Notch signalling maintains Hedgehog responsiveness via a Gli-dependent mechanism during spinal cord patterning in zebrafish
- Alberta Children’s Hospital Research Institute, University of Calgary, Canada
Figures
Figure 1 with 2 supplements

Characterization of the her12:Kaede reporter.
(A) Schematic drawing of the her12:Kaede BAC reporter. A BAC containing the her12 locus and surrounding regulatory elements was modified to replace the first exon of her12 with a cassette containing the coding sequence of Kaede and a Kanamycin resistance gene. her12 coding exons are highlighted in blue. (B) her12:Kaede expression, shown by immunohistochemistry using the Kaede antibody (red), recapitulated endogenous her12 expression, shown by fluorescent in situ hybridisation using the her12 probe (green). n = 8 embryos. (C) her12:Kaede expression was completely lost in mindbomb mutants at 36 hpf. n = 6 embryos per genotype. (D) Inhibition of Notch signalling by LY-411575 from 20 to 30 hpf completely abolished her12 expression compared to DMSO treated controls. n = 20 embryos per staining. (E) Activation of Notch signalling by hsp:Gal4; UAS:NICD at 13 hpf resulted in expanded and increased her12:Kaede expression at 27 hpf when compared to sibling controls. n = 4 embryos per genotype. Brackets in B-E denote the extent of the spinal cord. Scale bars: 20 μm.
Figure 1—figure supplement 1
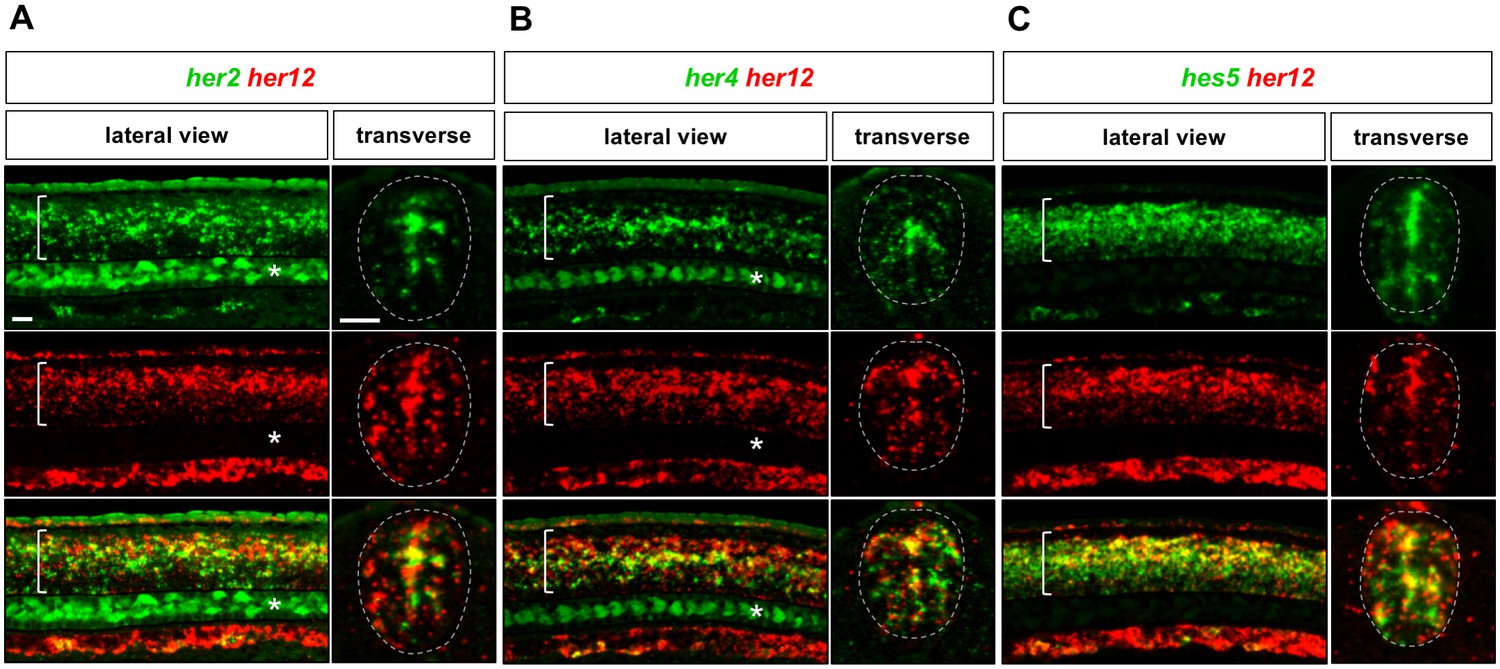
Co-expression of her12 and other Notch target genes in the spinal cord.
Whole-mount double fluorescent in situ hybridisation was performed in wild-type embryos at 24 hpf for her2 and her12 (A), her4 and her12 (B) and hes5 and her12 (C). Brackets in lateral views and dotted lines in transverse views denote the extent of the spinal cord. Note that her2 and her4 expression in notochord cells is indicated by asterisks. n = 6 embryos per staining. Scale bars: 20 μm.
Figure 1—figure supplement 2
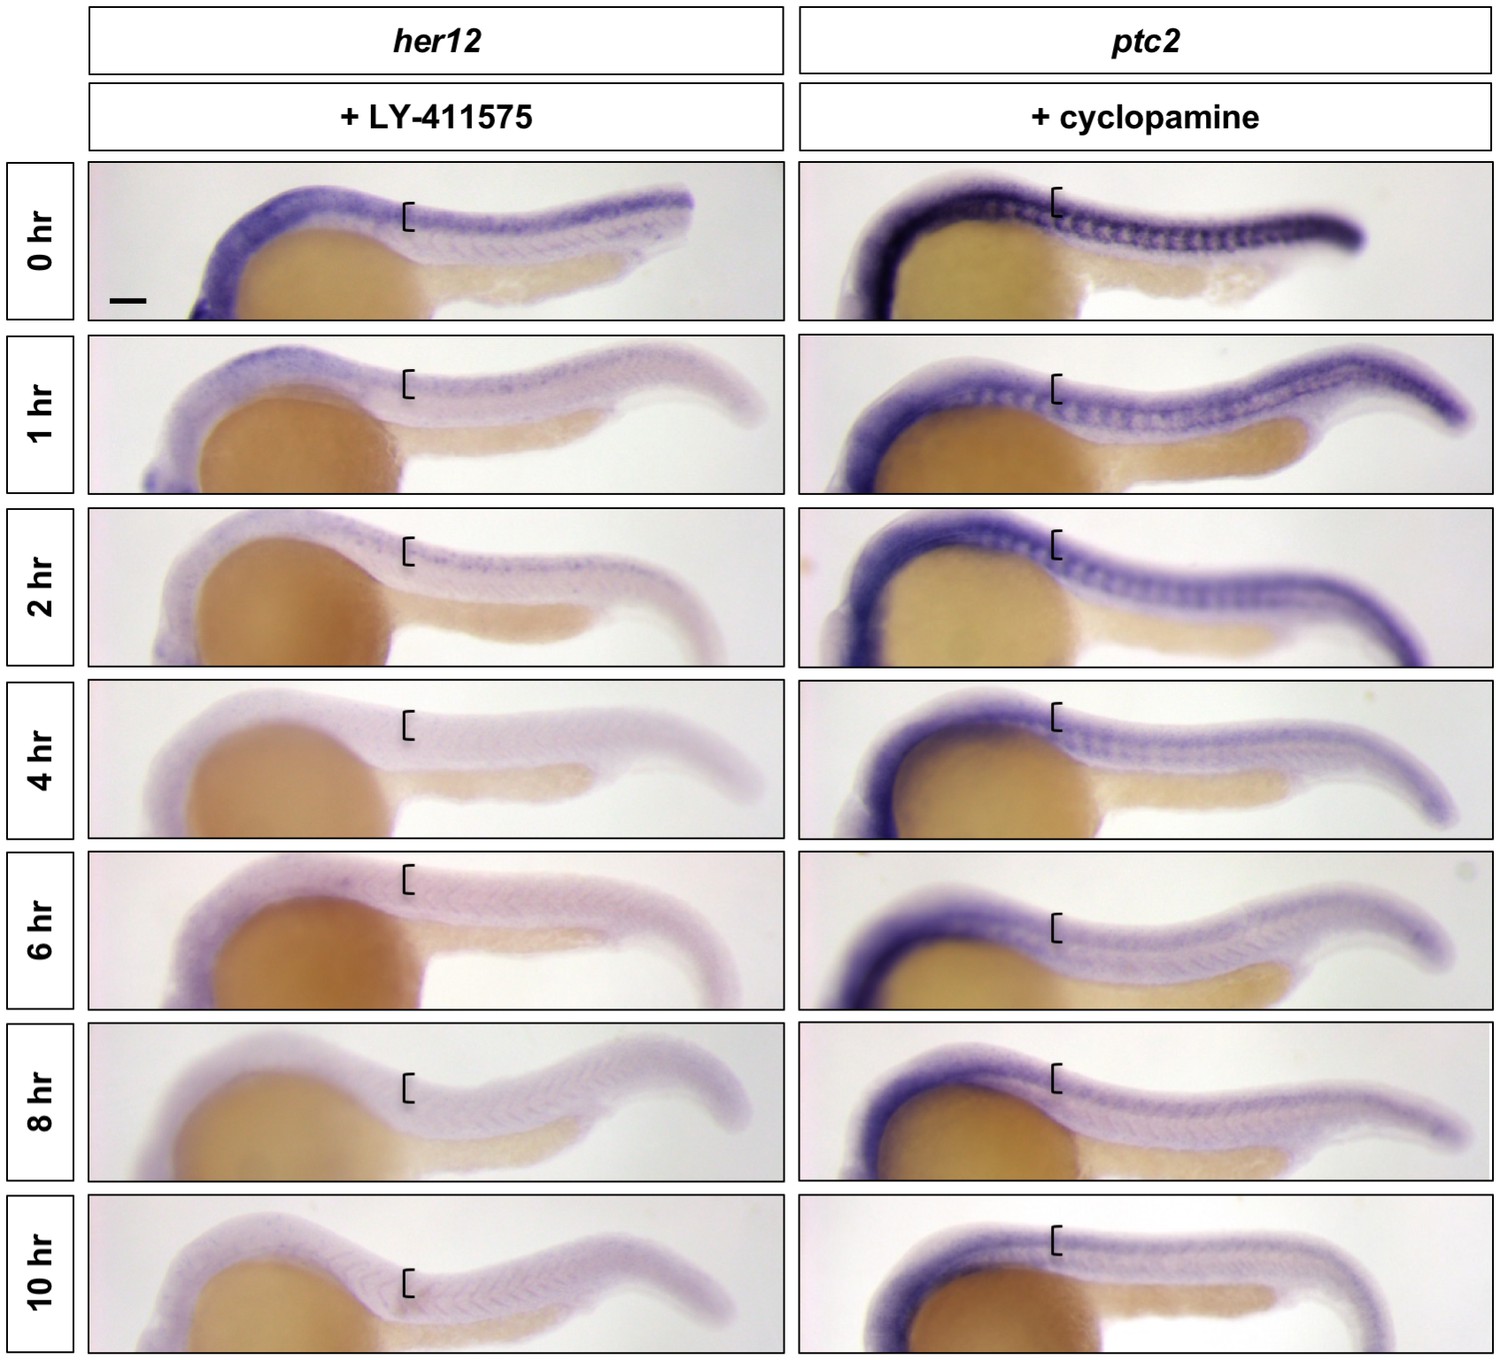
LY-411575 and cyclopamine are efficient inhibitors of Notch and Hh signalling, respectively.
Wild-type embryos were treated with LY-411575 or cyclopamine for 0, 1, 2, 4, 6, 8, or 10 hr, and fixed at 24 hpf. Whole mount in situ hybridisation was then performed for her12 in LY-411575 treated embryos and ptc2 in cyclopamine treated embryos. Brackets denote the extent of the spinal cord. n = 15 embryos per staining. Scale bar: 20 μm.
Figure 2 with 3 supplements
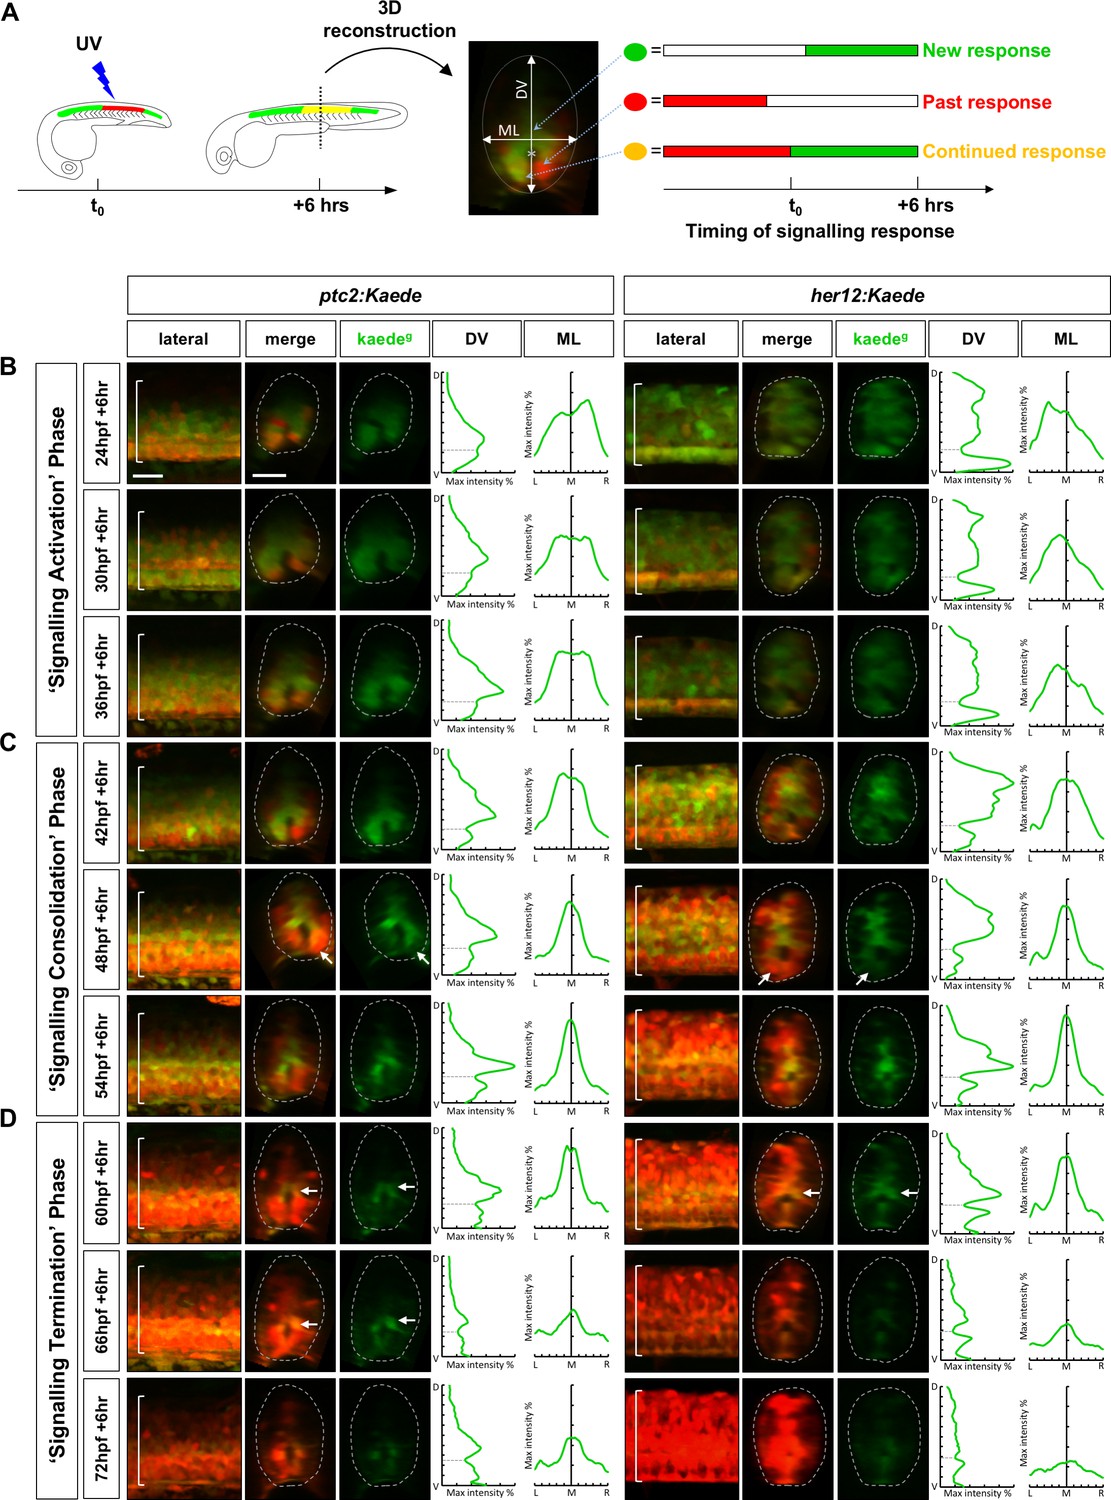
PHRESH analysis of the temporal dynamics of Notch and Hh signalling.
(A) Schematic representation of the experimental design. A section of the spinal cord above the yolk extension was photoconverted by the UV light at t0 and the fluorescent profile was analysed after 6 hours. 3D reconstruction of the spinal cord allowed the identification of cells that have either new signalling response after t0 (green), continued response from before and after t0 (yellow), or have ended signalling response before t0 (red). The graphical signalling profiles were generated from the dorsoventral axis (DV) and the mediolateral axis (ML) where indicated. (B–D) Time course of Hh and Notch signalling dynamics by PHRESH analysis. ptc2:Kaede and her12:Kaede embryos were photoconverted at specific time points (t0, indicated by hpf) and imaged at 6 hr post photoconversion. Lateral views of confocal projections and transverse views of single slices are shown. Kaedeg panels show de novo synthesised Kaedegreen after t0, while the merge panels show both previous Kaedered expression and new Kaedegreen expression. The graphs show the Kaedeg fluorescent intensity along the DV and ML axes for each representative embryo. The max intensity axes are 0–50% while the DV/ML axes display the full extent of the transverse section. The dotted lines in the graphs represent the position of the spinal canal. Three distinct phases of signalling response were observed: ‘signalling activation’ phase between 24 hpf and 42 hpf (B); ‘signalling consolidation’ phase between 42 hpf and 60 hpf (C); and ‘signalling termination’ phase between 60 hpf and 78 hpf (D). Arrows in C indicate ventral cells that have terminated response. Arrows in D highlight medial cells right above the spinal canal that remain responsive. Brackets in lateral views and dotted lines in transverse views denote the extent of the spinal cord. n = 4 embryos per condition. Scale bars: 20 μm.
Figure 2—figure supplement 1
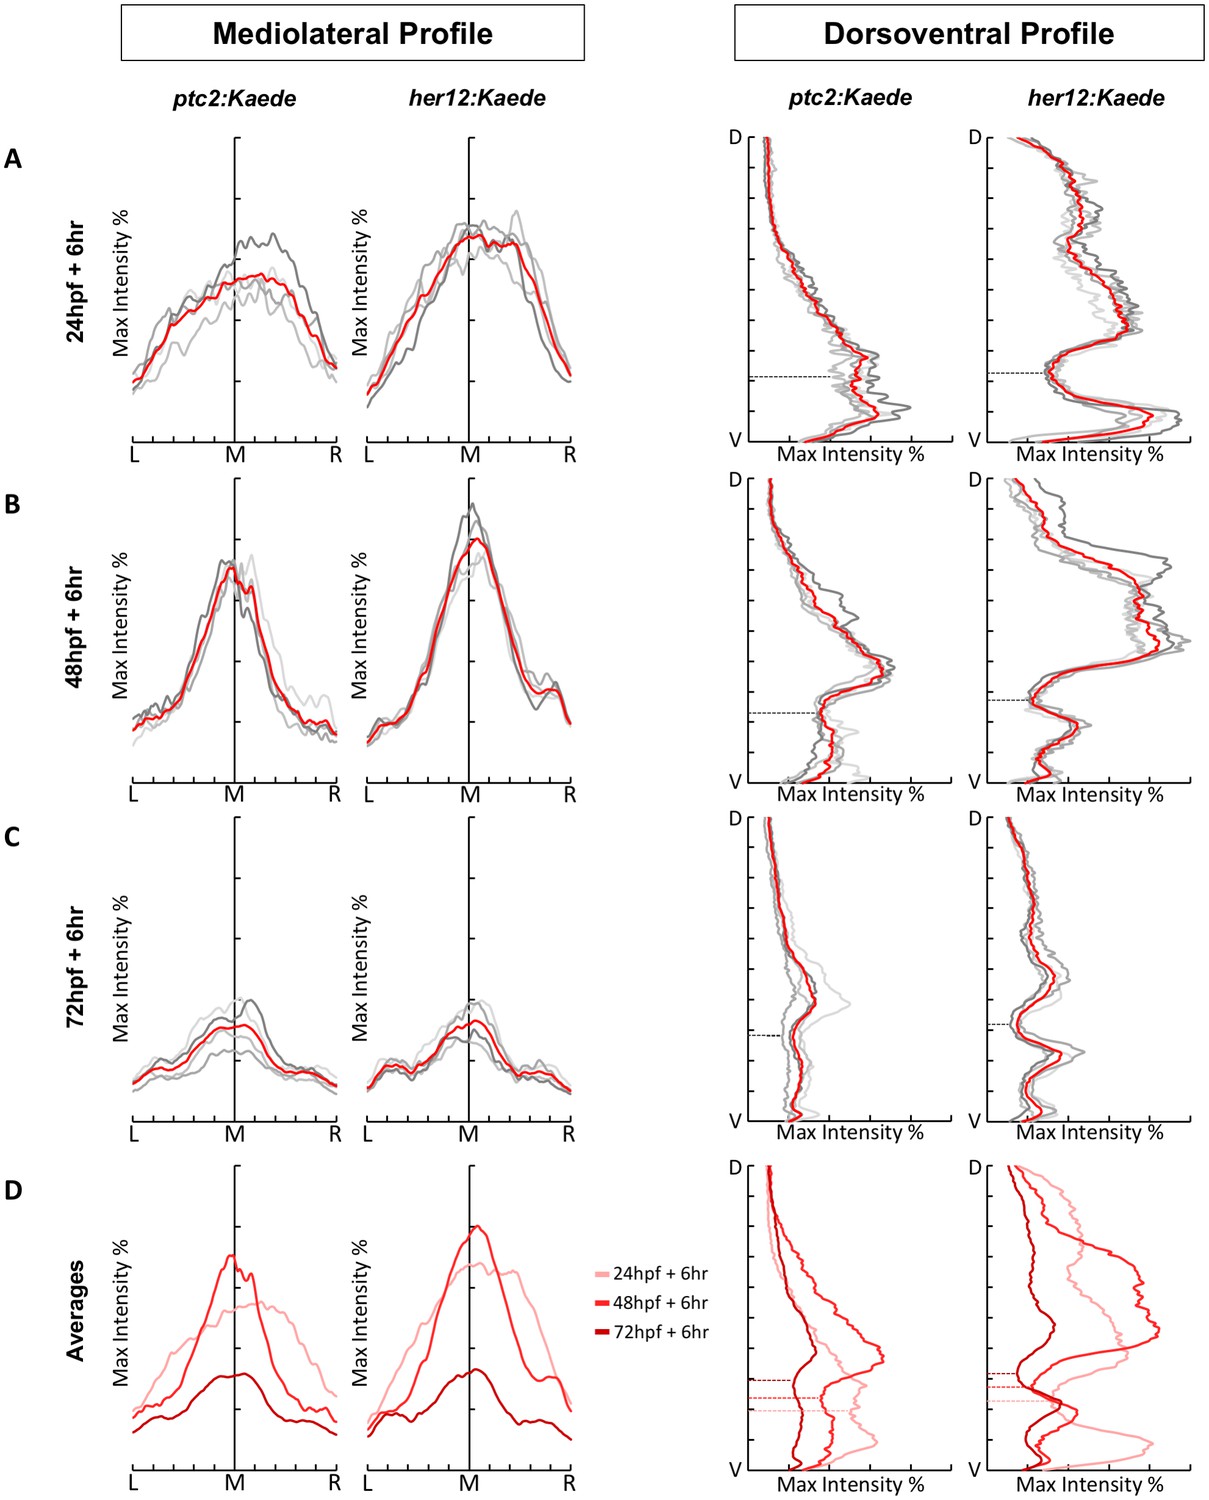
PHRESH signalling profiles show similar trends across multiple embryos.
ptc2:Kaede and her12:Kaede embryos were photoconverted at 24 hpf (A), 48 hpf (B) and 72 hpf (C) and imaged 6 hr post-conversion. Each line (grey) represents Kaedegreen fluorescent intensity along the mediolateral or dorsoventral axis (see Figure 2A) of one embryo. The red line denotes the average profile of all embryos (n = 4). The max intensity axes are 0–50%, while the DV/ML axes display the full extent of the transverse section. The position of the spinal canal in the dorsoventral profiles is denoted by a dotted line. (A) The signalling profiles during the ‘signalling activation’ phase. (B) The signalling profiles during the ‘signalling consolidation’ phase. (C) The signalling profiles during the ‘signalling termination’ phase. (D) The average profiles of all three phases plotted together. The relevant spinal canal position in the dorsoventral profile is marked by the matching coloured dotted line.
Figure 2—figure supplement 2
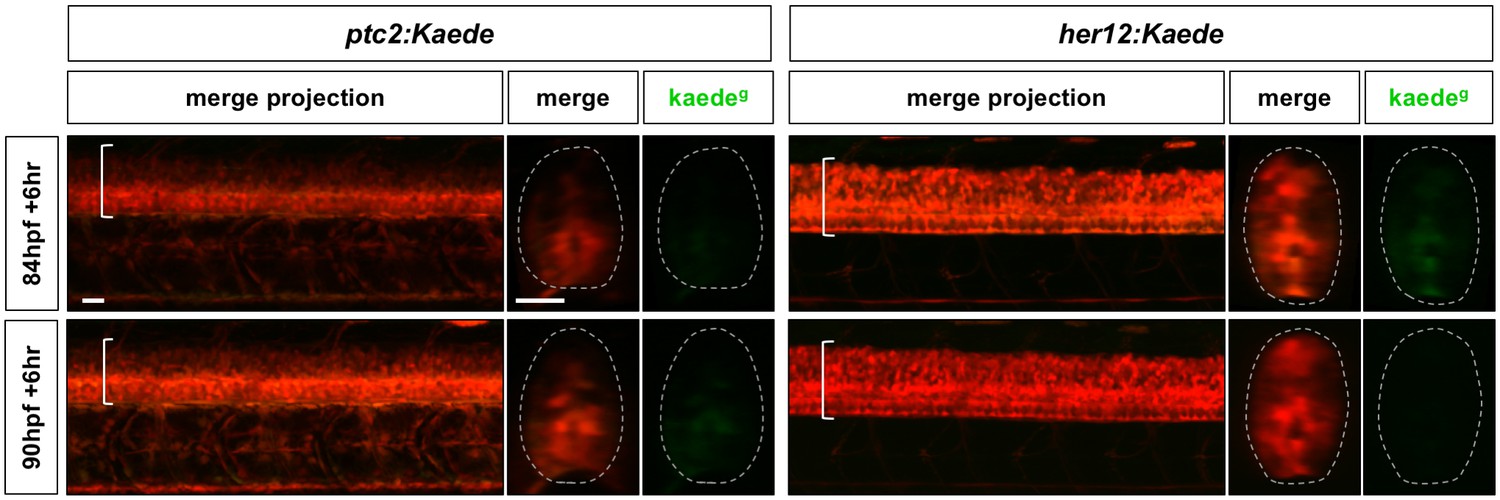
Notch and Hh response profiles after the ‘signalling termination’ phase.
Continuation of the time course described in Figure 2, where her12:Kaede and ptc2:Kaede embryos were photoconverted at 84 hpf or 90 hpf, and imaged 6 hr post-conversion. Lateral views of confocal projections and transverse views of single slices are shown. Kaedeg panels show de novo synthesised Kaedegreen after the time of photoconversion, while the merge panels show both previous Kaedered expression and new Kaedegreen expression. Brackets in lateral views and dotted lines in transverse views denote the extent of the spinal cord. n = 4 embryos per timepoint. Scale bars: 20 μm.
Figure 2—figure supplement 3
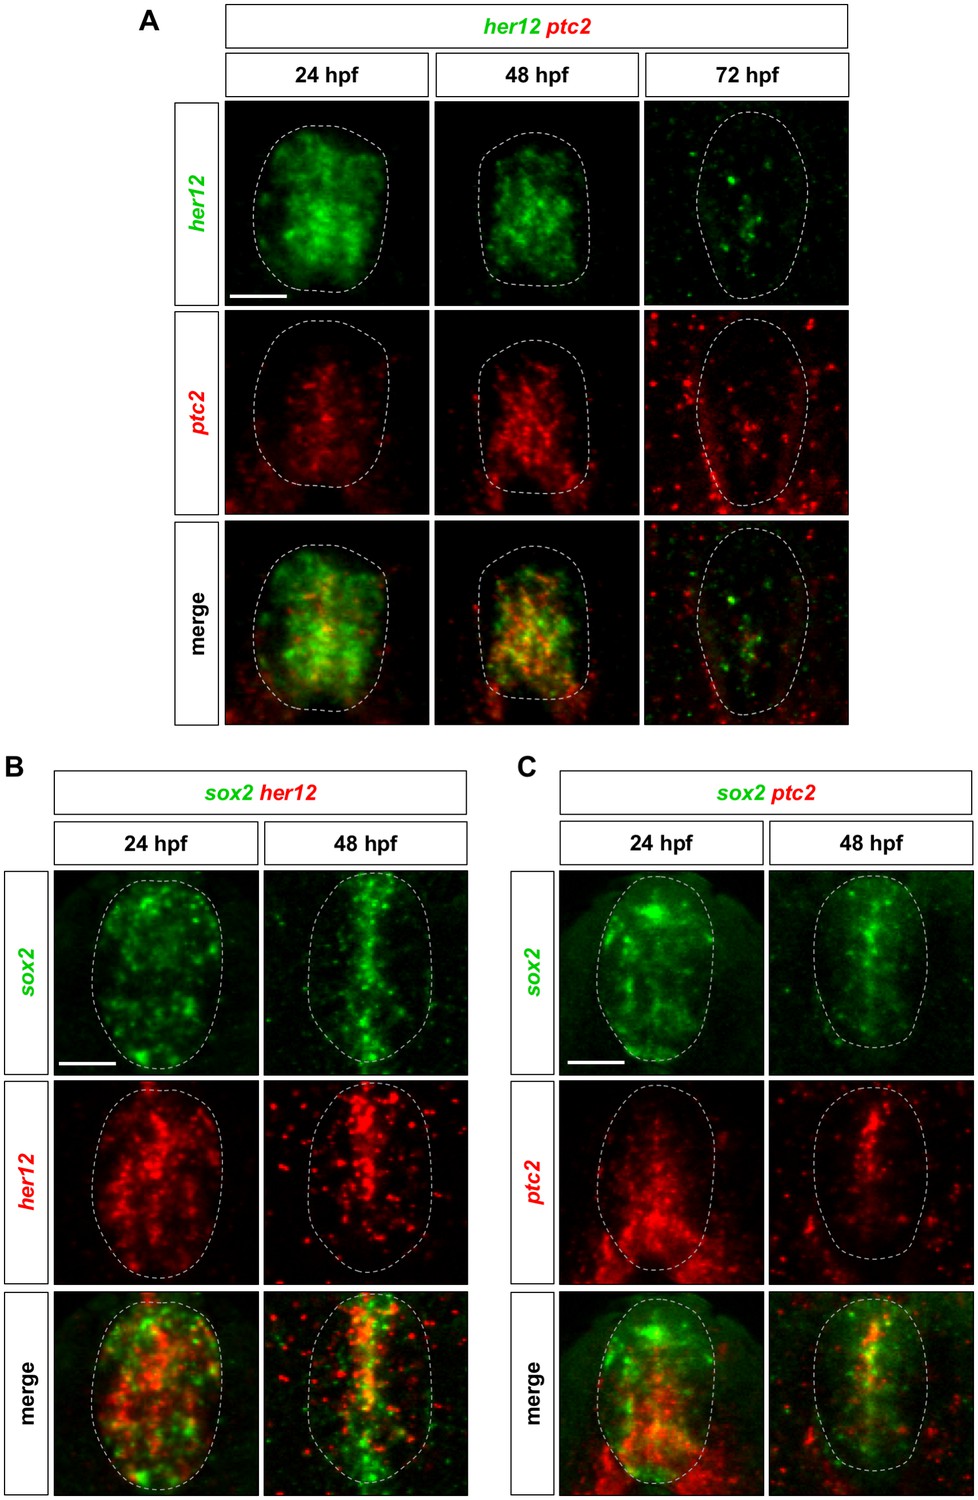
her12 and ptc2 are expressed in the same domain corresponding to sox2+ neural progenitors.
Whole-mount double fluorescent in situ hybridisation was performed in wild-type embryos for her12 and ptc2 (A), sox2 and her12 (B), and sox2 and ptc2 (C) at either 24, 48, or 72 hpf. Dotted lines denote the extent of the spinal cord. n = 6 embryos per staining. Scale bars: 20 μm.
Figure 3 with 1 supplement

Inhibition of Notch signalling abolishes Hh response in the spinal cord.
(A) ptc2:Kaede and her12:Kaede embryos were incubated with DMSO, cyclopamine (Cyc) or LY-411575 from 20 to 30 hpf, photoconverted at 24 hpf and imaged at 30 hpf. Lateral views of confocal projections and transverse views of single slices are shown. Kaedeg panels show de novo synthesised Kaedegreen, while the merge panels show both previous Kaedered expression and new Kaedegreen expression. Arrowheads highlight Kaedegreen cells with active Hh response surrounding the notochord. (B) Wild-type embryos were treated with DMSO, cyclopamine, or LY-411575 from 20 to 30 hpf, and stained with ptc2 or her12. Arrows indicate ptc2 expression in somites. Brackets in lateral views and dotted lines in transverse views in A and B denote the extent of the spinal cord. The n number for each staining is shown. Scale bars: 20 μm.
Figure 3—figure supplement 1
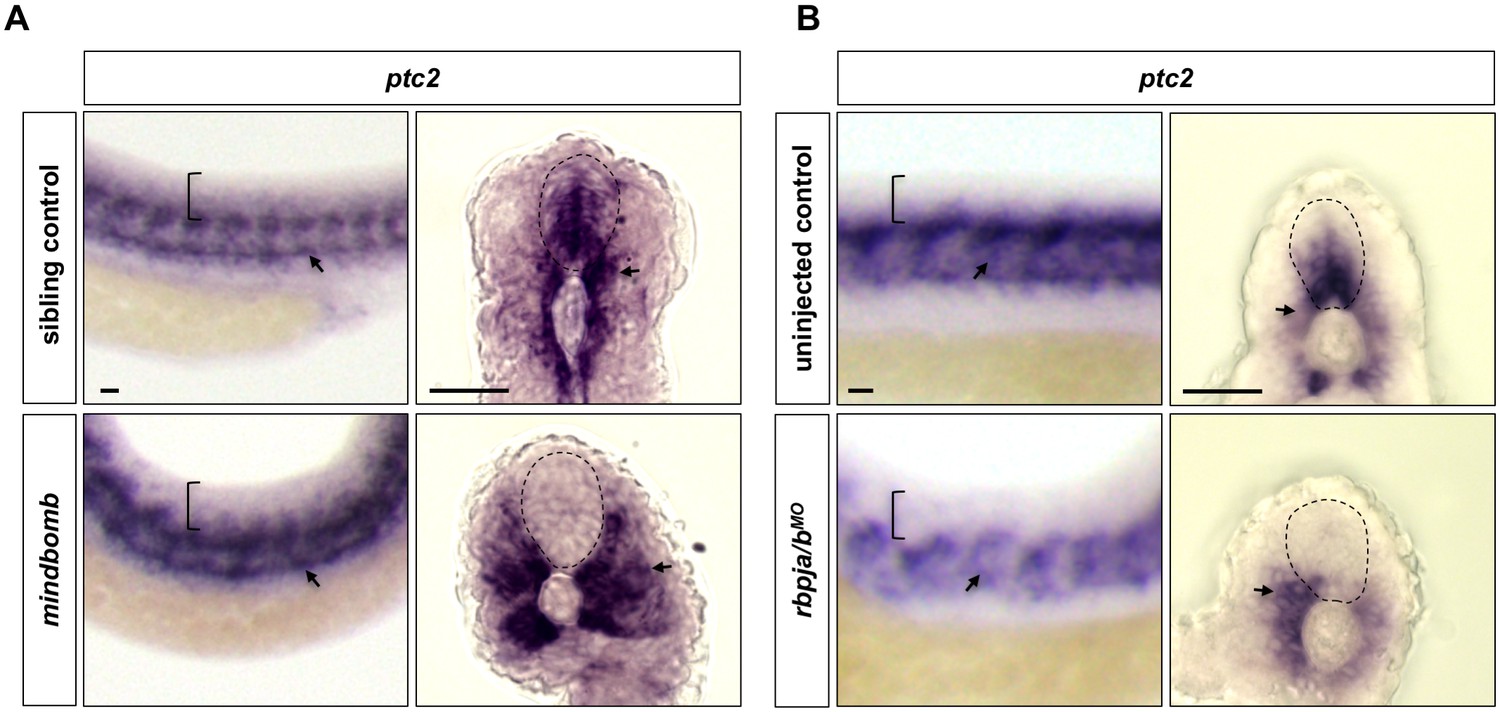
Inhibition of Notch signalling results in loss of Hh response in the spinal cord.
(A) Whole-mount in situ hybridisation was performed in mindbomb mutants or their sibling controls for ptc2 expression at 30 hpf. n = 15 embryos per staining. (B) Embryos were injected with the morpholino targeting both rbpja and rbpjb (rbpja/bMO) at the one-cell stage, and whole mount in situ hybridisation was performed in rbpja/bMO-injected and uninjected control embryos for ptc2 expression at 24 hpf. n = 35 embryos per staining. Brackets in the lateral views and dotted lines in the transverse views denote the extent of the spinal cord. Arrows indicate ptc2 expression in somites. Scale bars: 20 μm.
Figure 4
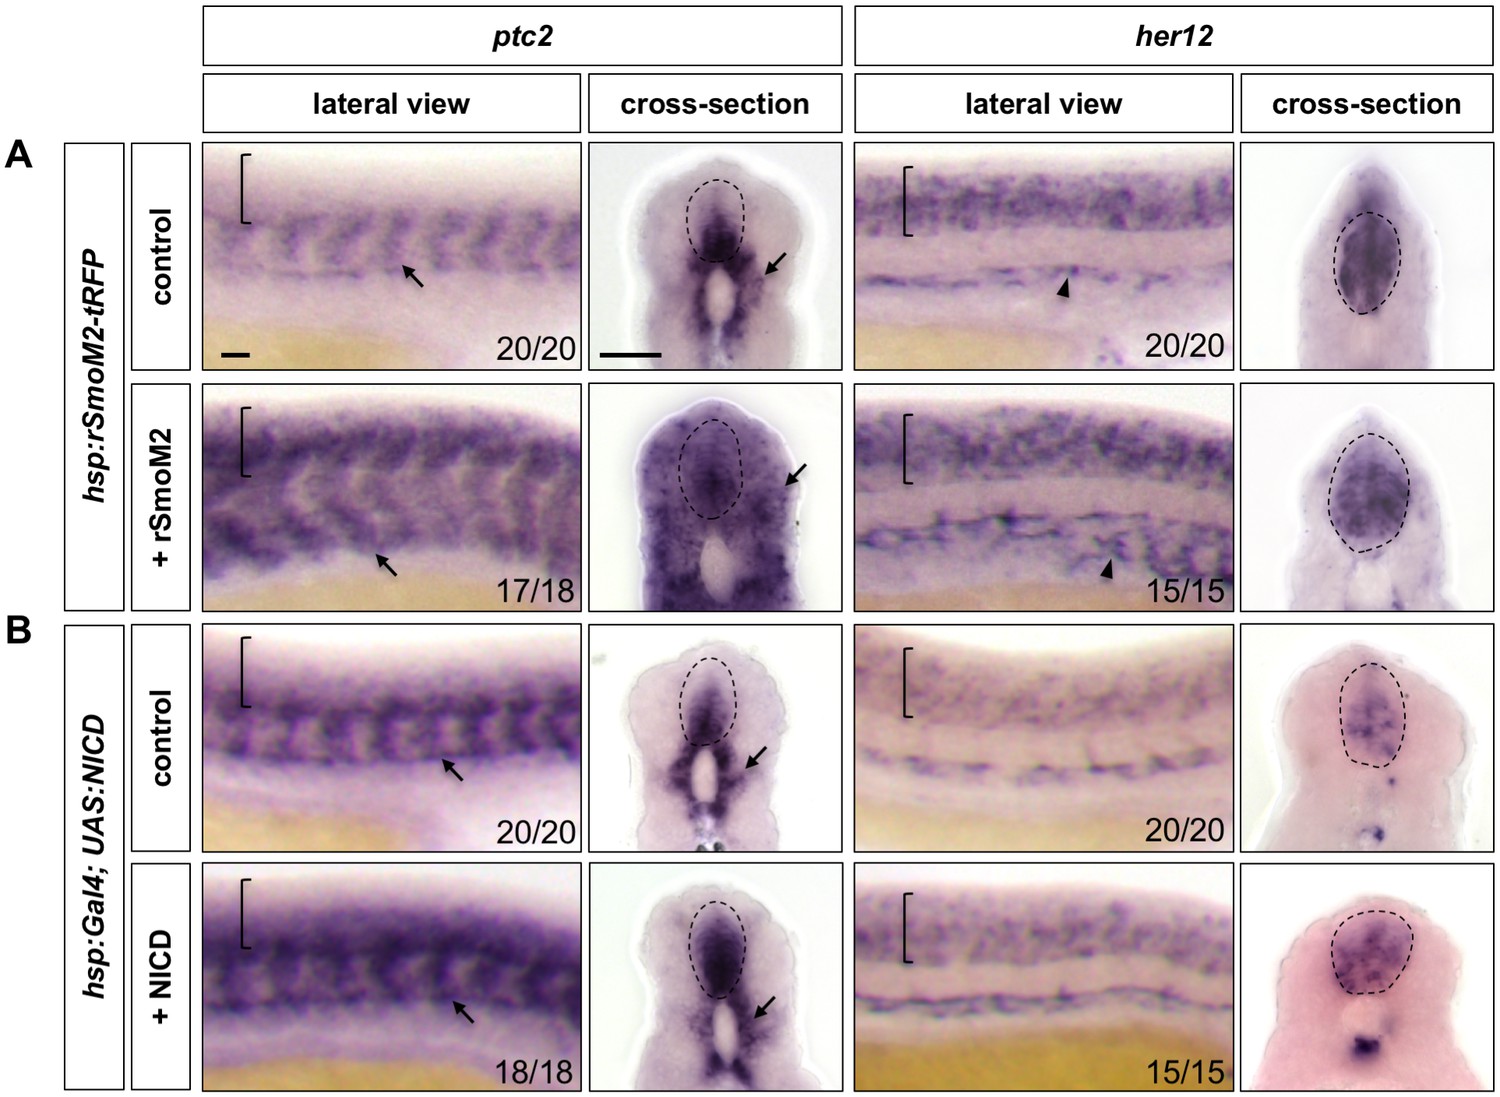
Ectopic Notch activation results in increased and expanded Hh response.
hsp:rSmoM2-tRFP embryos and wild-type controls (A), or hsp:Gal4; UAS:NICD embryos and wild-type controls (B) were heat shocked at 11 hpf and stained for the expression of ptc2 and her12 at 24 hpf. Brackets in lateral views and dotted lines in transverse views denote the extent of the spinal cord. Arrows indicate ptc2 expression in somites. Note that expression of hsp:rSmoM2-tRFP resulted in an expansion of her12 expression in the vasculature compared to control embryos (arrowheads in A). The n number for each staining is shown. Scale bars: 20 μm.
Figure 5
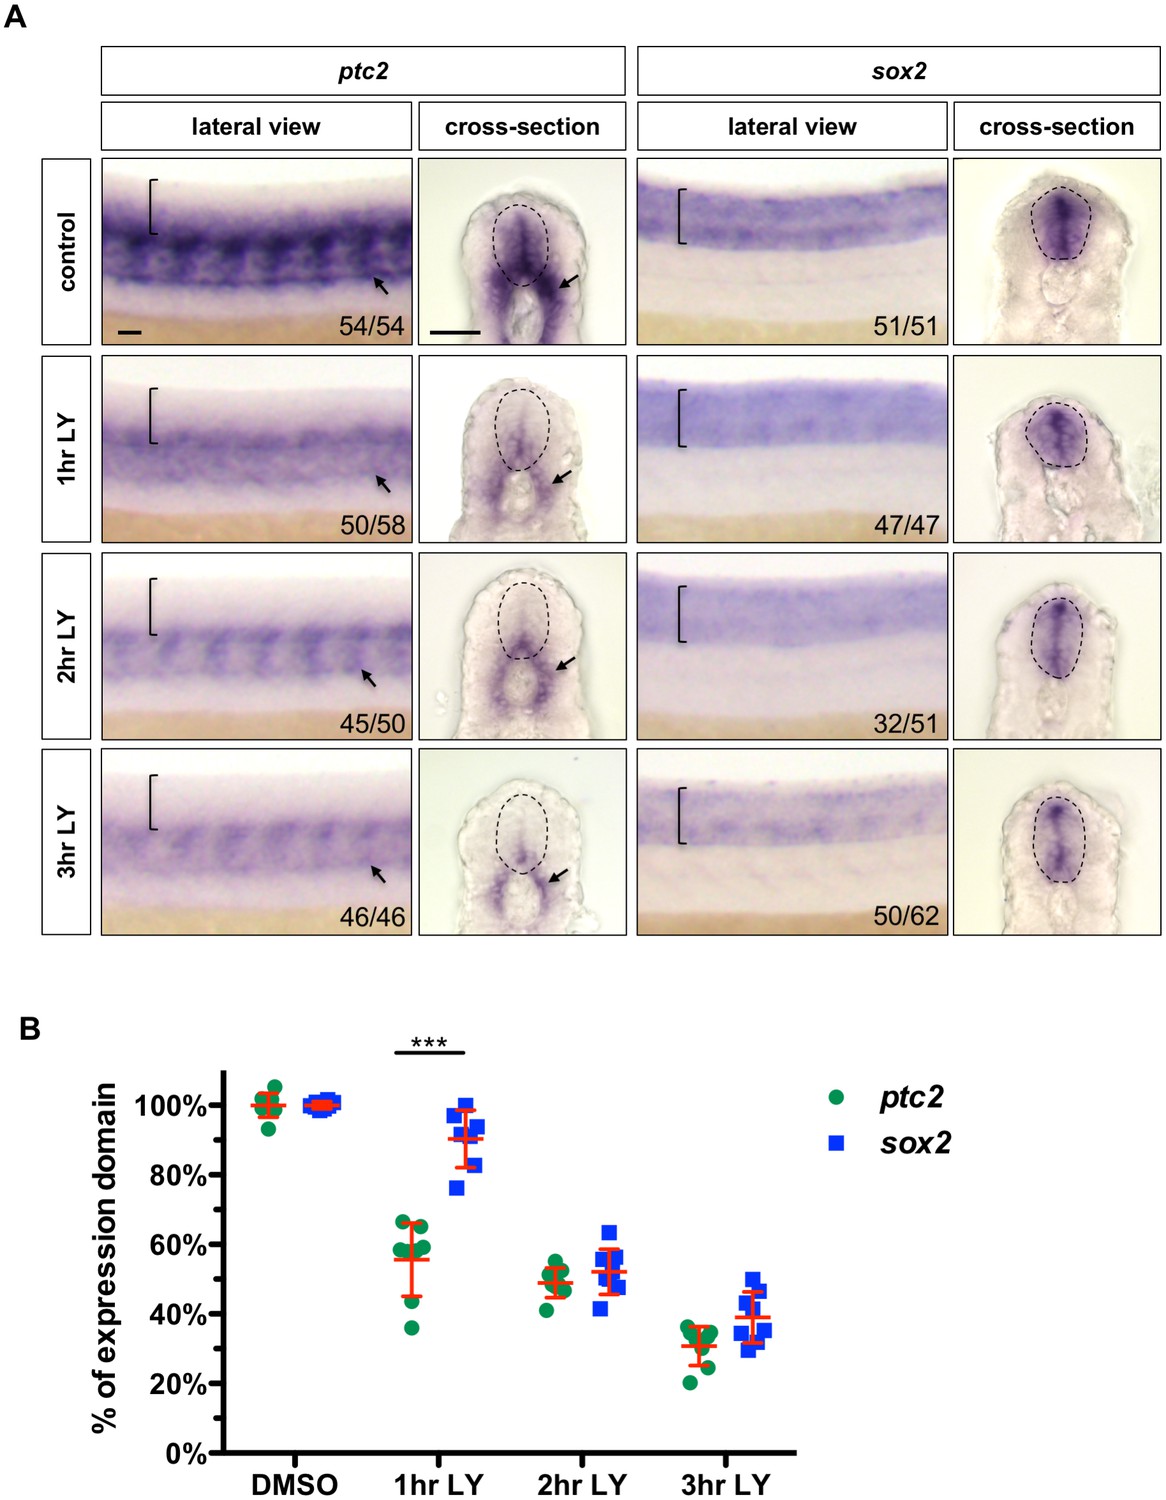
Inhibition of Notch signalling results in loss of Hh response followed by loss of neural progenitor identity.
(A) Wild-type embryos were incubated in LY-411575 from 20 hpf for 1, 2 or 3 hr and DMSO for the entire duration. Embryos were stained for the expression of ptc2 or sox2. Brackets in lateral views and dotted lines in transverse views denote the extent of the spinal cord. Arrows indicate ptc2 expression in the somites. The n number for each staining is shown. Scale bars: 20 μm. (B) Transverse sections of embryos were taken from the experiment in A and the extent of the expression domain of ptc2 and sox2 was measured and quantified as a percentage of the spinal cord. To directly compare changes in ptc2 and sox2 expression domains, the mean of the DMSO treated group was used as the ‘control maximum’ and all values were normalized as a percentage of their relevant control maximum. Each data point represents the average expression domain percentage of one embryo. n = 8 embryos per condition. Data are plotted with mean ± SD. Statistics: Mann-Whitney U test. Asterisks representation: p-value<0.001 (***).
Figure 6
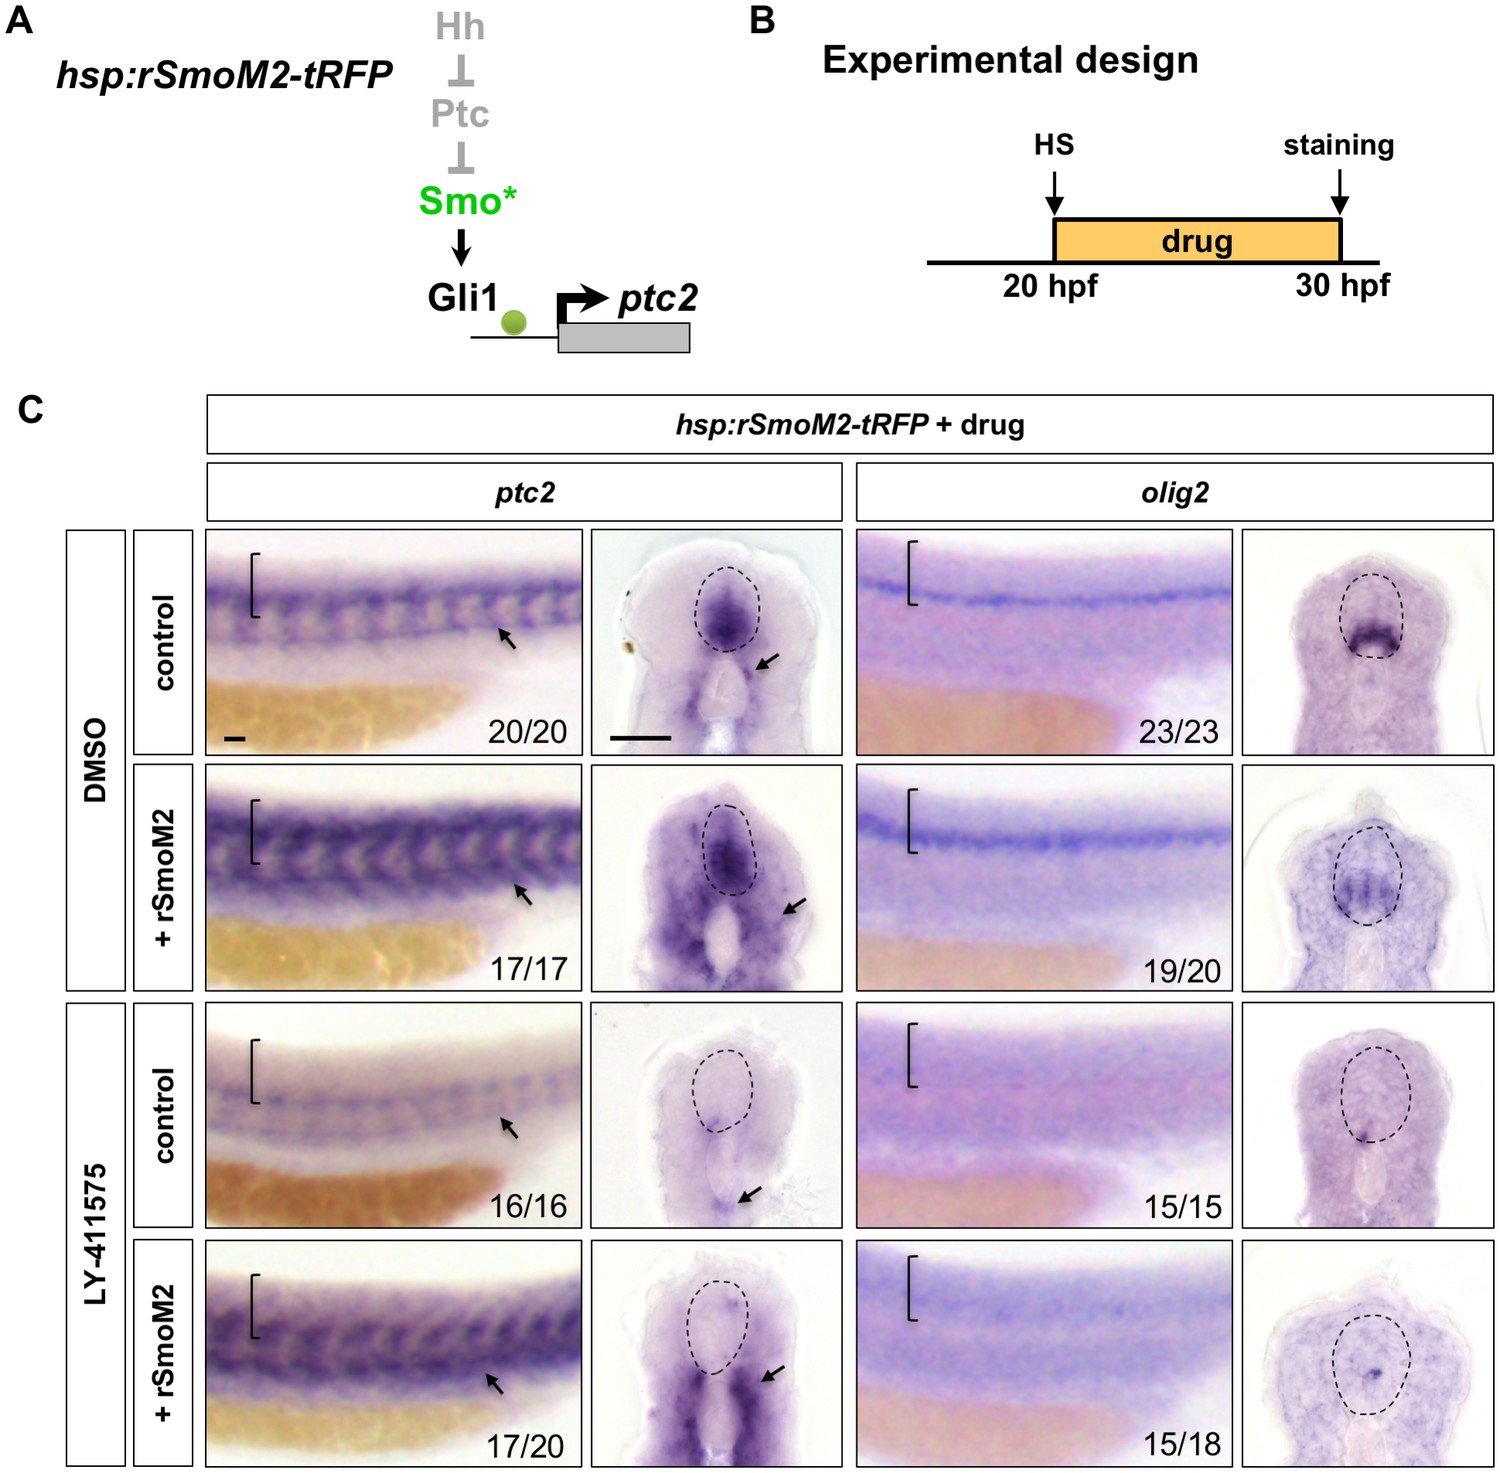
Activation of Hh signalling by rSmoM2 cannot rescue Notchoff spinal cords.
(A) Schematic representation of the manipulation to the Hh pathway caused by ectopic expression of rSmoM2-tRFP. The point of manipulation is highlighted in green with an asterisk. (B) Experimental design in C. (C) hsp:rSmoM2-tRFP or wild-type control embryos were heat shocked at 20 hpf, and then incubated in either DMSO or LY-411575 until fixation at 30 hpf. Whole mount in situ hybridisation was performed for ptc2 and olig2. Brackets in lateral views and dotted lines in transverse views denote the extent of the spinal cord. Arrows indicate ptc2 expression in somites. The n number for each staining is shown. Scale bars: 20 μm.
Figure 7
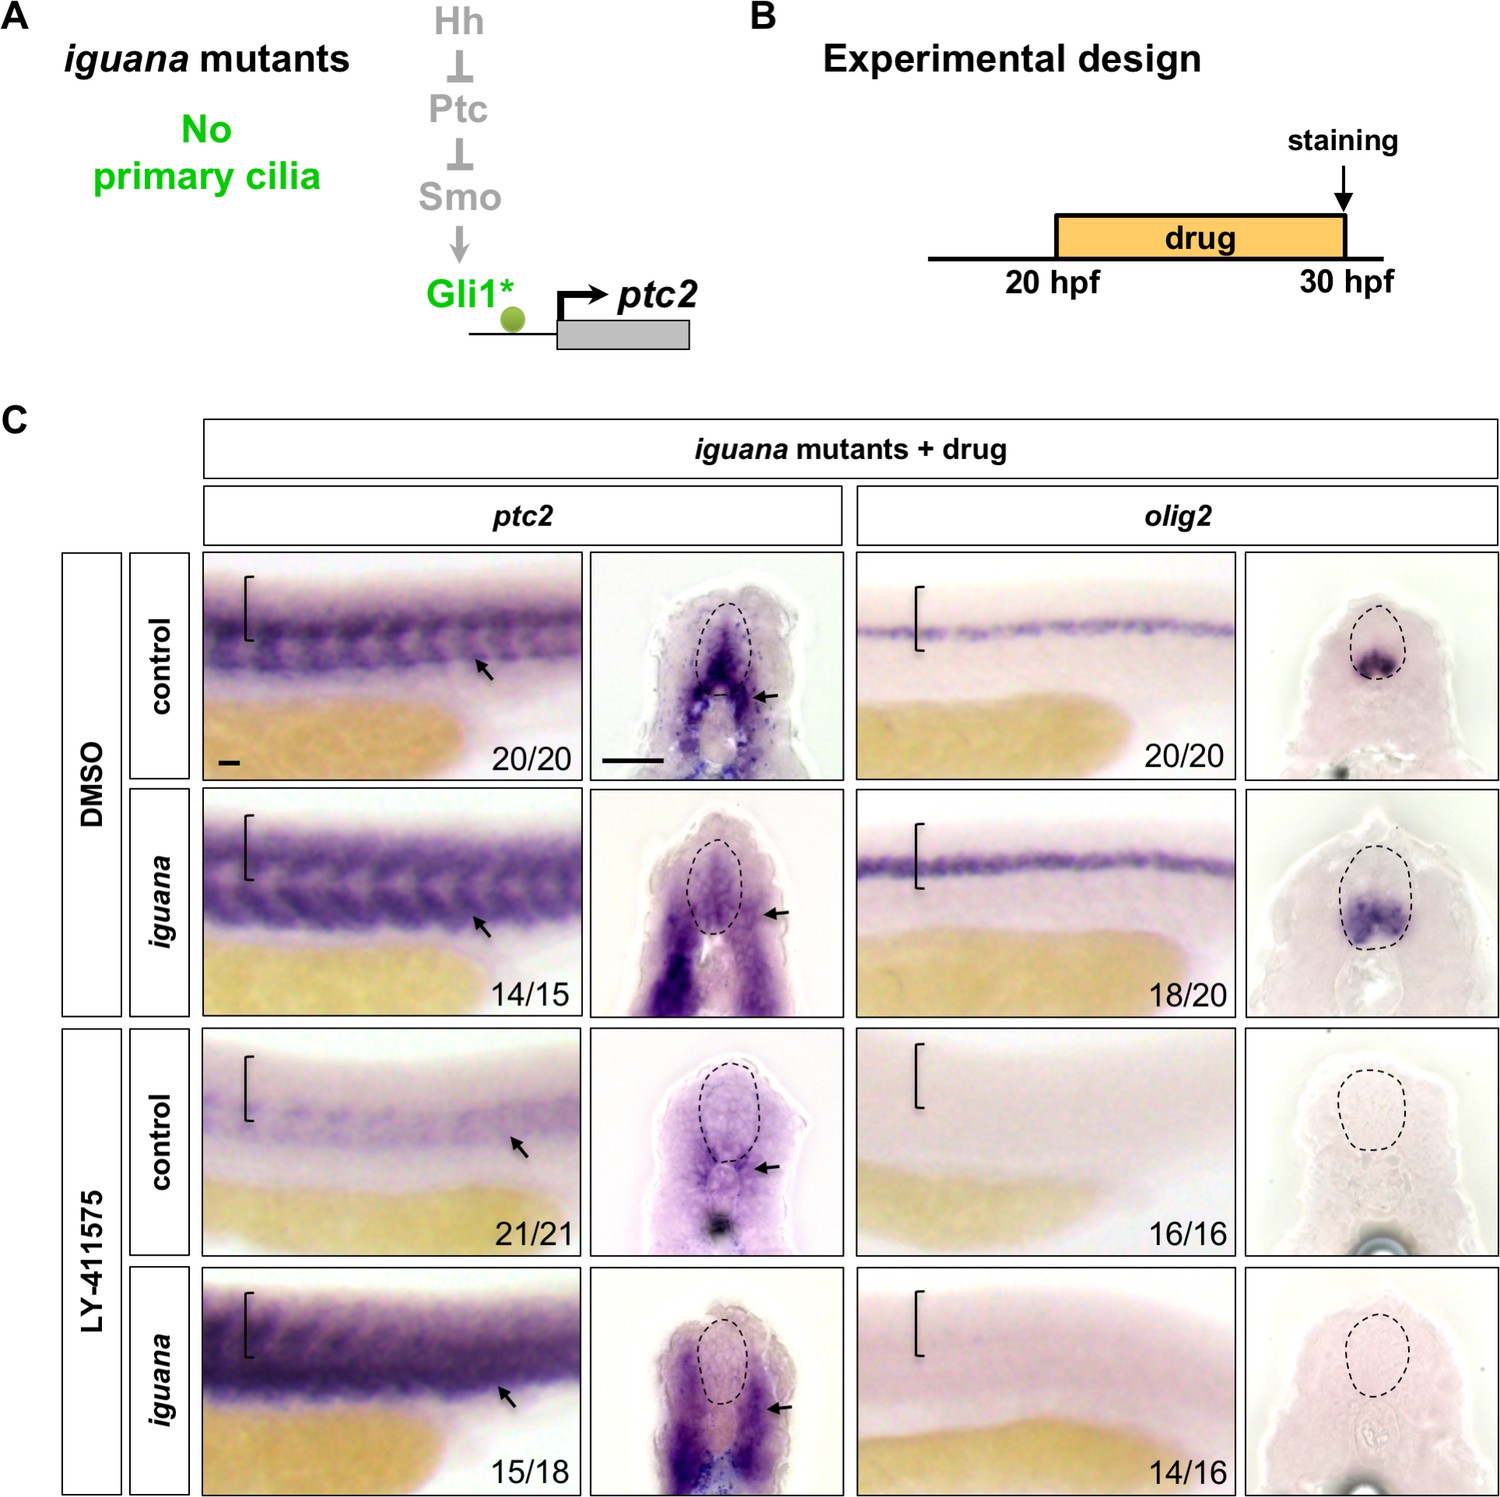
Notch signalling regulates Hh response independent of primary cilia.
(A) Schematic representation of the manipulation to the Hh pathway caused by the loss of primary cilia in iguana mutants. The point of manipulation is highlighted in green with an asterisk. (B) Experimental design in C. (C) iguana mutant and sibling control embryos were incubated in either DMSO or LY-411575 at 20 hpf until fixation at 30 hpf. Whole mount in situ hybridisation was performed for ptc2 and olig2. Brackets in lateral views and dotted lines in transverse views denote the extent of the spinal cord. Arrows indicate ptc2 expression in somites. The n number for each staining is shown. Scale bars: 20 μm.
Figure 8 with 1 supplement
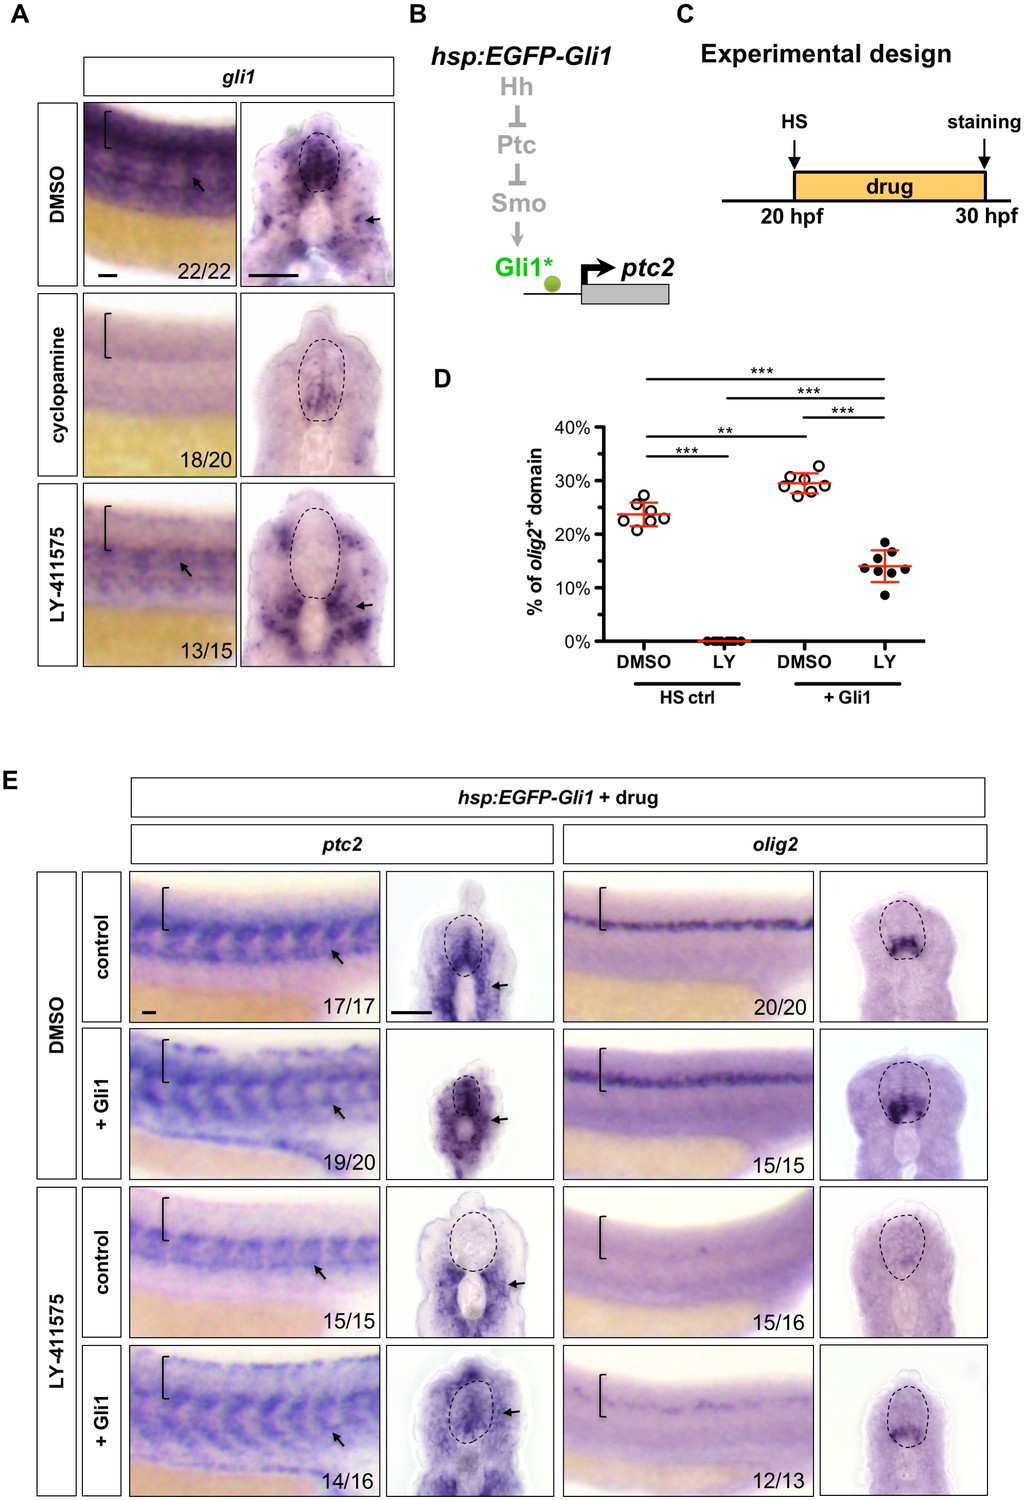
Notch signalling regulates Hh response at the Gli level.
(A) Whole-mount in situ hybridisation for gli1 was performed on wild-type embryos treated with DMSO, cyclopamine, or LY-411575 from 20 to 30 hpf. (B) Schematic representation of the manipulation of the Hh pathway caused by ectopic EGFP-Gli1 expression. The point of manipulation is highlighted in green with an asterisk. (C) Experimental design in D-E. (D–E) hsp:EGFP-Gli1 and wild type control embryos were heat shocked at 20 hpf, and then incubated in either DMSO or LY-411575 until fixation at 30 hpf. Whole mount in situ hybridisation was performed for ptc2 and olig2. The extent of the olig2+ expression domain was measured and plotted as a percentage of the spinal cord in D. Each data point represents the average expression domain of one embryo. n = 7–8 embryos per condition. Data are plotted with mean ± SD. Statistics: Mann-Whitney U test. Asterisks representation: p-value<0.01 (**) and p-value<0.001 (***). Brackets in lateral views and dotted lines in transverse views in A and E denote the extent of the spinal cord. Arrows in A and E indicate ptc2 expression in somites. The n number for each staining is shown in A and E. Scale bars: 20 μm.
Figure 8—figure supplement 1
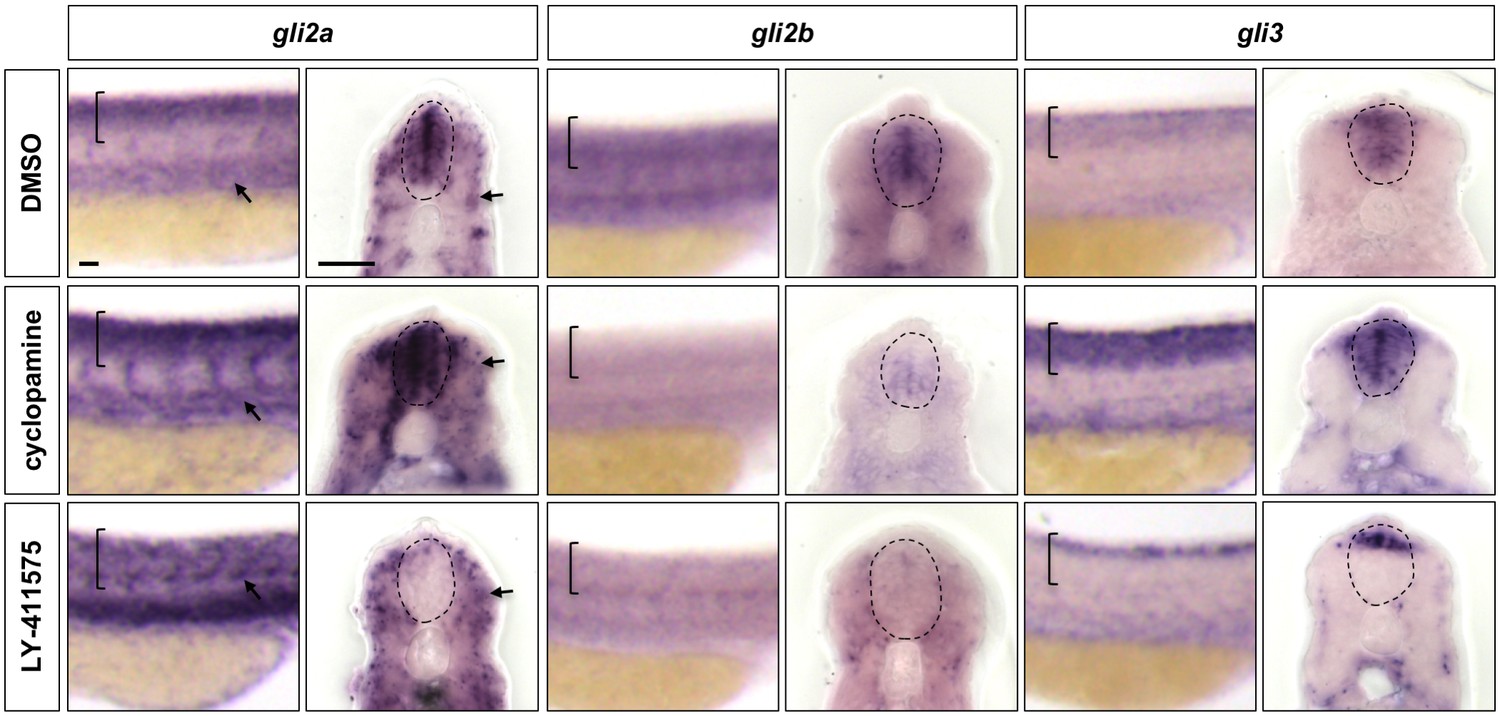
Notch signalling regulates the expression of all Gli family members in the spinal cord.
Wild-type embryos were treated with DMSO, cyclopamine, or LY-411575 from 20 to 30 hpf, and stained with gli2a, gli2b or gli3 probes. Brackets in lateral views and dotted lines in transverse views denote the extent of the spinal cord. Arrows indicate gli2a expression in somites. Note that in LY-411575 treated embryos, gli3 expression is absent in most of the ventral spinal cord but is maintained in the very dorsal region. n = 15 embryos per staining. Scale bars: 20 μm.
Author response image 1
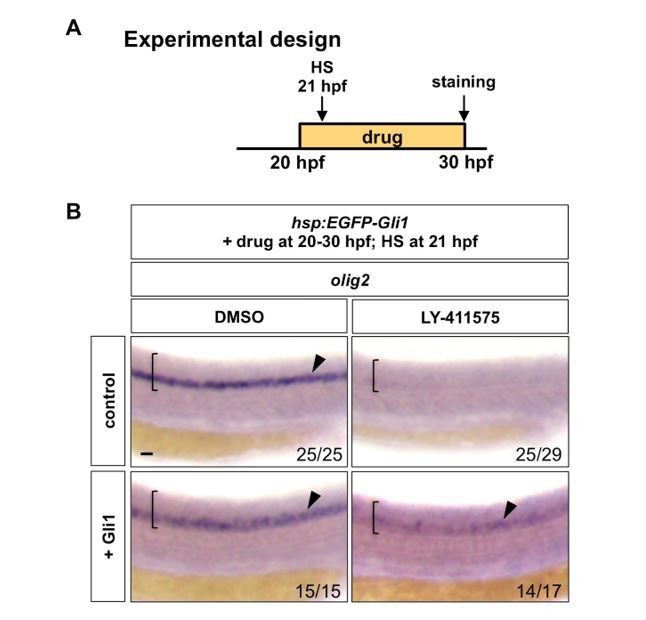
Notch signalling regulates Hh response at the Gli level.
(A) Experimental design. Embryos were heat shocked (HS) for 30 minutes in the solution containing the drug at 1 hour after the drug treatment. (B) hsp:EGFP-Gli1 and wild type control embryos were incubated in either DMSO or LY-411575 from 20 hpf to 30 hpf, during which embryos were heat shocked at 21 hpf. Whole mount in situ hybridisation was performed for olig2 at 30 hpf. Brackets denote the extent of the spinal cord and lateral views are shown. Arrowheads indicate olig2 expression in the spinal cord. The n number for each staining is shown. Scale bar: 20 μm.
Videos
Video 1
The re-emergence of ptc2:Kaede expression after photoconversion.
A ptc2:Kaede embryo was photoconverted at 28 hpf and then underwent time-lapse imaging for 18 hr. The vertical line indicates the boundary between photoconverted and unconverted regions at the start of the movie. Bracket indicates the extent of the spinal cord. n = 2 embryos. Scale bar: 20 μm.
Video 2
The ptc2:Kaede response profile along the anterior-posterior axis.
ptc2:Kaede embryos were photoconverted at 48 hpf and imaged 6 hr after. Individual transverse sections generated by 3D reconstruction were prepared into a video. The first frame is the most anterior slice and each subsequent frame moves further posterior through the embryo. The merge (left) and Kaedegreen (right) channels are shown. The spinal cord is denoted by solid lines and the active signalling domain (Kaedegreen) above the spinal canal is indicated by an arrowhead. Note that Figure 2C shows one single slice in the middle of the converted region. n = 4 embryos. Scale bar: 20 μm.
Video 3
The her12:Kaede response profile along the anterior-posterior axis.
her12:Kaede embryos were photoconverted at 48 hpf and imaged 6 hr after. Individual transverse sections generated by 3D reconstruction were prepared into a video. The first frame is the most anterior slice and each subsequent frame moves further posterior through the embryo. The merge (left) and Kaedegreen (right) channels are shown. The spinal cord is denoted by solid lines and the active signalling domain (Kaedegreen) above the spinal canal is indicated by an arrowhead. Note that Figure 2C shows one single slice in the middle of the converted region. n = 4 embryos. Scale bar: 20 μm.
Tables
Key resources table
| Resource type | Designation | Source/Reference | Identifier |
|---|---|---|---|
| Zebrafish strain (Danio rerio) | hsp:Gal4 | Scheer and Campos-Ortega, 1999, PMID: 10072782 | RRID:ZFIN_ZDB-ALT-020918-6 |
| Zebrafish strain (Danio rerio) | UAS:NICD | Scheer and Campos-Ortega, 1999, PMID: 10072782 | RRID:ZFIN_ZDB-ALT-020918-8 |
| Zebrafish strain (Danio rerio) | hsp:rSmoM2-tRFP | This paper. | NA |
| Zebrafish strain (Danio rerio) | hsp:EGFP-Gli1 | Huang and Schier, 2009 PMID: 19700616 | RRID:ZFIN_ZDB-ALT-110207-11 |
| Zebrafish strain (Danio rerio) | iguts294 (iguana) | Sekimizu et al., 2004; Wolff et al., 2004 PMIDs: 15115751; 15198976 | RRID:ZFIN_ZDB-ALT-980203-1553 |
| Zebrafish strain (Danio rerio) | mib1ta52b (mindbomb) | Itoh et al., 2003 PMID: 12530964 | RRID:ZFIN_ZDB-ALT-980203-1374 |
| Zebrafish strain (Danio rerio) | her12:Kaede | This paper: Generated using BAC clone zK5I17 (DanioKey) | NA |
| Zebrafish strain (Danio rerio) | ptc2:Kaede | Huang et al., 2012 PMID: 22685423 | RRID:ZFIN_ZDB-ALT-120810-2 |
| Morpholino oligonucleotide | rbpja/bMO (Previously Su(H)1+2 MO) | Gene Tools, LLC | ZFIN ID: ZDB- MRPHLNO-070410–11 |
| Antibody | Rabbit polyclonal anti-Kaede | MBL International | Cat# PM012, RRID:AB_592060 |
| Antibody | Goat anti-rabbit IgG, Alexa Fluor 555 | Thermo Fisher Scientific | Cat# A-21428, RRID:AB_2535849 |
| DNA dye | Draq5 | Biostatus | Cat# DR50050, RRID:AB_2314341 |
| Small molecule inhibitor | Cyclopamine | Toronto Chemical | Cat# C988400 |
| Small molecule inhibitor | LY-411575 | Millipore Sigma | Cat# 209984-57-6 |
| Software package | Fiji-ImageJ | Schindelin et al., 2012 PMID: 22743772 https://fiji.sc | RRID:SCR_002285 |
| Software package | Graphpad Prism | https://www.graphpad.com/scientific-software/prism/ | RRID:SCR_002798 |
Additional files
-
Transparent reporting form
- https://doi.org/10.7554/eLife.49252.020
Download links
A two-part list of links to download the article, or parts of the article, in various formats.
Downloads (link to download the article as PDF)
Open citations (links to open the citations from this article in various online reference manager services)
Cite this article (links to download the citations from this article in formats compatible with various reference manager tools)
Notch signalling maintains Hedgehog responsiveness via a Gli-dependent mechanism during spinal cord patterning in zebrafish
eLife 8:e49252.
https://doi.org/10.7554/eLife.49252


