Extensive impact of low-frequency variants on the phenotypic landscape at population-scale
- Université de Strasbourg, CNRS, GMGM UMR 7156, France
Figures
Figure 1 with 3 supplements
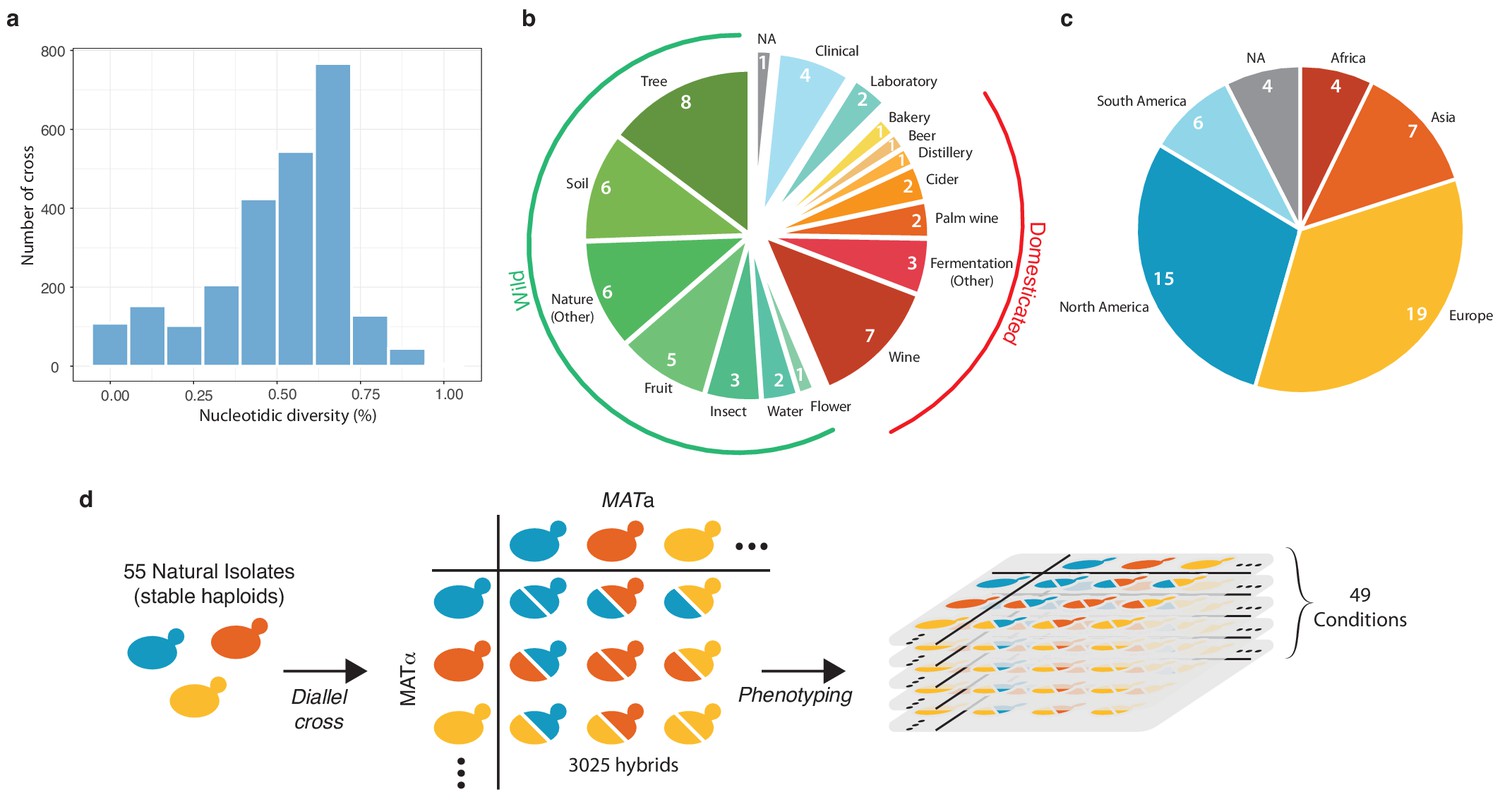
Diversity of the 55 selected natural isolates and diallel design.
(a) Pairwise sequence diversity between each pair of parental strains. (b) Ecological origins of the selected strains. See also Supplementary file 1. (c) Geographical origins of the selected strains. (d) Generation of the diallel hybrid panel. 55 natural isolates available as both mating types as stable haploids were crossed in a pairwise manner to obtain 3025 hybrids. This panel was then phenotyped on 49 growth conditions impacting various cellular processes.
-
Figure 1—source data 1
Growth ratios for every hybrid and parental isolate on each growth condition.
Each value for a given hybrid is the median of 6 replicates. Each value for the haploid parental strains ‘control.a’ and ‘control.b’ are the median of 54 replicates.
- https://doi.org/10.7554/eLife.49258.006
Figure 1—figure supplement 1
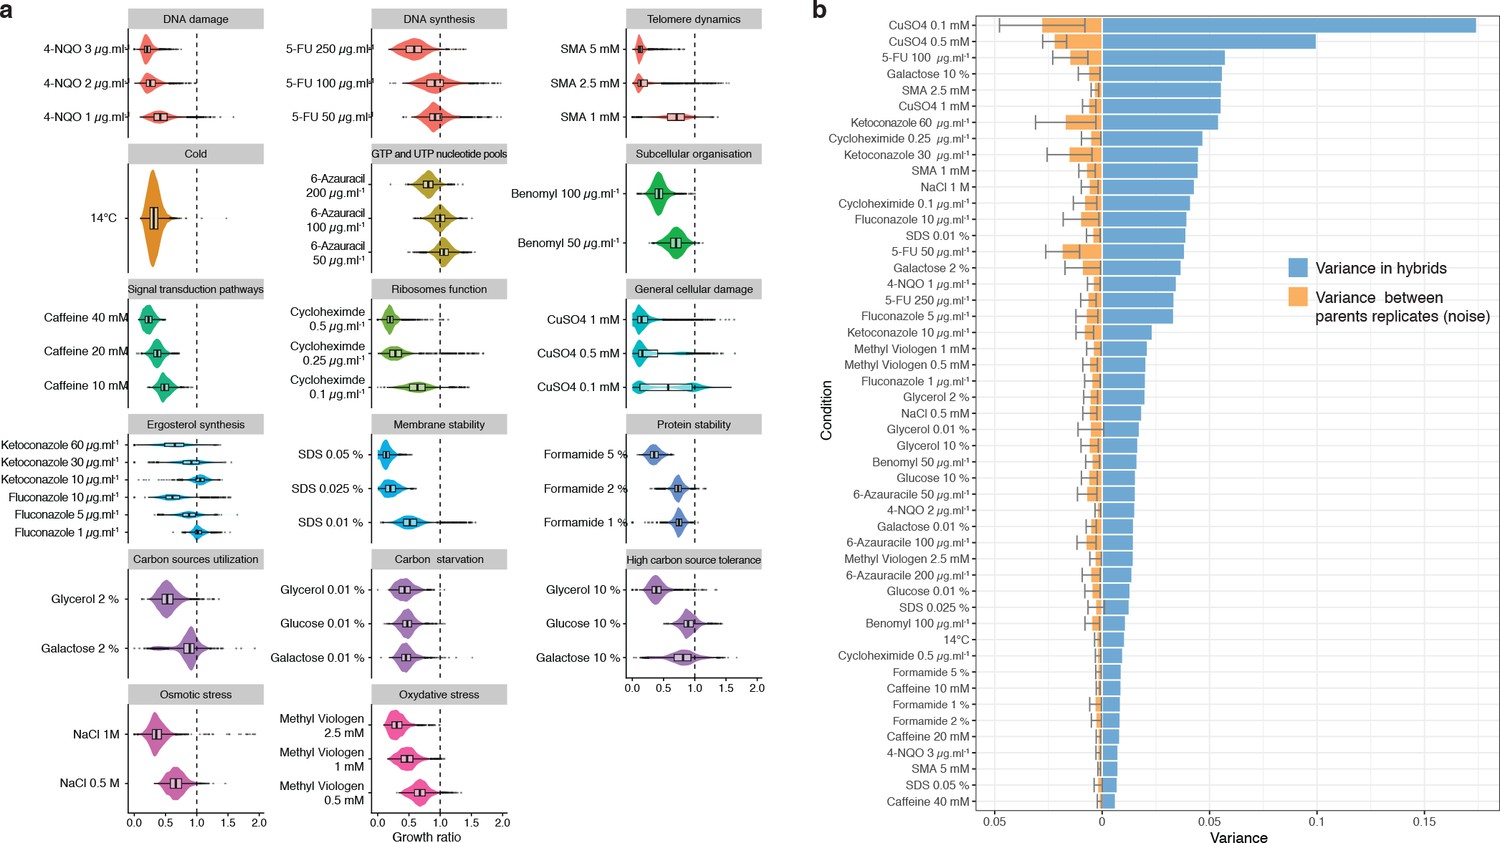
Phenotypic variance in hybrids.
(a) Phenotypic distribution for all hybrids in the different growth conditions. Conditions are organized by type of stress in each panel. (b) Blue bars show the phenotypic variance of the growth ratio for the hybrids in each condition (mean = 0.027). Orange bars represent the variance due to noise between each plate (mean = 0.006). Noise has been measured as the mean variance of every parental replicates across all plates for each condition (two replicate per plate, 27 plates, that is 54 replicate per parental isolate). Error bars represent interquartile range.
Figure 1—figure supplement 2
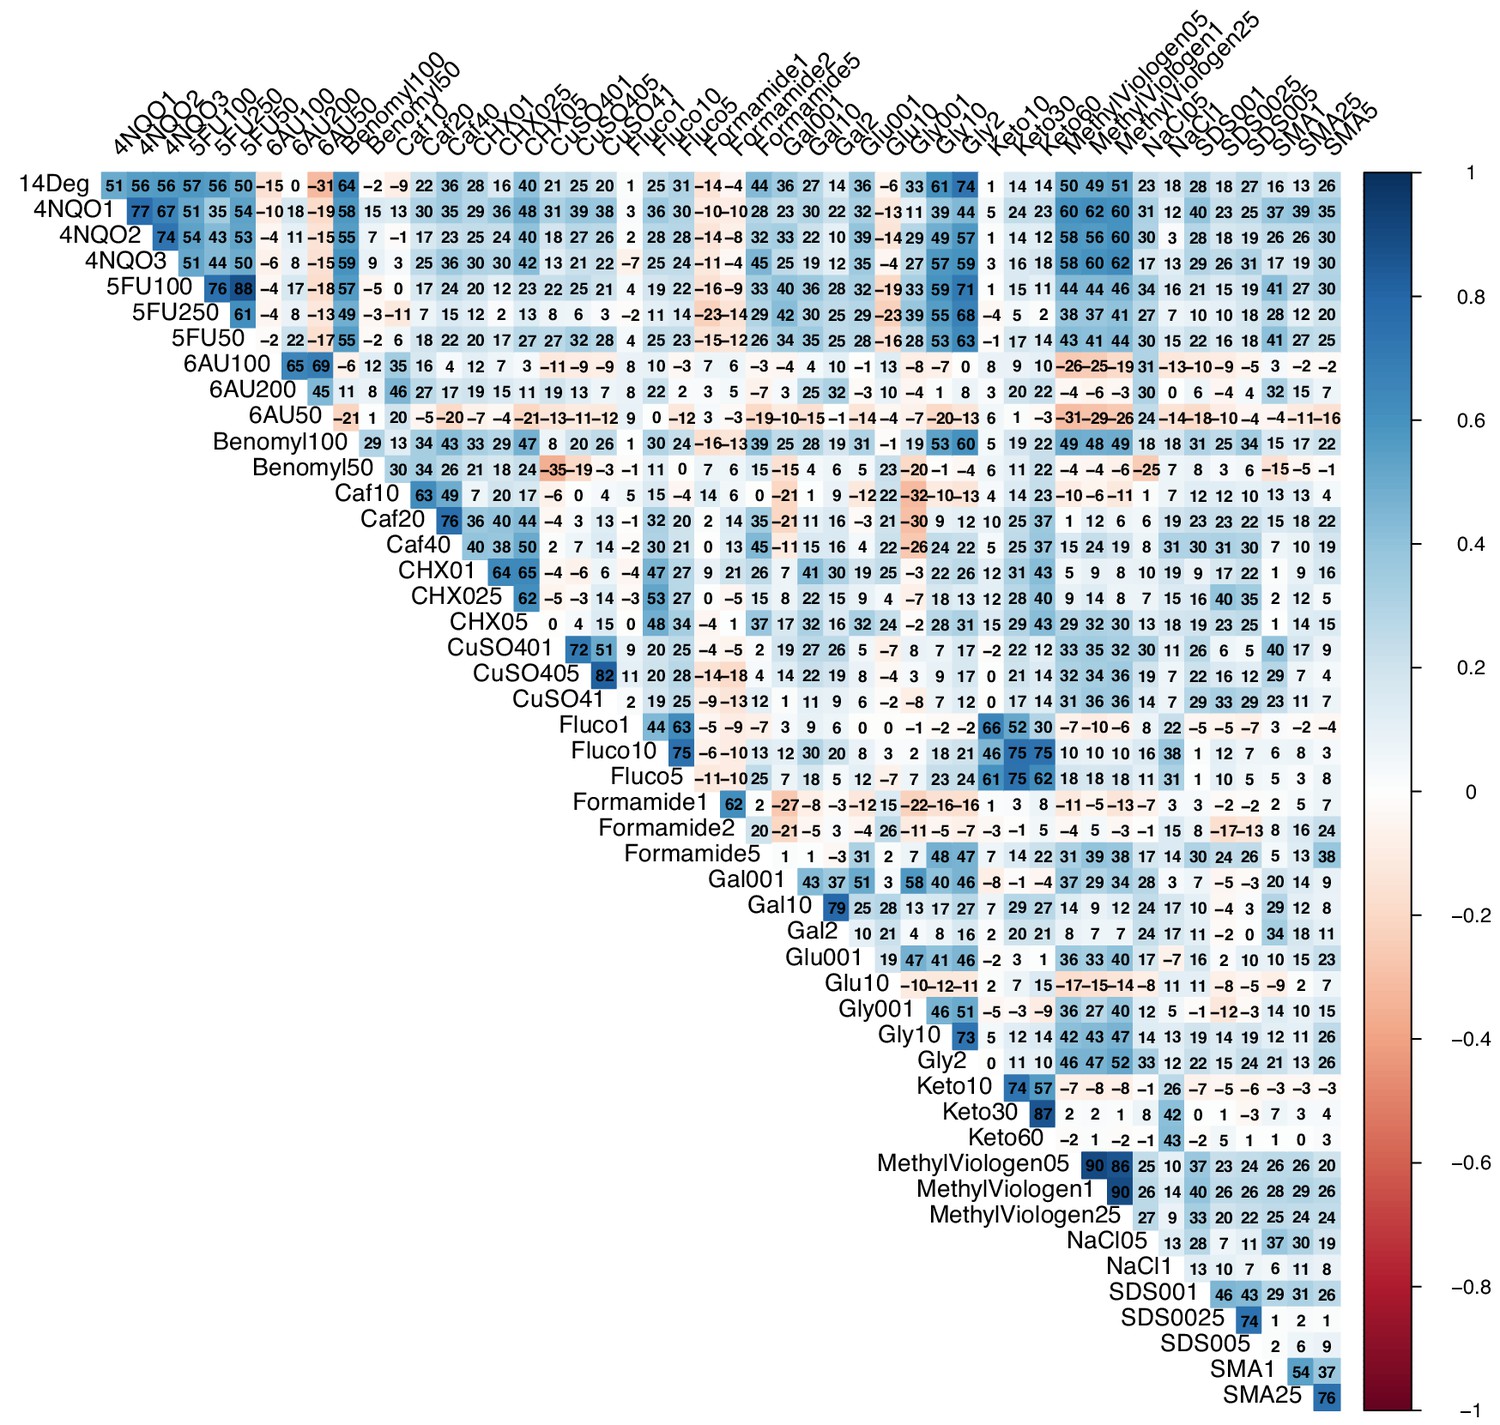
Correlation between conditions.
Correlogram of all tested growth conditions. Numbers in each cell represent 100 x Pearson’s r value.
Figure 1—figure supplement 3
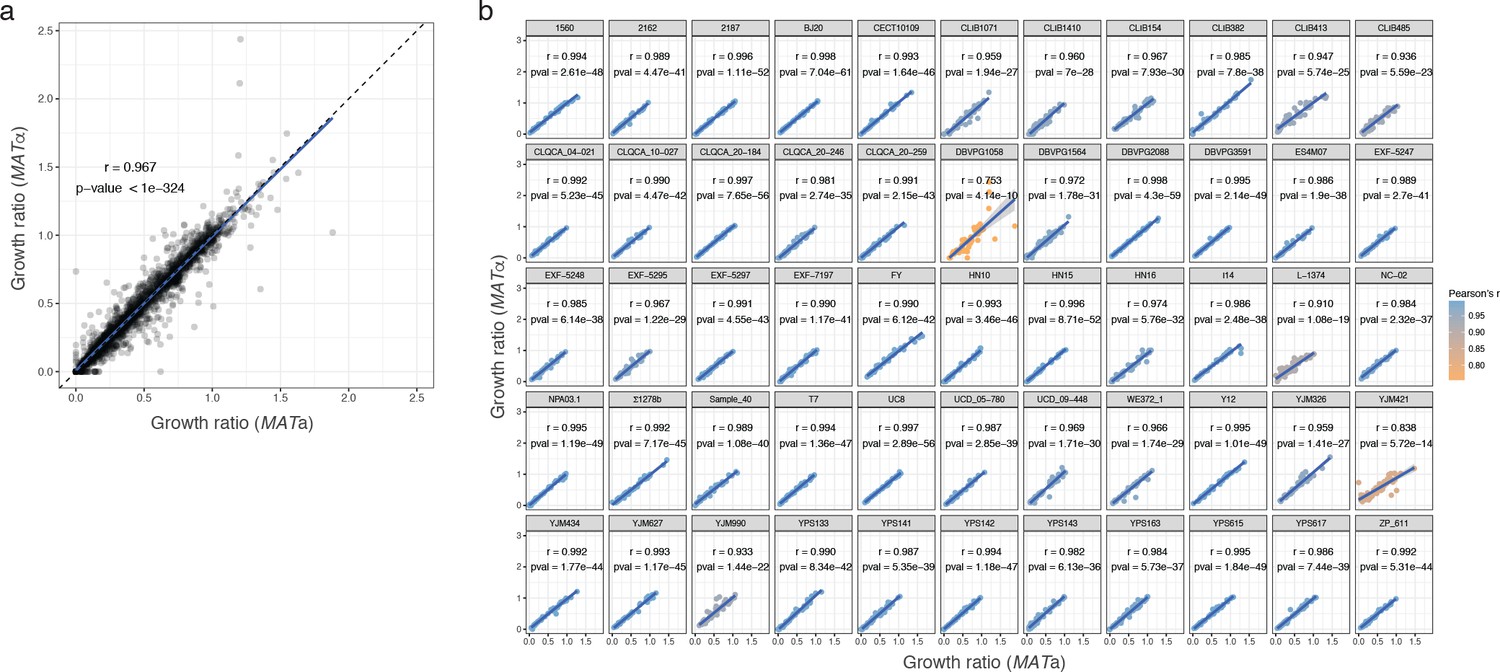
Phenotypic correlation between MATa and MATα isolate.
(a) Correlation between growth ratio of different mating types for all parental strains across all conditions. (b) Correlation between mating types by strain. Pearson’s r and corresponding p-values are indicated for each strain. The growth ratio used is the median of 54 replicates for each strain.
Figure 2
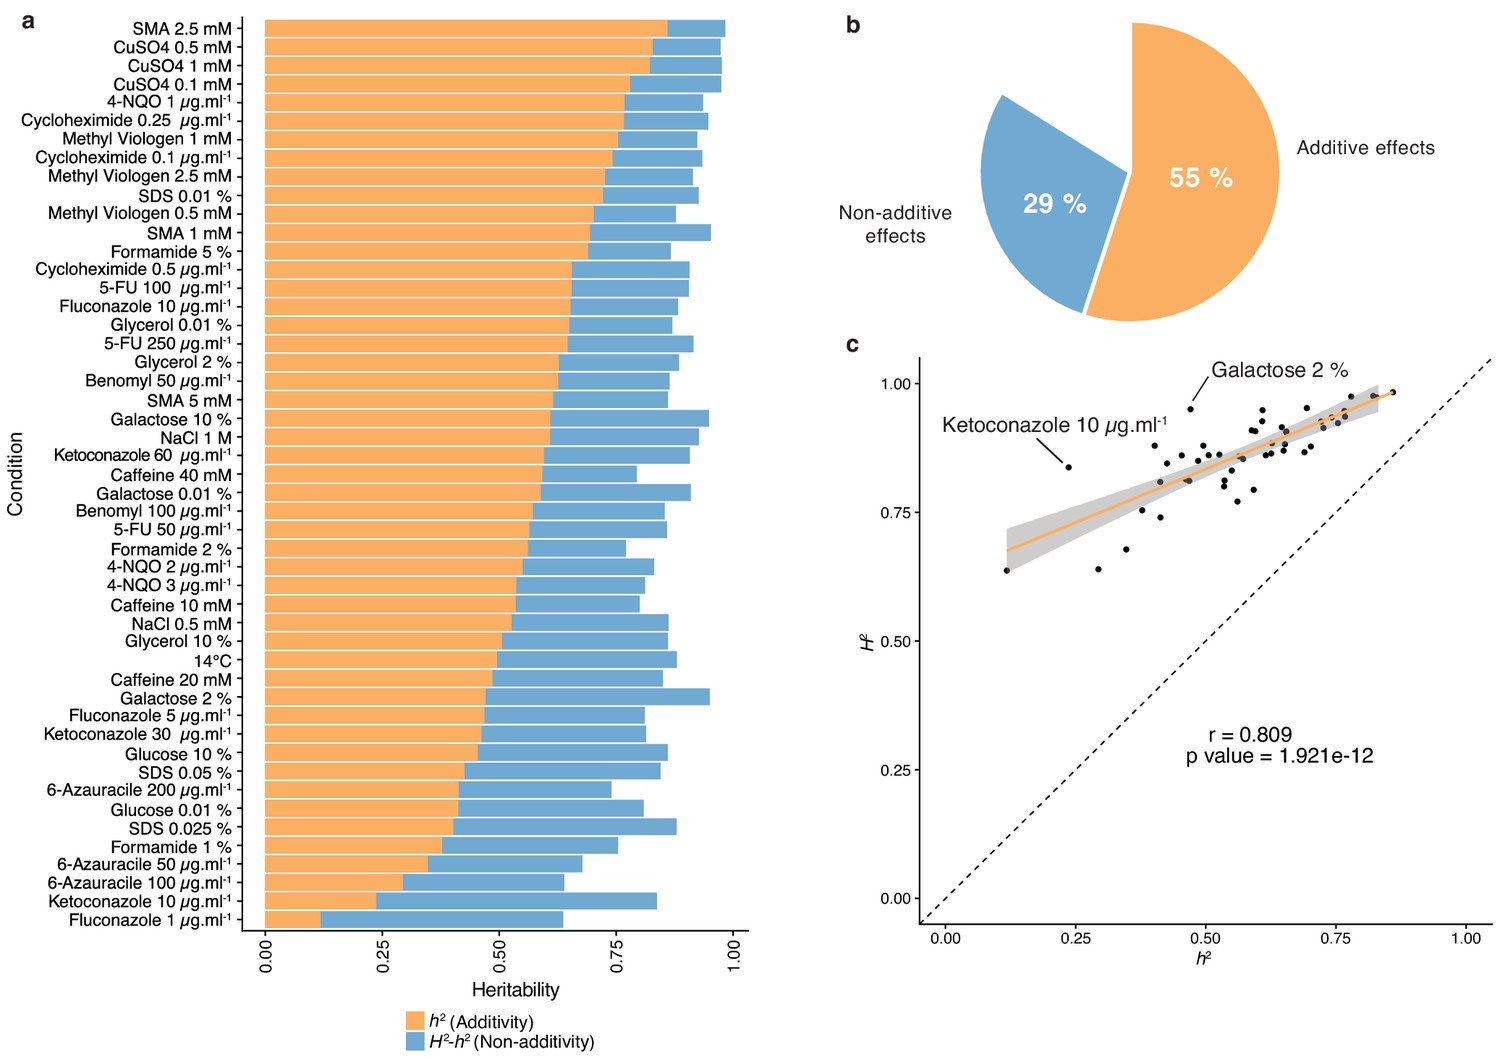
Heritability measurements.
(a) The whole bar represents the overall heritability (H2) for each condition tested. Orange part of the bars represents the narrow-sense heritability h2, that is the fraction of phenotypic variance explained by additive effects, while blue part depicts the fraction of phenotypic variance explained by non-additive effects. (b) Overall mean additive and non-additive effects for every tested growth condition. (c) Representation of H2 as a function of h2 showing the relative additive versus non-additive effects for each condition. Outlier conditions in terms of non-additive variance will lie further away from the linear regression line. Person’s r (95% confidence interval: 0.684–0.889) with the corresponding p-value is displayed.
Figure 3
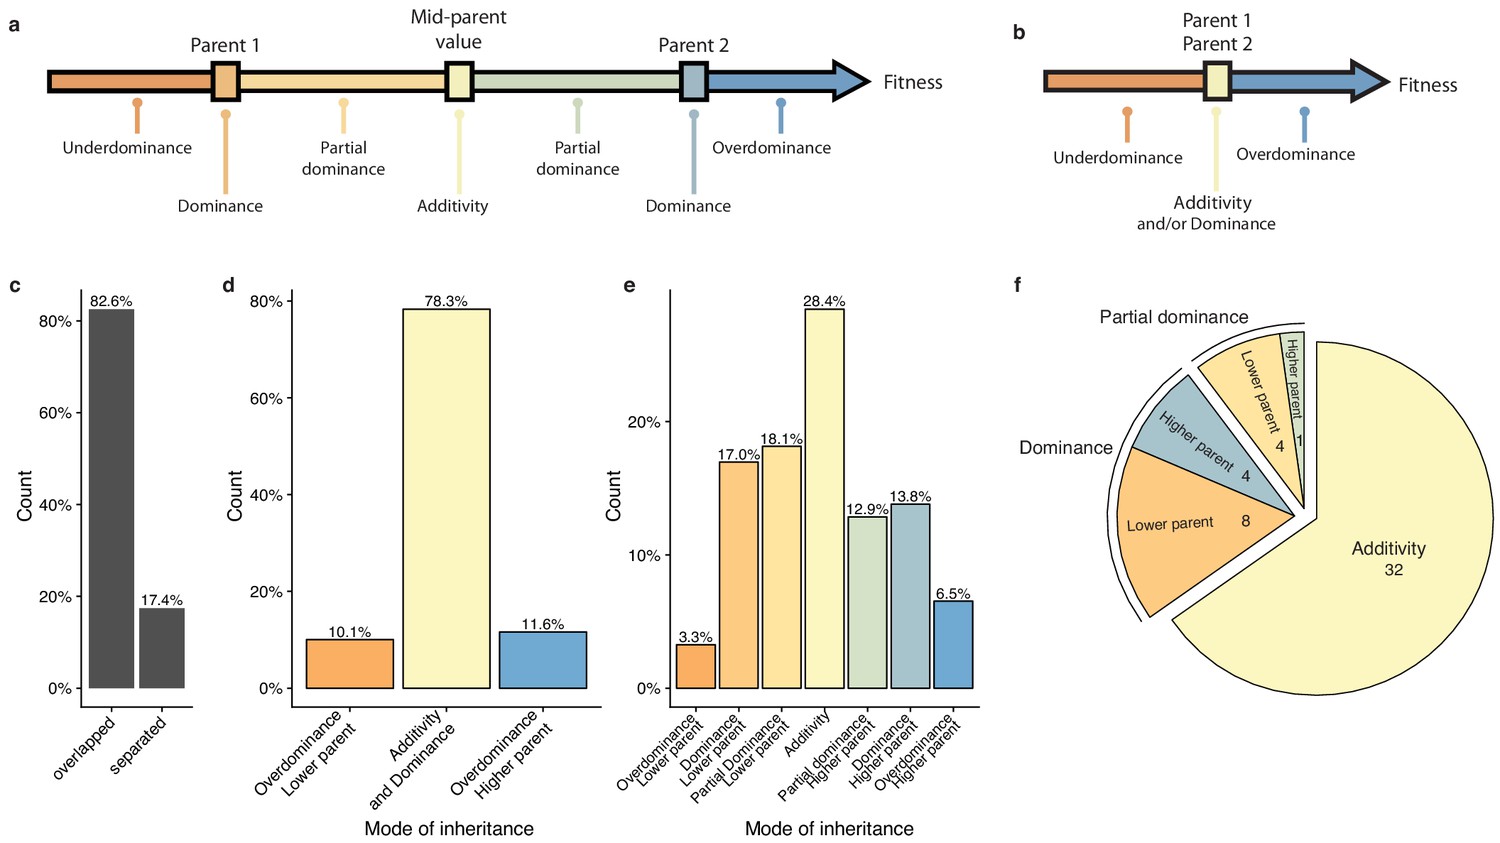
Mode of inheritance.
(a) Representation of the different mode of inheritance depending on the hybrid value when a separation can be achieved between parental strains and (b) if a clear separation cannot be achieved between parental strains. (c) Percentage of parental phenotypes separated from each other for which a complete partition of different inheritance modes can be achieved. (d) Inheritance modes for every cross and condition where no separation can be achieved between the two homozygous parents. e. Inheritance modes for every cross and condition where a clear phenotypic separation can be achieved between the two homozygous parents. (f) The number of conditions in each main inheritance mode.
Figure 4 with 1 supplement
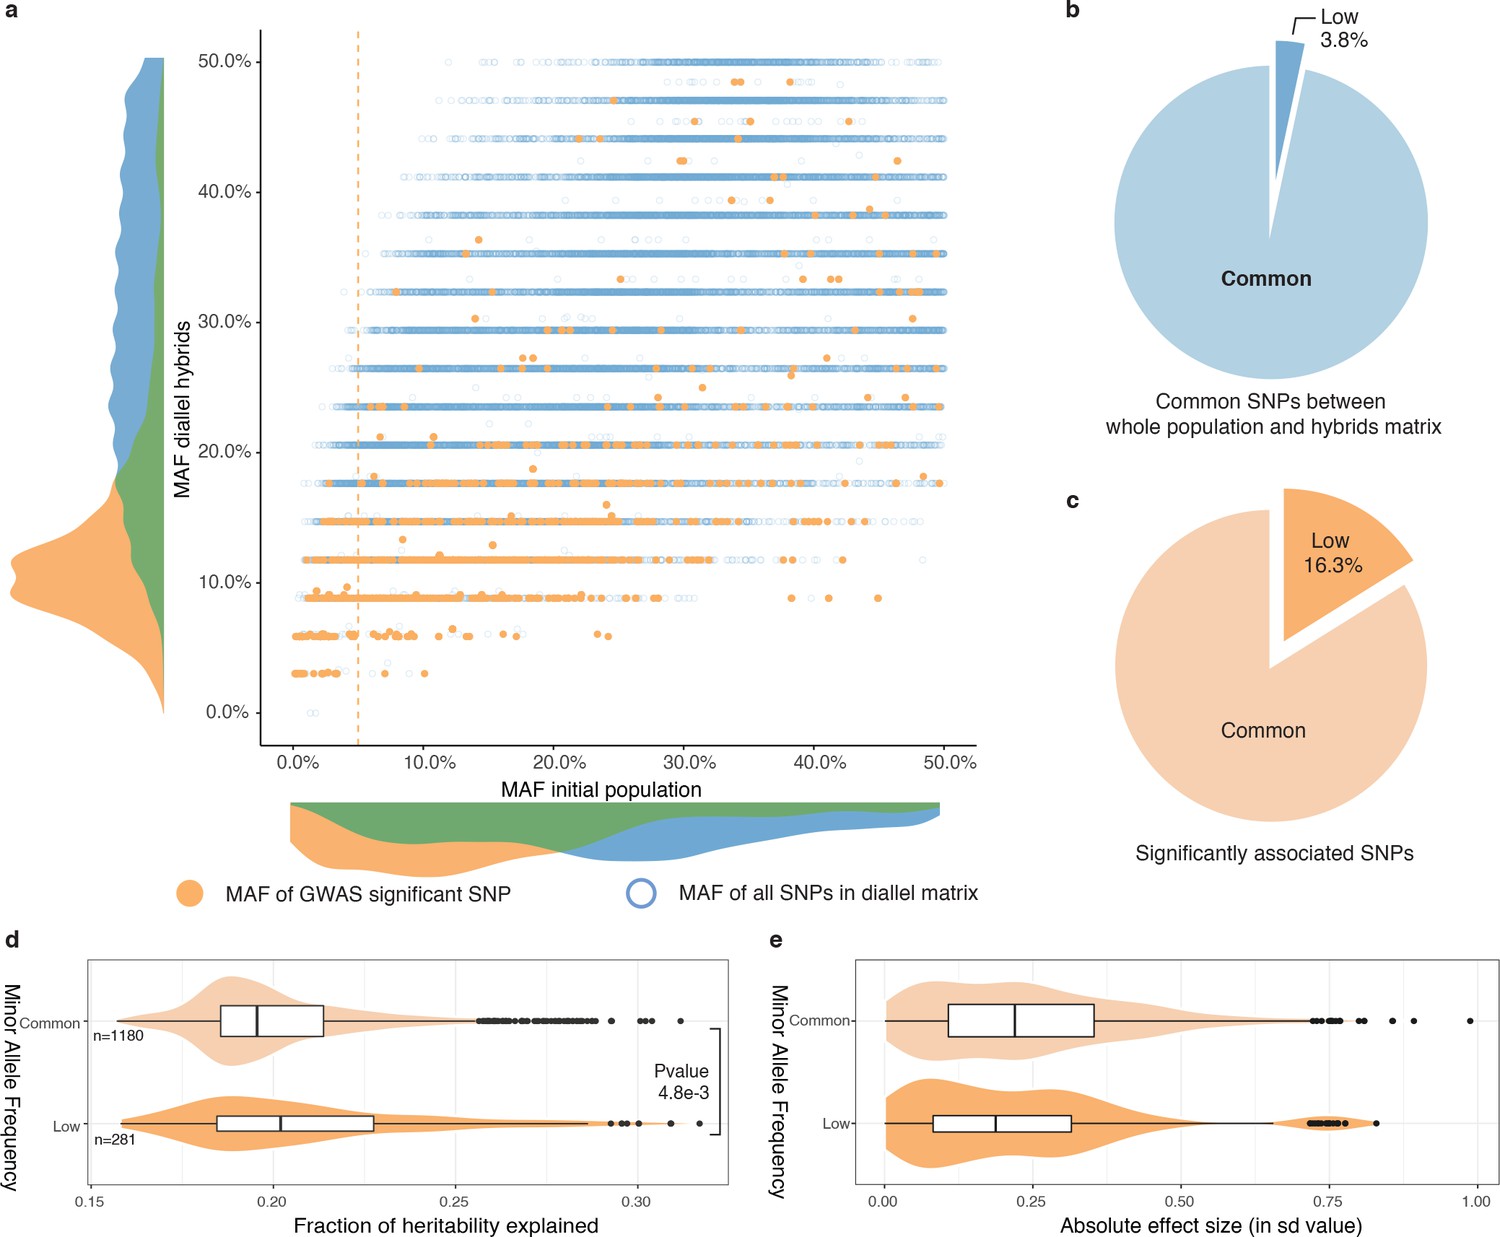
Rare and low-frequency variants detection.
(a) Comparison of MAF for each SNP between the whole population (1011 strains) and the hybrid diallel matrix used for GWAS. Hollow blue circles represent the MAF of all SNPs common to the initial population and the diallel hybrids (31,632). Full orange circles show the MAF of significantly associated SNPs. Vertical orange line shows the 5% MAF threshold. (b) Proportion of SNPs with a MAF below 0.05. (c) Proportion of significantly associated SNPs with a MAF below 0.05. (d) Fraction of heritability explained for common and low-frequency variants. P-value was calculated using a two-sided Mann-Whitney-Wilcoxon test, difference in location of −4.5e−3 (95% confidence interval −7.9e−3 -1.4e−3). (e) Absolute effect size of common and low-frequency variants.
-
Figure 4—source data 1
Significantly associated SNPs SNPs without MAF are SNPs that were not biallelic in the initial population of 1011 isolates (Peter et al., 2018).
- https://doi.org/10.7554/eLife.49258.011
Figure 4—figure supplement 1

Significantly associated SNPs.
(a) Variance explained for each significantly associated SNPs, for rare (MAF <1%), low-frequency (MAF <5%) and common (MAF >5%) variants for both encoding models (in gray), additive encoding only (in orange) and overdominant encoding (in blue). All p-values are calculated using a two-sided Mann-Whitney-Wilcoxon test. (b) Position of the unique significantly associated SNPs. (c) Venn diagram comparing the overlap between the 546 unique genes in our dataset with the 178 known QTGs (Peltier et al., 2019) and 195 QTGs recently highlighted (Bloom et al., 2019).
Figure 5
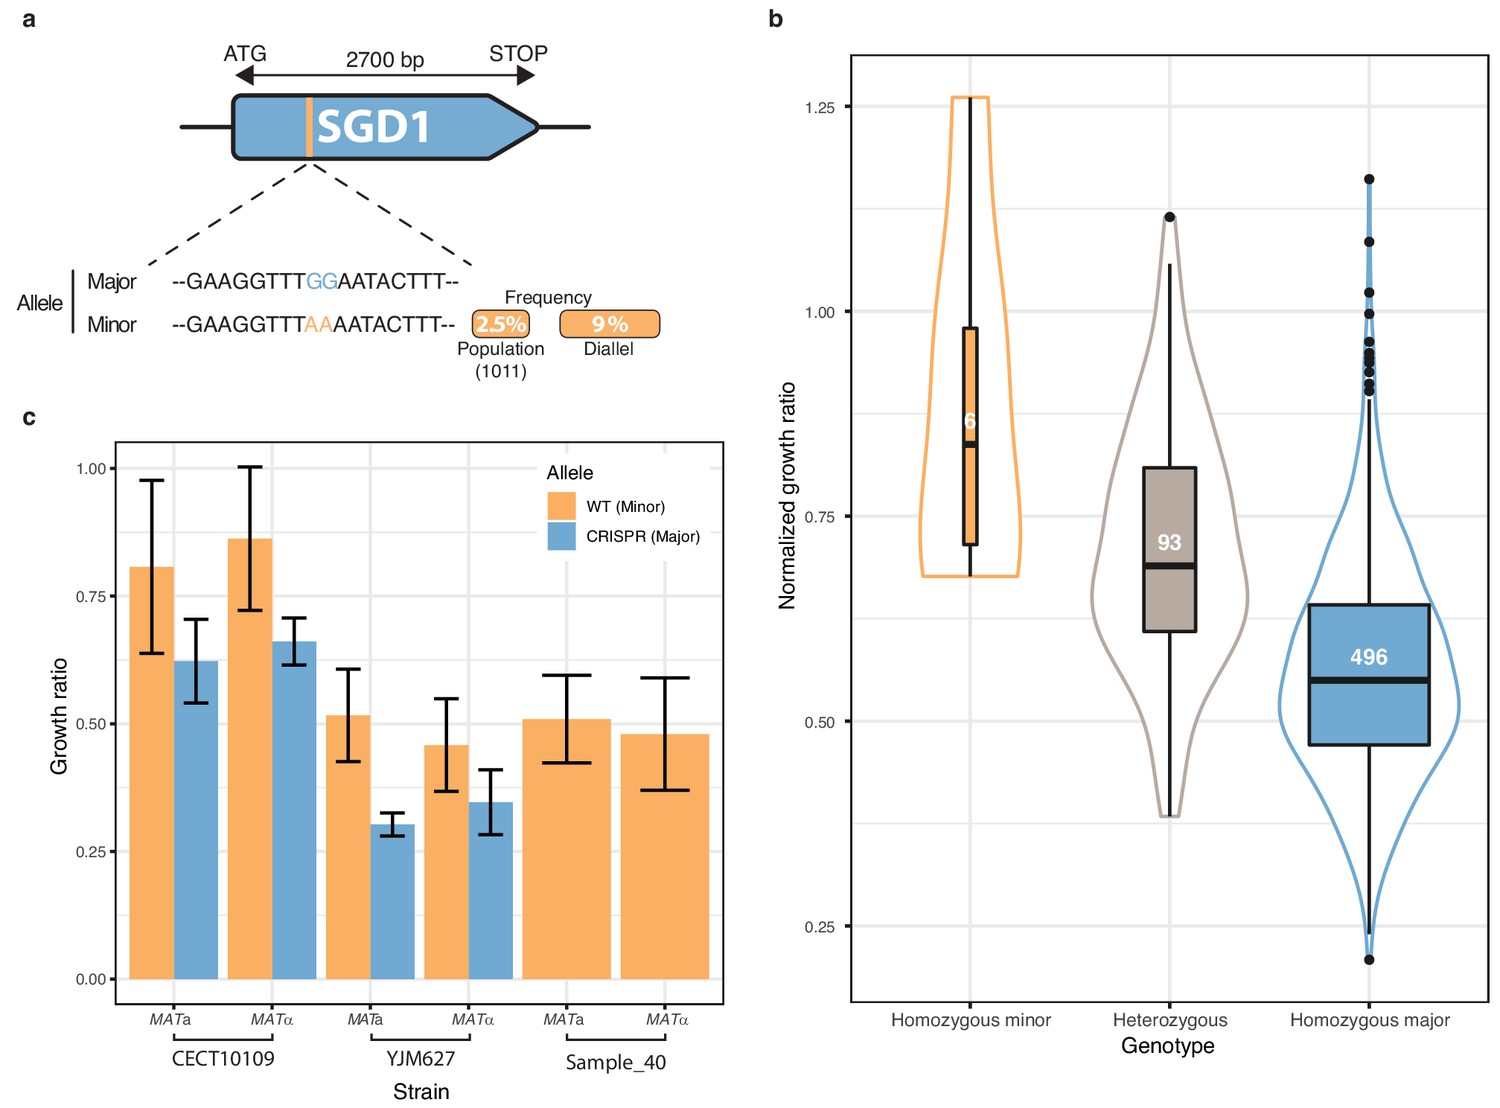
Low-frequency variant functional validation in 6-azauracil 100 µg.ml−1.
(a) Schematic representation of SGD1 with the relative position of the detected SNPs. The minor allele is represented in orange with its MAF in the population and in the diallel cross panel. (b) boxplot and density plot of the normalized growth ratios for each genotype on 6-azauracil 100 µg.ml−1. Number of observation is displayed in the boxplots. (c) Phenotypic validation after allele replacement of the minor allele with the major allele using CRISPR-Cas9 in the strains carrying the minor allele. Error bars represent median absolute deviation (four replicates).
Additional files
-
Supplementary file 1
Strains used for the diallel cross with their ecological and geographical origins.
- https://doi.org/10.7554/eLife.49258.013
-
Supplementary file 2
Phenotyping conditions and their respective type of induced stress.
- https://doi.org/10.7554/eLife.49258.014
-
Supplementary file 3
GO Term associated with the 546 unique genes with a significantly associated SNPs.
- https://doi.org/10.7554/eLife.49258.015
-
Transparent reporting form
- https://doi.org/10.7554/eLife.49258.016
Download links
A two-part list of links to download the article, or parts of the article, in various formats.
Downloads (link to download the article as PDF)
Open citations (links to open the citations from this article in various online reference manager services)
Cite this article (links to download the citations from this article in formats compatible with various reference manager tools)
Extensive impact of low-frequency variants on the phenotypic landscape at population-scale
eLife 8:e49258.
https://doi.org/10.7554/eLife.49258


