Monosynaptic tracing maps brain-wide afferent oligodendrocyte precursor cell connectivity
- Stanford University, United States
Figures
Figure 1 with 1 supplement
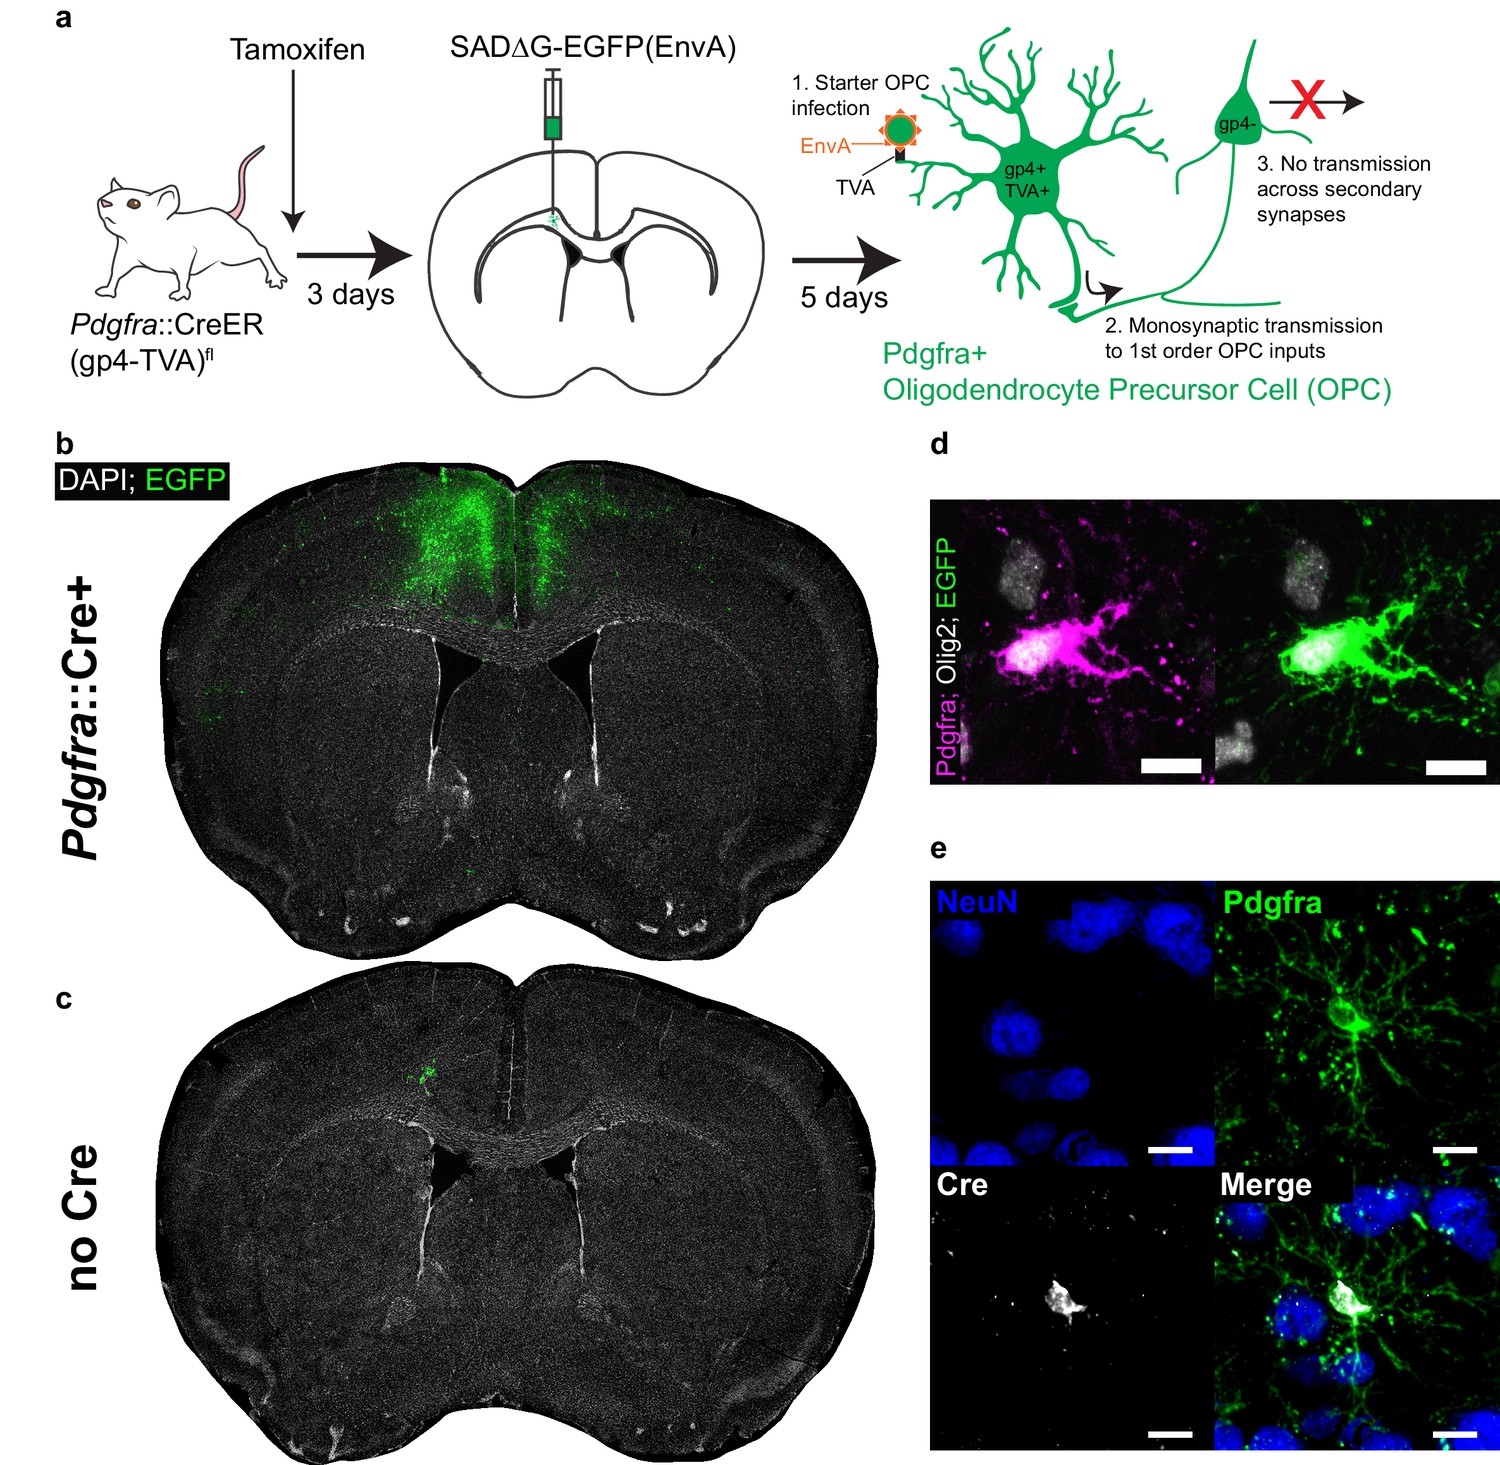
Monosynaptically-restricted rabies virus enables tracing of synaptic inputs to OPCs.
(a) Outline of experimental strategy used to label inputs to Pdgfra+ OPCs. (b) Injection of SADΔG-EGFP(EnvA) into sub-cingular corpus callosum results in widespread labeling of EGFP+ input neurons (representative injection site image from n = 10 animals. Green = EGFP, white = DAPI). (c) Injection of SADΔG-EGFP(EnvA) into animals lacking Pdgfra::CreER driver allele results in only minimal transduction, likely resulting from minimal quantities of EnvA- viral particles (representative image of n = 4 animals. Green = EGFP, white = DAPI). (d) Pdgfra+/Olig2+ OPC starter cells (left) are transduced with SADΔG-EGFP(EnvA) (right, same cell. Magenta = Pdgfra, white = Olig2, green = EGFP). (e) Immunostaining confirms Cre recombinase expression in Pdgfra+ OPCs (green) but not NeuN+ neurons (blue). Scale bars in (d,e) represent 10 microns.
Figure 1—figure supplement 1

SADΔG-EGFP(EnvA) specificity and starter characterization.
(a) Immunofluorescence staining for the white matter and reactive astrocyte marker Gfap (white; top panels) and the macrophage marker Iba1 (white; bottom panels) does not identify substantial evidence of EGFP+ (green) astroglial/microglial cells despite evidence of reactive gliosis in the injection site. (b) Quantification of colocalization studies represented in (a) demonstrates minimal overlap concentrated to the injection site that is not increased in Cre+ animals compared with minimal expected background labeling in Cre WT controls. Bars indicate the mean, n = 6 animals (Cre WT) or nine animals (Cre+) respectively; error bars represent SEM. (c) Example of EGFP+Pdgfra+Olig2+ starter cells with disrupted morphology. Blue = DAPI, green = EGFP; red = Pdgfra; white = Olig2. (d) Representative micrograph of SADΔG-mCherry compared against SADΔG-EnvA-GFP injections in Pdgfra::CreER and Cre WT animals after tamoxifen injection. In the absence of EnvA, widespread transduction occurs independently of Cre expression, confirming that viral EnvA confers starter cell specificity in Pdgfra::CreER animals. (e) Representative micrograph of CASPR (red) colocalization (indicated with white arrow) along myelinated GFP+ (green) input neurons, as well as unmyelinated axonal profiles lacking CASPR (green arrows). (f) Depth of Pdgfra+GFP+ OPC starter cells as measured from the pia. Histogram divided into 100 micron bins, with y-axis labels indicating center of bin; n = 68, 75, 93 cells respectively with injection site indicated by legend color. Scale bars in (a) are 50 microns, in (c) are 10 microns, in (d) are 500 microns, and in (e) is five microns.
Figure 2 with 1 supplement
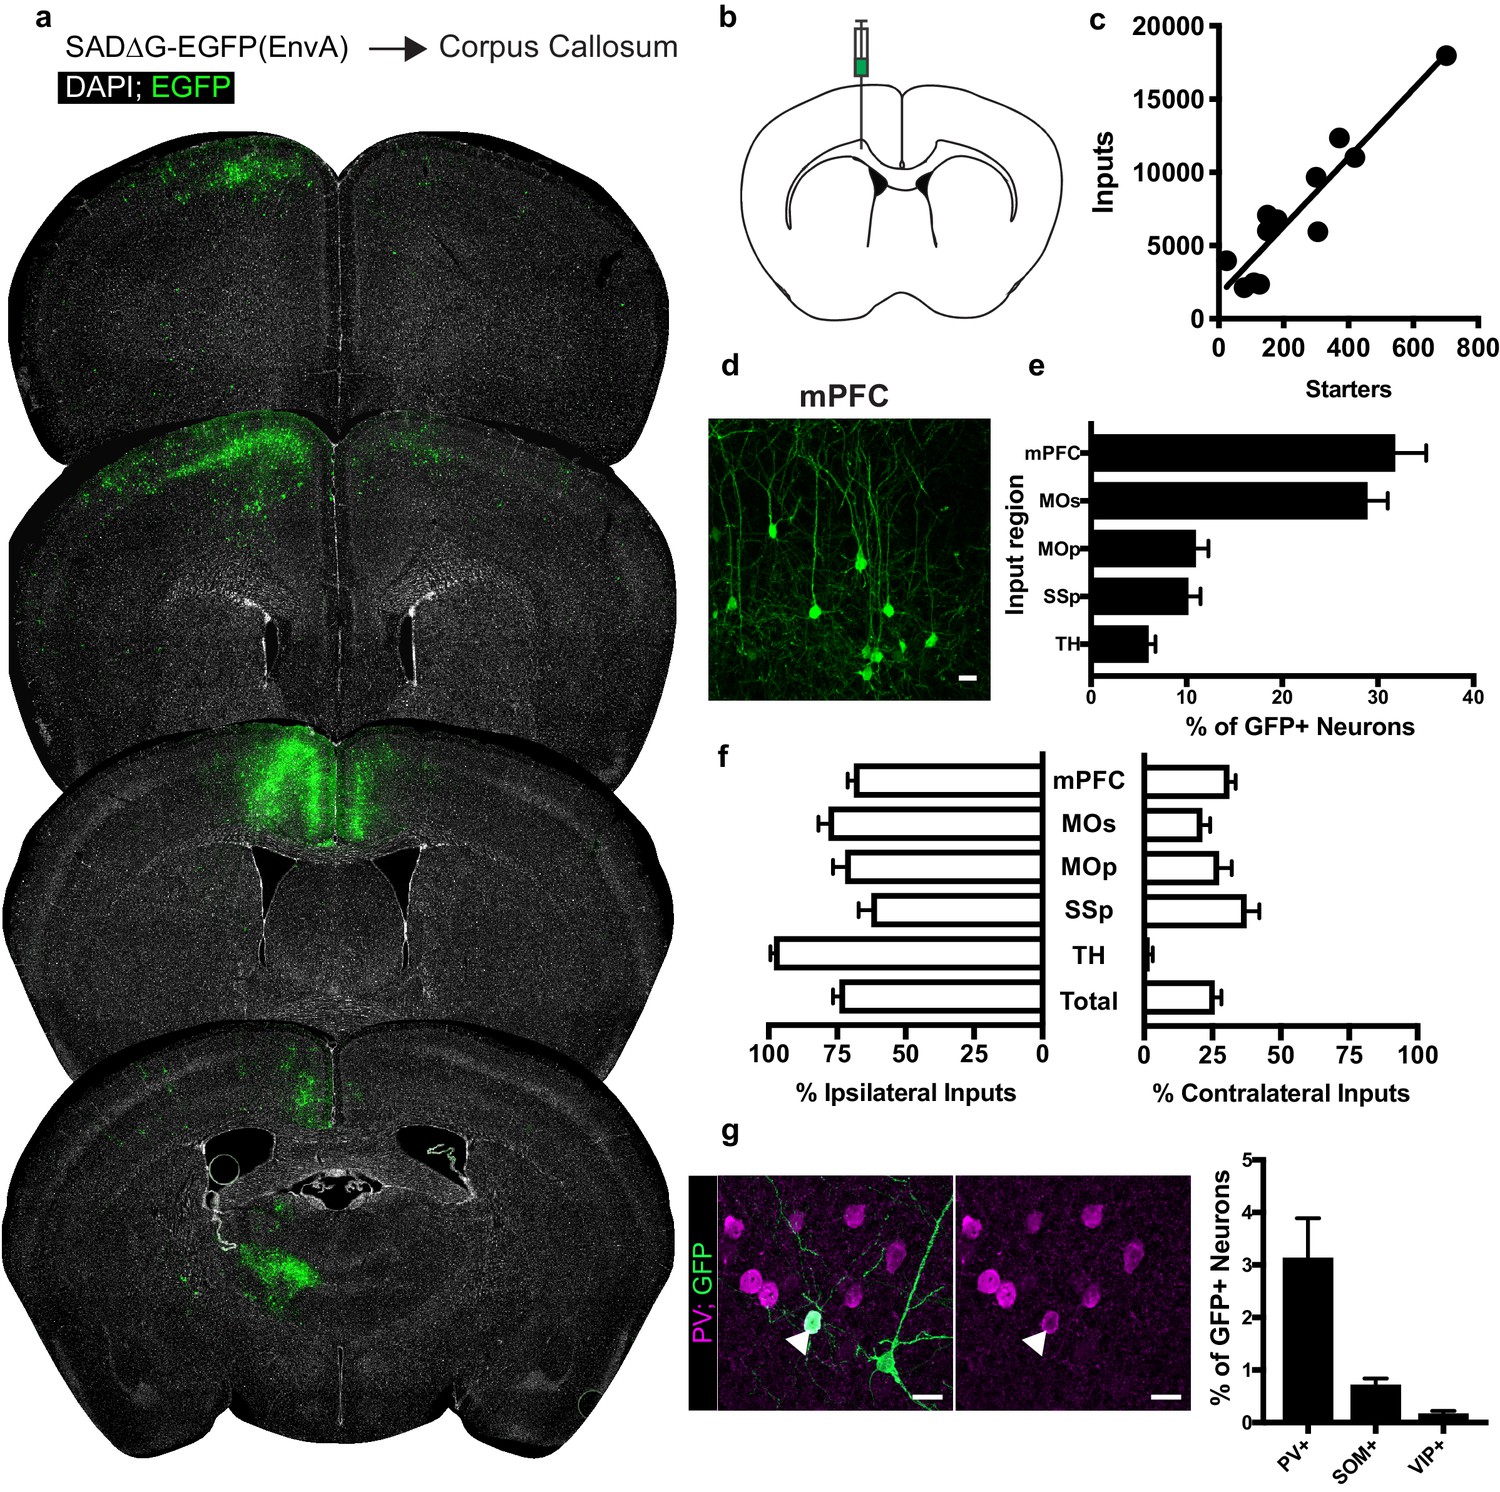
Neuronal inputs to callosal OPCs arise from functionally interconnected cortical and thalamic areas.
(a) Representative sections of neuronal input labeling to OPCs following stereotaxic injection of SADΔG-EGFP(EnvA) to corpus callosum underlying the secondary motor area. Green = EGFP, white = DAPI. (b) Schematic of injection site. (c) Linear regression fit of neuronal input/Pdgfra+ OPC starter cells. Each point represents one animal, n = 12 animals, R2 = 0.8732, slope = 23.46 ± 2.8 standard error. (d) Representative confocal micrograph of EGFP+ (green) input neurons in medial prefrontal (mPFC) cortex. (e) Inputs to callosal OPCs largely arise from frontal association cortices but also include primary motor and somatosensory areas and thalamic nuclei. Each bar represents mean input percentage, error bars indicate SEM, n = 10 total. mPFC = medial prefrontal cortex (anterior cingulate, prelimbic, infralimbic regions), MOs = secondary motor area, MOp = primary motor area, SSp = primary somatosensory area, TH = thalamus (including all thalamic nuclei). (f) Percent of input neurons ipsilateral or contralateral to the OPC starter cells. Bars indicate mean, error bars indicate SEM, n = 10 animals. (g) Representative image of parvalbumin+ (PV+, magenta) GFP+ (green) input neuron (arrowhead) and quantification of percentage of input neurons that co-label with immunofluorescence makers for PV, somatostatin (SOM), or vasoactive intestinal peptide (VIP). Bars represent mean, error bars indicate SEM, n = 6 animals total. Scale bars in (d,g) represent 20 microns.
Figure 2—figure supplement 1
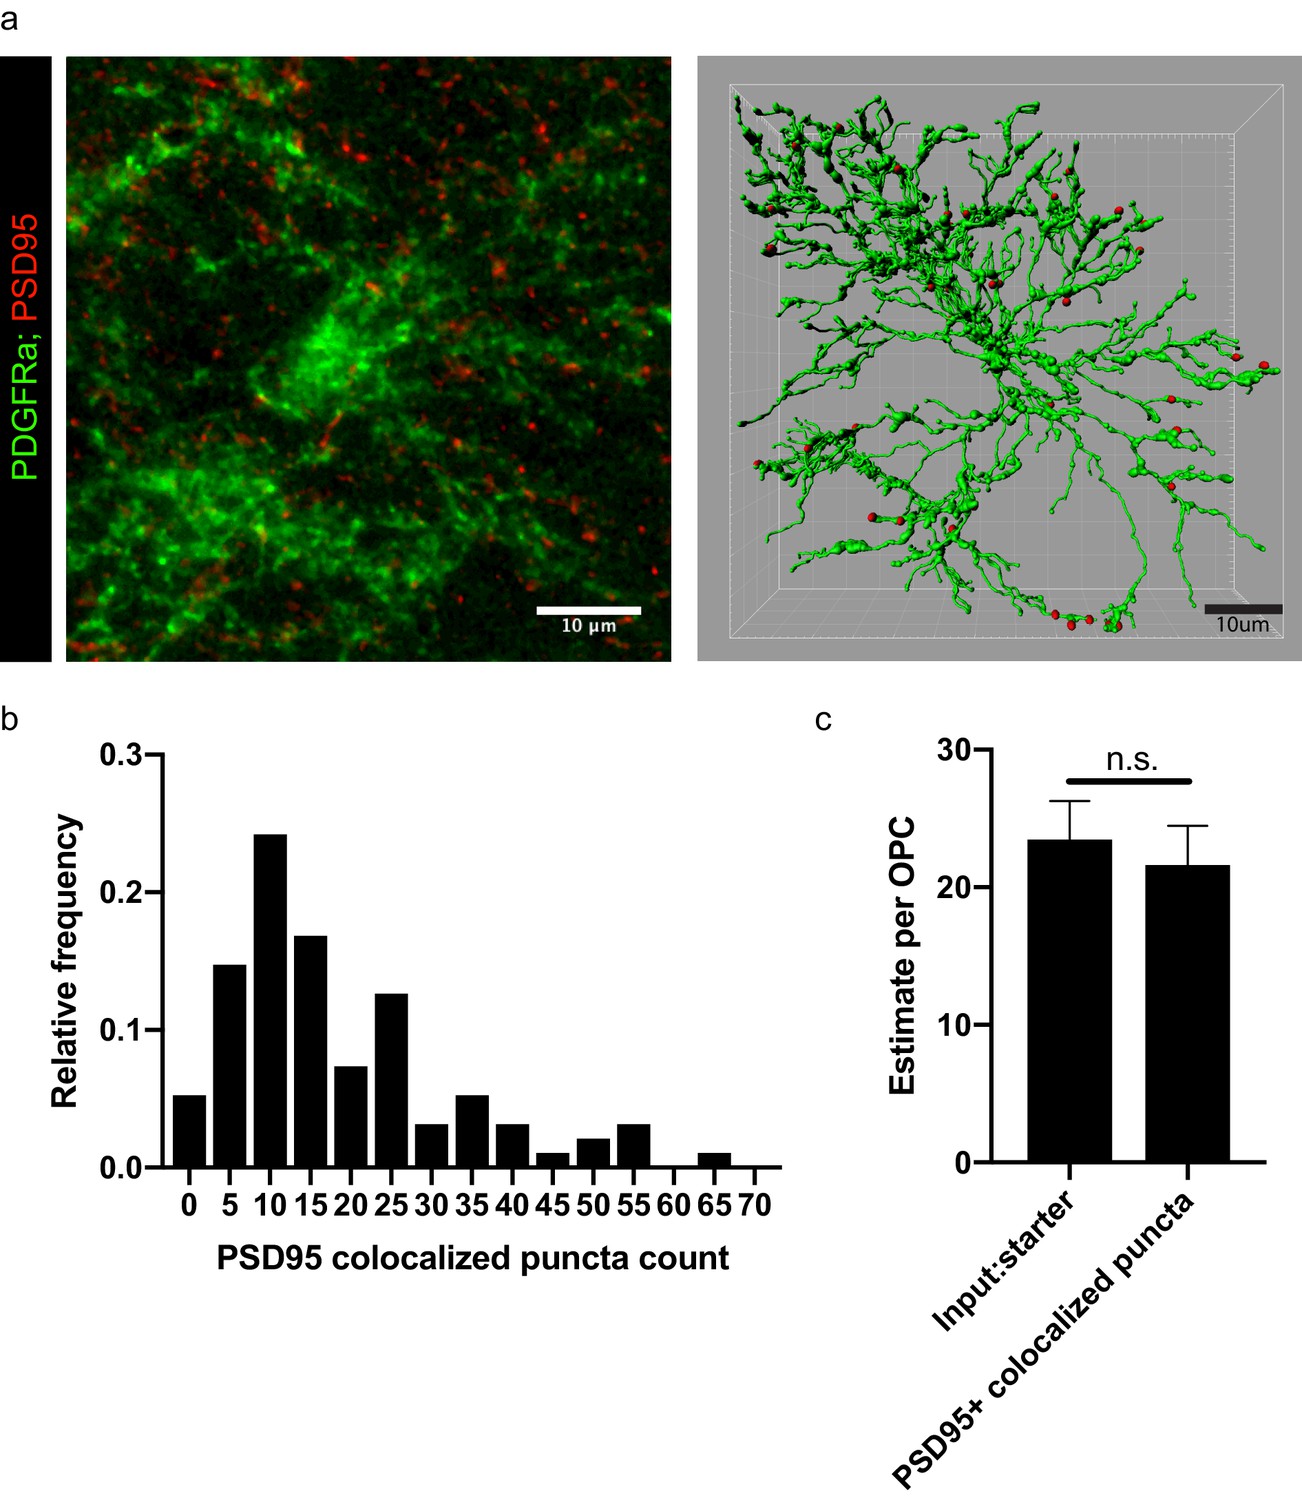
PSD95 puncta colocalization with OPCs.
(a) Representative micrograph of PSD95 puncta (red) and Pdgfra+ (green) OPC in corpus callosum, with subsequent rendering of 3D filament model of OPC and colocalized puncta generated in Imaris. Scale bars 10 microns, (b) Frequency distribution of PSD95 colocalized puncta across all OPCs imaged in corpus callosum and rendered as in (a); bars indicate relative frequency, n = 95 cells across nine animals. (c) Comparison of mean PSD95 colocalized puncta per OPC calculated from the nine animals investigated with neuronal input:OPC starter ratio estimated by linear regression as in (Figure 2C). Error bars indicate standard error of each respective measurement.
Figure 3
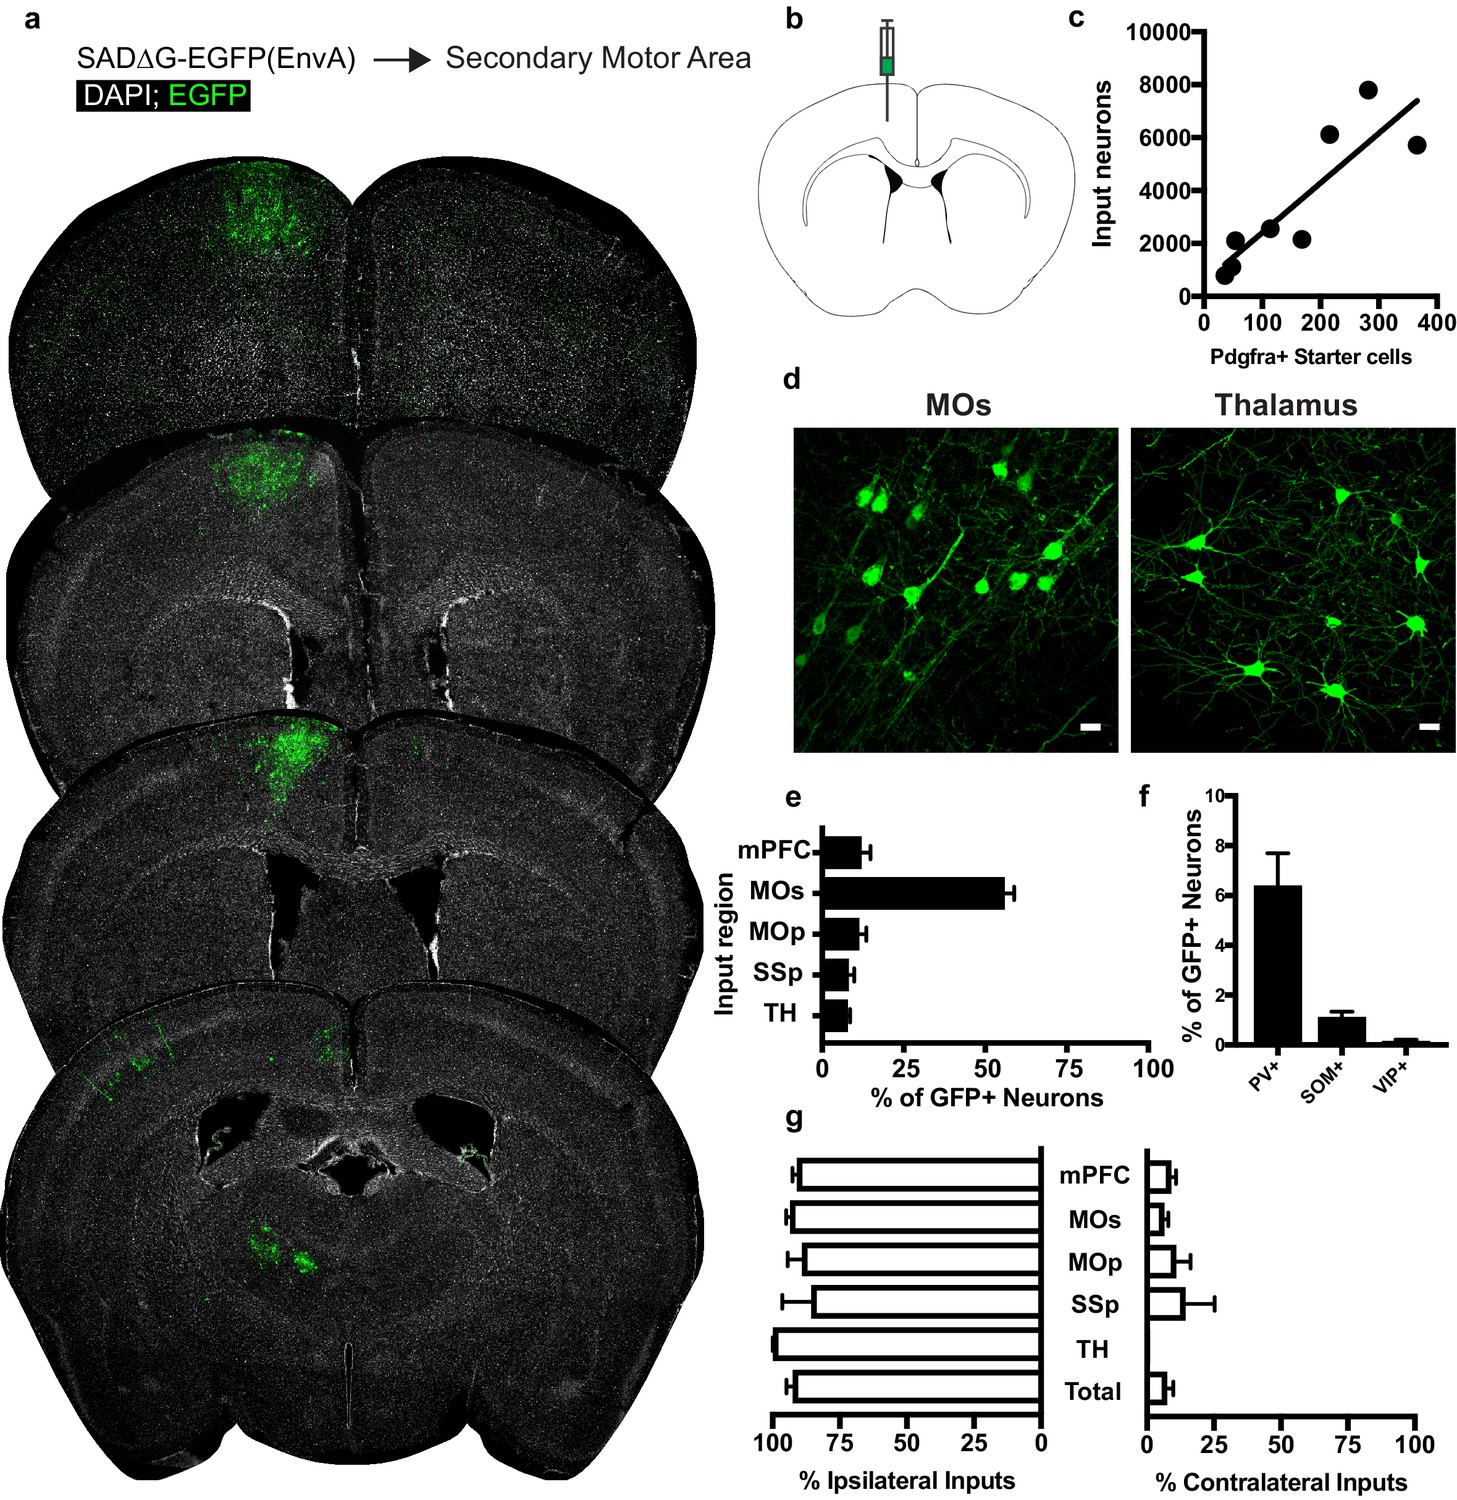
Circuit-specific cortical and thalamic neuronal inputs to OPCs in secondary motor area (MOs).
(a) Representative sections of neuronal input labeling to OPCs following stereotaxic injection of SADΔG-EGFP(EnvA) to MOs. Green = EGFP, white = DAPI. (b) Schematic of injection site. (c) Linear regression fit of neuronal input/Pdgfra+ starter cells. Each point represents one animal, R2 = 0.7486, slope = 18.76 ± 4.4 standard error). (d) Representative confocal micrographs of EGFP+ (green) input neurons in secondary motor cortex (MOs) and thalamus. (e) Inputs to gray matter OPCs found in MOs are chiefly located within MOs, n = 8 animals total. mPFC = medial prefrontal cortex (anterior cingulate, prelimbic, infralimbic regions), MOs = secondary motor area, MOp = primary motor area, SSp = primary somatosensory area, TH = thalamus (including all thalamic nuclei). (f) Percentage of input neurons that co-label with immunofluorescence makers for parvalbumin (PV), somatostatin (SOM), or vasoactive intestinal peptide (VIP), n = 5 animals total. (g) Percent of input neurons ipsilateral or contralateral to OPC starter cells. Bars indicate mean, error bars indicate SEM, each point represents an individual animal (n = 8). Scale bars in (d) represent 20 microns.
Figure 4
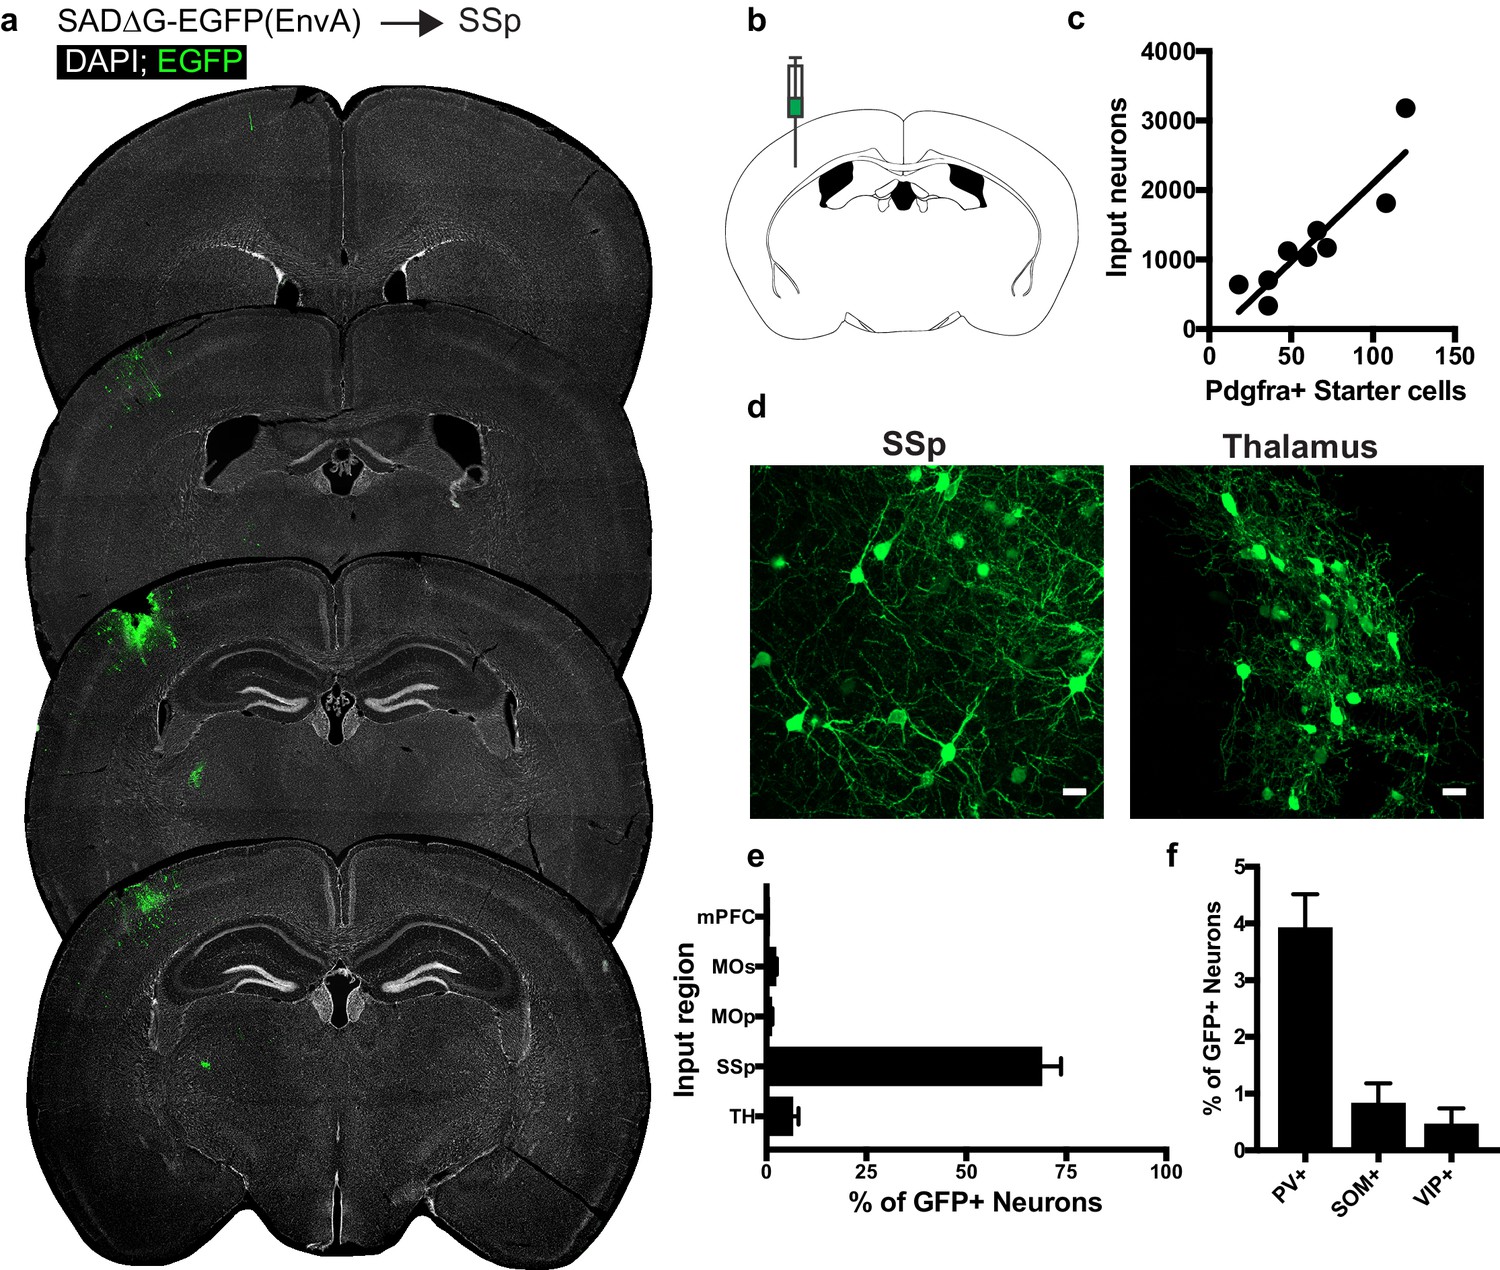
Circuit-specific cortical and thalamic neuronal neuronal inputs to SSp.
(a) Representative sections of neuronal input labeling to OPCs following stereotaxic injection of SADΔG-EGFP(EnvA) to SSp. Green = EGFP, white = DAPI. (b) Schematic of injection site. (c) Linear regression fit of neuronal input/Pdgfra+ starter cells. Each point represents one animal, R2 = 0.8145, slope = 22.57 ± 3.8 standard error). (d) Representative confocal micrographs of EGFP+ (green) input neurons in primary somatosensory cortex (SSp) and thalamus. (e) Inputs to gray matter OPCs found in SSp are chiefly located within SSp. n = 9 animals total. mPFC = medial prefrontal cortex (anterior cingulate, prelimbic, infralimbic regions), MOs = secondary motor area, MOp = primary motor area, SSp = primary somatosensory area, TH = thalamus (including all thalamic nuclei). (f) Percentage of input neurons that co-label with immunofluorescence makers for parvalbumin (PV), somatostatin (SOM), or vasoactive intestinal peptide (VIP), n = 5 animals. Bars indicate mean, error bars indicate SEM. Scale bars in (d) represent 20 microns.
Figure 5
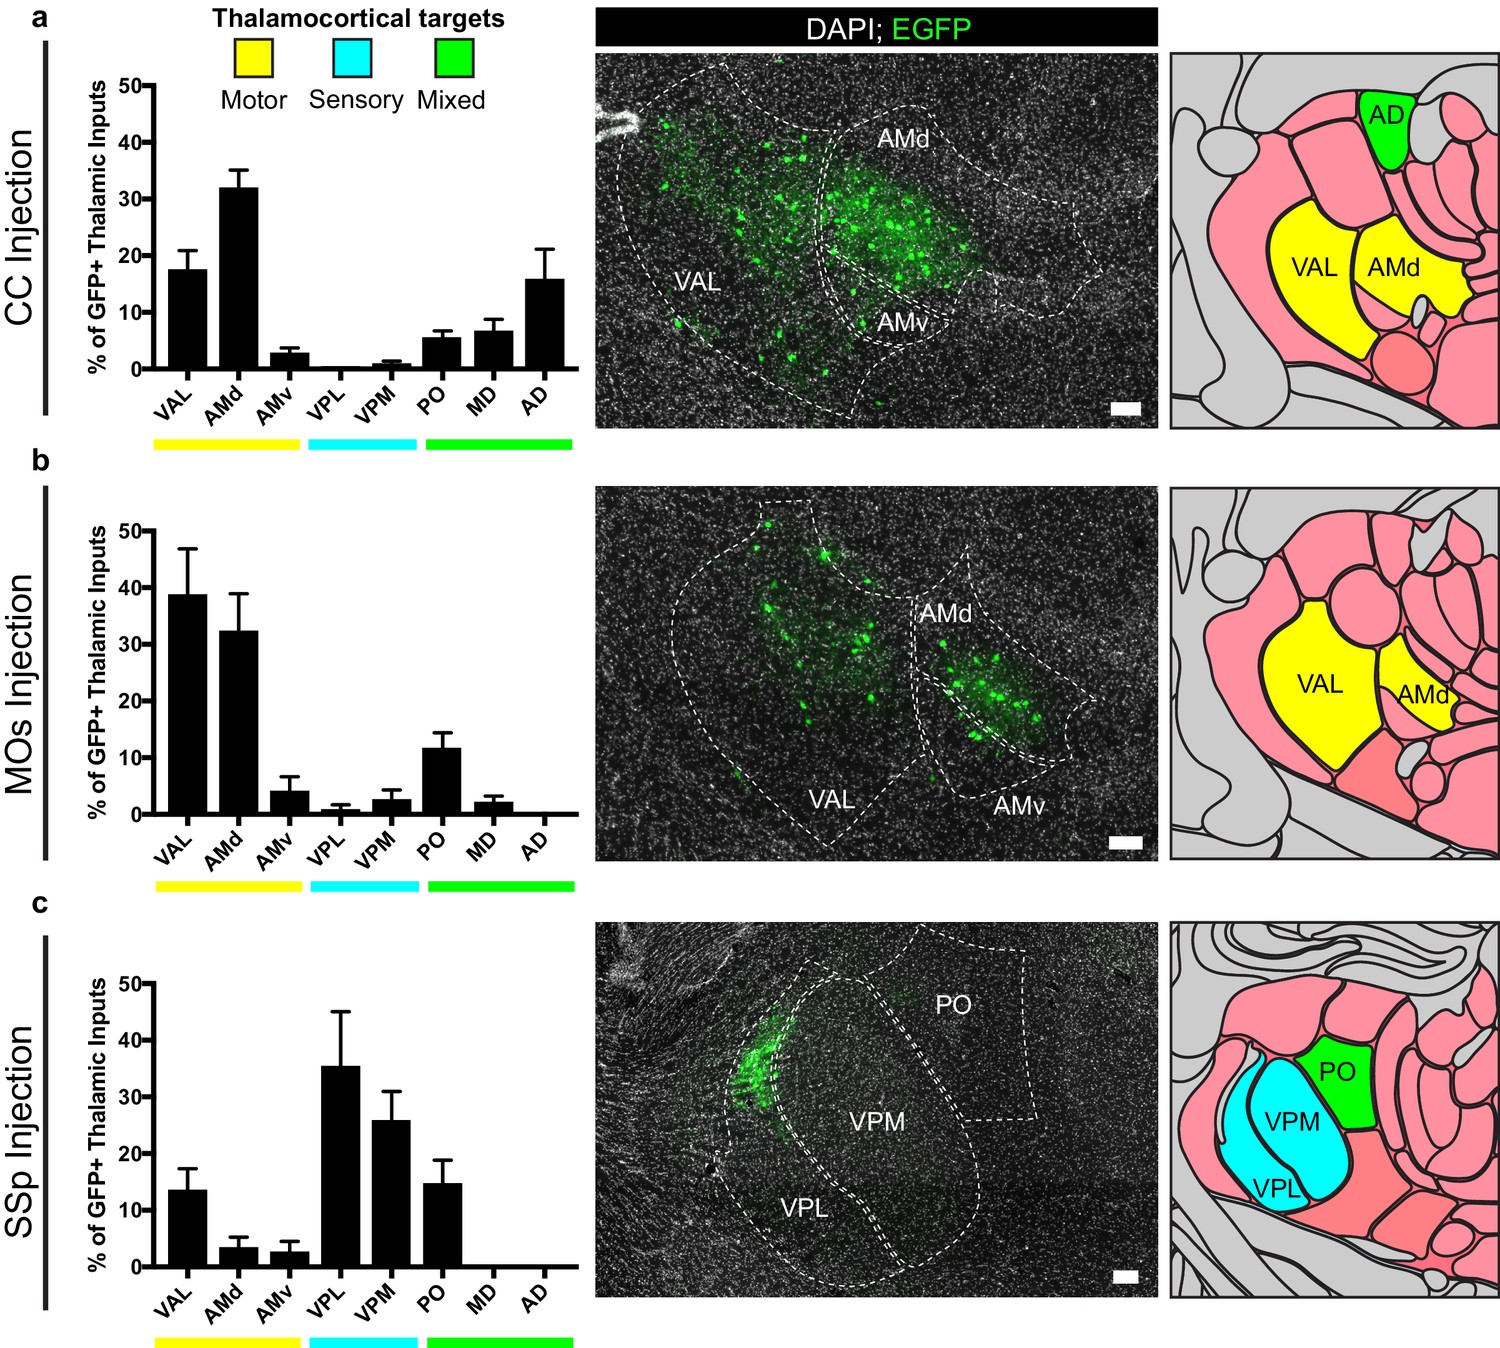
Thalamic inputs to OPCs arise from functionally-related nuclei.
Tiled immunofluorescence images of GFP+ input neurons were registered to the Allen Brain Atlas to determine the thalamic nuclei from which the inputs arise. Nuclei are color-coded here according to the primary function of their cortical projection targets – motor (yellow), sensory (blue), or mixed (green). (a) Thalamic inputs to OPCs in the CC underlying primary and secondary motor cortices arise primarily from ventral anterior-lateral (VAL) and anteriomedial (AM) nuclei. (b) Thalamic inputs to OPCs in MOs arise primarily from VAL and AM nuclei. (c) Thalamic inputs to SSp arise primarily from ventral posterolateral (VPL) and ventral posteromedial (VPM) nuclei. All bars indicate mean, error bars indicate SEM. Scale bars represent 100 microns. N = 10 mice (CC), eight mice (MOs), and six mice (SSp) respectively. Thalamic nuclei defined as presented in the Allen Brain Atlas and abbreviated as follows: VAL = ventral anterior-lateral, AMd = anteromedial dorsal part, AMv = anteromedial ventral part, VPL = ventral posterolateral, VPM = ventral posteromedial, PO = posterior complex, MD = mediodorsal, AD = anterodorsal.
Figure 6
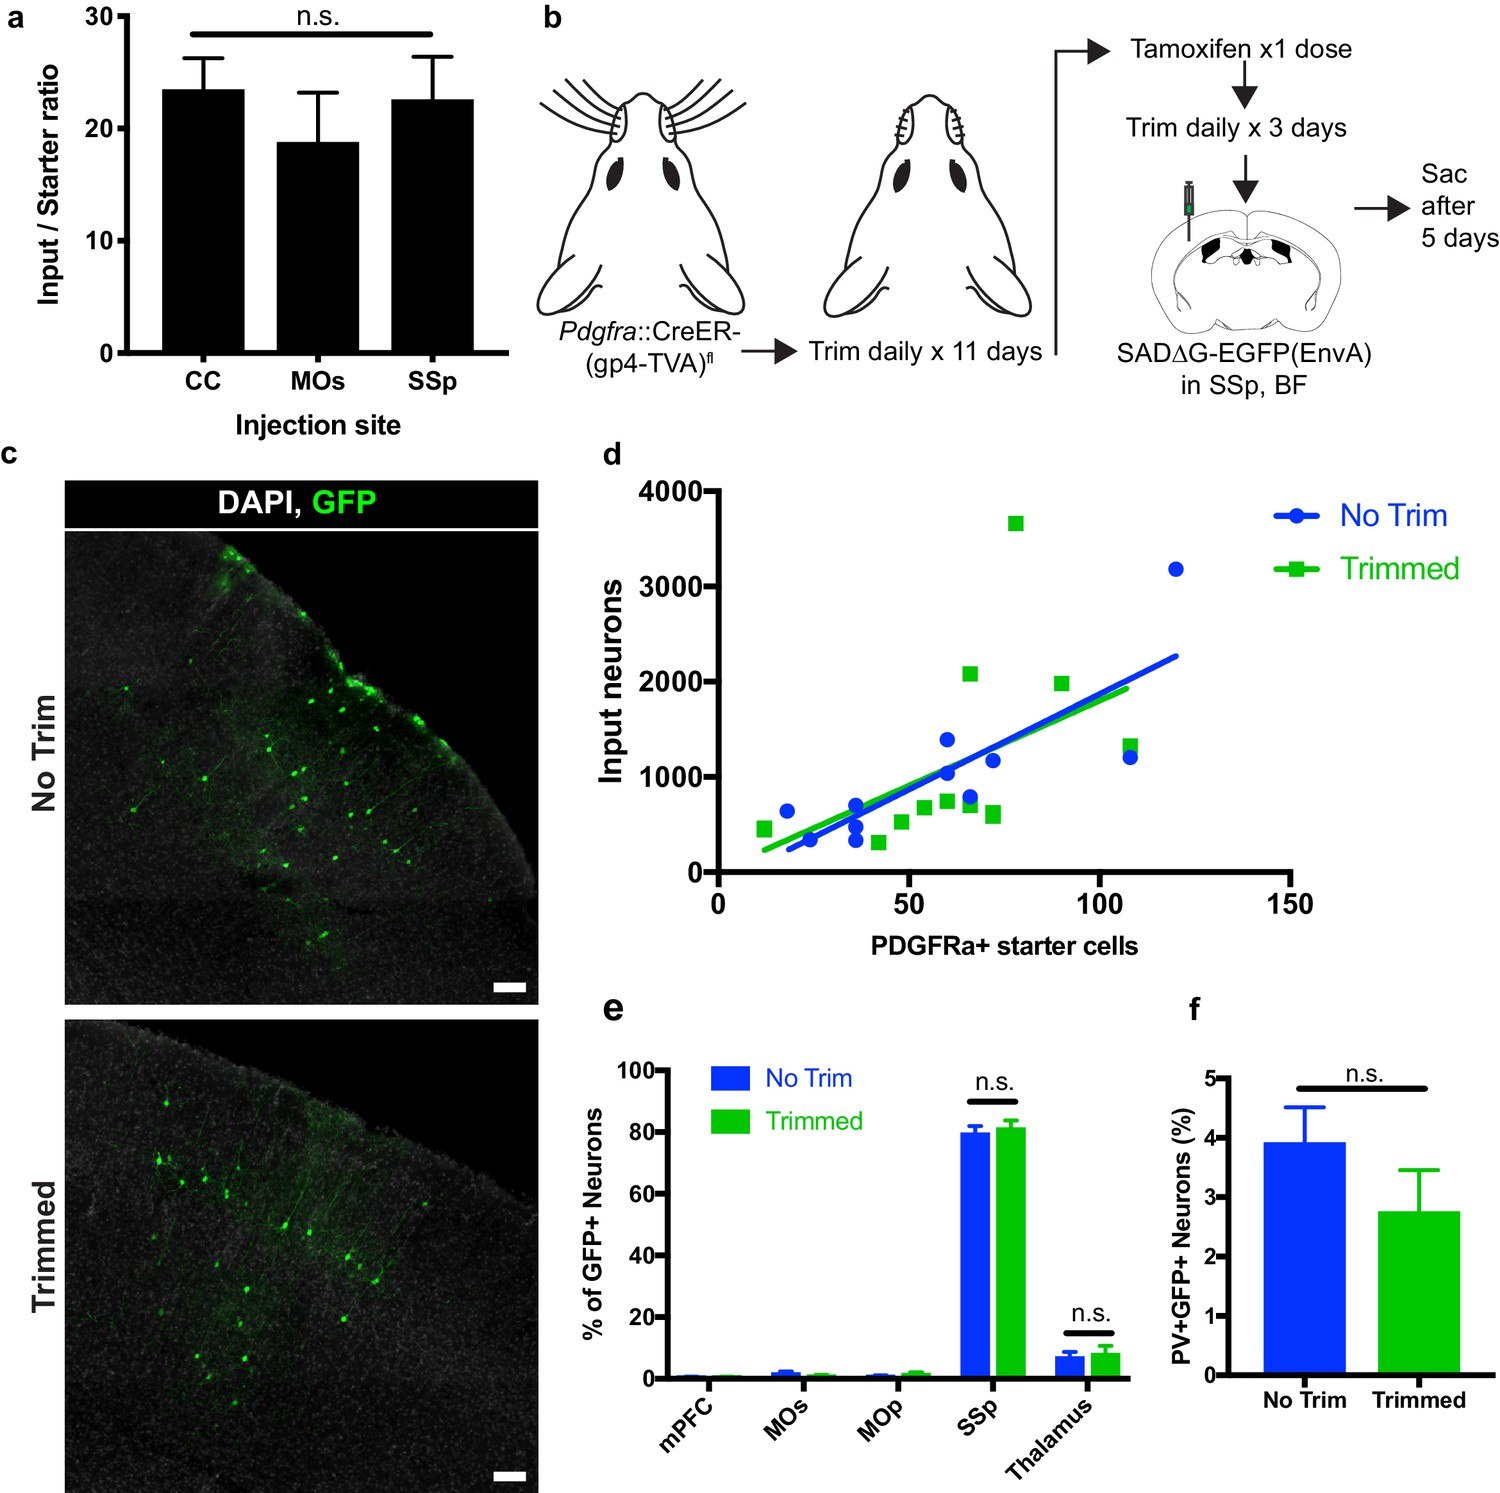
Neuronal input to OPC starter ratios are consistent across brain region and despite whisker trimming-induced afferent activity deprivation.
(a) Neuronal input to OPC starter ratios, as measured by the slope of the best-fit linear regression of GFP+ input neurons against Pdgfra+/GFP+ OPC starter cells. Bars indicate mean, error bars indicate standard error of linear regression. (b) Outline of whisker trimming deprivation expriment and subsequent viral injection into barrel field of somatosensory cortex (SSp,BF). (c) Representative images of GFP+ input neurons in SSp, BF of non-trimmed and trimmed animals, white = DAPI, green = GFP. (d) Scatter plot of GFP+ input neurons against Pdgfra+/GFP+ starter OPCs and best-fit linear regression to assess average input to starter cell ratio in whisker-trimmed (Trimmed) and control (No Trim) groups. Each point represents an independent animal, n = 13 (Trimmed), n = 11 (No Trim). (e) Distribution of GFP+ neuronal inputs to OPCs in Trimmed and No Trim groups as a percentage of total inputs. n = 13 (Trimmed), n = 11 (No Trim). (f) Proportion of total GFP+ input neurons immunostaining for parvalbumin (PV) in Trimmed and No Trim groups, n = 5 animals each. Bars indicate mean, error bars indicate SEM. Scale bars in (c) represent 100 microns. Statistical testing performed by Tukey’s multiple comparisons test, n.s. indicates p>0.05.
Tables
Key resources table
| Reagent type (species) or resource | Designation | Source or reference | Identifiers | Additional information |
|---|---|---|---|---|
| Antibody | Anti-Pdgfra (goat polyclonal) | R and D systems | AF1062 RRID:AB_2236897 | 1:500 |
| Antibody | Anti-Olig2 (rabbit monoclonal) | Abcam | EPR2673 RRID:AB_10861310 | 1:500 |
| Antibody | Anti-GFP (chicken polyclonal) | Abcam | Ab13970 RRID:AB_300798 | 1:1000 |
| Antibody | Anti-parvalbumin (rabbit polyclonal) | Abcam | Ab11427 RRID:AB_298032 | 1:250 |
| Antibody | Anti-somatostatin (rat monoclonal) | Millipore | MAB354 RRID:AB_2255365 | 1:200 |
| Antibody | Anti-VIP (rabbit polyclonal) | Immunostar | 20077 RRID:AB_572270 | 1:500 |
| Antibody | Anti-Iba1 (rabbit polyclonal) | Wako | 019–19741 RRID:AB_839504 | 1:500 |
| Antibody | Anti-Cre recombinase (mouse monoclonal) | Millipore | MAB3120 RRID:AB_2085748 | 1:1000 |
| Antibody | Anti-PSD95 (rabbit polyclonal) | Invitrogen | 51–6900 RRID:AB_2533914 | 1:100 |
| Antibody | Anti-CASPR (rabbit monoclonal) | Cell Signaling Technologies | 97736 RRID:AB_2800288 | 1:250 |
| Software | Imaris | Bitplane/Oxford Instruments | v8.1.2 RRID:SCR_007370 | |
| Software | Matlab | Mathworks | R2017b RRID:SCR_001622 | |
| Strain (Mus musculus) | B6N.Cg-Tg(Pdgfra-cre/ERT)467Dbe/J | The Jackson Laboratory | 018280 RRID:IMSR_JAX:018280 | |
| Strain (Mus musculus) | B6;129P2-Gt(ROSA)26Sortm1(CAG-RABVgp4,-TVA)Arenk/J | The Jackson Laboratory | 024708 RRID:IMSR_JAX:024708 |
Additional files
-
Source data 1
Raw data presented in the paper.
- https://doi.org/10.7554/eLife.49291.010
-
Transparent reporting form
- https://doi.org/10.7554/eLife.49291.011
Download links
A two-part list of links to download the article, or parts of the article, in various formats.
Downloads (link to download the article as PDF)
Open citations (links to open the citations from this article in various online reference manager services)
Cite this article (links to download the citations from this article in formats compatible with various reference manager tools)
Monosynaptic tracing maps brain-wide afferent oligodendrocyte precursor cell connectivity
eLife 8:e49291.
https://doi.org/10.7554/eLife.49291


