GPC1 specific CAR-T cells eradicate established solid tumor without adverse effects and synergize with anti-PD-1 Ab
- Division of Cellular Signaling, Institute for Advanced Medical Research, Keio University School of Medicine, Japan
- Laboratory of Veterinary Surgery, Graduate school of agricultural and life sciences, The University of Tokyo, Japan
- Department of Obstetrics and Gynecology, Keio University School of Medicine, Japan
- Department of Ophthalmology, Tokyo Medical University, Japan
- Center for Drug Design Research, National Institute of Biomedical Innovation, Health and Nutrition, Japan
- Center for Intractable Immune Disease, Kochi Medical School, Kochi University, Japan
- Department of immunology, School of Medicine, International University of Health and Welfare, Japan
Figures
Figure 1
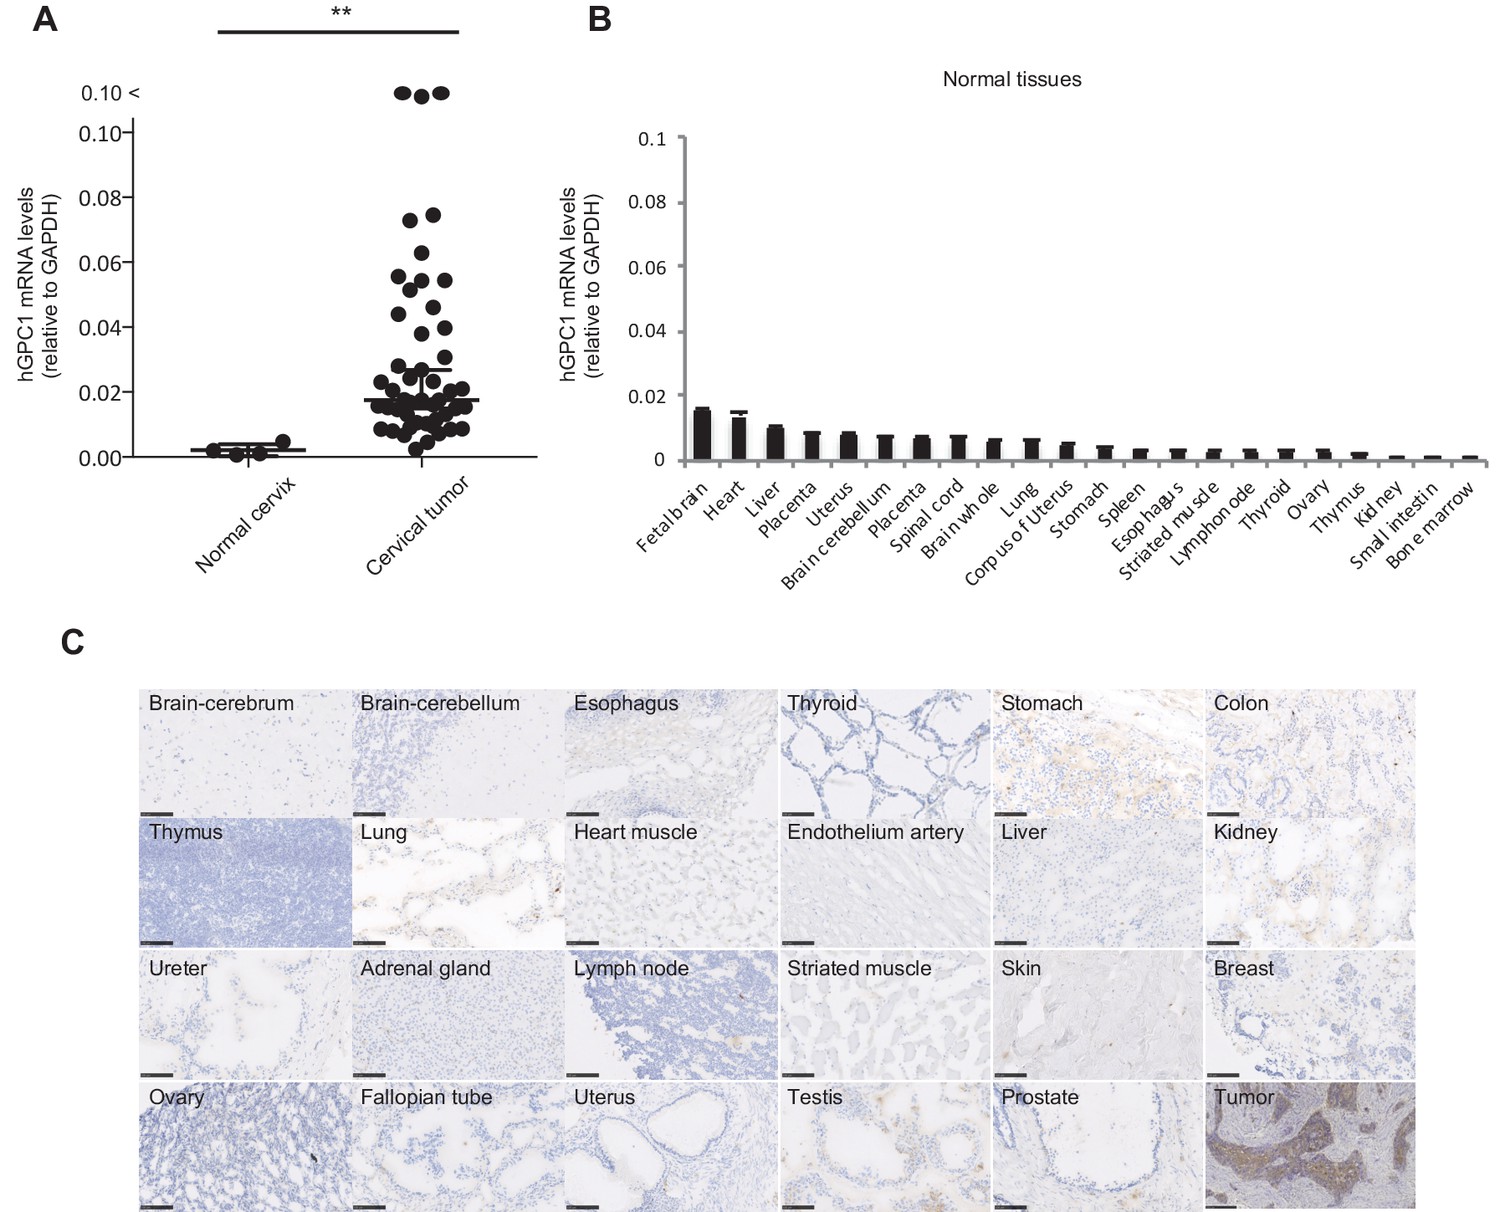
Low protein expression of GPC1 in human normal tissues detected by anti-GPC1 mAb (clone: 1–12).
(A) The mRNA expression of hGPC1 was evaluated by qPCR in human normal cervix and cervical squamous carcinoma tissues; GAPDH was used as an internal control. (B) The mRNA expression of hGPC1 was evaluated by qPCR in various human adult normal tissues and human fetal brain tissue; GAPDH was used as an internal control. (C) IHC staining by anti-GPC1 mAb (clone: 1–12) in human adult normal tissues and human esophageal SCC tissues. Scale bar, 100 μm.
Figure 2 with 1 supplement

GPC1-specific human hCAR-T cells specifically recognized hGPC1-positive tumor cells and inhibited tumor growth in xenograft mouse model.
(A) Diagrams of GPC1-specific human hCAR; scFv frgments derived from light chain (VL) and heavy chain (VH) of anti-GPC1 mAb (clone: 1–12) were fused to human CD28 and human CD3ζ signal domains. The positions of VL and VH were switched to generate two forms of CAR gene, LH and HL. (B) LK2-hGPC1, LK2-mock, and endogenous hGPC1-expressing TE14 were stained by anti-GPC1 mAb (clone: 1–12) (shaded histogram) or isotype control (open histogram). (C) GPC1-specific IFNγ secretion of hCAR-T cells (LH or HL form) or hCont-T cells co-cultured with LK2-mock, LK2-hGPC1, or TE14. (D) Antigen-specific in vitro cytotoxicity of hCAR-T cells (LH or HL form) or hCont-T cells against LK2-hGPC1, LK2-mock, or TE14 was evaluated by using standard Cr51 releasing assay. (E) hCAR-T cells (LH or HL form) or hCont-T cells (2 × 10⁷ cells/mouse) were injected into TE14-bearing NOG mice on day 9. Results are representative of two or three experiments. Error bars indicate SD.
Figure 2—figure supplement 1
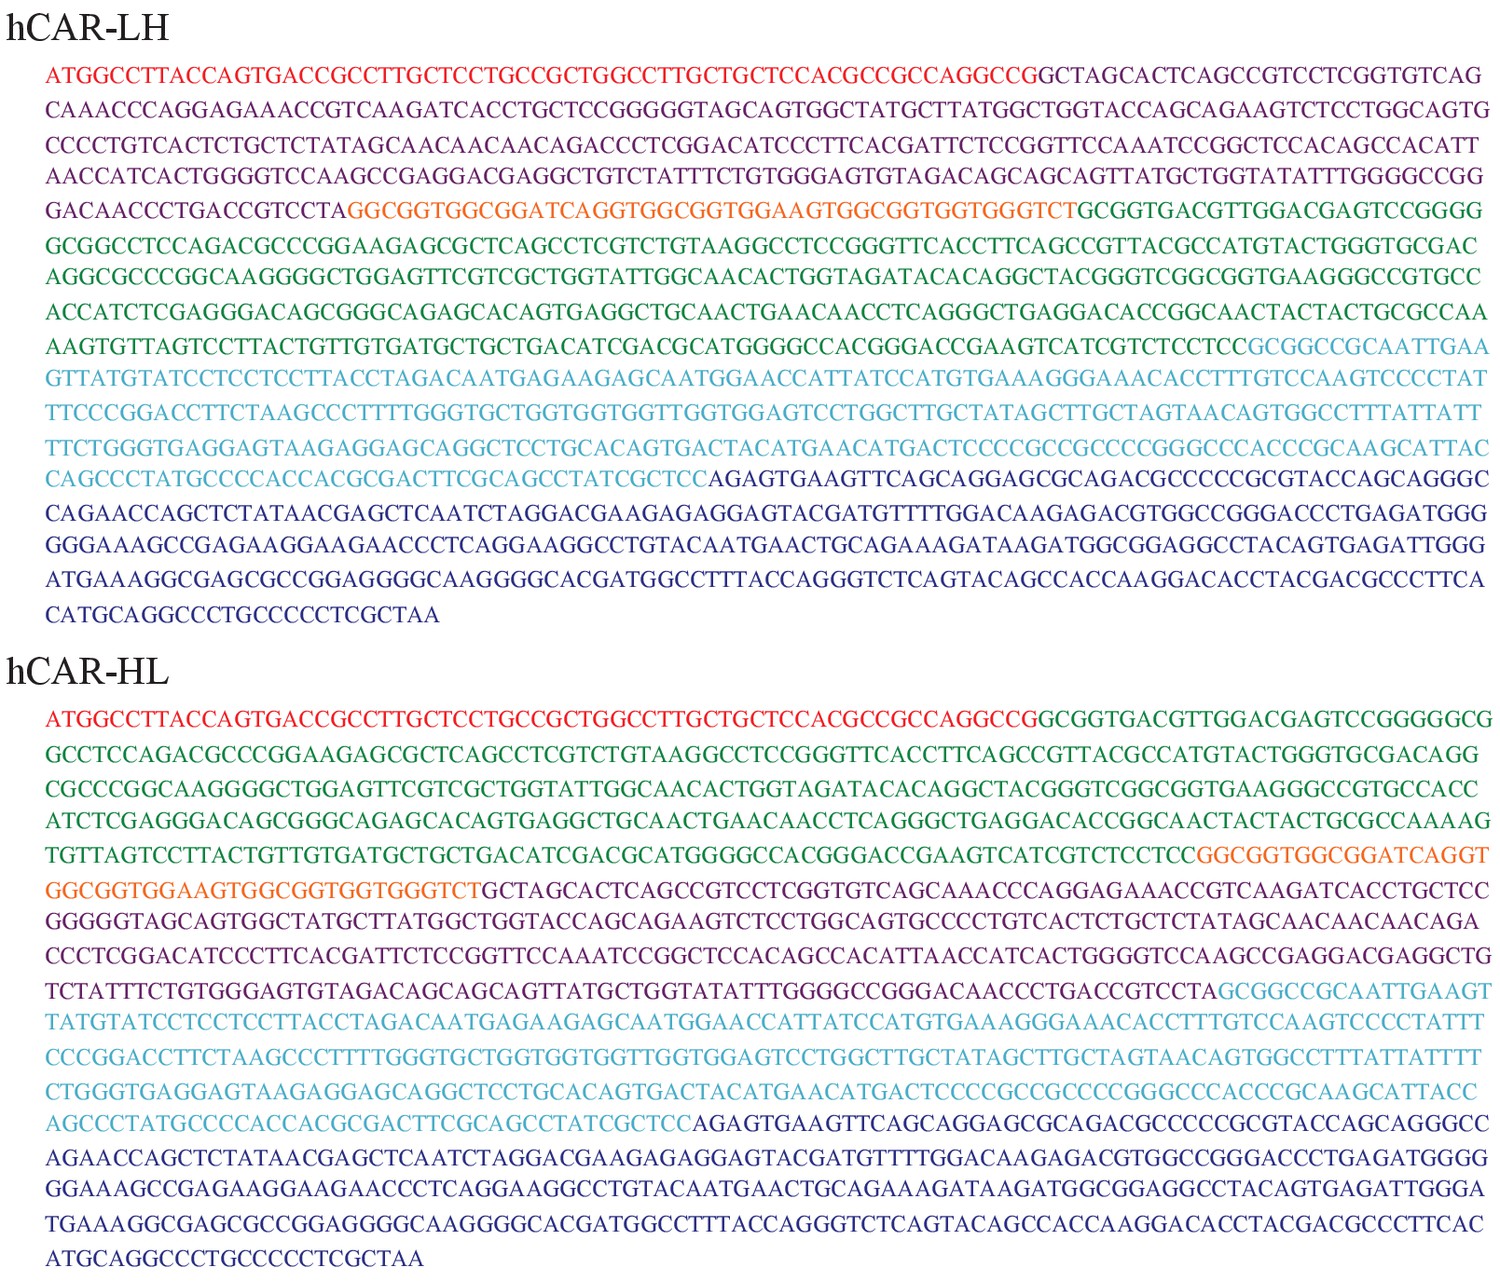
The sequences of GPC1-specific human CAR vectors.
The sequences of the hCAR vectors (LH and HL forms) are shown. The hCAR vectors are comprised of the human CD8a leader sequence (red), scFv of the anti-GPC1 mAb (linker; orange and VL; purple or VH; green), human CD28 extracellular/transmembrane/intracellular domains (light blue), and human CD3ζ intracellular domain (dark blue).
-
Figure 2—figure supplement 1—source data 1
The sequences of GPC1-specific human CAR vectors.
- https://cdn.elifesciences.org/articles/49392/elife-49392-fig2-figsupp1-data1-v1.docx
Figure 3
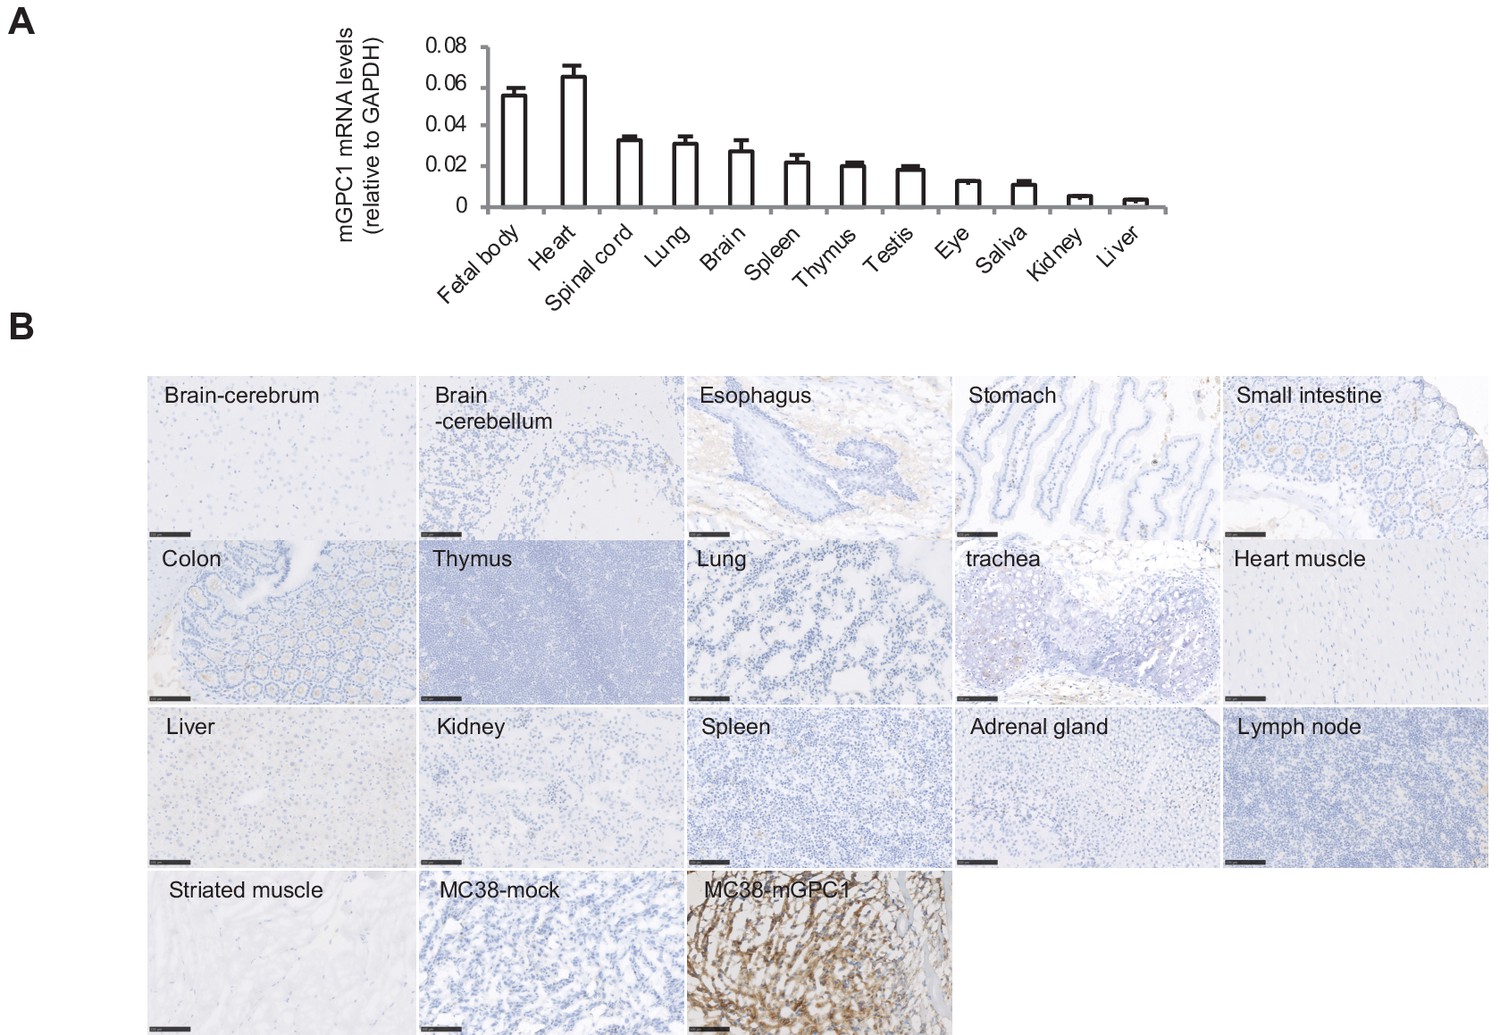
Low protein expression of GPC1 in murine normal tissues detected by anti-GPC1 mAb (clone: 1–12).
(A) Expression of mGPC1 mRNA in various mouse normal tissues and GPC1-positive fetal bodies was quantified by qPCR; GAPDH was used as an internal control. (B) The mouse normal tissues and GPC1-positive MC38-mGPC1 tissues were IHC stained by anti-GPC1 mAb (clone: 1–12) in. Scale bar, 100 μm.
Figure 4 with 1 supplement

GPC1-specific murine mCAR-T cells specifically recognized mGPC1-positive tumor cells and eradicated solid tumors in vivo.
(A) Diagram of GPC1-specific murine CAR; scFv fragment (HL) derived from anti-GPC1 mAb (clone: 1–12) was fused to mouse CD28 and CD3ζ signal domains. (B) The mGPC1-overexpressing murine cells (MC38-mGPC1 and MCA205-mGPC1), endogenous hGPC1-expressing human cells (TE14), and hGPC1-overexpressing human cells (LK2-hGPC1), hGPC1-negative cells (LK2-mock) were stained with anti-GPC1 mAb (shaded histogram) or isotype control (open histogram). (C) Antigen-specific IFNγ secretion of mCAR-T cells or mCont-T cells co-cultured with MC38-mGPC1 or MC38-mock was evaluated. (D) Antigen-specific cytotoxicity of mCAR-T cells or mCont-T cells against MC38-mGPC1 and MC38-mock was evaluated by using standard Cr51 releasing assay. (E and F) Mice bearing MC38-mGPC1 tumor (E) or MCA205-mGPC1 tumor (F) received 2 × 10⁶ cells of mCAR-T cells or mCont-T cells on day 3. Mean tumor volumes (mm3 ± SD) of each group (left panels) and tumor-growth curves of the individual mice in each group (right panels) are shown. (G) Mice bearing MCA205-mGPC1 large tumor (tumor volume is >100 mm3) received 3.5 × 10⁷ cells of mCAR-T cells or mCont-T cells on day 7. Mean tumor volumes (mm3 ± SD) of each group (left panels) and tumor-growth curves of the individual mice in each group (right panels) are shown. (H) Percentages of GFP-positive CD8+ mCAR-T cells in total CD8+ T cells from peripheral blood and tumor tissues on day 15 are shown. Dots indicate mice in each group. (I) Splenocytes (left panel) or CD8+ TIL (right panel) were collected from the mice treated with mCAR-T cells or mCont-T cells on day 15, and co-cultured with LK2-hGPC1 or LK2-mock. After 24 hr, IFNγ in the supernatants was measured by ELISA. (J) CD8+ TIL collected from the mice treated with mCAR-T cells or mCont-T cells were re-stimulated with irradiated normal splenocytes pulsed with gp70 peptides. After 48 hr, the re-stimulated TIL were collected and co-cultured with murine tumor cells pulsed with gp70 or control peptide (βgal) for 24 hr and IFNγ in the supernatants was measured by ELISA. Results are representative of two or three experiments. Error bars indicate SD. (K) 120 days after the mCAR-T cell administration, mGPC1-negative parental MCA205 was inoculated in the naive mice with no history of bearing tumors or the mice which had rejected MCA205-mGPC1 by mCAR-T cells injection. Tumor-growth curves of the individual mice in each group are shown.
Figure 4—figure supplement 1
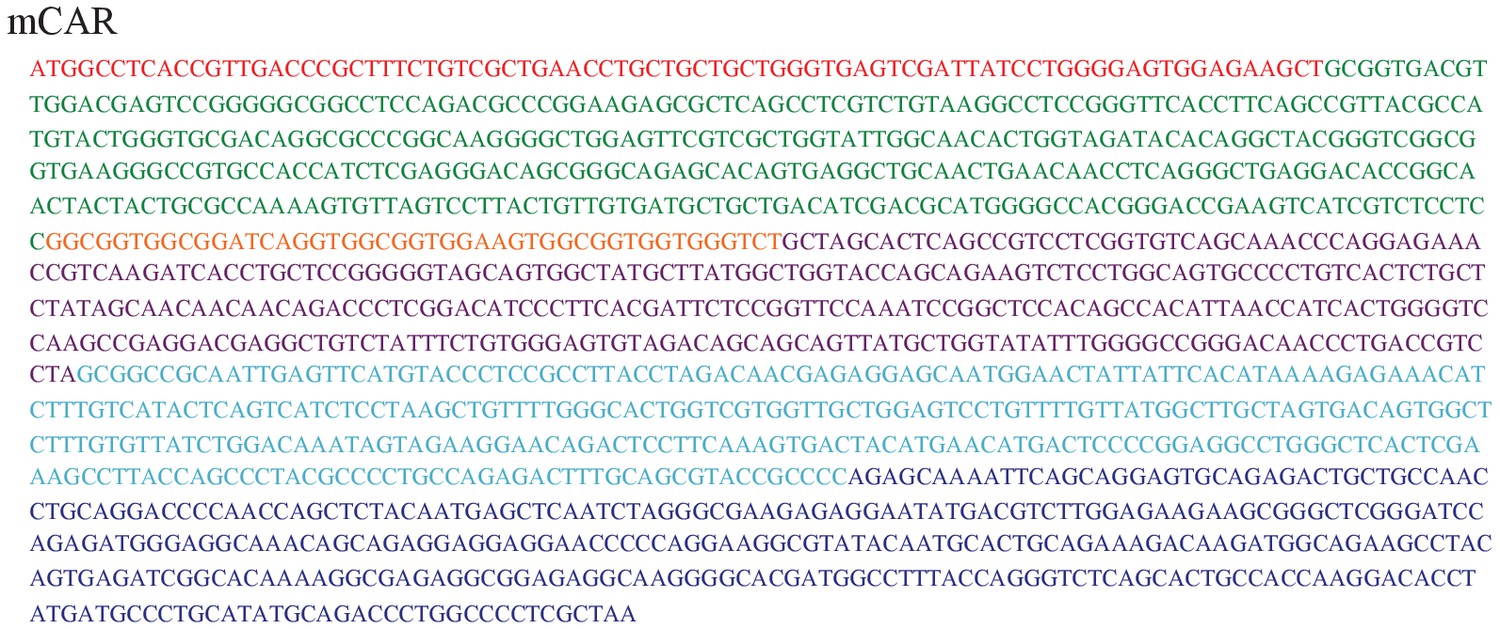
The sequences of GPC1-specific murine CAR vectors.
The sequences of the mCAR vector are shown. The mCAR vectors are comprised of the mouse CD8a leader sequence (red), scFv of the anti-GPC1 mAb (VH; green, linker; orange, and VL; purple), mouse CD28 extracellular/transmembrane/intracellular domains (light blue), and mouse CD3ζ intracellular domain (dark blue).
-
Figure 4—figure supplement 1—source data 1
The sequences of GPC1-specific murine CAR vectors.
- https://cdn.elifesciences.org/articles/49392/elife-49392-fig4-figsupp1-data1-v1.docx
Figure 5 with 2 supplements
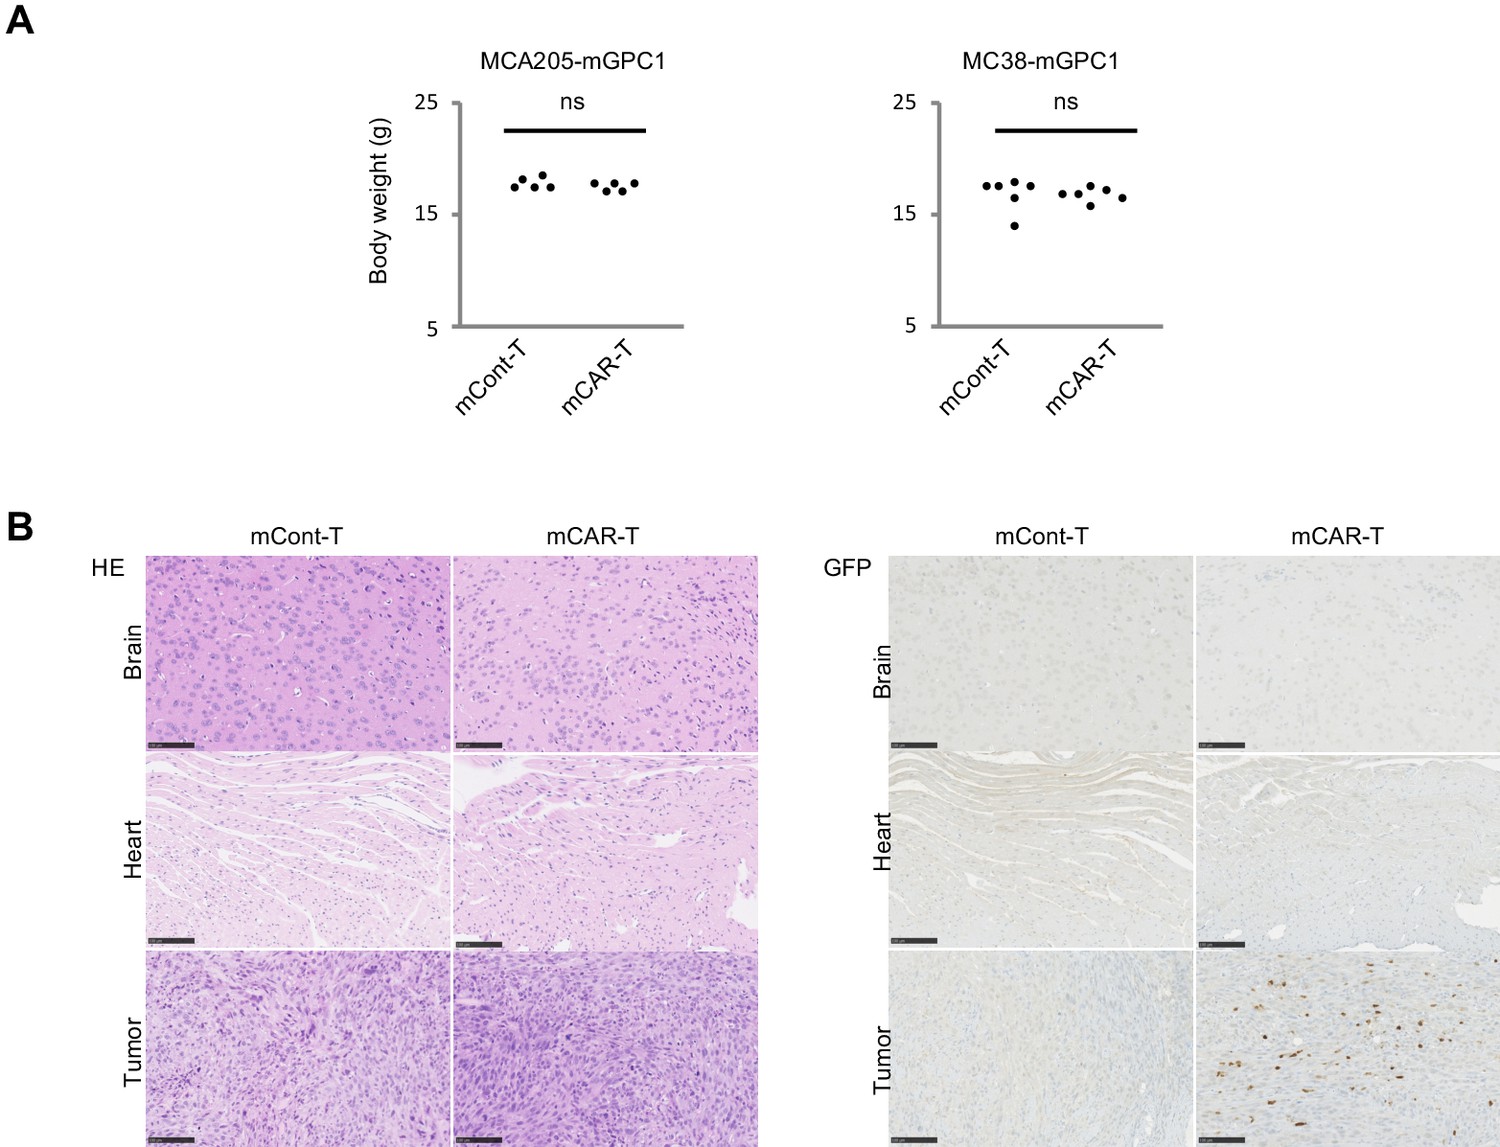
GPC1-specific mCAR-T cells showed no obvious adverse effects on normal tissues in vivo.
(A) Body weight of mCAR-T cells or mCont-T cells injected mice bearing MC38-mGPC1 (right panel) or MCA205-GPC1 (left panel) was measured 12 days after mCAR-T cell or mCont-T cell administration. (B) Representative staining of HE (left panel) and IHC for injected GFP+ T cells detected by anti-GFP Ab (right panel) in mouse normal tissues are shown. The data of other normal tissues are shown in Figure 5-figure supplements 1 and 2.
Figure 5—figure supplement 1
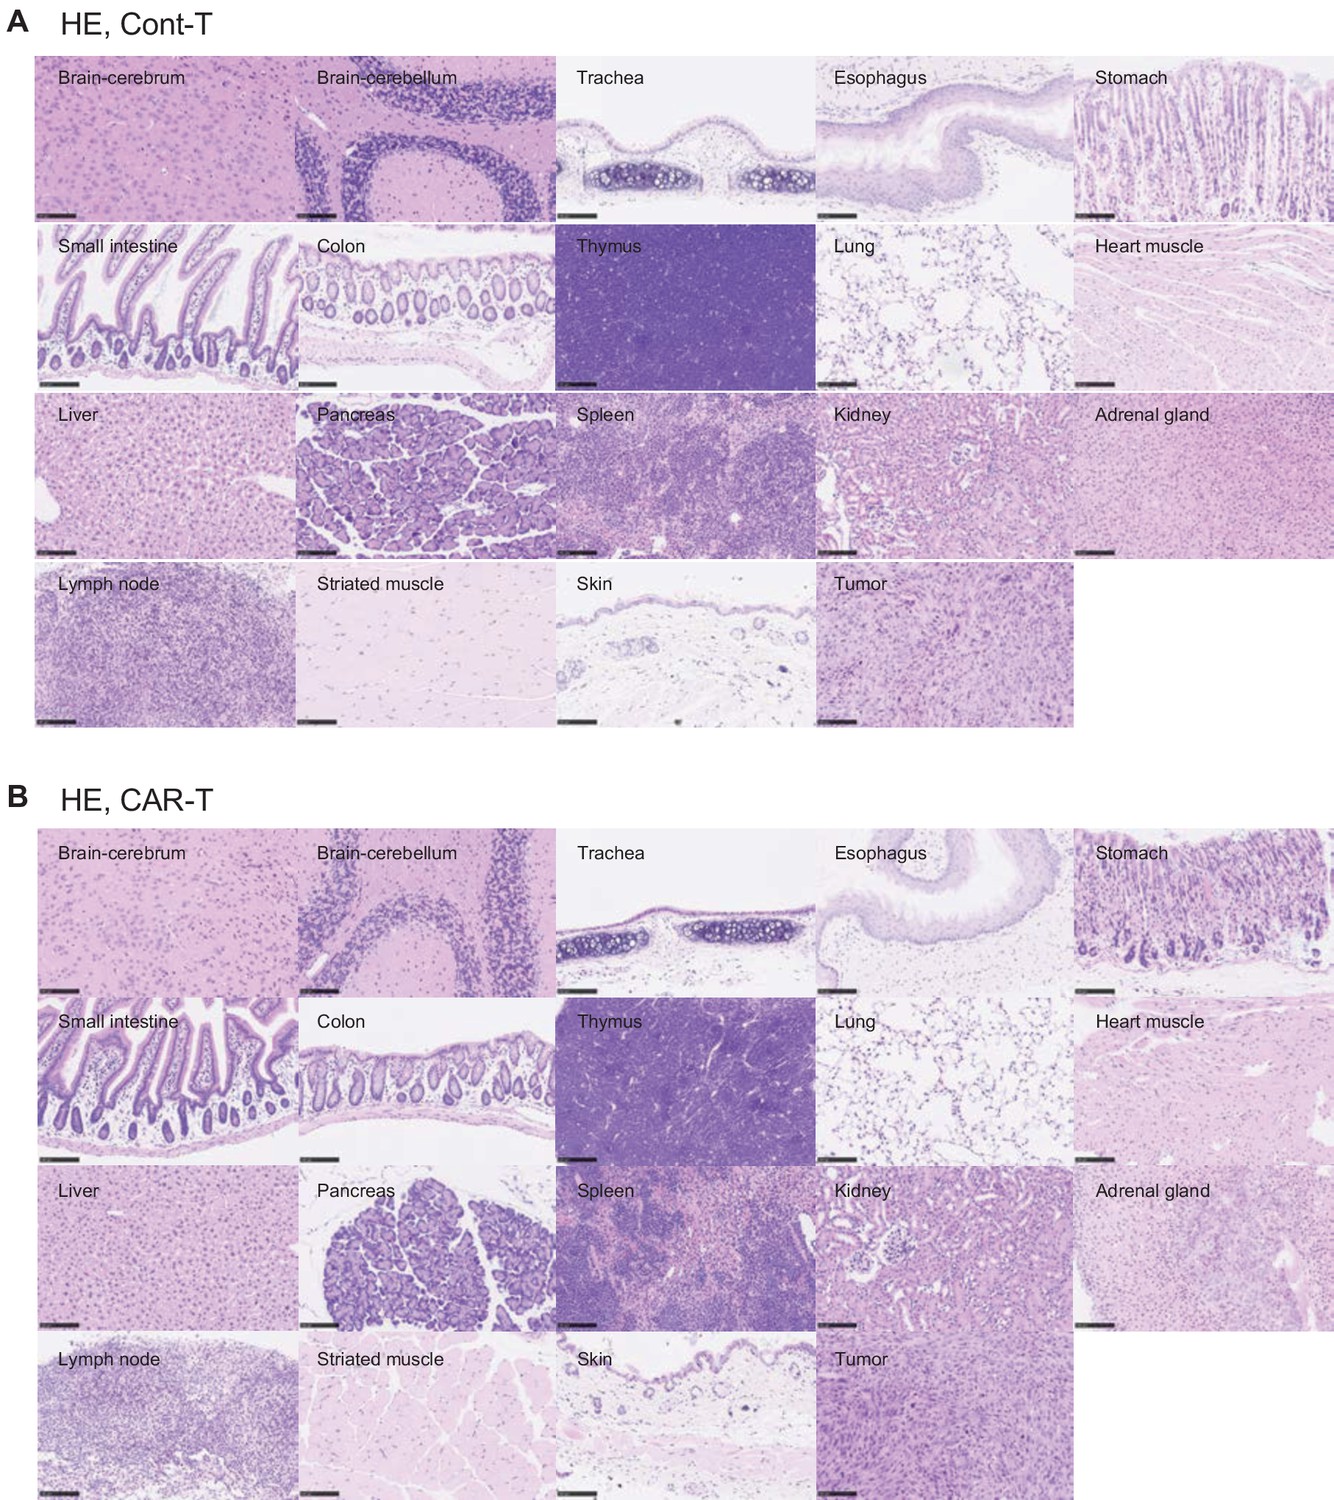
Tissues damages were not detected in mouse normal tissues.
HE staining was performed on normal tissues from MC38-mGPC1-bearing mouse treated with mCont-T cells (A) or mCAR-T cells (B). Scale bar, 100 μm.
Figure 5—figure supplement 2
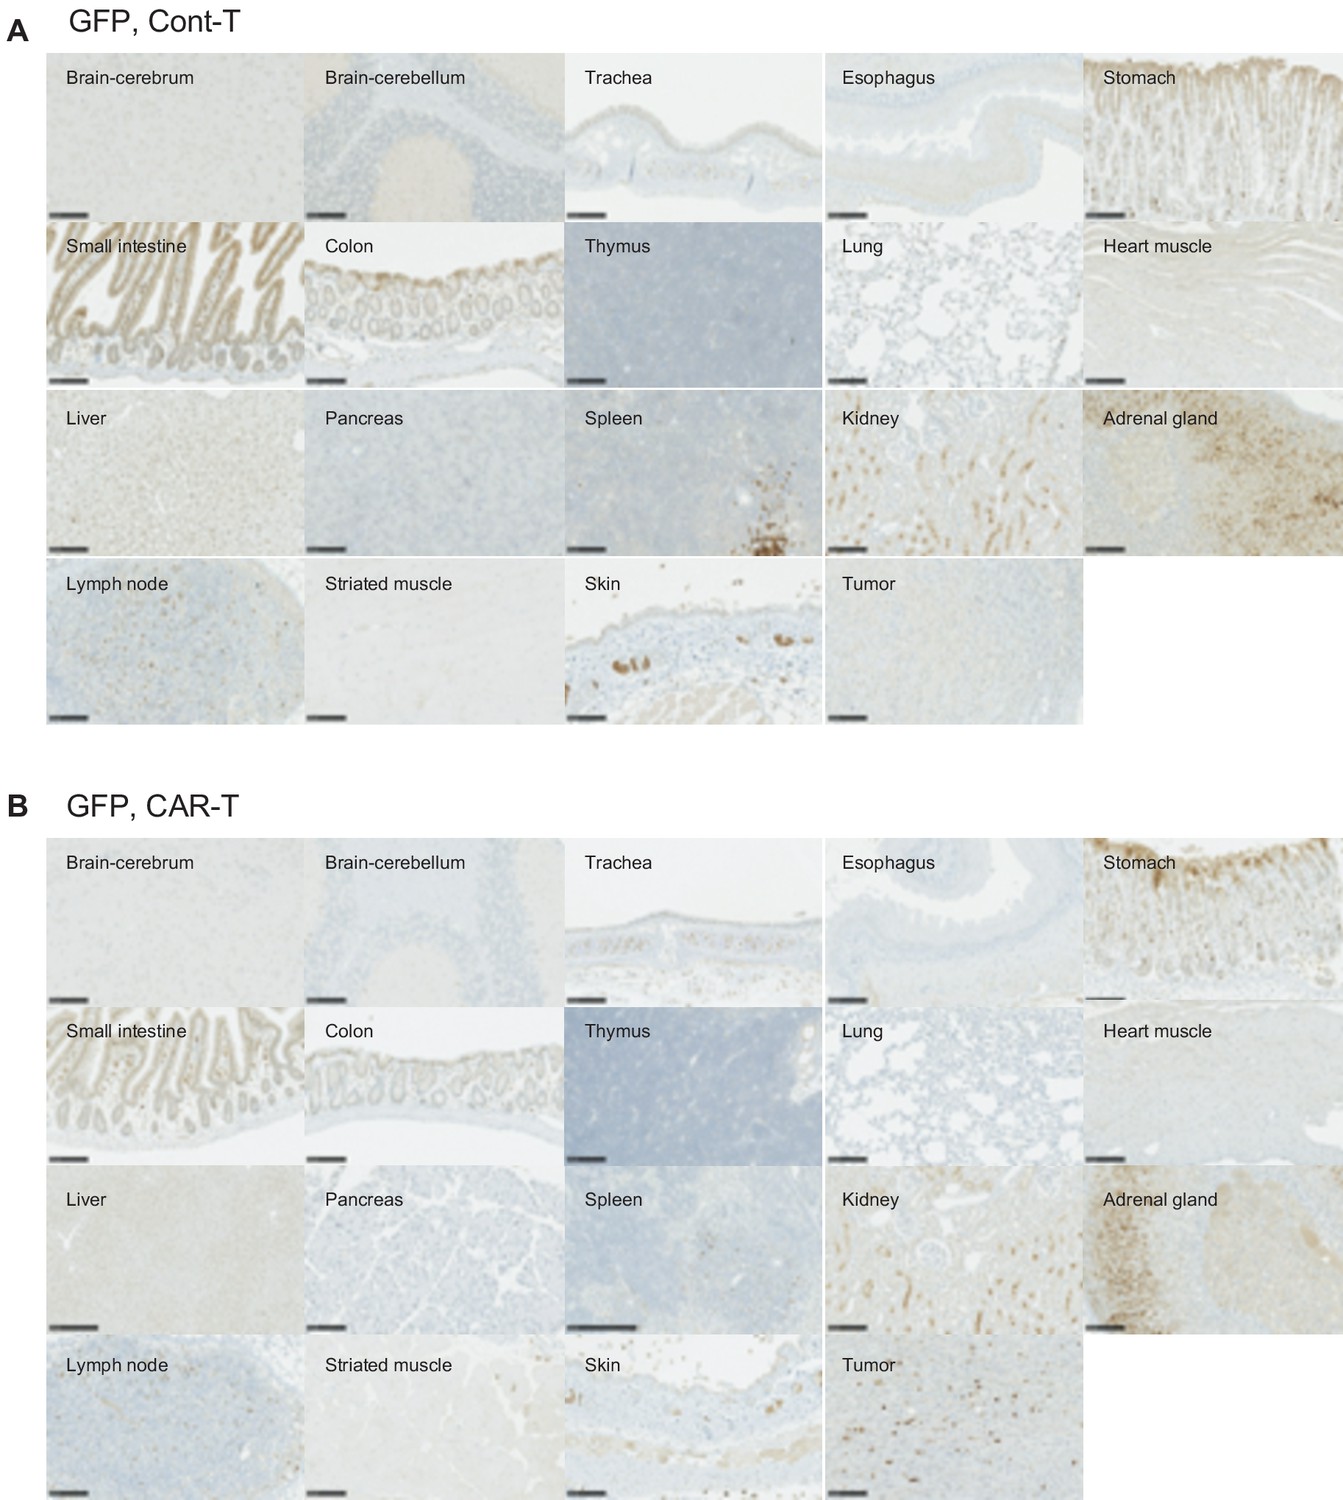
Only few GFP-positive mCAR-T cells infiltrated mouse normal tissues.
IHC staining of GFP was performed on normal tissues from the MC38-mGPC1-bearing mouse treated with mCont-T cells (A) or mCAR-T cells (B). Scale bar, 100 μm.
Figure 6
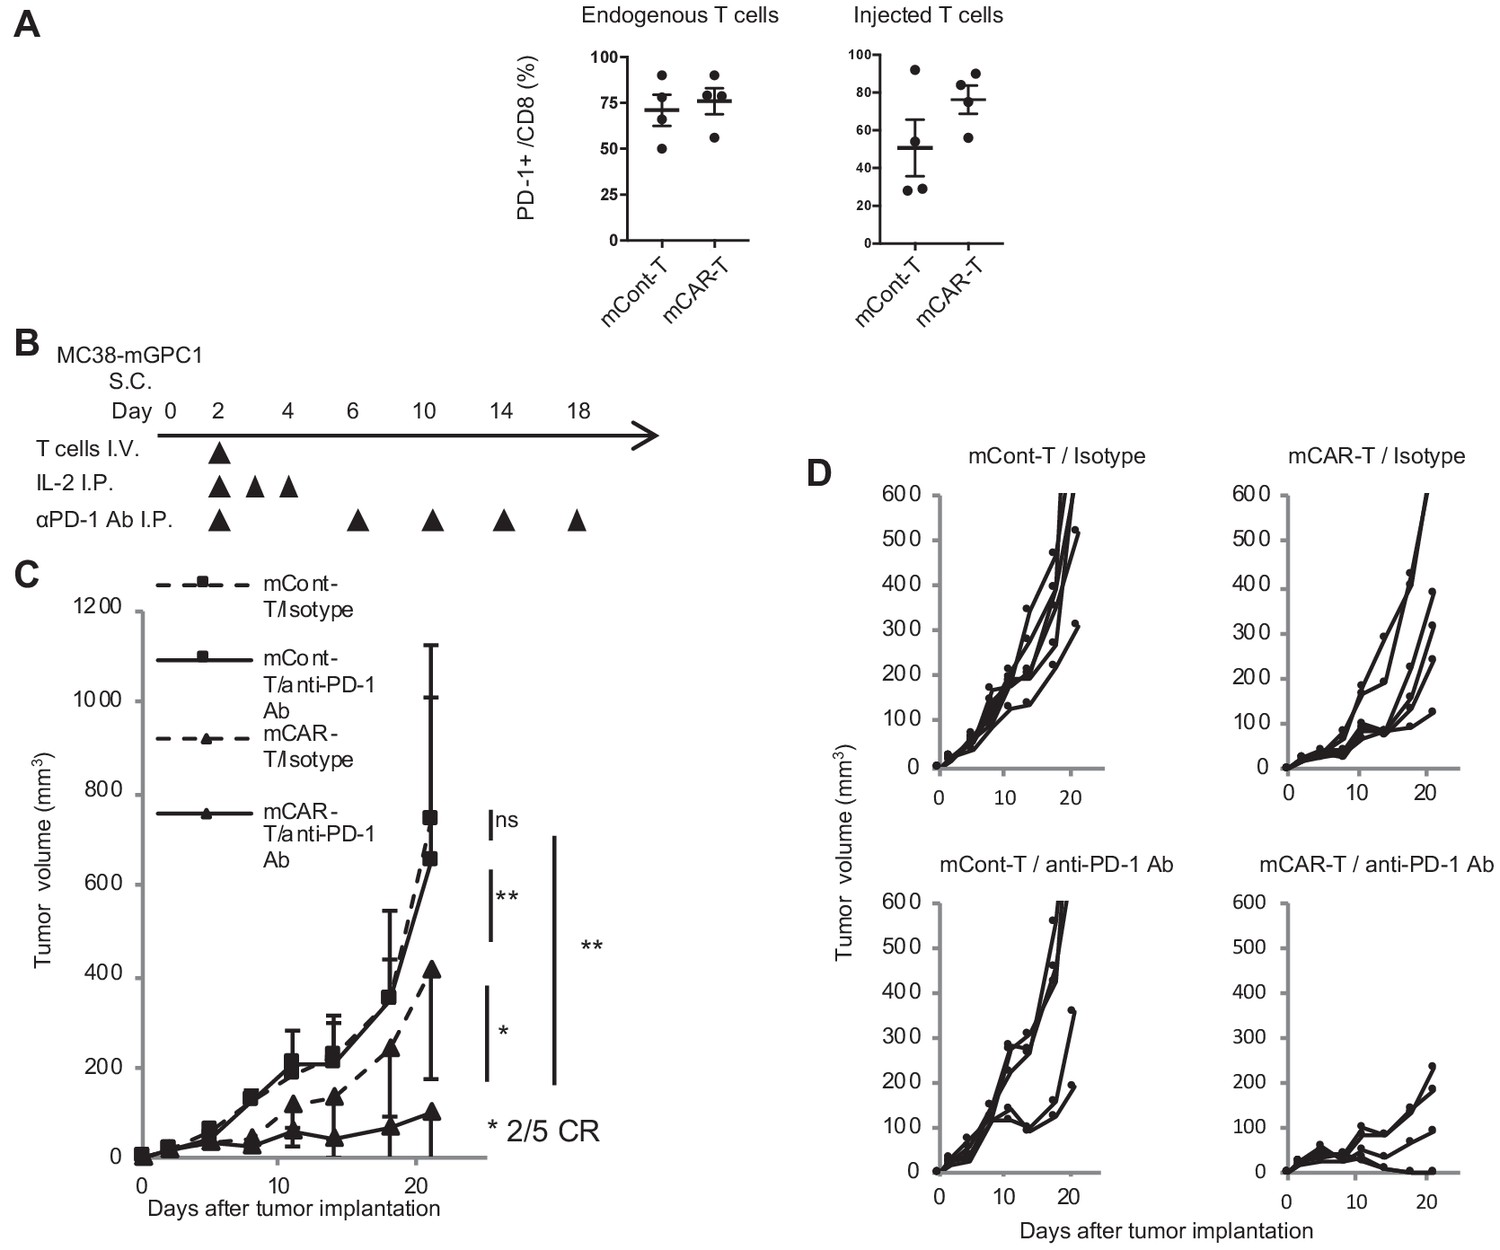
GPC1-specific mCAR-T cells synergized with anti-PD-1 Ab.
(A) Percentages of PD-1-expressing cells among endogenous CD8+ T cells (left panel) and injected CD8+ T cells (right panel) harvested from the tumor tissues of MC38-mGPC1 mouse model 12 days after mCAR-T cell or mCont-T cell administration. Dots indicate individual mice of each group. (B) The protocol of combination therapy is shown. Mice bearing MC38-mGPC1 were treated with 2 × 10⁶ cells of mCAR-T cells or mCont-T cells on day 2 and anti-PD-1 Ab (200 mg/mouse) or isotype Ab were intraperitonealy injected on days 2, 6, 10, 14, and 18. (C) Mean tumor volume (mm3 ± SD) of each group is shown. (D) Tumor-growth curves of the individual mice in each group are shown. Results are representative of two or three experiments. Error bars indicate SD.
Tables
Key resources table
| Reagent type (species) or resource | Designation | Source or reference | Identifiers | Additional information |
|---|---|---|---|---|
| Strain, strain background (M. musculus) | NOG (NOD/Shi-PrkdcscidIl2rγtm1Sug/Jic) mouse | Central Institute for Experimental Animals | Female and Male, 6–10 week-old | |
| Strain, strain background (M. musculus) | C57BL/6 mouse | CLEA Japan, Inc | Female, 6–8 week-old | |
| Cell line (Homo-sapiens) | G3Thi | Takara Bio Inc | TKR-6163 | Human kidney cell line derived packaging cell line |
| Cell line (Homo-sapiens) | TE14 | RIKEN BioResource Center | Human esophageal squamous cancer cell lines | |
| Cell line (Homo-sapiens) | LK2-hGPC1 | Previous paper (Harada et al., 2017), see Materials and methods | Human lung squamous cancer cell lines expressing hGPC1 | |
| Cell line (Homo-sapiens) | LK2-mock | Previous paper (Harada et al., 2017), see Materials and methods | Human lung squamous cancer cell lines expressing empty vector | |
| Cell line (M. musculus) | PG13 | Takara Bio Inc | Murine leukemia cell line | |
| Cell line (M. musculus) | EL4 | National Cancer Institute, National Institutes of Health (MD, USA) | Mouse T cell lymphoma cell line | |
| Cell line (M. musculus) | MCA205 | National Cancer Institute, National Institutes of Health (MD, USA) | Mouse sarcoma cell line | |
| Cell line (M. musculus) | MCA205-mGPC1 | This paper, see Materials and methods | Mouse sarcoma cell line expressing mGPC1 | |
| Cell line (M. musculus) | MC38-mGPC1 | This paper, see Materials and methods | Mouse colon adenocarcinoma cell line expressing mGPC1 | |
| Transfected construct (Gallus gallus domesticus, Homo-sapiens) | hCAR-LH | This paper, see Materials and methods and Figure 2—figure supplement 1 | ||
| Transfected construct (Gallus gallus domesticus, Homo-sapiens s) | hCAR-HL | This paper, see Materials and methods and Figure 2—figure supplement 1 | ||
| Transfected construct (Gallus gallus domesticus, M. musculus) | mCAR | This paper, see Materials and methods and Figure 4—figure supplement 1 | ||
| Antibody | OKT-3 (anti-human CD3 mAb) | Thermo Fischer Scientific | Cat # 16-0037-81, RRID:AB_2619696 | T cell activation, 50 ng/ml |
| Antibody | Anti-mouse PD-1 Ab (clone: J43) | Bio X Cell | BE-0033–2, RRID:AB_1107747 | In vivo injection, 200 mg/mouse |
| Antibody | Anti-human IFNγ Ab (M700A) | Thermo Fisher Scientific | Cat # M700A, RRID:AB_223578 | For ELISA |
| Antibody | Anti-human IFNγ Ab (M700B) | Thermo Fisher Scientific | Cat # M700B | For ELISA |
| Antibody | anti-GPC1 Ab (clone: 1–12) | previous paper (Harada et al., 2017) | IHC-F(0.5 μg/ml) | |
| Antibody | anti-GFP mAb (clone: 1E4) | Medical and Biological Laboratories | Code # M-048–3, RRID:AB_591823 | IHC-P(0.5 μg/ml) |
| Antibody | APC-donkey-anti-IgY Ab | Jackson immuno Research Inc | Code # 703-136-155, RRID:AB_2340360 | FACS (1:50) |
| Antibody | PE-donkey-anti-IgY Ab | Jackson immuno Research Inc | Code # 703-116-155, RRID:AB_2340358 | FACS (1:50) |
| Antibody | V500- anti-mCD45 mAb | BD Biosciences | Cat # 561487, RRID:AB_10697046 | FACS (1:50) |
| Antibody | BV421-anti-mCD3 mAb | Biolegend | Cat # 562600, RRID:AB_11153670 | FACS (1:50) |
| Antibody | Alexa Fluor 700-anti-mCD8 mAb | BD Biosciences | Cat # 557959, RRID:AB_396959 | FACS (1:50) |
| Sequence-based reagent | human GPC-1 (Hs00892476_m1) | Applied Biosystems | Cat # 4331182 | |
| Sequence-based reagent | mouse GPC-1 (Mm00497305_m1) | Applied Biosystems | Cat # 4331182 | |
| Peptide, recombinant protein | Human GPC1 | Biolegend | Cat # 757206 | |
| Peptide, recombinant protein | Mouse GPC1 | Biolegend | Cat # 757306 | |
| Peptide, recombinant protein | MuLV gp70 p15E | Medical and Biological Laboratories | Code # TS-M507-P | KSPWFTTL |
| Peptide, recombinant protein | H-2Kb-restricted b-galactosidase | Medical and Biological Laboratories | Code # TS-M501-P | DAPIYTNV |
| Commercial assay or kit | Series S Sensor Chip CM5 | GE Healthcare Life Sciences | Cat # BR-1005–30 | |
| Commercial assay or kit | Mouse Antibody Capture Kit | GE Healthcare Life Sciences | Cat # BR1008-38 | |
| Commercial assay or kit | Mouse IFNγ ELISA set | BD Biosciences | Cat # 555138 | |
| Software, algorithm | Kaluza 1.2 | BECKMAN COULTER | ||
| Software, algorithm | GraphPad Prism 7.0 | GraphPad software | ||
| Other | FDA Standard Frozen Tissue Array-Human Adult Normal | BioChain Institute Inc | Cat # T6234701-1 | |
| Other | human normal cervix tissues and cervical carcinoma tissues | This paper, see Materials and methods | ||
| Other | Cr51 | Japan Radioisotope Association |
Author response table 1
Anti-GPC1 scFv HL form.
| Ka (1/Ms) | Kd (1/s) | KD (M) | |
|---|---|---|---|
| hGPC1 | 1.40E+05 | 0.0017 | 1.22E-08 |
| mGPC1 | 2.73E+04 | 0.002963 | 1.09E-07 |
Author response table 2
Anti-GPC1 scFv LH form.
| Ka (1/Ms) | Kd (1/s) | KD (M) | |
|---|---|---|---|
| hGPC1 | 1.45E+05 | 0.00131 | 9.06E-09 |
| mGPC1 | 4.21E+04 | 0.002179 | 5.18E-08 |
Additional files
Download links
A two-part list of links to download the article, or parts of the article, in various formats.
Downloads (link to download the article as PDF)
Open citations (links to open the citations from this article in various online reference manager services)
Cite this article (links to download the citations from this article in formats compatible with various reference manager tools)
GPC1 specific CAR-T cells eradicate established solid tumor without adverse effects and synergize with anti-PD-1 Ab
eLife 9:e49392.
https://doi.org/10.7554/eLife.49392


