Apolipoprotein M-bound sphingosine-1-phosphate regulates blood–brain barrier paracellular permeability and transcytosis
- University of Copenhagen, Denmark
- Lund University, Sweden
- Rigshospitalet, Denmark
- Copenhagen University, Denmark
- Rigshospitalet-Glostrup, Denmark
Figures
Figure 1 with 1 supplement

Two-photon imaging of paracellular permeability changes in Apom-/- mice.
(a) Schematic of a mouse after preparative microsurgery for two-photon imaging, with (b) craniotomy over the somatosensory cortex. (c) Three-dimensional reconstruction of the brain microvasculature from a single Z-stack after i.v. injection of NaFluo. Each Z-stack corresponds to a single time point and underwent dimensionality reduction by maximum intensity projection along the Z-axis (depth). (d) Relative fluorescence change over the baseline (first projected Z-stack in the recording). Contours delineate the main cerebral microvasculature. Compared to WT, the Apom-/- animals had increased accumulation of NaFluo in the brain parenchyma over time, which was ameliorated by treatment with S1PR1 agonist SEW2871. (e) Bolus injections of fluorophore were separated by 30 min time-lapse imaging intervals. The panels show fluorescent molecule accumulation in the brain parenchyma for all tested fluorophores at 30 min post-injection. (f) Changes in fluorescence intensity over time in the brain parenchyma and the blood circulation expressed as a fraction of the baseline. (g) Quantitative assessment of the total effect 30 min post-injection by area under the curve (AUC) calculation. Left bar plot: increased paracellular permeability of the BBB in Apom-/- mice towards sodium fluorescein (0.365 kDa) and Alexa Fluor488 (0.643 kDa), but not large molecule FITC-dextran (10 kDa). Right bar plot: no differences in the signal decrease of blood-circulating fluorophores among all experimental groups. (h) The mean arterial blood pressure during imaging was the same in all experimental groups. All data are presented as mean ± SEM. *p<0.05, **p<0.01, ***p<0.001.
Figure 1—figure supplement 1
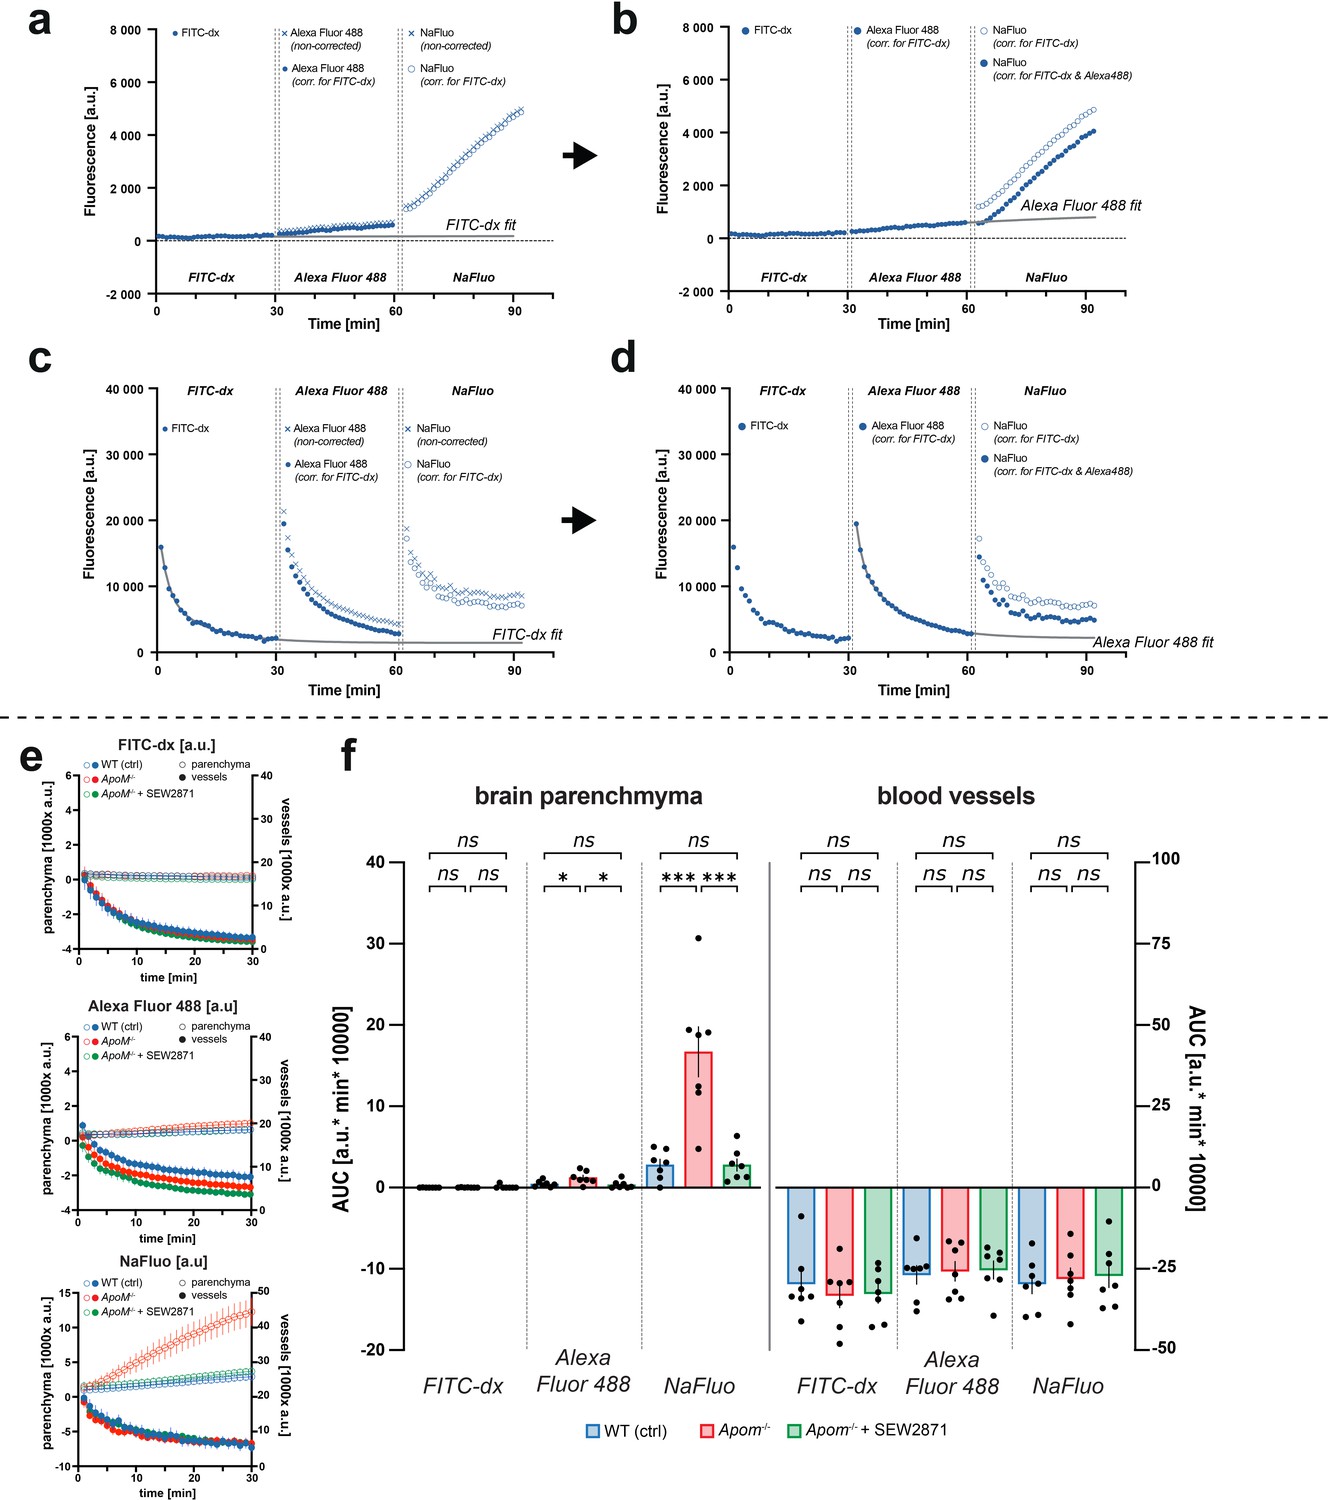
Data analysis: (a) Brain parenchyma fluorescence traces from three consecutively injected fluorophores with an exponential curve fit to the FITC-dx trace.
The fit is extrapolated and subtracted from the Alexa Fluor 488 and NaFluo traces. (b) Next, a second exponential fit is performed to the corrected Alexa Fluor 488 trace, extrapolated and subtracted from the NaFluo trace. (c, d) For vessel fluorescence, analogically to the brain parenchyma, two exponential decay fits are performed to correct first for (c) FITC-dx and then for (d) Alexa Fluor 488 fluorescence contribution. (e) Averages of corrected fluorescence traces for brain parenchyma and vessels. (f) AUC analysis of fluorescence increases in the brain parenchyma and decrease in blood vessels. Data are presented in arbitrary fluorescence units [a.u] as mean ± SEM. *p<0.05; ***p<0.001.
Figure 2 with 1 supplement
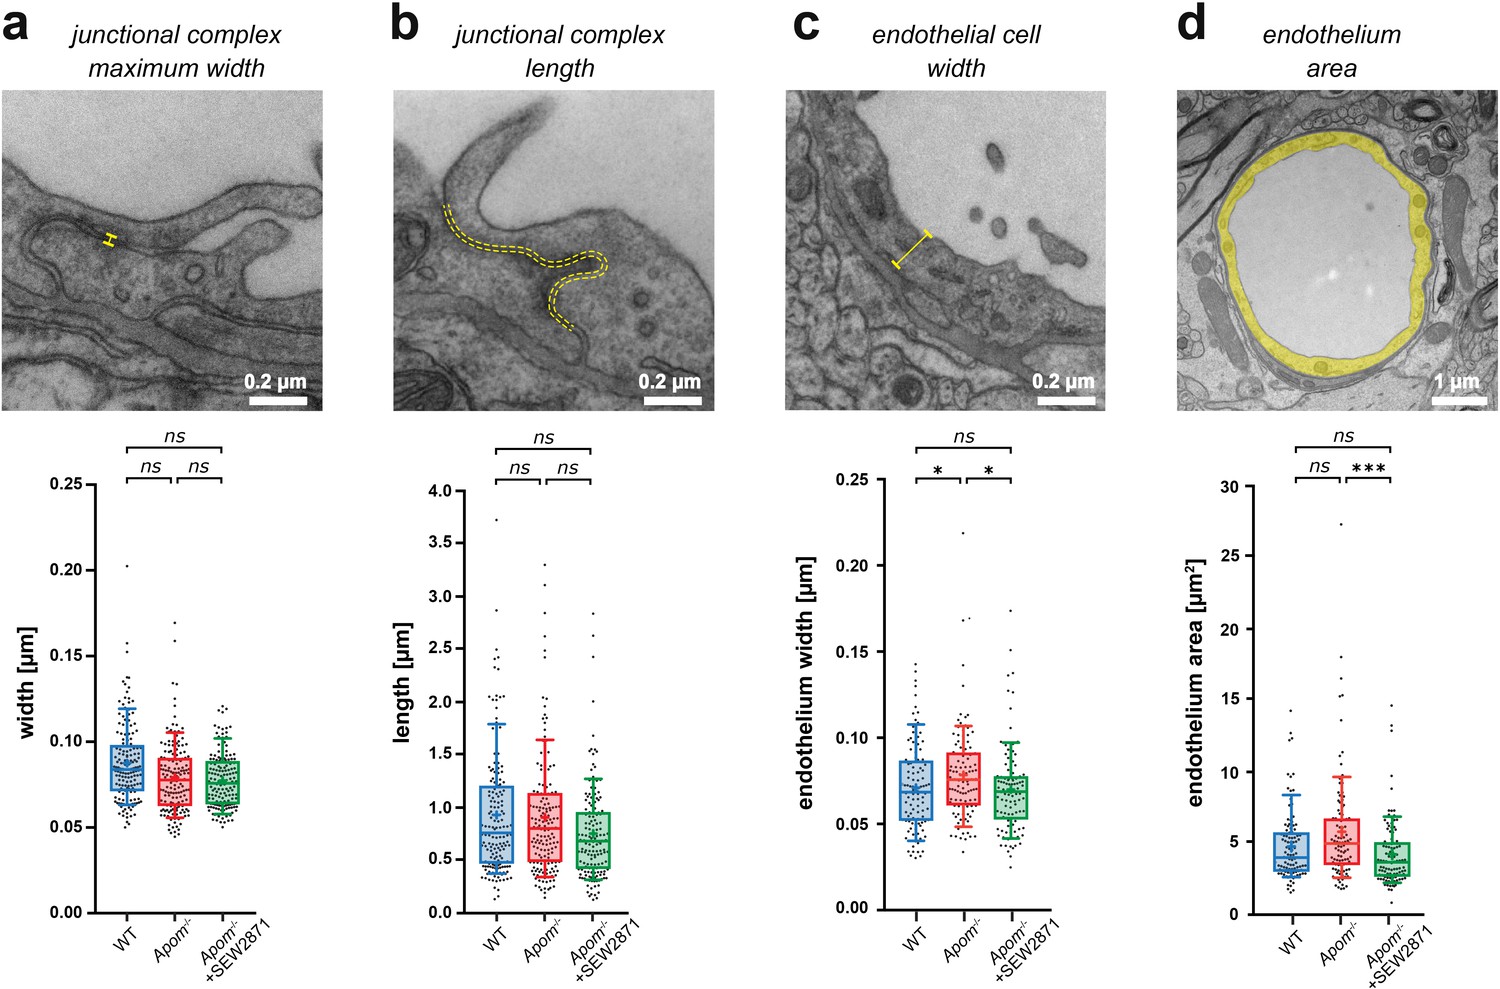
Small changes in endothelium cell morphology, but not junctional complexes, accompany increased BBB paracellular permeability in Apom-/-mice.
TEM ultrastructure assessment of the structural components of the BBB revealed no changes in the (a) width or (b) length of junctional complexes, with (c) a small increase in endothelial thickness in Apom-/- mice compared to WT mice and a decrease in SEW2871-treated Apom-/- mice. (d) A small decrease in endothelial cell area was observed upon SEW2871 treatment in Apom-/- mice. Data are presented as interquartile distributions with median (horizontal line) and mean (plus sign). The box whiskers indicate 10–90% percentiles. *p<0.05, ***p<0.001.
Figure 2—figure supplement 1

Complementary BBB measurements by TEM.
(a) Neither ApoM-S1P deficit nor treatment with S1PR1 agonist SEW2871 affected the width of junctional complexes and length of the endothelial cleft, the proportion of endothelial cleft covered by junctional complexes (%), or the minimum and the maximum thickness of the basement membrane. Data are presented as interquartile distributions with median (horizontal line) and mean (plus sign). The box whiskers indicate 10–90% percentiles. (b) Summary table of all TEM micrograph measurements. Data are presented as mean with (median) ± SEM.
Figure 3 with 2 supplements
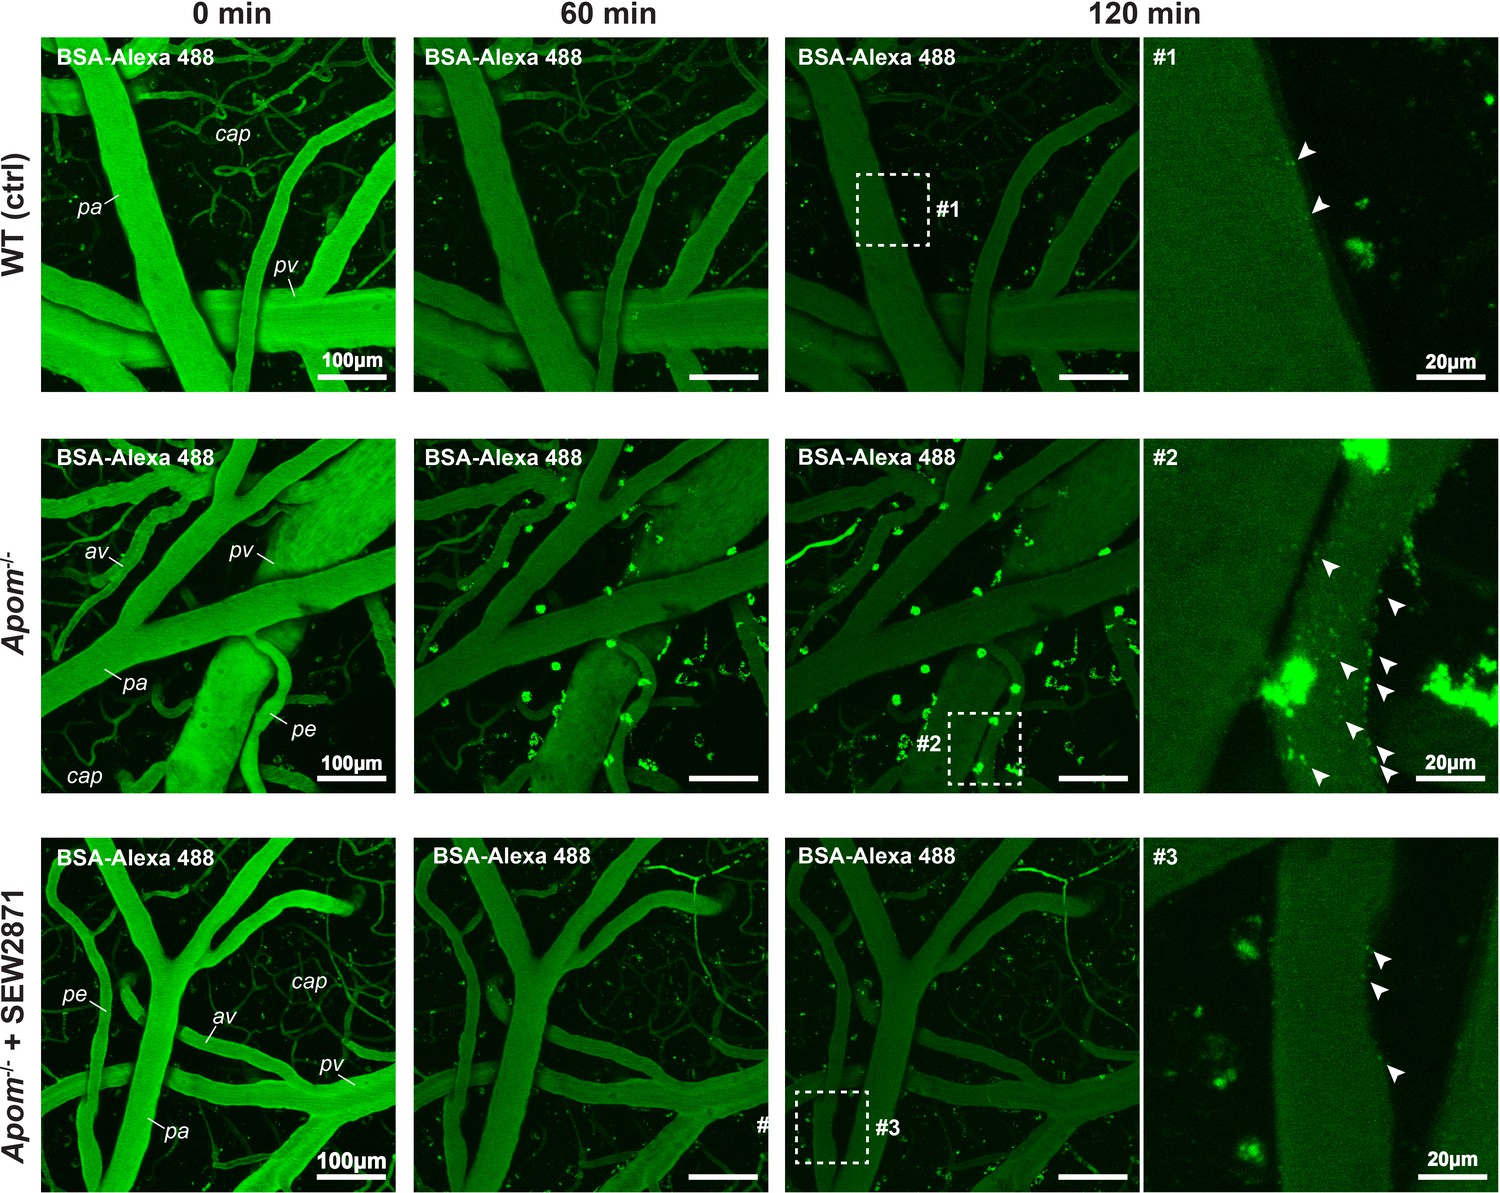
Increase in BSA-Alexa 488 uptake indicates an increase in transcellular transport in Apom-/- mice.
Two-photon assessment of albumin uptake (green puncta) 60 and 120 min post i.v. injection of BSA-Alexa 488. Arrowheads indicate numerous puncta of BSA-Alexa 488 vesicles at the BBB interface in Apom-/- mice but only sparse labeling in WT and SEW2871-treated animals. pa = pial arteriole; pe = penetrating arteriole; cap = capillaries; pv = pial venule; av = ascending venule.
Figure 3—figure supplement 1

Increased BBB permeability in Apom-/- mice is not associated with fibrinogen invasion and gliosis.
(a) Fibrinogen DAB staining in the brain parenchyma in WT and Apom-/- mice. Small panels show brain tissue at the location of the cerebral microvessels. (b) There were no signs of morphological differences in microglia/macrophages (Iba-1) and astrocytes (GFAP) between WT and Apom-/- mice. Immunofluorescence images represent maximum intensity projections of a 10 µm Z-stack from cortical brain sections. Both WT and Apom-/- panels are presented in the same fluorescence signal intensity scale.
Figure 3—figure supplement 2
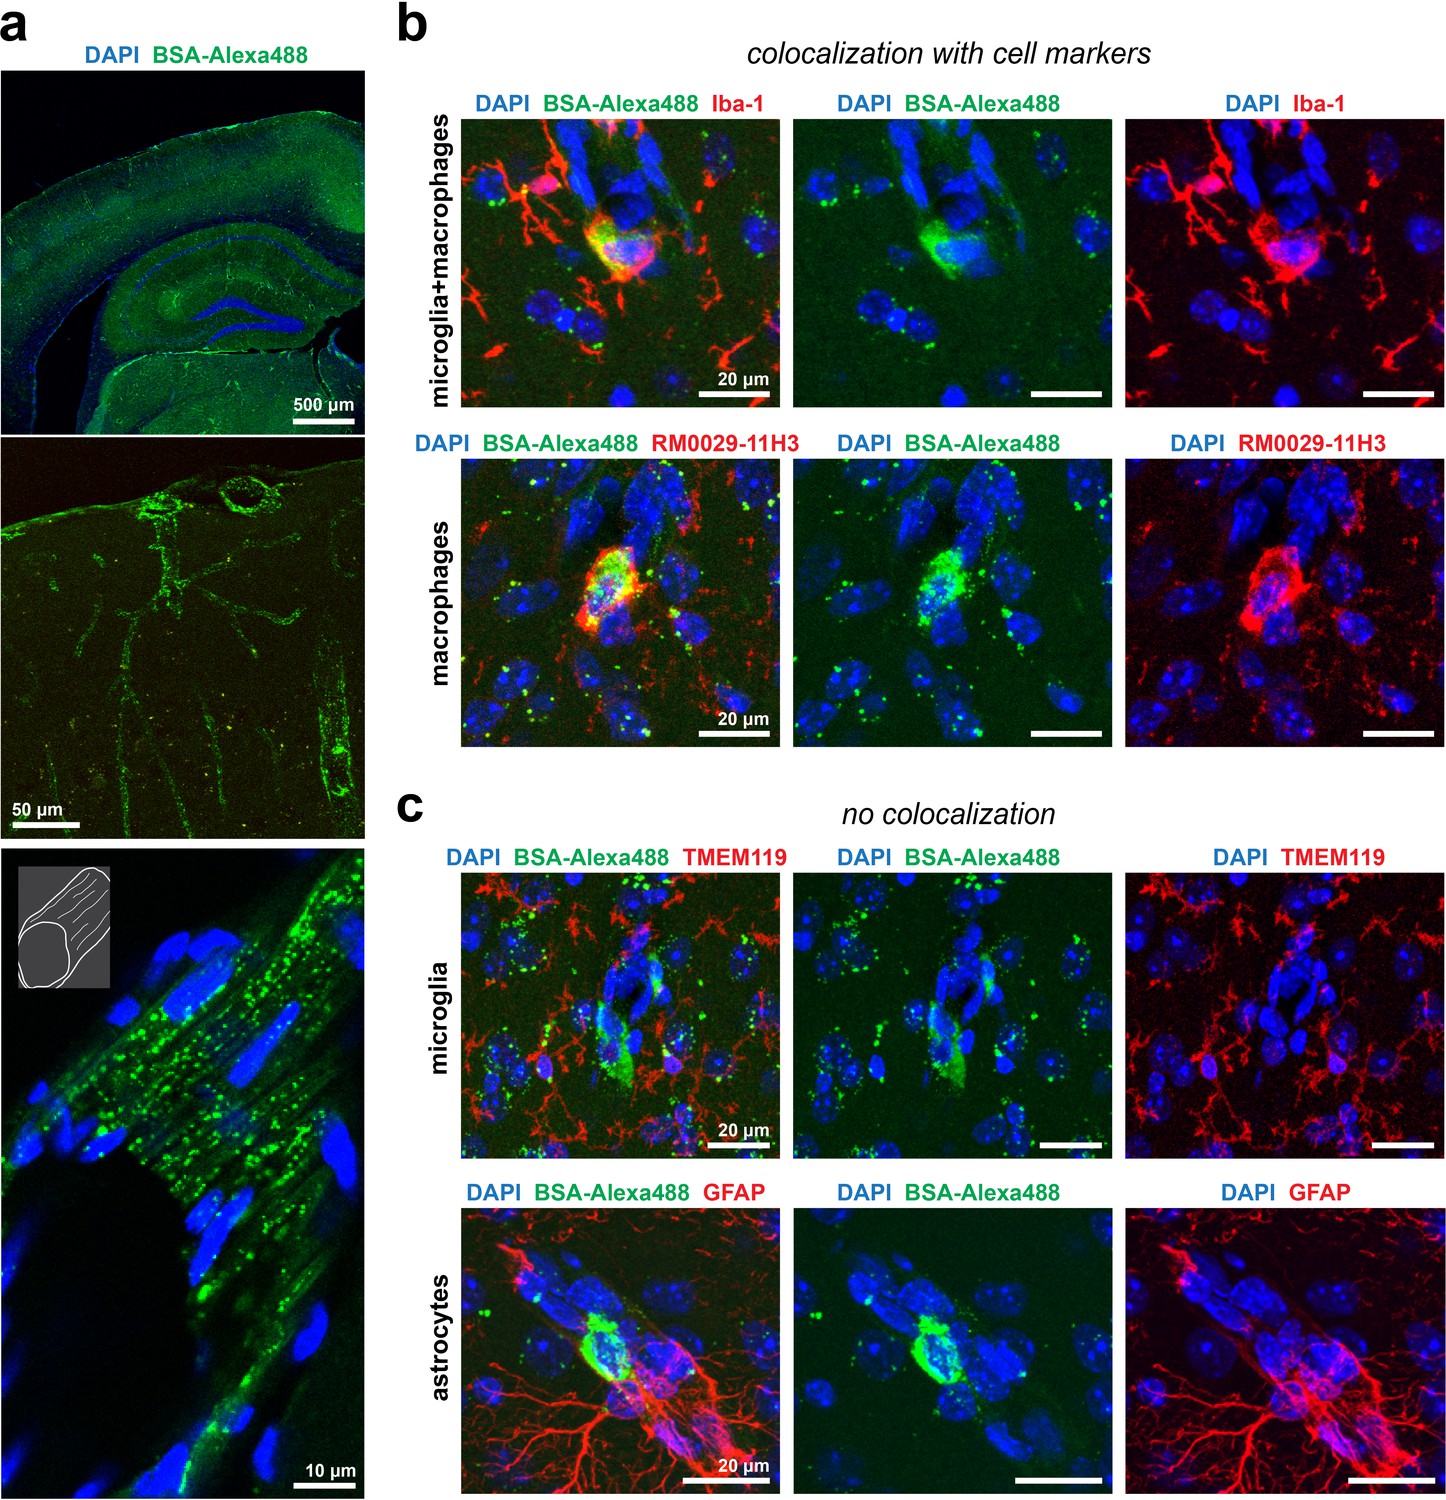
Uptake of BSA-Alexa488 in the Apom-/- brain parenchyma by macrophages.
(a) Perfusion-fixation protocol neither quenched nor altered the distribution of BSA-Alexa488. Top panel: an overview of a mouse brain cortical region with BSA-Alexa488 fluorescence. Middle panel: contours of numerous cerebral microvessels delineated by vesicular BSA-Alexa488. Bottom panel: fragment of a pial microvessel aligned with the imaging plane with a clear presence of vesicular BSA-Alexa488. (b) Macrophages, but not (c) microglia or astrocytes sequester BSA-Alexa488 in the brain.
Figure 4

Heterogeneous susceptibility of different categories of brain microvessels to increased transcytosis in Apom-/- mice.
(a) Scatter plot showing the distribution of the surface vesicle densities of individual vessels plotted against respective vessel diameters 120 min post BSA-Alexa 488 injection. The blue areas represent the morphological division into distinct vessel types. Data from capillaries were mirrored to preserve the order of vessel diameter change in the continuous brain microvascular tree. (b) Quantitative analysis showed the increase in albumin uptake in Apom-/- mice that was present only in the arterial part of the vascular tree and absent in capillaries and venules. Only penetrating arterioles responded to SEW2871 treatment. Numbers in brackets are the number of vessels across five mice in each group. The data are presented as mean ± SEM. (c) Average traces showing the kinetics of the vesicle density changes for WT, Apom-/-, and Apom-/- SEW2871 treated mice with respect to different vessel types. The data are presented as mean ± SEM. *p<0.05, **p<0.01.
Author response image 1
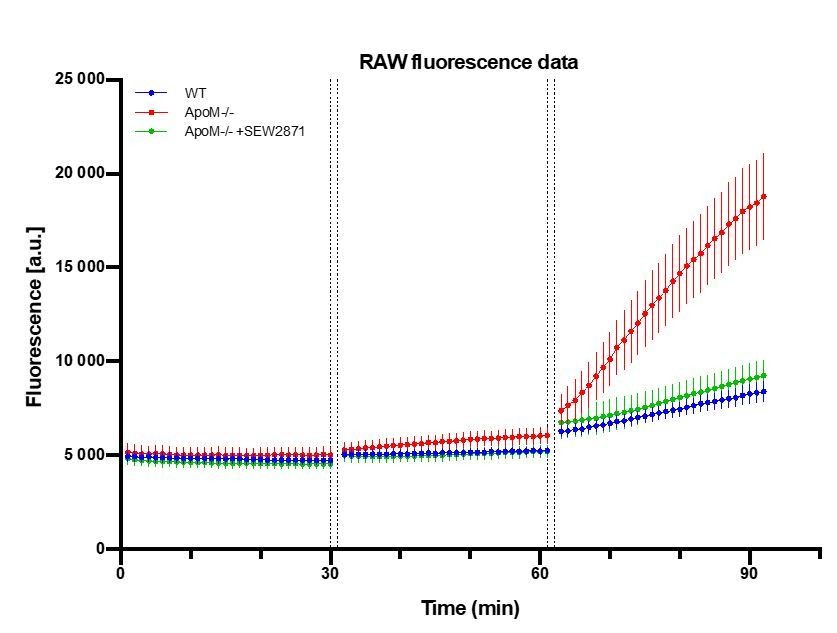
Raw fluorescence signal collected from brain parenchyma after sequential injections of FITC-dx, Alexa Fluor 488 and NaFluo.
A.U. = arbitrary fluorescence unit (detector counts). The time between data points of last frame in Z-stack of preceding fluorophore and time of last Z-stack of subsequent fluorophore was 2 min (1 min of injection + 1 min of Z-stack collection time). n=7 animals in each experimental.
Author response image 2
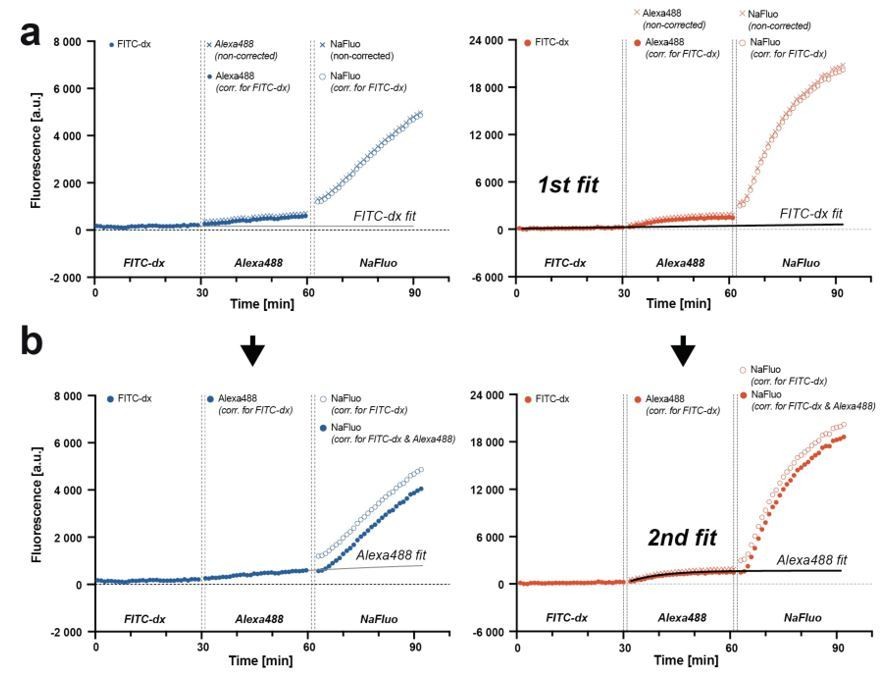
Correcting for the preceding fluorophore signal contribution to the subsequent fluorophore signal measurement.
(a) Traces from three consecutive injections of fluorophores with a curve fit to FITC-dx trace. The fit is extrapolated and subtracted from Alexa Fluor 488 and NaFluo traces. (b) Second fit is performed to a corrected Alexa Fluor 488 trace, extrapolated and subtracted from NaFluo trace. The model is applicable for both, relatively low (blue traces, WT animal) and relatively high (red traces, apoM-/- mouse) fluorescence changes.
Author response image 3
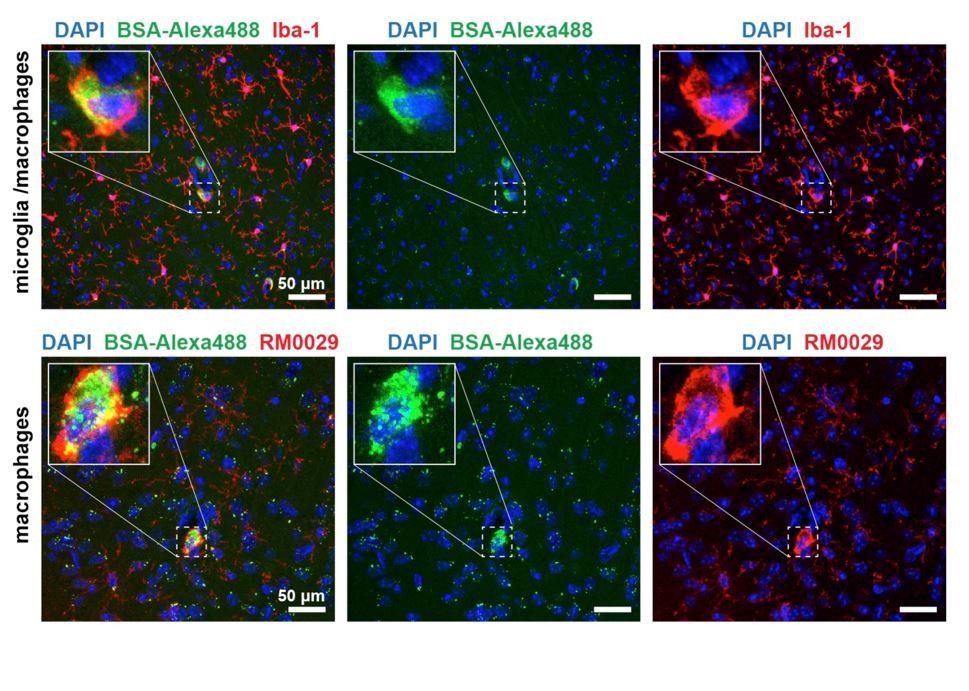
BSA-Alexa 488 uptake by Iba-1 and RM0029-11H3 positive cells, i.e. macrophages.
Author response image 4
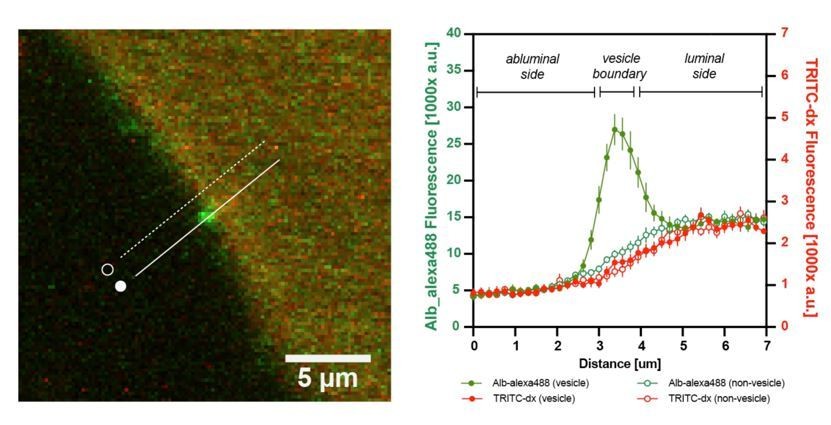
Additional internal control: the graph shows the fluorescence intensity profile plot of n=10 albumin-containing vesicles.
There was no enrichment of TRITC-dx signal (red) in BSA-Alexa488 –containing vesicles (green) at the BBB.
Videos
Video 1
Lack of apoM leads to a reversible increase in BBB paracellular permeability.
Accumulation of NaFluo in brain parenchyma presented as fluorescence increase relative to the baseline. Fluorophore injections occurred 1 min before the first recorded imaging plane.
Video 2
WT mice BBB paracellular permeability towards NaFluo, Alexa Fluor 488, and 10 kDa FITC-dx.
Accumulation of fluorophores in brain parenchyma presented as fluorescence increase relative to the baseline. For each time-lapse recording, the respective fluorophore was injected 1 min before the first recorded imaging plane.
Video 3
Increase in the BBB paracellular permeability in Apom-/- mice towards NaFluo and Alexa Fluor 488, but not 10 kDa FITC-dx.
Accumulation of fluorophores in brain parenchyma presented as fluorescence increase relative to the baseline. For each time-lapse recording, the respective fluorophore was injected 1 min before the first recorded imaging plane.
Video 4
Apom-/- SEW2781-treated mice exhibit normal BBB paracellular permeability towards NaFluo, Alexa Fluor 488, and 10 kDa FITC-dx.
Accumulation of fluorophores in brain parenchyma presented as fluorescence increase relative to the baseline. For each time-lapse recording, the respective fluorophore was injected 1 min before the first recorded imaging plane.
Additional files
Download links
A two-part list of links to download the article, or parts of the article, in various formats.
Downloads (link to download the article as PDF)
Open citations (links to open the citations from this article in various online reference manager services)
Cite this article (links to download the citations from this article in formats compatible with various reference manager tools)
Apolipoprotein M-bound sphingosine-1-phosphate regulates blood–brain barrier paracellular permeability and transcytosis
eLife 8:e49405.
https://doi.org/10.7554/eLife.49405


