Decreasing human body temperature in the United States since the Industrial Revolution
- Stanford University, School of Medicine, United States
- Stanford University, United States
Figures
Figure 1 with 6 supplements
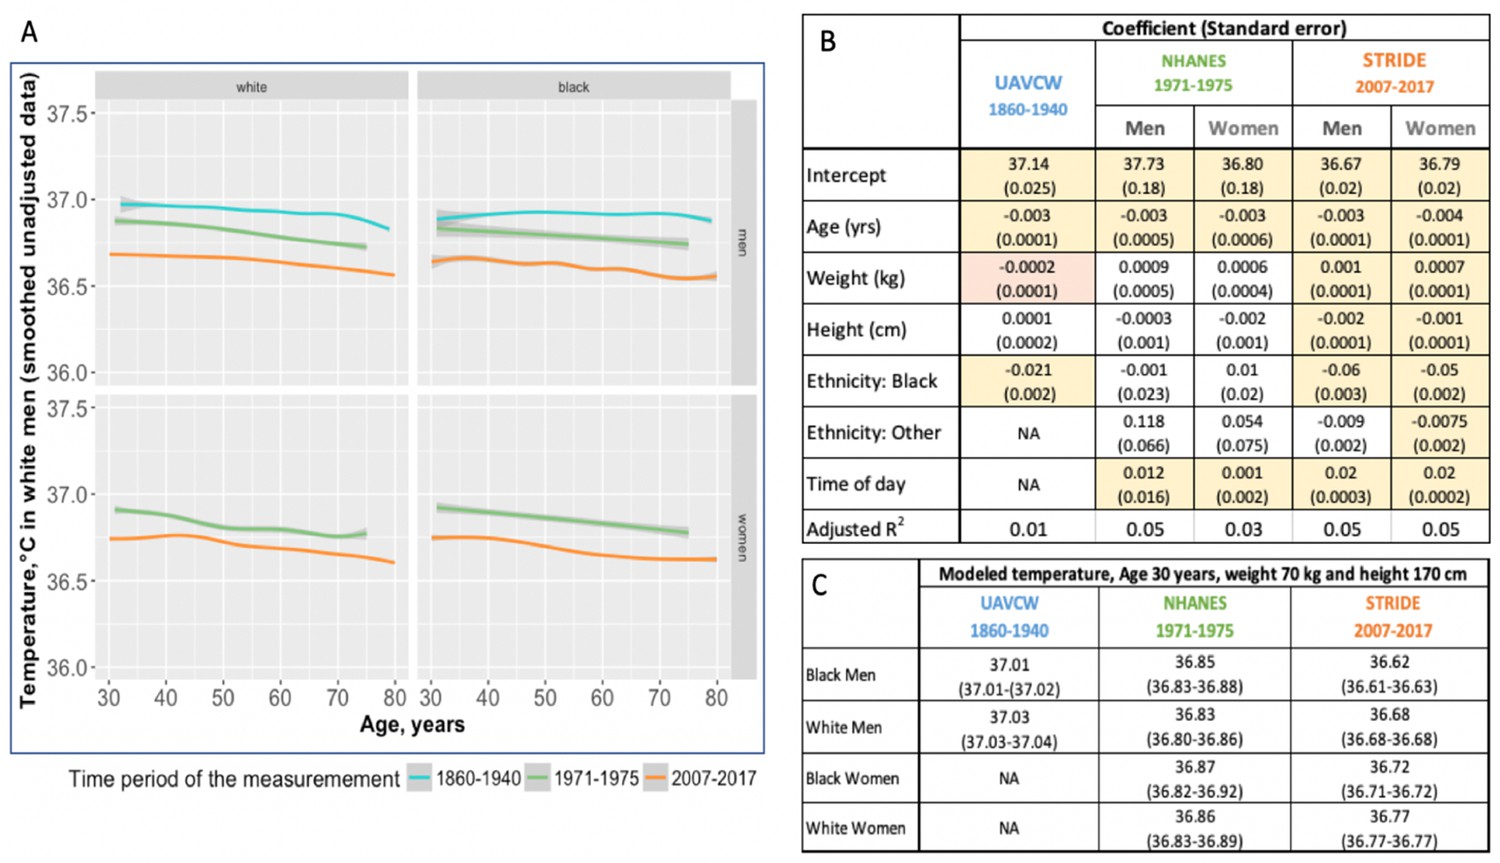
Body temperature measurements by age as observed in three different time periods: 1860–1940 (UAVCW), 1971–1975 (NHANES 1), and 2007–2017 (STRIDE).
(A) Unadjusted data (local regression) for temperature measurements, showing a decrease in temperature across age in white men, black men, white women, and black women, in the three cohorts. (B) Coefficients and standard errors from multivariate linear regression models for each cohort including age, weight, height, ethnicity group and time of day as available. Yellow cells are statistically significant at a p value of < 0.01, orange cells are of borderline significance (p<0.1 but>0.05), and remaining uncolored cells are not statistically significant. (C) Expected body temperature for 30 year old men and women with weight 70 kg and height 170 cm in each time period/cohort.
-
Figure 1—source code 1
R code for Figure 1.
- https://cdn.elifesciences.org/articles/49555/elife-49555-fig1-code1-v2.rmd
Figure 1—figure supplement 1
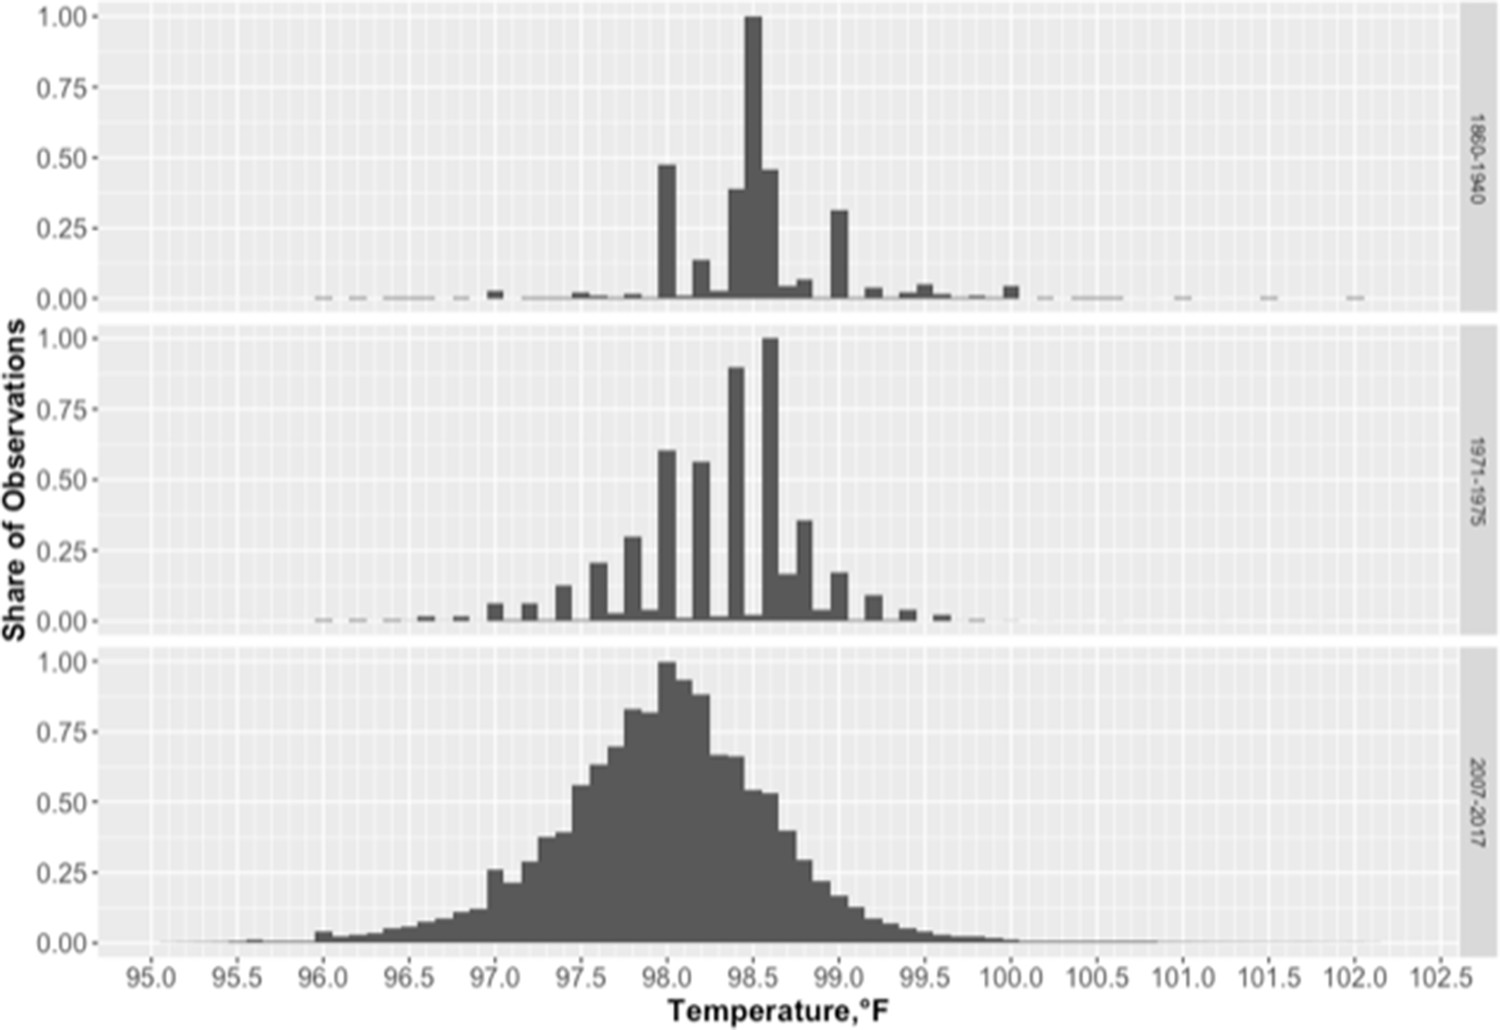
Distribution of temperature measures (oF) for each cohort: UAVCW (1860–1940), NHANES I (1971–1975) and STRIDE (2007–2017).
-
Figure 1—figure supplement 1—source code 1
R code for Figure 1—figure supplement 1.
- https://cdn.elifesciences.org/articles/49555/elife-49555-fig1-figsupp1-code1-v2.rmd
Figure 1—figure supplement 2
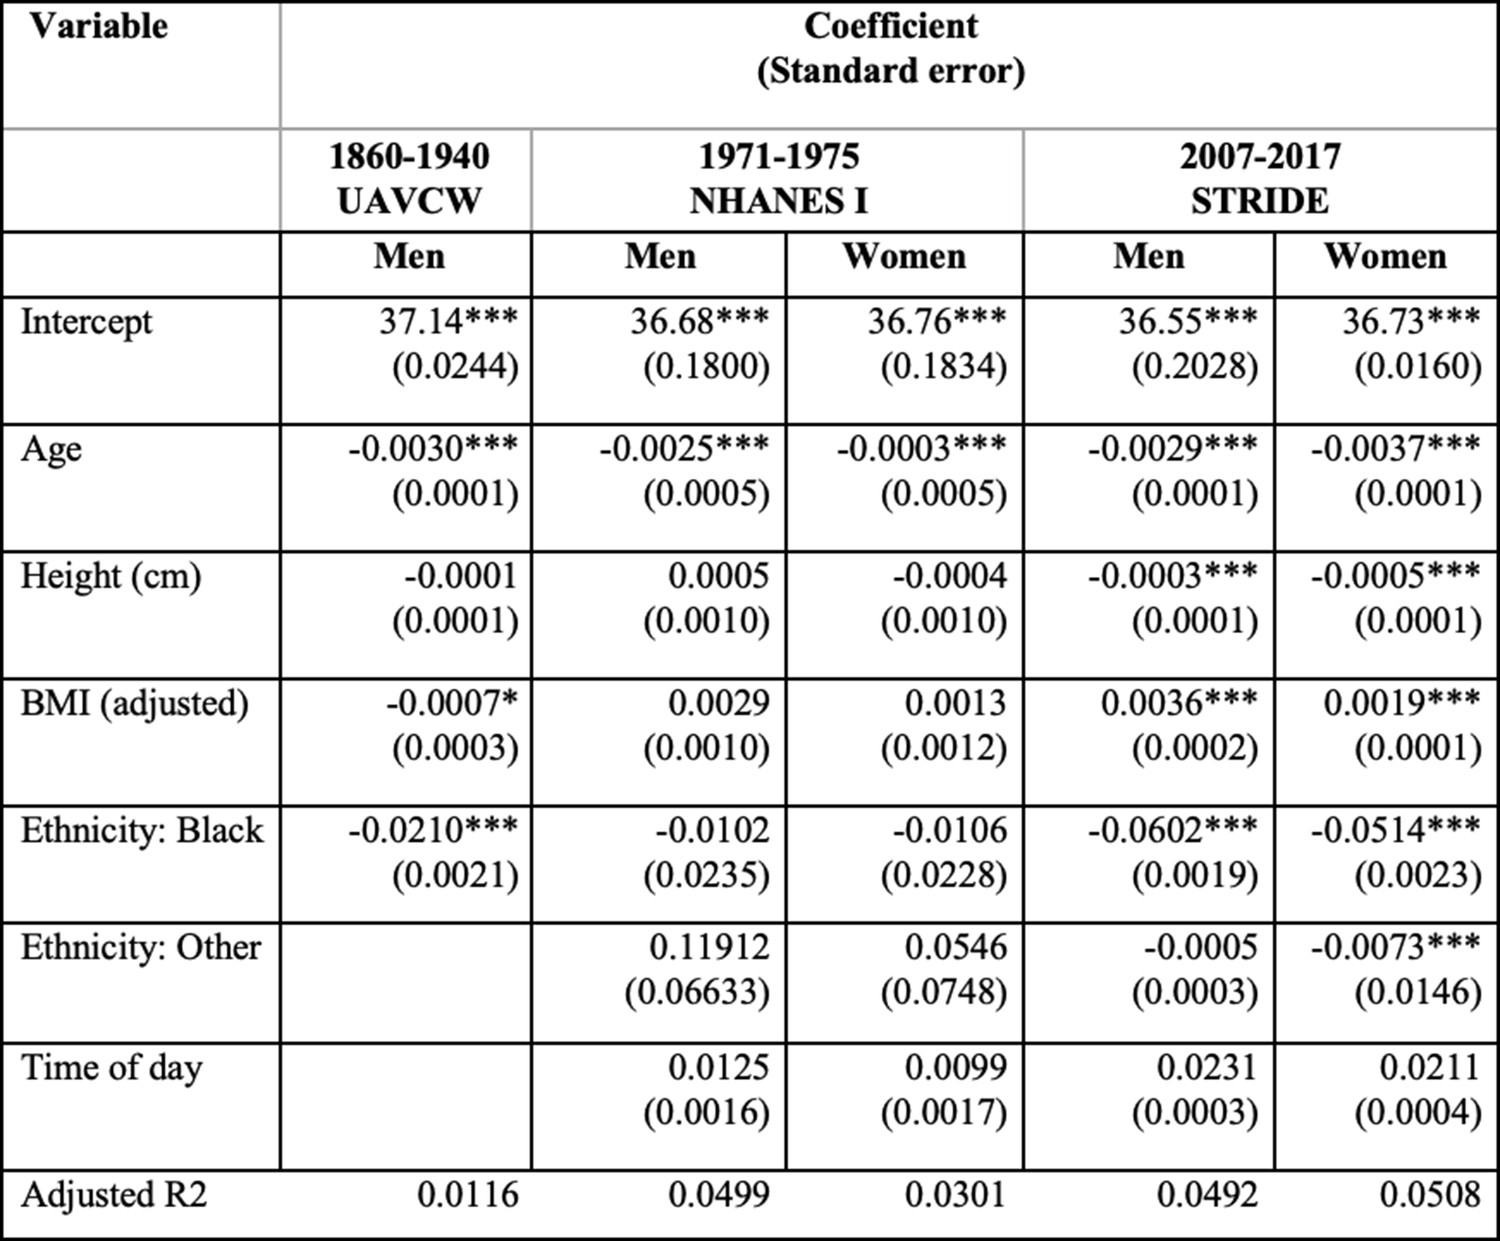
Analysis using BMI adjusted for height.
Coefficients (and standard errors) are from multivariate linear regression models for each cohort including age, height, BMI adjusted for height and time of day (as available). NHANES I includes population weights. *, **, *** indicates significance at the 90%, 95%, and 99% level, respectively.
-
Figure 1—figure supplement 2—source code 1
R code for Figure 1—figure supplement 2.
- https://cdn.elifesciences.org/articles/49555/elife-49555-fig1-figsupp2-code1-v2.rmd
Figure 1—figure supplement 3
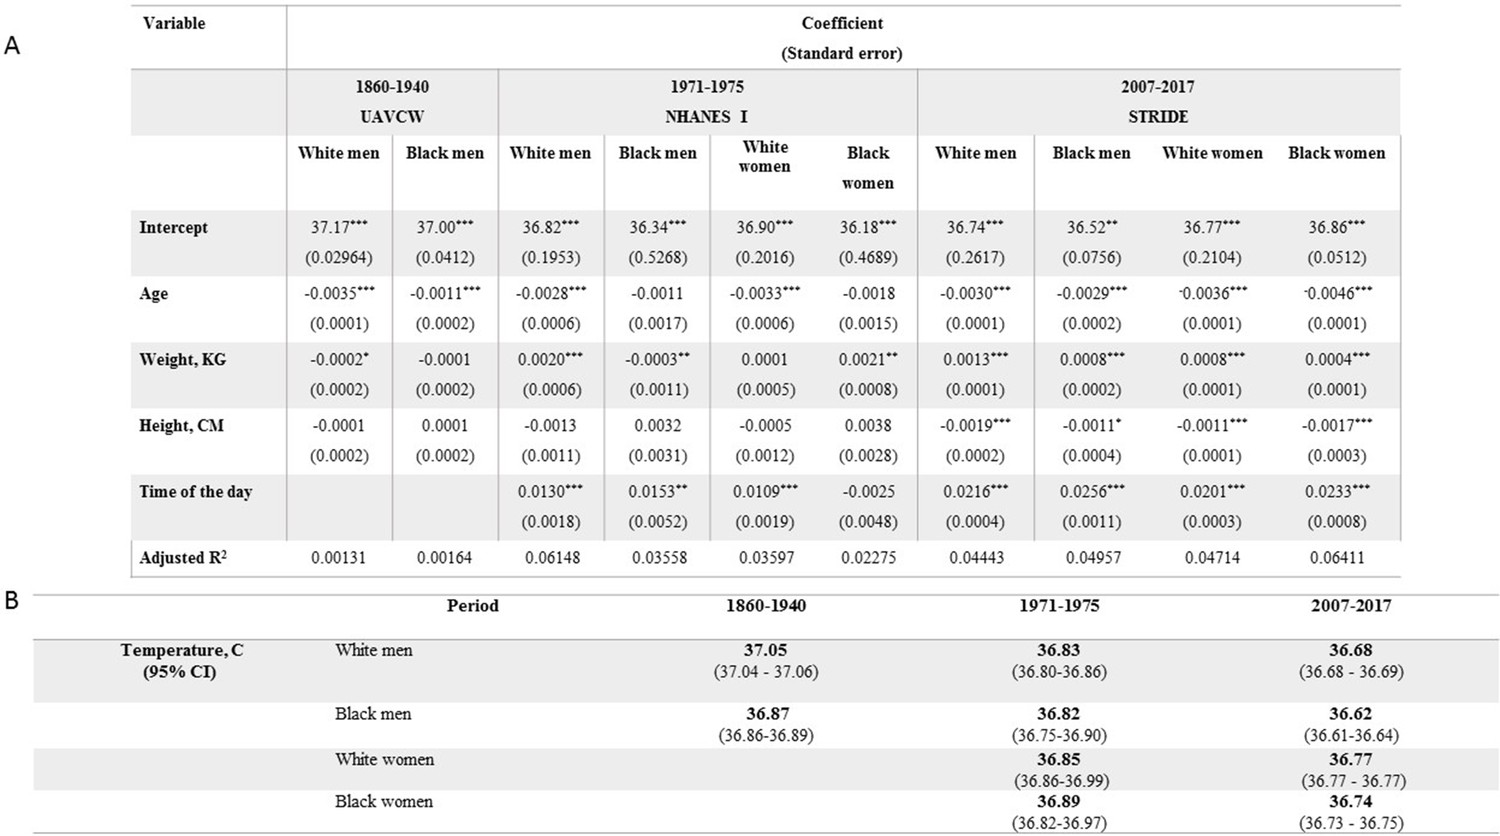
Model of mean body temperature in black and white ethnicity groups in three different time periods (cohorts): 1860–1940 (UAVCW), 1971–1975 (NHANES 1), and 2007–2017 (STRIDE).
(A) Coefficients (and standard errors) from multivariate linear regression models for each cohort including age, body weight, height and time of day. Separate regression models were fitted for men and women, in black and white ethnicity groups. NHANES I includes population weights. *, **, *** indicates significance at the 90%, 95%, and 99% level, respectively. (B) Expected body temperature (and associated 95% confidence interval) for 30 year old men and women with body weight 70 kg and height 170 cm in each time period/cohort. These values derive from the regression models presented in A.
-
Figure 1—figure supplement 3—source code 1
R code for Figure 1—figure supplement 3.
- https://cdn.elifesciences.org/articles/49555/elife-49555-fig1-figsupp3-code1-v2.rmd
Figure 1—figure supplement 4
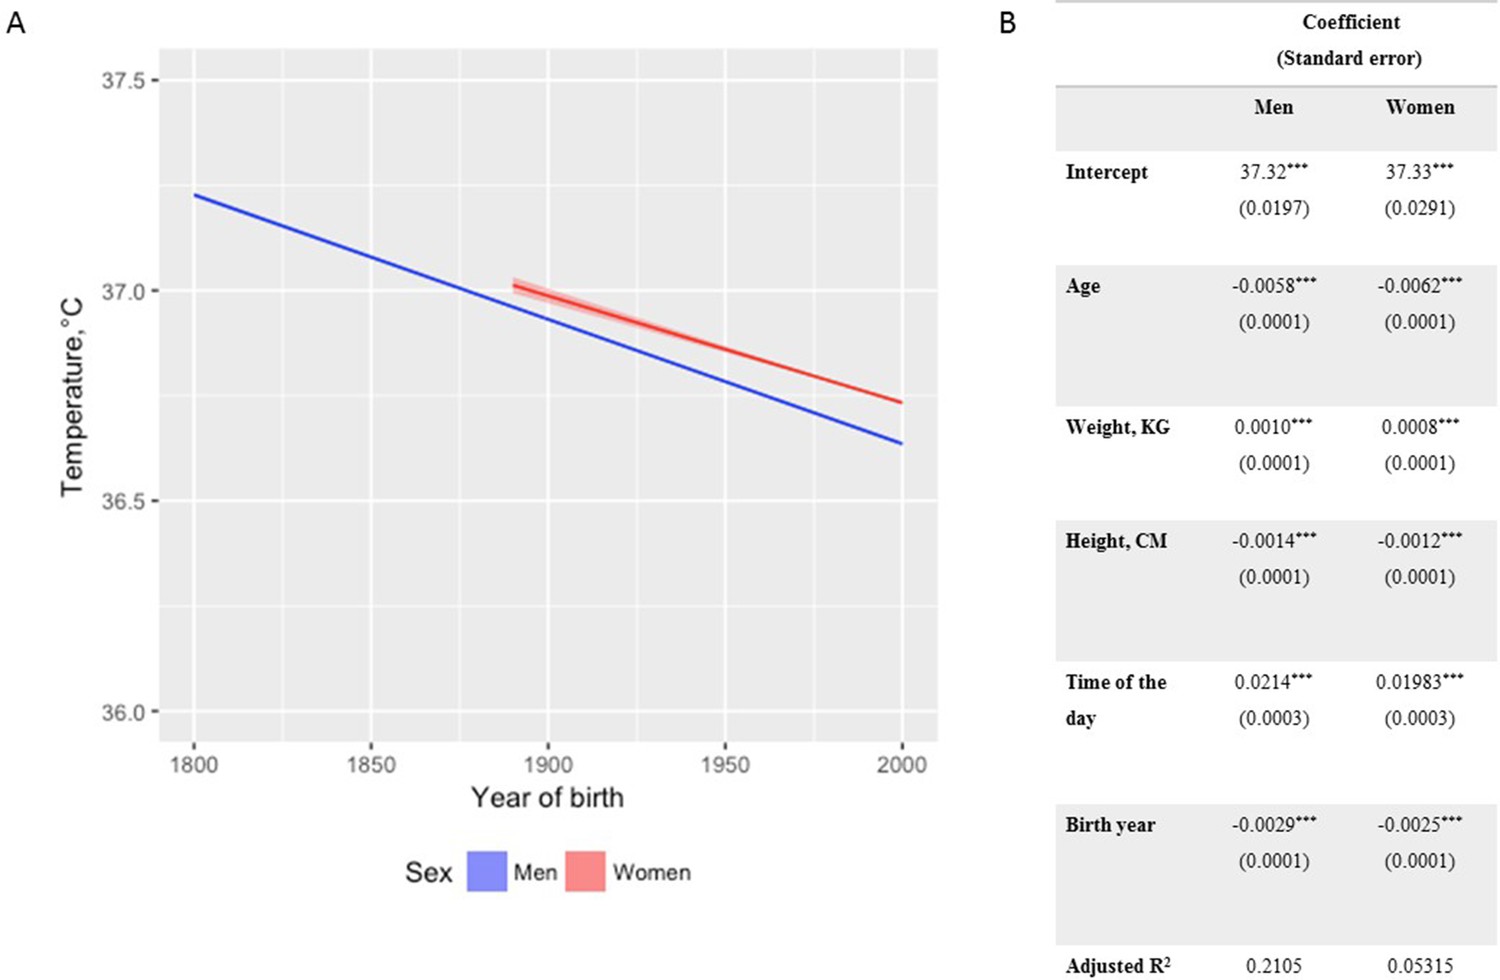
Model of mean body temperature over time in three cohorts by birth year controlling for the time of the day of the temperature measurement (white men and women).
(A) Graph shows a decrease of predicted body temperature by birth year for both white men (blue line) and white women (red line) based on the linear regression coefficients displayed in B. No data for women were available for the period 1800–1890. For all measurements from UACWV, where time of the day was not available, the values of 12:00 PM (noon) were imputed. (B) Coefficients (and standard errors) from linear regression model including age, weight in kg, height in cm and birth year.
-
Figure 1—figure supplement 4—source code 1
R code for Figure 1—figure supplement 4.
- https://cdn.elifesciences.org/articles/49555/elife-49555-fig1-figsupp4-code1-v2.rmd
Figure 1—figure supplement 5

Effect of the month of temperature measurement.
Mixed effect predictions and confidence intervals of the month during which the measurement was taken on the measured temperature. (A) White men in UACWV, (B) white men in NHANES I, (C) white men in STRIDE, (D) white women in NHANES I, and (E) white women in STRIDE.
-
Figure 1—figure supplement 5—source code 1
R code for Figure 1—figure supplement 5.
- https://cdn.elifesciences.org/articles/49555/elife-49555-fig1-figsupp5-code1-v2.rmd
Figure 1—figure supplement 6
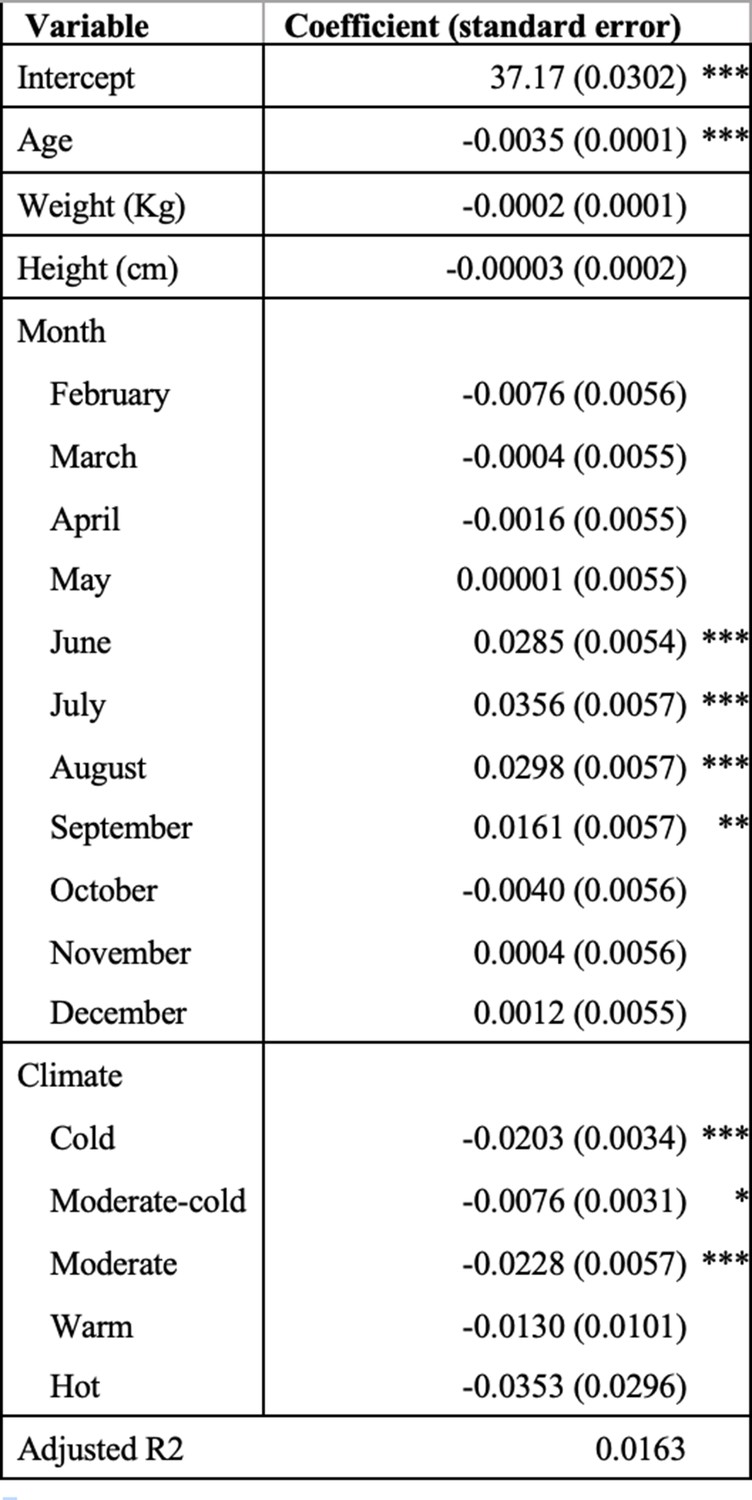
Analysis using both month and location.
Coefficients (and standard errors) are from a multivariate linear regression model for the UAVCW cohort including age, weight, height, month and state climate classification (cold, moderate-cold, moderate, warm or hot). While UAVCW provided state information, NHANES I provided general region only and STRIDE was in Northern California only. *, **, *** indicates significance at the 90%, 95%, and 99% level, respectively.
-
Figure 1—figure supplement 6—source code 1
R code for Figure 1—figure supplement 6.
- https://cdn.elifesciences.org/articles/49555/elife-49555-fig1-figsupp6-code1-v2.rmd
Figure 2
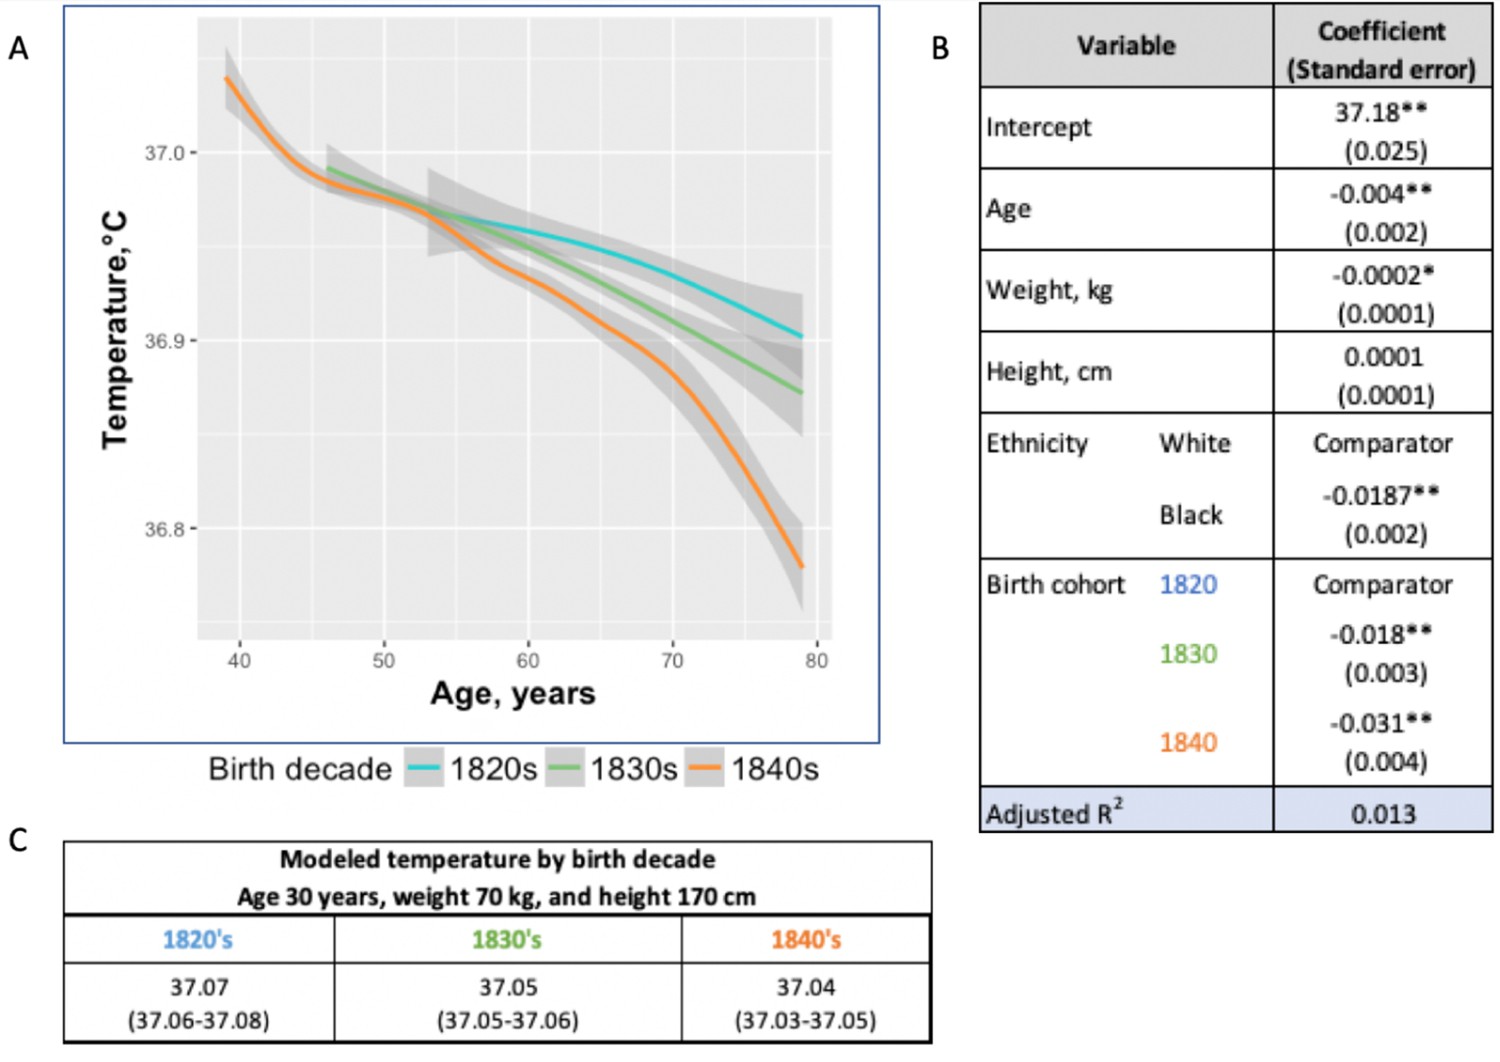
Temperature trends within birth cohorts of the UAVCW, 1860–1940 (black and white men).
(A) Smoothed unadjusted data (local regression) for temperature measurement trends within birth cohorts. The different colors represent different birth cohorts (green: 1820s, blue: 1830s, orange: 1840s). (B) Coefficients (and standard errors) from multivariate linear regression including age, body weight, height and decade of birth (1820–1840) (these coefficients do not correspond to the graph as here the trajectories are approximated by linear functions). Only the three birth cohorts with more than 8000 members are included. * and ** indicate significance at the 90%, and 99% level, respectively. (C) Expected body temperature (and associated 95% confidence interval) for 30 year old men with body weight 70 kg and height 170 cm in each birth cohort. These values derive from the regression models presented in B.
-
Figure 2—source code 1
R code for Figure 2.
- https://cdn.elifesciences.org/articles/49555/elife-49555-fig2-code1-v2.rmd
Figure 3
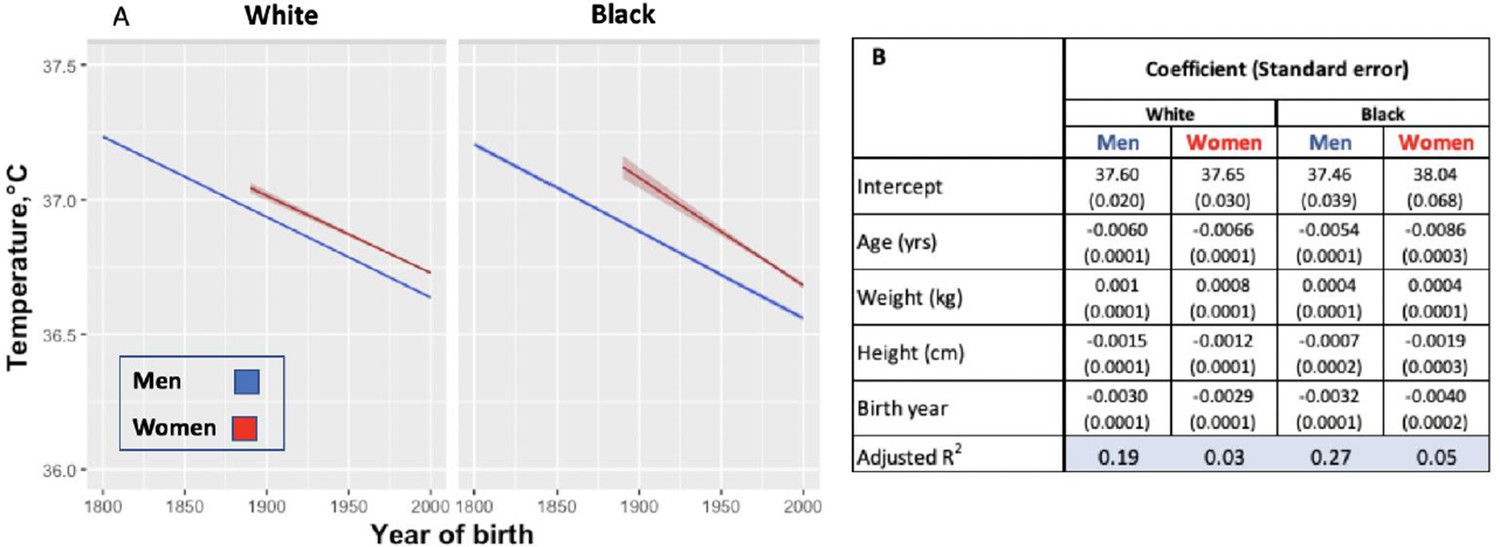
Modeled body temperature over time in three cohorts by birth year (black and white ethnicity groups).
(A) Body temperature decreases by birth year in white and black men and women. No data for women were available for the birth years from 1800 to 1890. (B) Coefficients (and standard errors) used for the graph from multivariate linear regression including age, body weight, height and birth year. All cells are significant at greater than 99% significance level.
-
Figure 3—source code 1
R code for Figure 3.
- https://cdn.elifesciences.org/articles/49555/elife-49555-fig3-code1-v2.rmd
Tables
Table 1
Demographic characteristics (N (%)) and mean (SD)) of cohort participants included in the analyses.
| Total, N (%) | Uavcw | Nhanes i | Stride | |
|---|---|---|---|---|
| Individuals | 189,338 (100%) | 23,710 (13%) | 15,301 (8%) | 150,280 (79%) |
| Observations1 | 677,423 (100%) | 83,699 (12%) | 15,301 (2%) | 578,222 (85%) |
| Age (years) | ||||
| Overall* | 56.89 (8.85) | 46.55 (16.74) | 53.00 (15.62) | |
| 20–40 | 144,379 (21%) | 1682 (2%) | 6489 (42%) | 136,181 (24%) |
| 40–60 | 283,059 (42%) | 52,117 (62%) | 4422 (29%) | 225,365 (39%) |
| 60–80 | 249,985 (37%) | 28,900 (35%) | 4390 (29%) | 216,676 (37%) |
| Weight (Kg) | 0 (0%) | 0 (0%) | 0 (0%) | 0 (0%) |
| Overall* | 68.63 (10.54) | 70.44 (15.76) | 78.53 (19.75) | |
| >60 | 123,931 (18%) | 16,147 (19%) | 4245 (28%) | 103,516 (18%) |
| 60–80 | 296,244 (44%) | 57,475 (69%) | 7311 (48%) | 231,312 (40%) |
| 80–100 | 175,598 (26%) | 9054 (11%) | 3115 (20%) | 163,402 (28%) |
| >100 | 81,650 (12%) | 1023 (1%) | 630 (4%) | 79,992 (14%) |
| Height (cm) | ||||
| Overall* | 172.34 (6.8) | 166.31 (9.17) | 167.78 (10.46) | |
| <160 | 145,964 (64%) | 2587 (3%) | 4077 (27%) | 139,295 (24%) |
| 160–180 | 432,404 (64%) | 69,506 (83%) | 9995 (65%) | 352,762 (61%) |
| 180–200 | 98,320 (15%) | 11,569 (14%) | 1227 (8%) | 85,470 (15%) |
| >200 | 735 (0%) | 37 (0%) | 2 (0%) | 695 (0%) |
| Sex | ||||
| Women2 | 357,309 (53%) | 0 (0%) | 9303 (61%) | 348,006 (60%) |
| Men | 320,114 (47%) | 83,699 (100%) | 5998 (39%) | 230,216 (40%) |
| Ethnicity | ||||
| Black | 68,955 (10%) | 20,801 (25%) | 2399 (16%) | 45,689 (8%) |
| White | 381,330 (56%) | 62,898 (75%) | 12,716 (83%) | 305,581 (53%) |
| Other | 78,277 (12%) | 0 (0%) | 186 (1%) | 78,091 (14%) |
| Unknown | 148,861 (22%) | 0 (0%) | 0 (0%) | 148,861 (26%) |
-
SD: standard deviation; UAVCW: Union Army Veterans of the Civil War; NHANES: National Health and Nutrition Examination Survey I; STRIDE: Stanford Translational Research Integrated Database Environment; BMI: body mass index. * Mean (SD). 1 Between one and four temperature measurements were available per person. 2UAVCW included men only.
-
Table 1—source code 1
R code for Table 1.
- https://cdn.elifesciences.org/articles/49555/elife-49555-table1-code1-v2.rmd
Additional files
-
Source data 1
Cohort datasets for all analyses.
- https://cdn.elifesciences.org/articles/49555/elife-49555-data1-v2.zip
-
Source code 1
R code - Data import files.
- https://cdn.elifesciences.org/articles/49555/elife-49555-code1-v2.zip
-
Source code 2
R code - Data analysis files.
- https://cdn.elifesciences.org/articles/49555/elife-49555-code2-v2.zip
-
Source code 3
R code for Supplementary file 1.
- https://cdn.elifesciences.org/articles/49555/elife-49555-code3-v2.rmd
-
Supplementary file 1
Predicted body temperature in individuals with infectious diseases in the UAVCW cohort (1860–1940).
Expected body temperature (and associated 95% confidence interval) for a 30 year old white man with body weight of 70 kg and height 170 cm in the UAVCW cohort. *, **, *** indicates significance at the 90%, 95%, and 99% level, respectively.
- https://cdn.elifesciences.org/articles/49555/elife-49555-supp1-v2.docx
-
Transparent reporting form
- https://cdn.elifesciences.org/articles/49555/elife-49555-transrepform-v2.pdf
Download links
A two-part list of links to download the article, or parts of the article, in various formats.
Downloads (link to download the article as PDF)
Open citations (links to open the citations from this article in various online reference manager services)
Cite this article (links to download the citations from this article in formats compatible with various reference manager tools)
Decreasing human body temperature in the United States since the Industrial Revolution
eLife 9:e49555.
https://doi.org/10.7554/eLife.49555


