Long non-coding RNA GRASLND enhances chondrogenesis via suppression of the interferon type II signaling pathway
Figures

GRASLND is important and specifically upregulated in MSC chondrogenesis.
(A) Expression pattern of GRASLND in chondrogenesis (GSE109503; Huynh et al., 2018b). Log2TPM: log transformed value of transcripts per million (TPM). (B) Effect of GRASLND knockdown on chondrogenic, apoptotic, and cell-cycle-inhibition markers (n = 5). (C–E) Effect of GRASLND knockdown on pellet matrix synthesis (n = 5). (F) Representative histological images of day 21 MSC pellets. Scale bar = 200 µm. SafO-FG, SafraninO-Fast Green staining; COLII IHC, collagen type II immunohistochemistry; hOC, human osteochondral control. (G–I) qRT-PCR analysis of MSC samples cultured in (G) the adipogenic condition (n = 6), (H) the osteogenic condition (n = 6), and (I) the chondrogenic condition (n = 3–4). One-way ANOVA followed by Tukey post-hoc test (α = 0.05). Groups of different letters are statistically different from one another.
-
Figure 1—source data 1
shRNA target sequences (5′ – sequence – 3′).
- https://cdn.elifesciences.org/articles/49558/elife-49558-fig1-data1-v2.xlsx
-
Figure 1—source data 2
qRT-PCR sequencing primers (5′ – sequence – 3′).
- https://cdn.elifesciences.org/articles/49558/elife-49558-fig1-data2-v2.xlsx

Identification of lncRNA candidates.
LncRNAs whose expression patterns are correlated to crucial markers are of interest. (A) Expression patterns of previously identified MSC markers (left), chondrogenic markers (middle), and SOX transcription factors (right). Data retrieved from: GSE109503. (B) Expression patterns of correlated genes or lncRNAs (Pearson correlation >0.9) to MSC markers (left), chondrogenic markers (middle), and SOX transcription factors (right). Lower boundary, 25th percentile; upper boundary, 75th percentile; blue line, median of correlated gene set. (C) Number of correlated genes and correlated lncRNAs.

Functional validation of identified lncRNA candidates.
Left: expression pattern of candidates during chondrogenesis (GSE109503). Log2TPM, log-transformed value of transcripts per million (TPM). Middle: efficiency of designed target shRNAs. Individual graphs indicate that experiments on target number one and target number two were performed separately (n = 3). Welch’s t-test on log-transformed fold changes was used for panels (A, B); one-way ANOVA with Tukey post-hoc test was used for panel (C) (α = 0.05). Groups of different letters are statistically different. Right: Quantitative analysis of synthesized GAG matrix normalized to DNA amount. In panel (A) LOXL1-AS1 (n = 4–5), a one-way ANOVA with Tukey post-hoc test was used. Groups of different letters are statistically different; in panel (B) RP11-366L20.2 (n = 3–5), Welch’s t-test was used; and in panel (C) MIR4435-1HG (n = 3–4), one- way ANOVA with Tukey post-hoc test was used. Groups of different letters are statistically different. (D) Cytotoxicity assay of target shRNAs for GRASLND. Cytotoxicity level was measured indirectly by the amount of released LDH (n = 4). One-way ANOVA followed by Tukey post-hoc test (α = 0.05) was used. Groups of different letters are statistically different from one another.

GRASLND is localized to the cytoplasm.
(A) RNA in situ hybridization of MSC-derived pellets at different time points during chondrogenesis. GAPDH and GRASLND probes were hybridized on separate slides. Top three panels, scale bar = 20 µm; bottom panel, scale bar = 10 µm. (B) qRT-PCR of the nuclear versus cytoplasmic fraction of day 21 MSC pellets (n = 4). NEAT1, Nuclear Paraspeckle Assembly Transcript 1. One-way ANOVA followed by Tukey post-hoc test (α = 0.05) was used. Groups of different letters are statistically different from one another. (C) Confocal microscopy on MSC-derived pellets. Scale bar = 5 µm.
-
Figure 2—source data 1
Cloning primer sequences (5′ – sequence – 3′).
- https://cdn.elifesciences.org/articles/49558/elife-49558-fig2-data1-v2.xlsx
-
Figure 2—source data 2
GRASLND probe set sequences (5′ – sequence – 3′).
- https://cdn.elifesciences.org/articles/49558/elife-49558-fig2-data2-v2.xlsx

GRASLND relationship to RNF144A and SOX9.
(A) GRASLND genomic location and conservation across different species. Data were retrieved from UCSC Genome Browser. (B) Knockdown of GRASLND and expression of RNF144A (n = 4). (C) Overexpression GRASLND and expression of RNF144A (n = 4). Welch’s t-test. (D) Protein amount of RNF144A by western blot in variation of GRASLND levels. Lanes indicate biological replicates. Full bands are shown in Figure 3—figure supplement 1. (E) GRASLND level in GFP- or SOX9-transduced MSCs under different doses of TGF-β3 (n = 6). Two-way ANOVA followed by Tukey post-hoc test (α = 0.05) was carried out on the effect of SOX9 overexpression (p<0.0001) and doses of TGF-β3 (p>0.05). The interaction between two tested factors (SOX9 overexpression and TGF-β3 doses) was not significant (p>0.05). Groups of different letters are statistically different. ns, not significant.

Full bands of western blot from Figure 3D.
Lanes indicate biological replicates.

GRASLND enhances chondrogenesis.
(A) Experimental timeline. (B, C) Biochemical analyses of day 21 MSC pellets (n = 4). Welch’s t-test. (D, E) qRT-PCR analyses of day 21 MSC pellets (n = 5 in panel [D]; n = 6 in panel [E]). Welch’s t-test. (F) Representative histological images of day 21 MSC pellets. COLII IHC, collagen type II immunohistochemistry; hOC, human osteochondral control. Scale bar = 100 µm. (B, D, F) Transgene ectopic expression of GRASLND. (C, E, F) CRISPR-dCas9-VP64-induced activation of GRASLND. ns, not significant (p>0.05).

Effect of GRASLND overexpression across time points and tested doses.
(A) Overview of designed lentiviral backbone. GRASLND is driven under a doxycycline-inducible promoter, and poly-adenylated with BGHpA signal. (B, C) Relative expression of GRASLND under different doses of doxycycline (Dox). Dox is most potent at 1 μg/mL under both conditions of TGF-β3 (n = 4). One-way ANOVA with Tukey post-hoc test (α = 0.05) were used. Groups of different letters are statistically different. (D–F) Biochemical analyses of MSC pellets cultured under chondrogenic condition with different doses of TGF-β3 (n = 3–4): 0.1 ng/mL (D), 1ng/mL (E) and 10 ng/L (F). Welch’s t-test was used. No bracket indicates that the comparison is not significant. LTR, long terminal repeat; BGHpA, bovine growth hormone polyadenylation signal; TRE/CMV, Tet responsible element fused with the minimal cytomegalovirus promoter; rtTA2, reverse tetracycline-controlled transactivator 2; IRES, internal ribosome entry site; PuroR, puromycin N-acetyl-transferase; SIN: Self inactivating.

Synthetic guide RNA screening for efficient activation of endogenous GRASLND.
Dunnett’s test compared to ‘No Guide’ control. ns, not significant. **, p<0.01; ***, p<0.001.

GRASLND suppresses interferon type II signaling.
(A) Top 20 up- and down-regulated genes in GRASLND KD pellets compared to scrambled controls. (B) Gene ontology analysis of affected pathways. (C) Upregulated targets and related gene ontology terms and potential transcription factors. (D,E) Luciferase reporter assays on MSCs transduced with: (D) ISRE promoter element (n = 3), or (E) GAS promoter element (n = 3). Two-way ANOVA followed by Tukey post-hoc test (α = 0.05). Groups of different letters are statistically different. (F) RNA pull-down followed by western blot (full bands are shown in Figure 5—figure supplement 2). (G) RNA immunoprecipitation confirmed EIF2AK2 as the binding partner of GRASLND (n = 2). (H) Biochemical assays on MSC-derived pellets cultured under 100 ng/mL of IFN-β (n = 4). (I) Biochemical assays on MSC-derived pellets cultured under 5 ng/mL of IFN-γ (n = 6). Welch’s t-test. ns, not significant.

Relationship between GRASLND and IFN.
(A) (B) IFN signal was upregulated in OA patients. Samples are indicated as disease state followed by patients’ age (GSE57218). (C) IFN was upregulated while GRASLND was downregulated in damaged cartilage. Samples are named by cartilage site followed by patients’ age (EMTAB-4304). (C) Inverse correlation between GRASLND and IFN-related genes (EMTAB-4304).

GRASLND enhances chondrogenesis in adipose-derived stem cells.
(A) Biochemical analyses (n = 5). (B) qRT-PCR analyses (n = 6). (C) Representative histological images of day 21 ASC pellets. COLII IHC, Collagen type II immunohistochemistry; hOC, Human osteochondral control. Scale bar = 100 µm. Welch’s t-test. ns, not significant.
Tables
Long non-coding RNA candidates shortlist.
| Gene symbol | Gene name | ENSEMBL gene ID | Relationship to MSC chondrogenesis | Relationship to SOX9 |
|---|---|---|---|---|
| LOXL1-AS1 | LOXL1 antisense RNA 1 | ENSG00000261801 | Correlated with MSC marker expression | Downregulated upon SOX9 overexpression |
| MIR4435-2HG gene synonym: MIR4435-1HG | MIR4435-2 host gene | ENSG00000172965 | Correlated with MSC marker expression | Downregulated upon SOX9 overexpression |
| HMGA2-AS1 gene synonym: RP11-366L20.2 | HMGA2 antisense RNA 1 | ENSG00000197301 | Correlated with MSC marker expression | Upregulated upon SOX9 overexpression |
| RNF144A-AS1 Referred to as GRASLND in this manuscript | RNF144A antisense RNA 1 | ENSG00000228203 | Correlated with chondrogenic marker expression | Upregulated upon SOX9 overexpression |
Top 5 enriched Cis-BP motifs and associated transcription factors for upregulated genes upon GRASLND knockdown.
| Transcription factor | Cis-BP motif* | Number of genes with enriched motifs/number of upregulated genes |
|---|---|---|
| STAT2 | 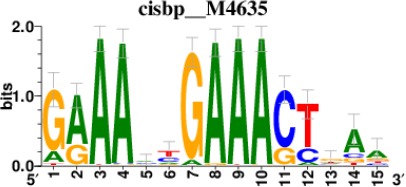 | 212/817 |
| IRF2 | 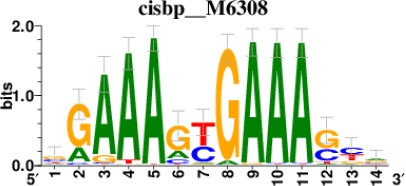 | 189/817 |
| IRF1 | 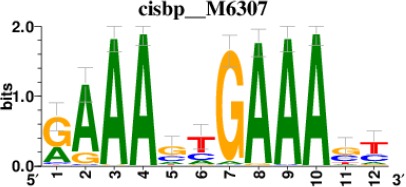 | 220/817 |
| IRF1 | 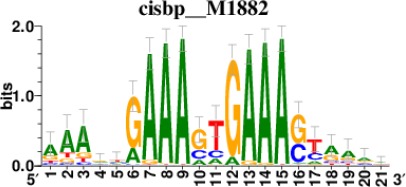 | 153/817 |
| STAT1 | 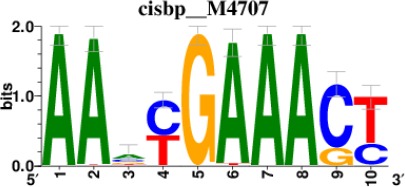 | 262/817 |
-
*Cis-BP: Catalogue of Inferred Sequence Preferences of DNA-Binding Proteins (Weirauch et al., 2014). Curated position weight matrices were retrieved from http://motifcollections.aertslab.org.
Additional files
-
Supplementary file 1
RNA-seq databases on MSC chondrogenesis (GSE109503) (Huynh et al., 2018b) and SOX9 overexpression in ASCs (GSE69110) (Ohba et al., 2015).
- https://cdn.elifesciences.org/articles/49558/elife-49558-supp1-v2.xlsx
-
Supplementary file 2
Differentially expressed genes with GRASLND knockdown as compared to scrambled control.
Data is expressed as log2FoldChange in KD compared to scrambled control (a positive log2FC means that the gene is upregulated in KD samples. A negative log2FC means that the gene is downregulated in KD samples).
- https://cdn.elifesciences.org/articles/49558/elife-49558-supp2-v2.xlsx
-
Transparent reporting form
- https://cdn.elifesciences.org/articles/49558/elife-49558-transrepform-v2.docx


