Alpha/beta power decreases track the fidelity of stimulus-specific information
- University of Birmingham, United Kingdom
- University of Nottingham, United Kingdom
- École Polytechnique Fédérale de Lausanne, Switzerland
Figures
Figure 1
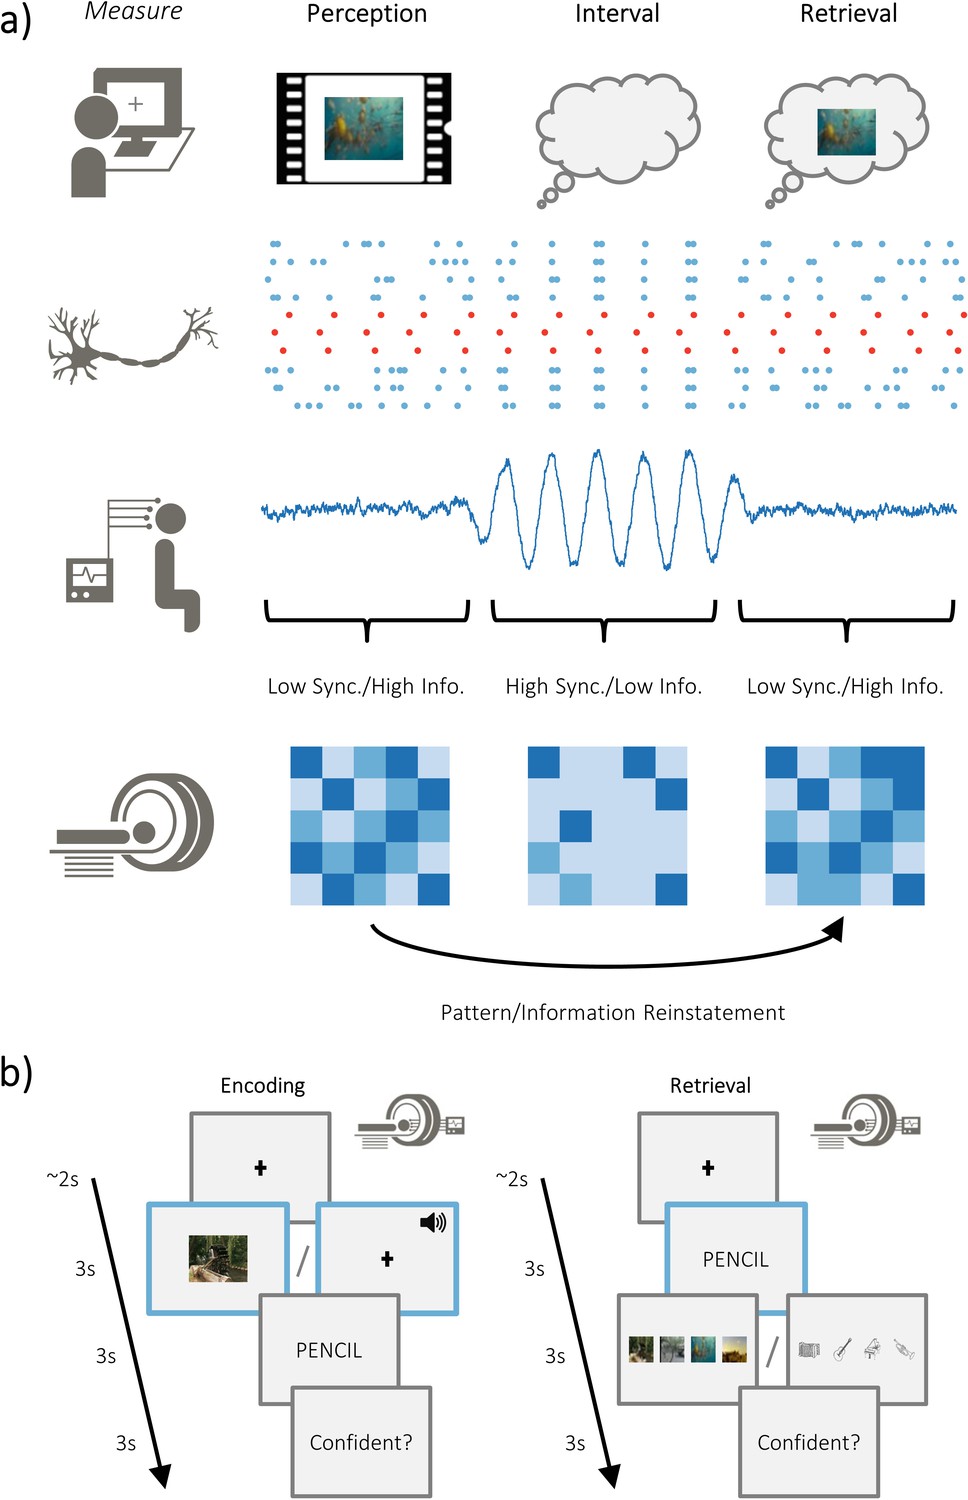
Overview of hypotheses and paradigm.
(a) The brain is capable of representing stimulus-specific information through neural patterns that are consistent regardless of whether the stimulus is externally or internally generated (i.e. perceived or retrieved; top). On a neuronal level, populations that code for the stimulus (in red) need to generate signal greater than ongoing neuronal noise (in blue). When the neuronal noise correlates (i.e. arises at the same time; during the ‘interval’), the signal-to-noise ratio is reduced and stimulus specific information is limited. These noise correlations may be reflected in macroscopic measures of electrophysiological activity, where periods of highly synchronised firing is accompanied by periods of high amplitude activity. Under this assumption, high amplitude activity would reflect an attenuation of the processing of stimulus-specific information. Stimulus-specific information can be measured using fMRI to look at pattern similarity during perception and pattern reinstatement during memory retrieval. (b) Participants completed an associative memory task while undergoing simultaneous EEG-fMRI recordings. Participants were asked to vividly associate a video/melody with a word, and then rate how plausible (i.e. believable) the imagined association was. Later, they were cued with the word and tasked with recalling the associated video/melody. After selecting the associated video/melody, they were asked to judge how confident they felt about their decision. The modality of the dynamic stimuli alternated at the end of each block (counterbalanced across participants).
Figure 2 with 2 supplements
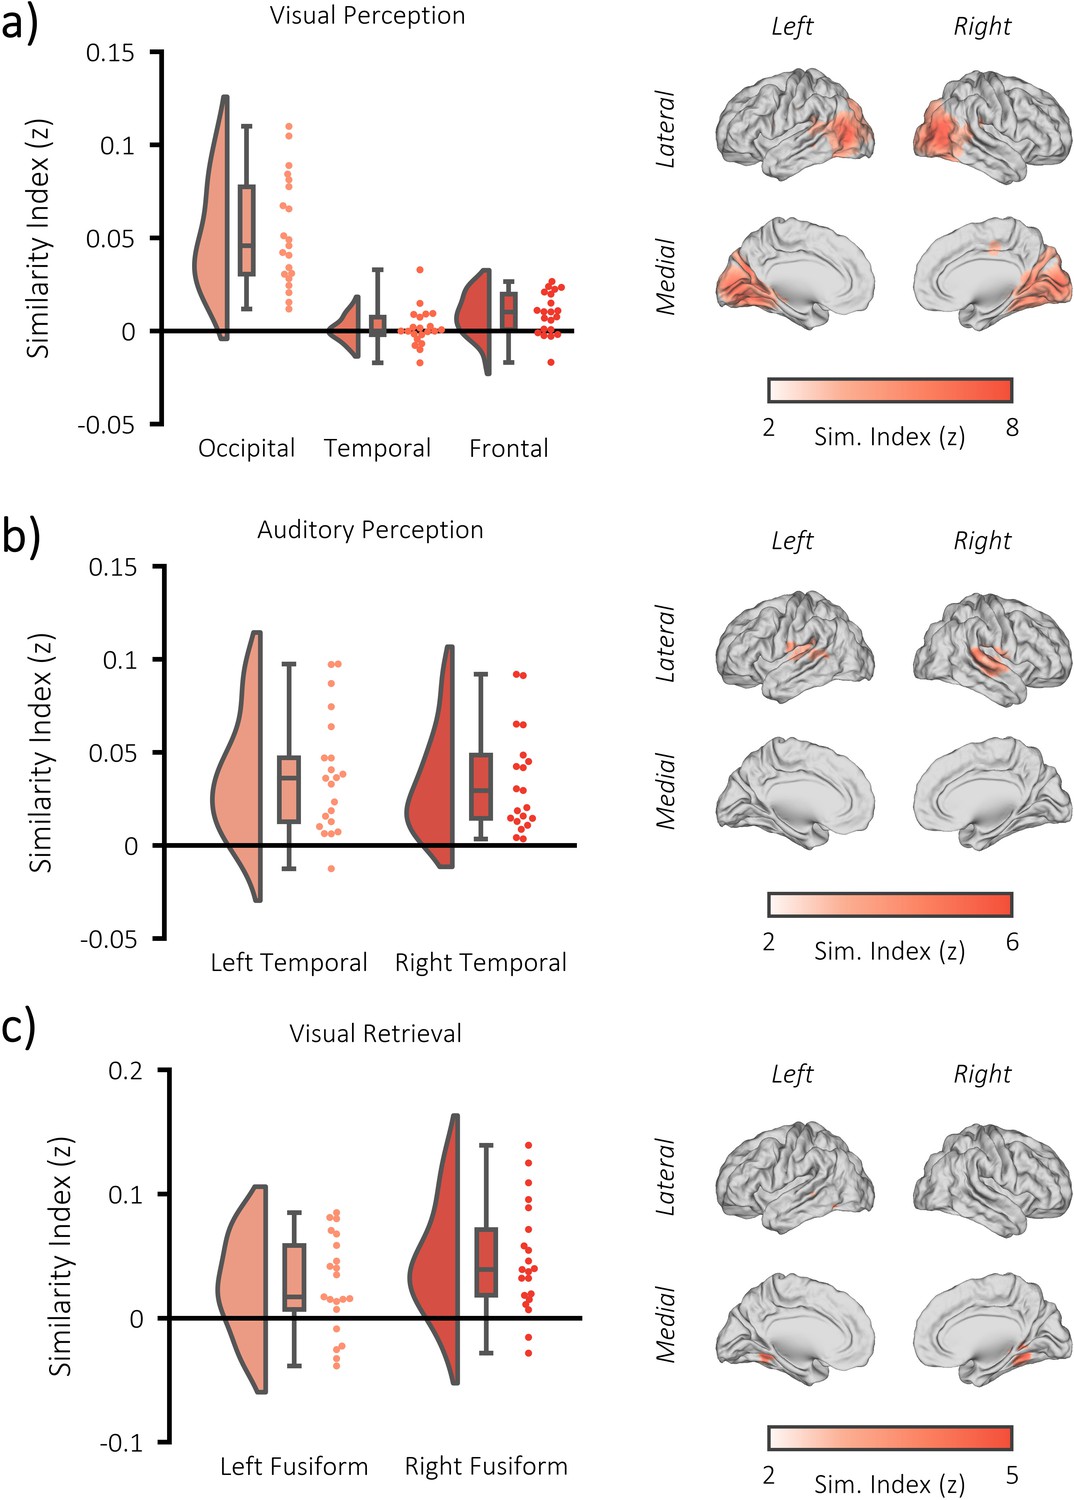
fMRI RSA searchlight analysis.
(a) raincloud plot (left) depicting the degree to which matching and differing stimuli could be distinguished from one another during visual perception, per participant (single dots), within the significant cluster, and brain map (right) depicting the cluster where matching and differing stimuli could be distinguished from one another. (b) raincloud plot (left) and brain map (right) for stimulus discriminability during auditory perception. (c) raincloud plot (left) and brain map (right) for stimulus discriminability during visual memory retrieval.
Figure 2—figure supplement 1
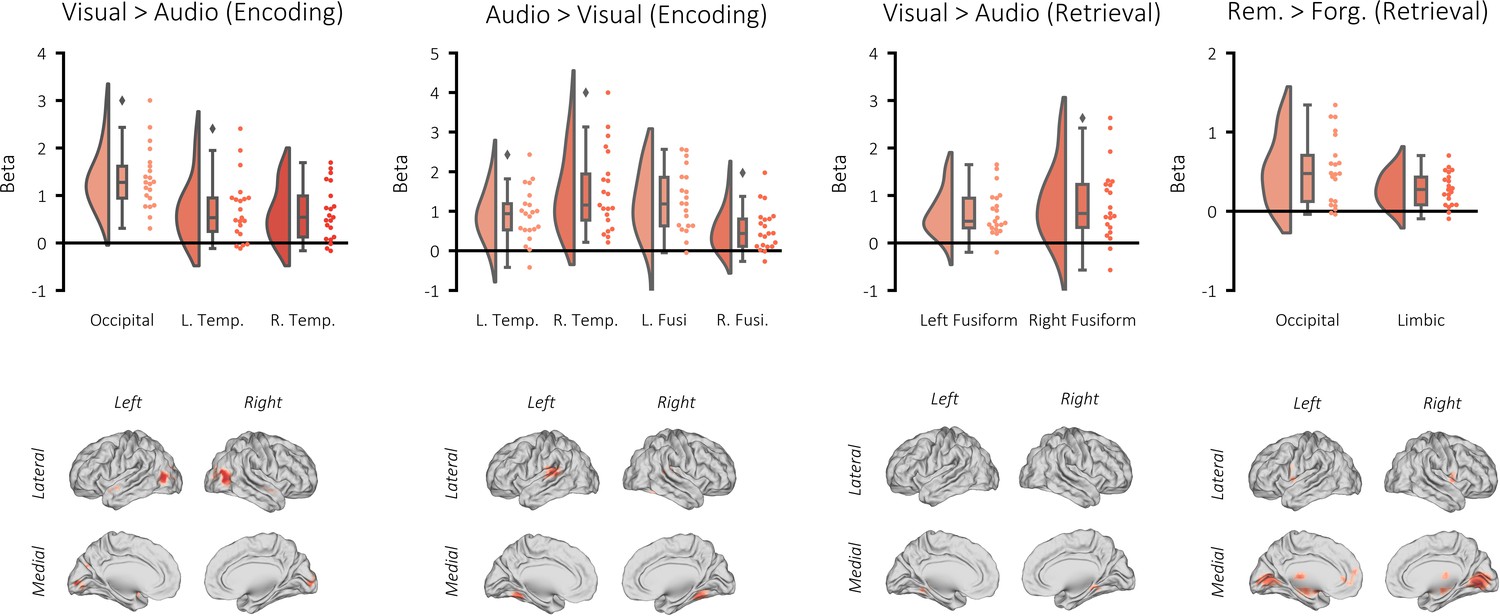
Univariate BOLD contrasts.
Top: raincloud plots depicting the contrasted beta weights for each participant. Bottom: brain maps depicting the clusters revealed from the contrasts (non-significant voxels masked). A GLM was created per participant where these events were modelled as stick functions that had been convolved with a canonical hemodynamic response function (HRF). In addition, a regressor modelling button presses, six movement regressors and eight regressors modelling each run were added to the GLM. The derived beta weights for visual perception and auditory perception were then contrasted. The resulting contrast image of each participant was statistically appraised in a one-sample t-test across participants. Using a cluster-forming threshold of puncorr <0.001 and k = 10, three significant clusters showed greater activation during visual perception relative to auditory perception: one in the occipital lobe (pFWE <0.001, k = 975, MNI [x = 42, y = −70, z = 10], Cohen’s d = 2.09), one in the left temporal pole (pFWE = 0.008, k = 67, MNI [x = −48, y = 2, z = −10], Cohen’s d = 1.06), and one in the right temporal pole (pFWE = 0.005, k = 72, MNI [x = 48, y = 5, z = −14], Cohen’s d = 1.11). Four significant clusters showed greater activation during auditory perception relative to visual perception: two bilaterally in the auditory cortex (left: pFWE <0.001, k = 324, MNI [x = −63, y = −31, z = 14], Cohen’s d = 1.35; right: pFWE <0.001, k = 217, MNI [x = 60, y = −31, z = 14], Cohen’s d = 1.47), and two bilaterally in the fusiform gyrus (left: pFWE <0.001, k = 112, MNI [x = −24, y = −49, z = 14], Cohen’s d = 1.18; right: pFWE <0.001, k = 203, MNI [x = 27, y = −49, z = −18], Cohen’s d = 1.00). Two significant clusters showed greater activation during visual retrieval relative to auditory retrieval: one in the left fusiform gyrus (pFWE = 0.001, k = 89, MNI [x = 21, y = −37, z = −14], Cohen’s d = 1.05), and one in the right temporal pole (pFWE = 0.001, k = 99, MNI [x = −30, y = −46, z = −6], Cohen’s d = 1.33). No clusters showed greater activation during auditory retrieval relative to visual retrieval. Two significant clusters showed greater activation during successful visual memory retrieval relative to unsuccessful visual memory retrieval: one in the occipital lobe (pFWE <0.001, k = 1178, MNI [x = 12, y = −52, z = −14], Cohen’s d = 1.21), and one spanning the limbic system, including the hippocampus (pFWE <0.001, k = 1447, MNI [x = −21, y = −16, z = 2], Cohen’s d = 1.33). No clusters showed greater activation during successful auditory memory retrieval relative to unsuccessful auditory memory retrieval.
Figure 2—figure supplement 2
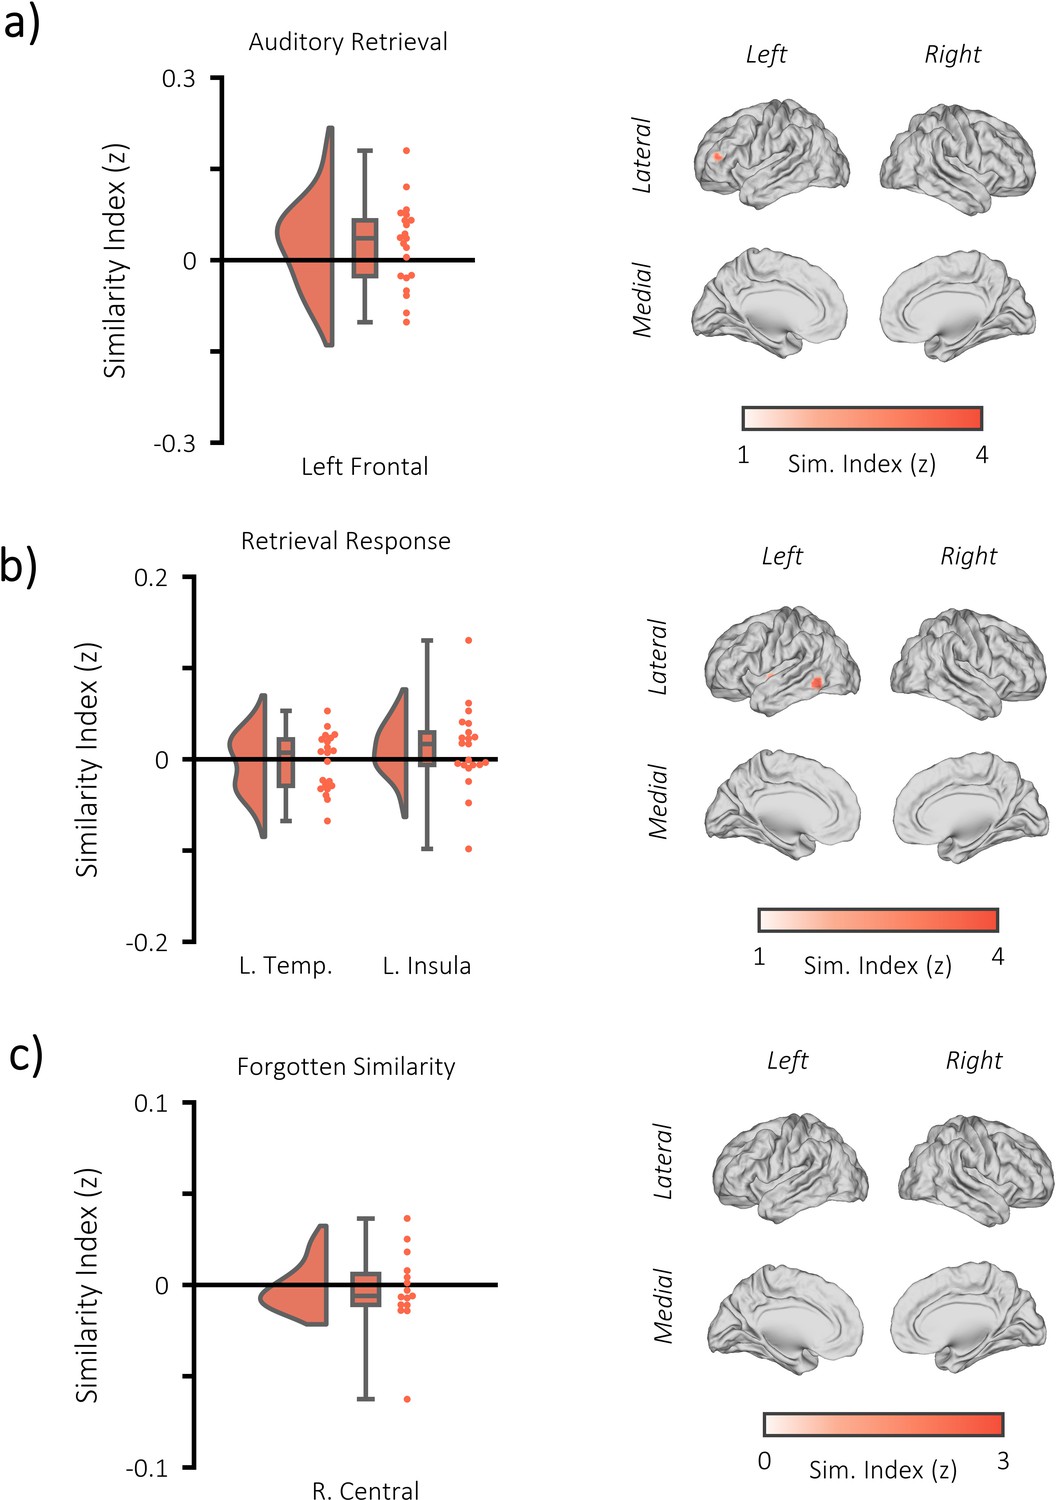
Additional fMRI RSA searchlight analysis.
(a) raincloud plot (left) depicting the degree to which matching and differing stimuli could be distinguished from one another during auditory memory retrieval, per participant (single dots), within the significant cluster, and brain map (right) depicting the cluster where matching and differing stimuli could be distinguished from one another. The left frontal cluster did not pass threshold to be deemed statistical significant (p=0.153, k = 28, MNI = [x = −39, y = 44, z = 14]). (b) raincloud plot (left) and brain map (right) for stimulus discriminability during the response period of the memory retrieval task (when still images of the stimuli were presented on screen [approximately 3 s after the retrieval cue]). Two significant clusters were identified (left temporal: p=0.002, k = 70, MNI = [x = −39, y = 44, z = 14], Cohen’s dz = 0.12; left insula: [=0.013, k = 49, MNI = [x = −36, y = −4, y = −2], Cohen’s dz = 0.27). However, neither overlapped with the fusiform clusters identified during the moment of visual memory retrieval, suggesting the still images did not drive the reported encoding-retrieval pattern similarity effect. (c) raincloud plot (left) and brain map (right) for encoding-retrieval similarity of forgotten stimuli. One cluster was formed, but did not pass threshold for significance (right central: p=0.681, k = 13, MNI = [x = 39, y = −7, z = 66], Cohen’s dz = 0.13).
Figure 3 with 1 supplement
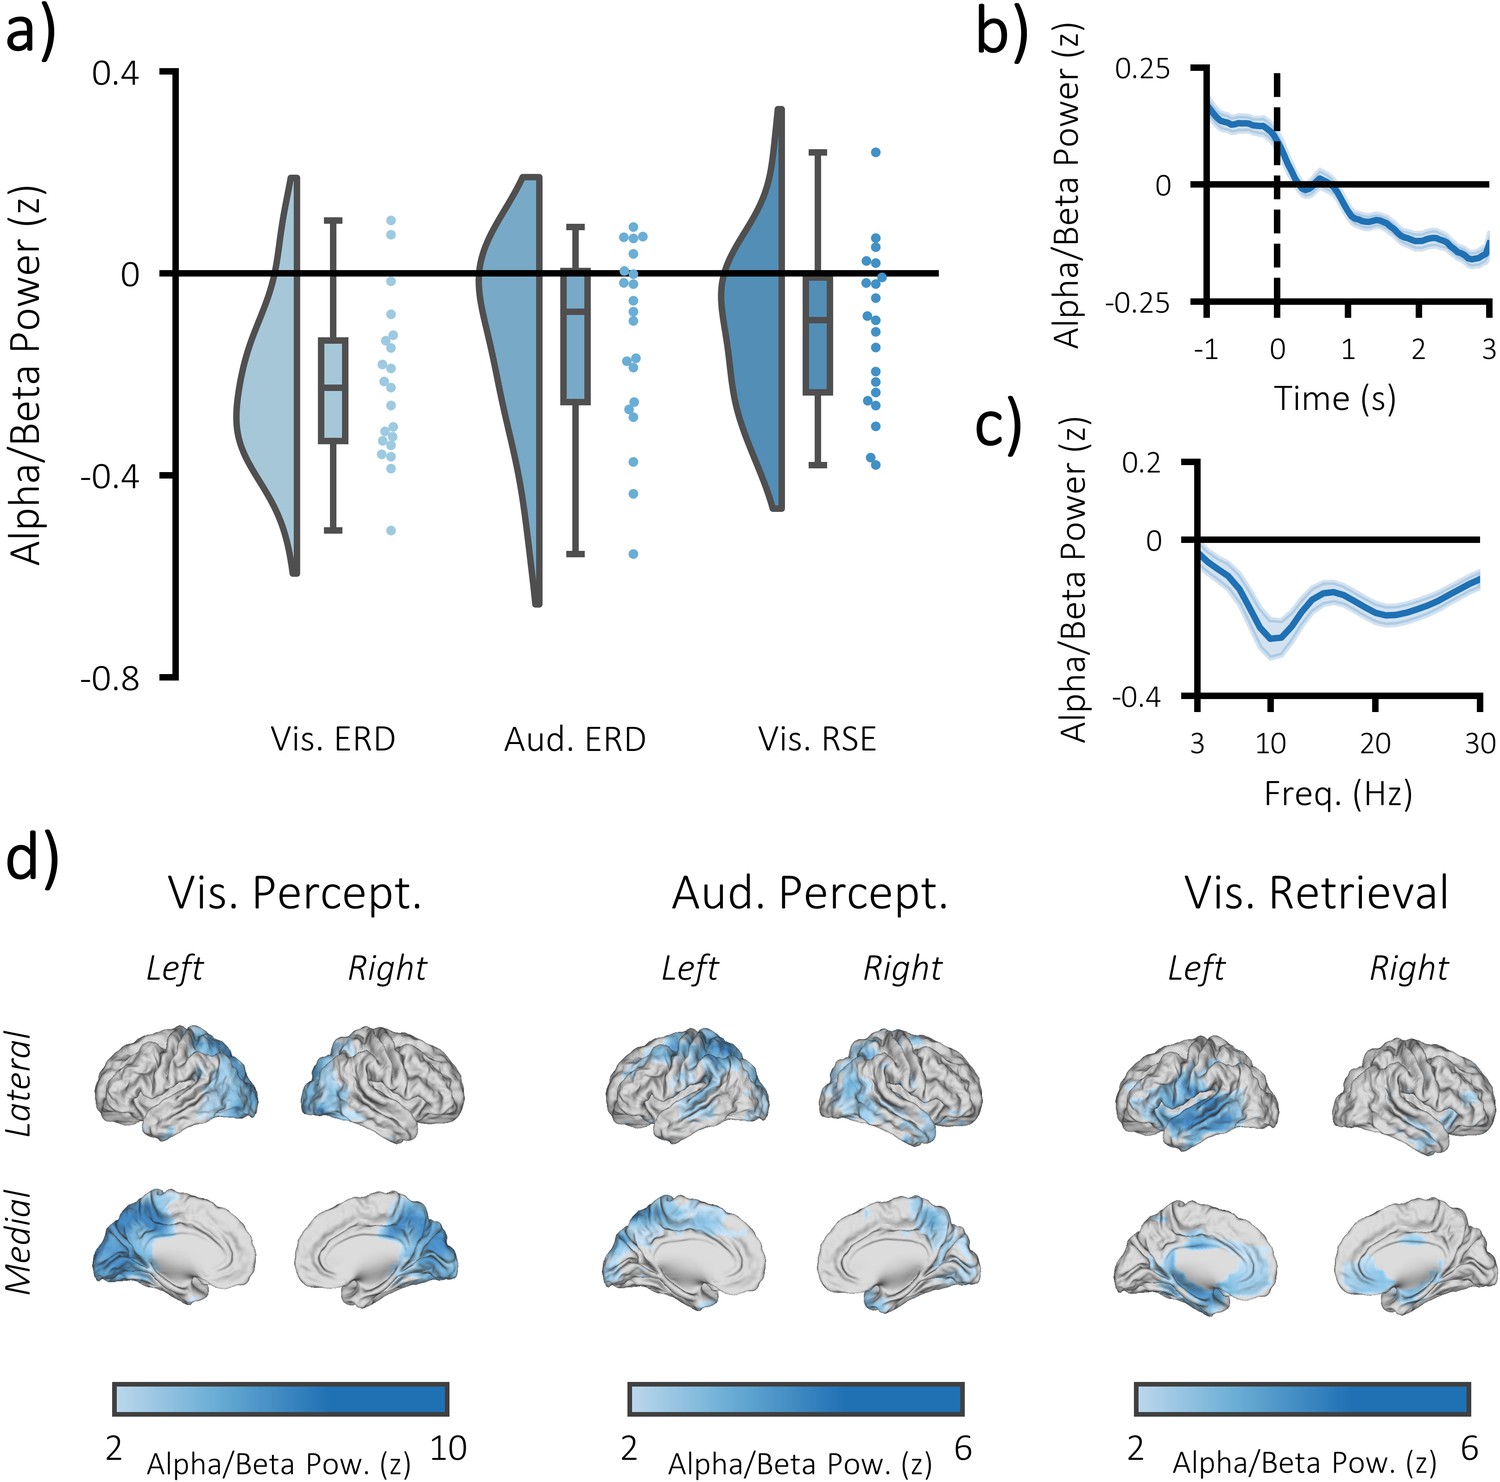
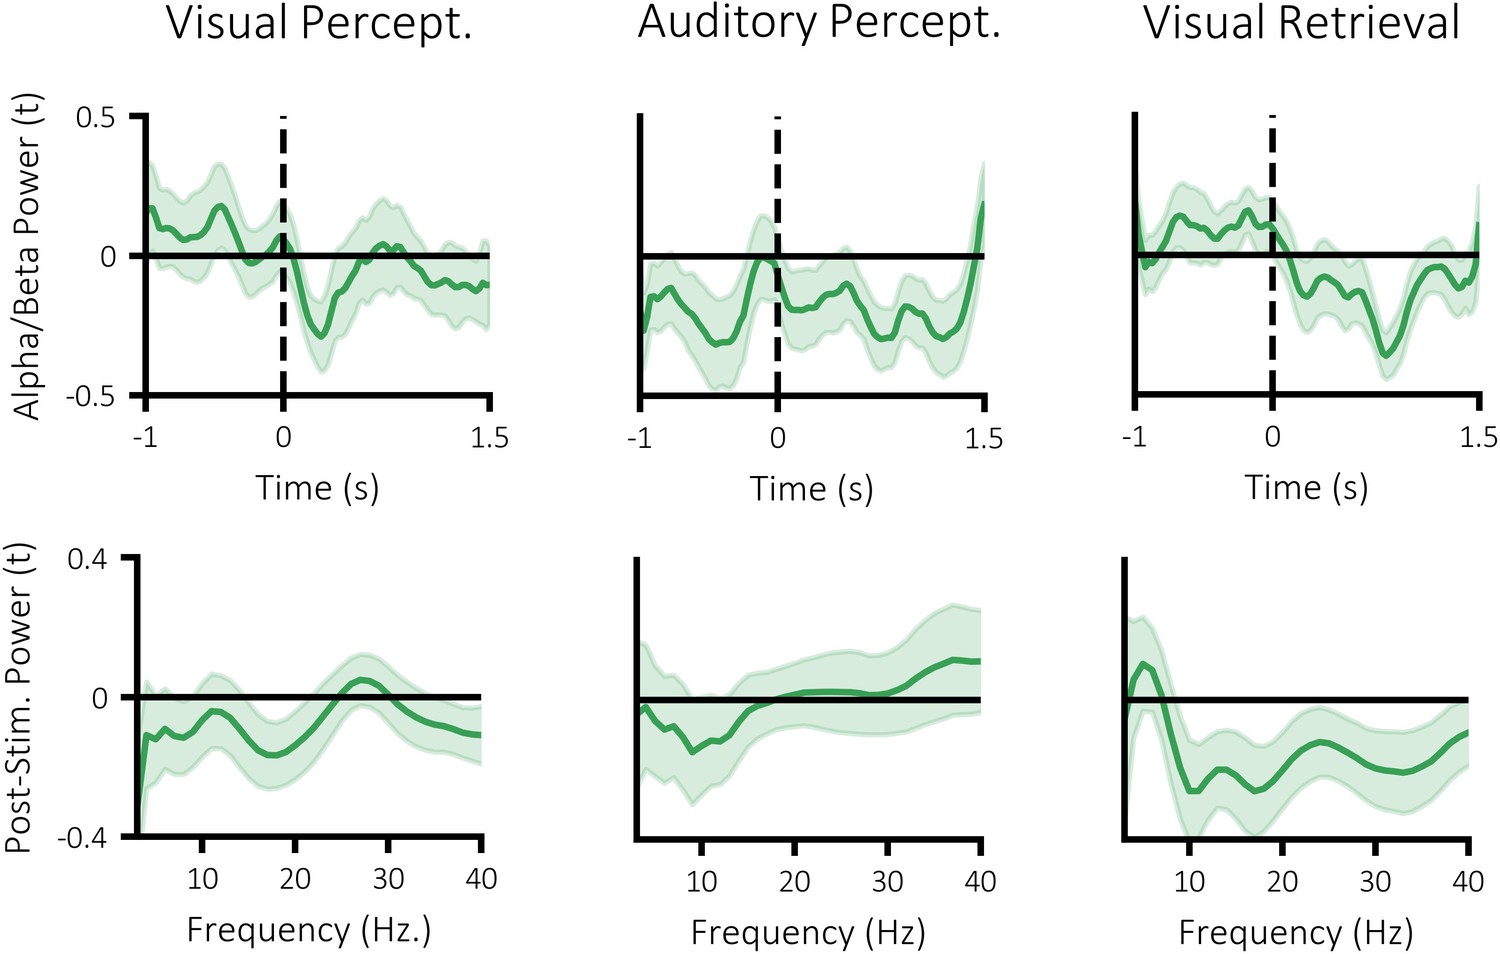
Task-induced decreases in post-stimulus alpha/beta power.
(a) Raincloud plot displaying event-related decreases in power during visual perception (left) and auditory perception (middle), and memory-related decreases in power during visual retrieval (each dot represents a single subject). (b) time-series of alpha/beta (8–30 Hz) power change over time across all three tasks (see Figure 3—figure supplement 1 for each task individually). The dark line indicates the mean across participants; the shaded error bar represents standard error of the mean [N.B. as the electrodes were chosen because they belonged to the significant cluster, these figures are for descriptive purposes only and should not be used for statistical inference]. (c) frequency spectrum of post-stimulus power across all three tasks (500–1500 ms; referenced to −1000 to −375 ms pre-stimulus power). The dark line indicates the mean across participants; the shaded error bar represents standard error of the mean (see Figure 3—figure supplement 1 for each task individually). (d) brain maps of the event-related (left/middle) and memory-related (right) differences in alpha/beta power.
Figure 3—figure supplement 1
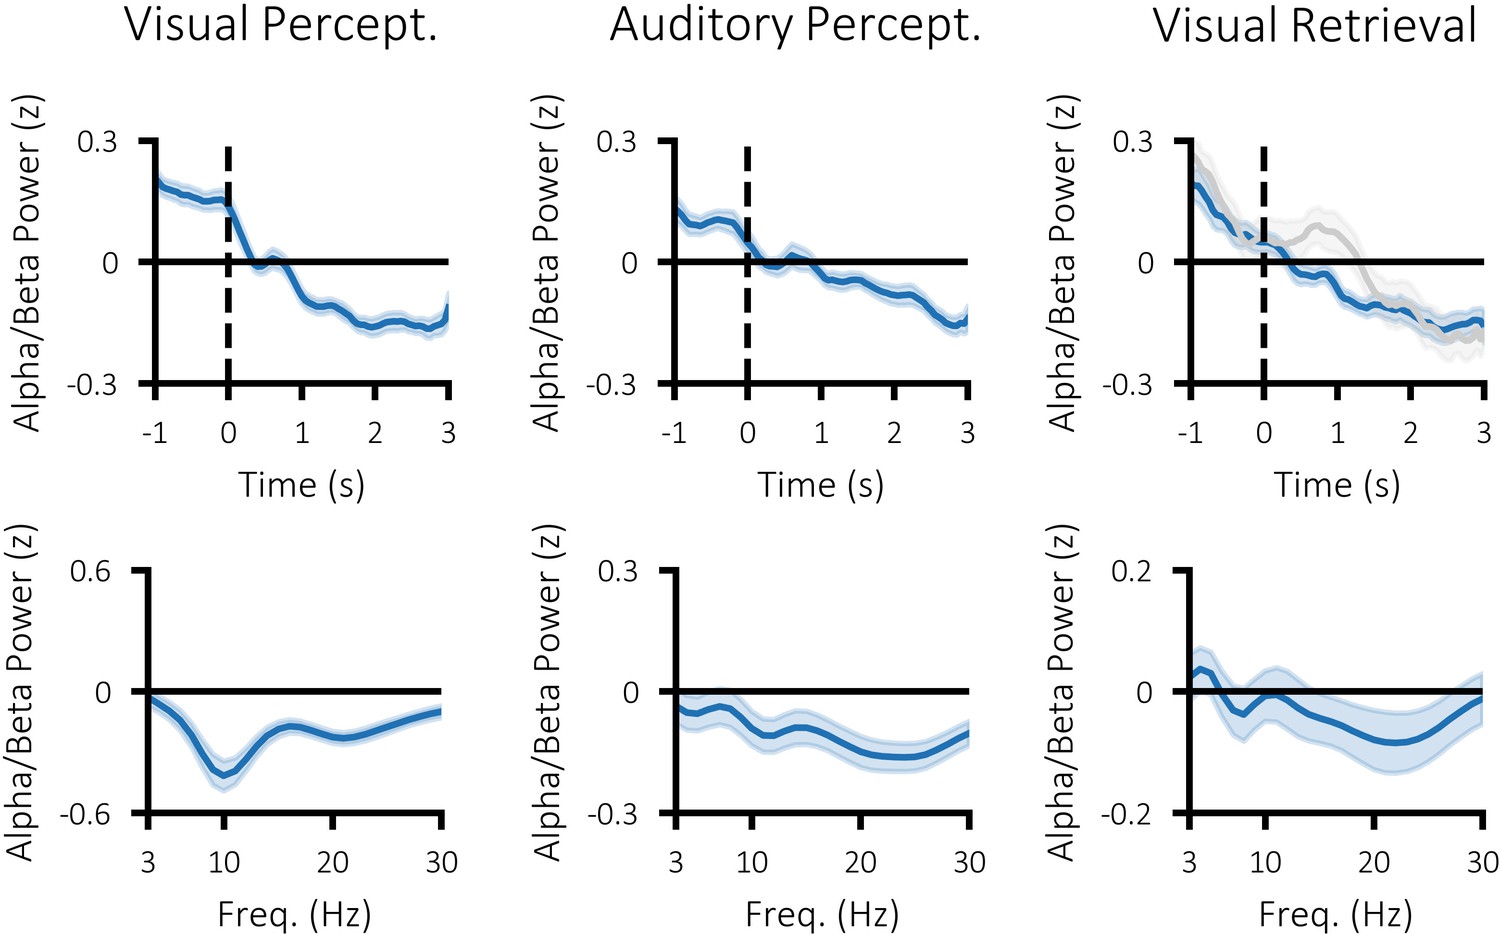
Time-series (top) and difference in spectral power (bottom) for visual perception (left; post-stimulus >pre stimulus), auditory perception (middle; post-stimulus >pre stimulus) and visual memory retrieval (right; hits > misses).
Dark blue line indicates mean power across participants and shaded area indicates standard error of the mean. The grey line in the top right plot depicts the time-course for forgotten items.
Figure 4 with 6 supplements
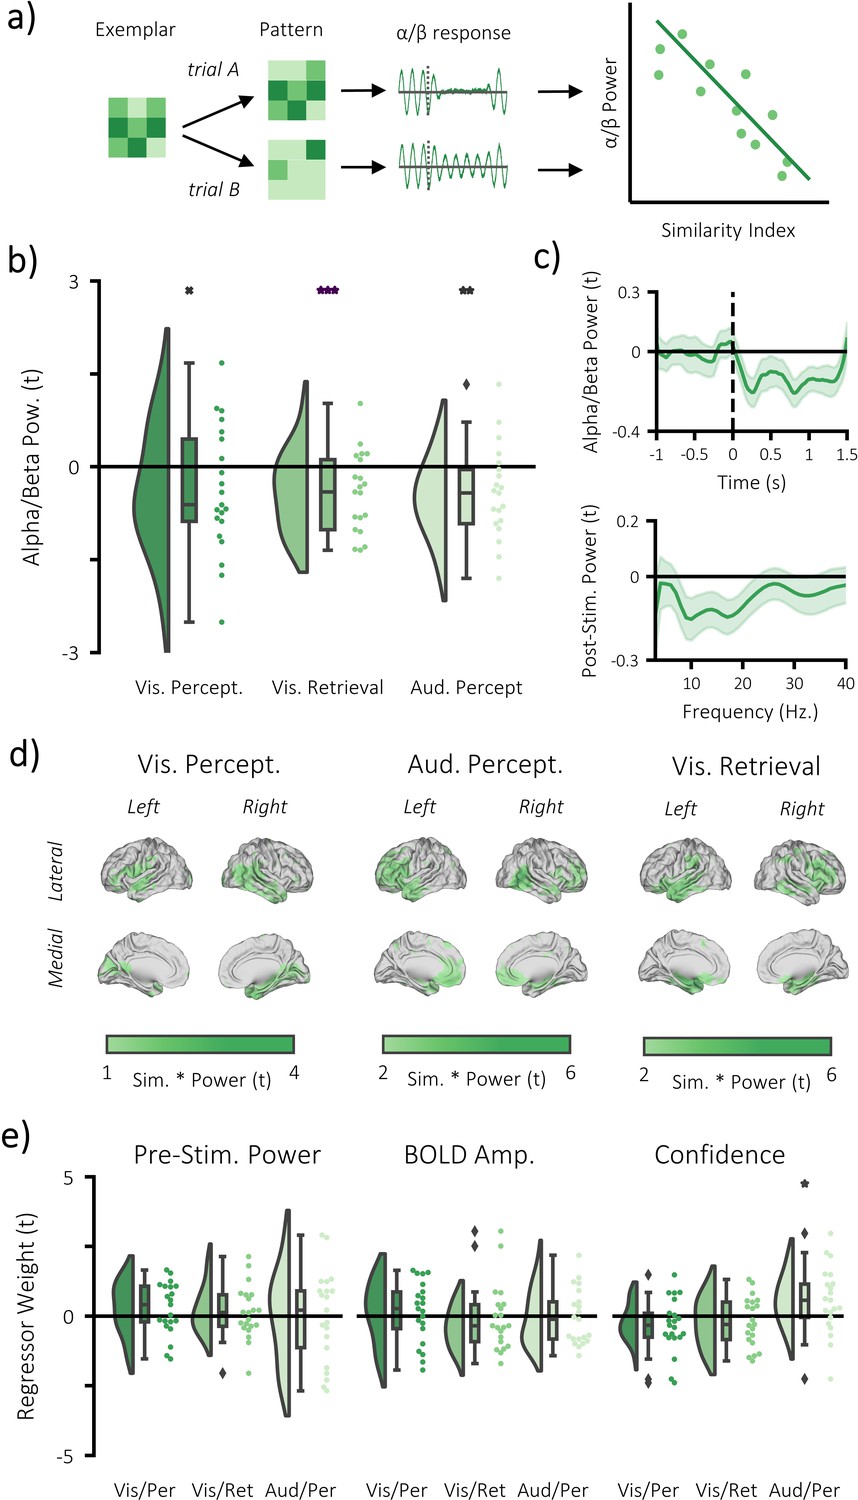
Alpha/beta power decreases track the fidelity of stimulus-specific information.
(a) infographic depicting hypotheses and analytical approach. We anticipated that the more a pattern represented matching stimuli relative to differing stimuli, the greater the post-stimulus decrease in alpha/beta power would be. (b) Raincloud plot displaying the correlation between alpha/beta power and stimulus-specific information during visual perception, visual memory retrieval and auditory perception (each dot represents a single participant; xp = 0.054, **p<0.01, ***p<0.001). (c) temporal (top) and spectral (bottom) specificity of the correlation between stimulus-specific information and alpha/beta power across all tasks (see Figure 4—figure supplement 2 for each task individually). A value below zero indicates a negative correlation between variables. The negative relationship becomes apparent after stimulus onset (time = 0) within the frequency range 8–30 Hz. (d) brain map of the correlation between alpha/beta power at each virtual electrode with the measure of stimulus-specific information during visual perception, auditory perception and visual retrieval. (e) Raincloud plot displaying the correlation between stimulus-specific information and additional regressors ‘pre-stimulus alpha/beta power’, ‘BOLD amplitude’, and ‘confidence rating’ for each task (each dot represents a single participant; *p<0.05).
Figure 4—figure supplement 1
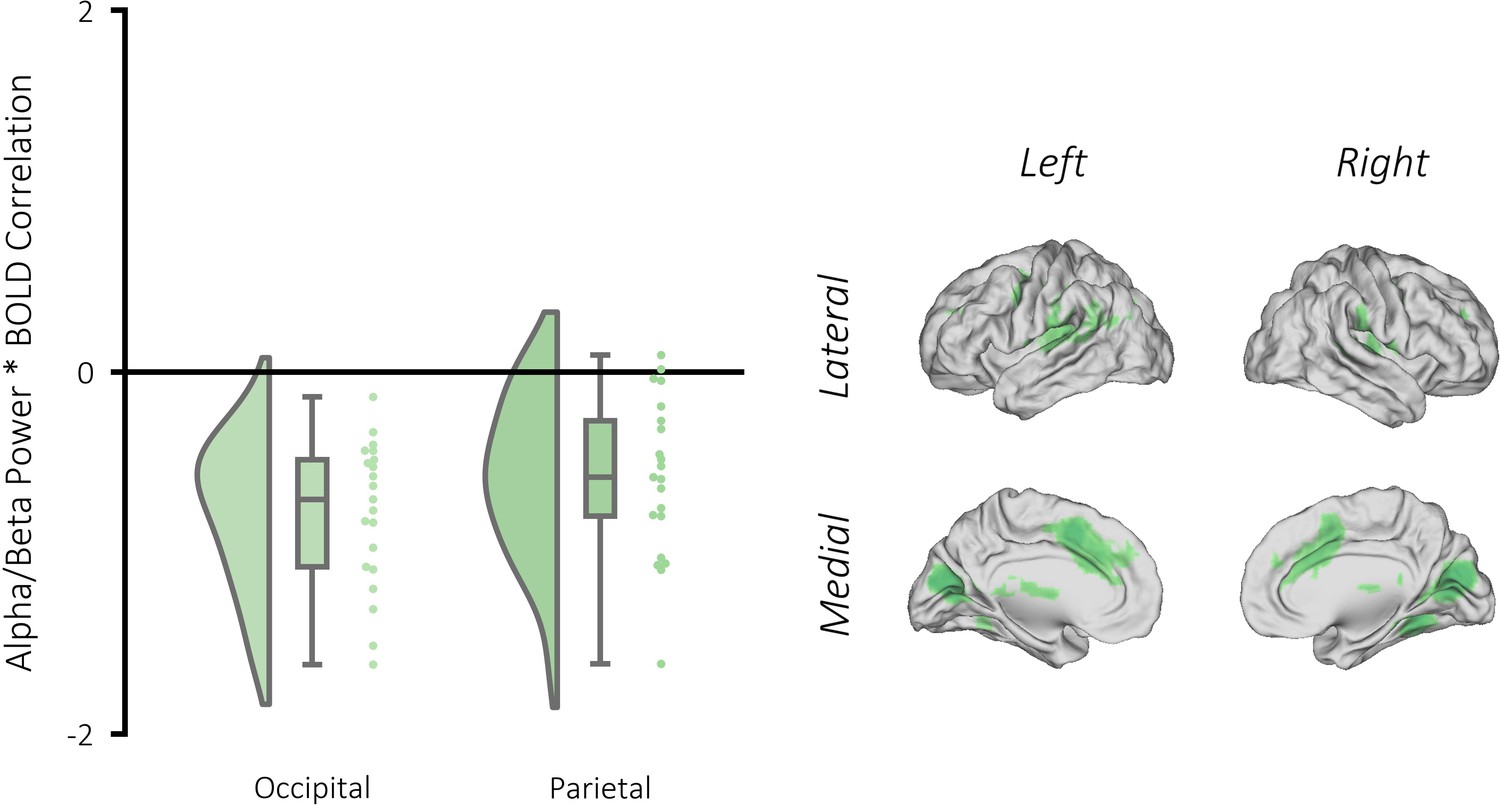
Correlation between alpha/beta power and BOLD signal during visual memory retrieval.
Left: raincloud plot depicting significant clusters identified when contrasting beta weights (remembered >forgotten) for each participant. Right: brain map depicting the clusters where alpha/beta power negatively correlated with BOLD for remembered items (relative to forgotten items). A GLM was created as in Figure 2—figure supplement 1 with one key exception: the binary stick functions used in the earlier GLM were replaced with parametric values dictated by alpha/beta power observed on that trial. These parametric values were calculated by convolving the source-reconstructed EEG data with a 6-cycle wavelet (−1 to 3 s, in steps of 25 ms; 8 to 30 Hz; in steps of 0.5 Hz). The resulting data were z-transformed using the mean and standard deviation of power across time and trials (for each condition separately). Then, the data were restricted to the time/frequency window of interest (500–1500 ms post-stimulus, 8–30 Hz) and then averaged across this window and across all virtual electrodes within the brain to return a single value of alpha/beta power per trial. Trials that were removed during preprocessing due to artifact contamination were given the value 0. The statistical approach matched that of the Univariate fMRI analysis section. We uncovered two significant clusters where there was a greater negative relationship between BOLD and alpha/beta power for successfully recalled trials relative to forgotten trials: one in the occipital lobe (pFWE <0.001, k = 5183, MNI [x = −6, y = −76, z = 14], Cohen’s d = 1.94), and the other in the parietal lobe (pFWE <0.001, k = 139, MNI [x = 39, y = −40, z = 38], Cohen’s d = 1.33).
Figure 4—figure supplement 2
Specificity of power-similarity correlation across time (top) and frequency (bottom).
Dark line indicates mean across participants and shaded area indicates standard error of the mean. A negative value indicates a negative relationship between power and stimulus-specific information. All analyses were conducted on an a priori window ranging from 8 to 30 Hz, 500 to 1500 ms post-stimulus.
Figure 4—figure supplement 3
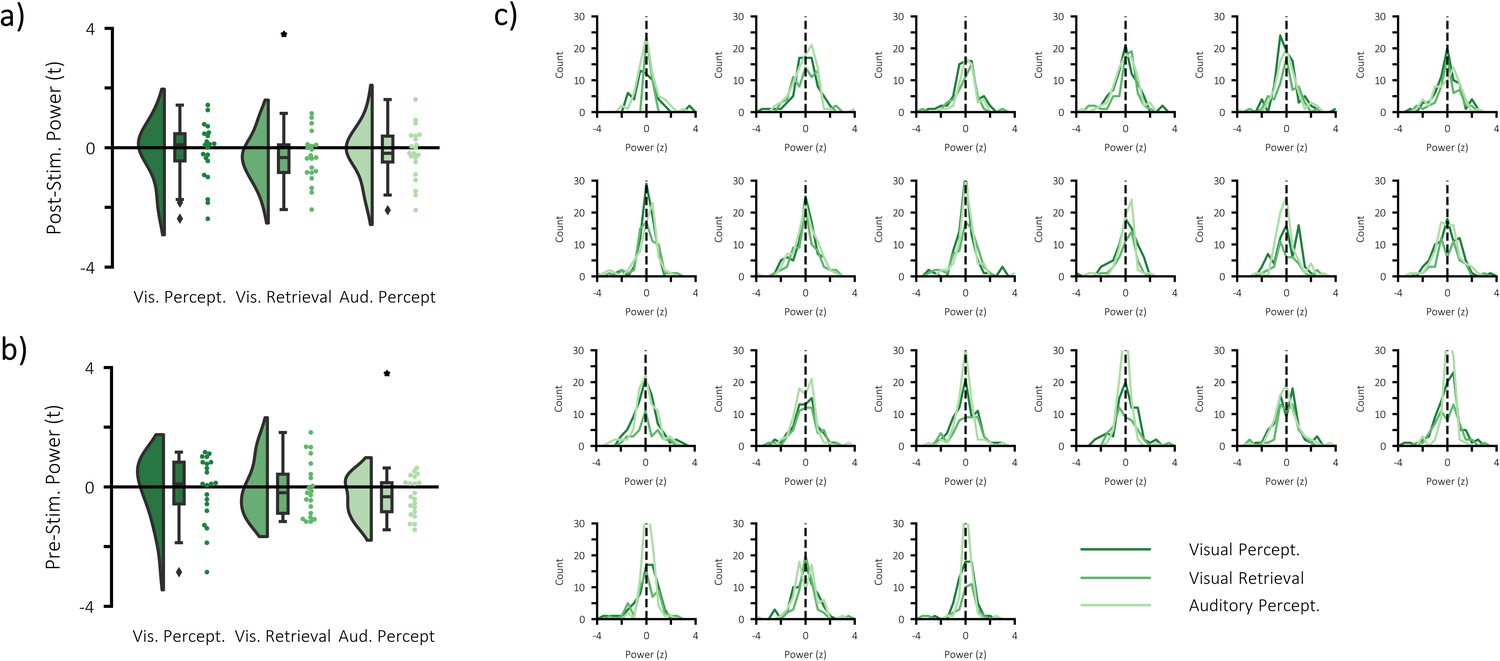
Investigating bimodal alpha power and stimulus-specific information.
(a) Raincloud plot displaying the correlation between median-split post-stimulus alpha/beta power and stimulus-specific information during visual perception (each dot represents a single participant). Only during visual memory retrieval was an effect observed (p=0.045, Cohen’s dz = 0.39). Given the absence of a similar effect in the perceptual tasks, this effect may reflect an idiosyncrasy of the retrieval task such as bimodally-distributed power relating to recollection vs. familiarity. (b) Raincloud plot displaying the correlation between median-split pre-stimulus alpha/beta power and stimulus-specific information during visual perception (each dot represents a single participant). Only during auditory perception was an effect observed (p=0.037, Cohen’s dz = 0.49). (c) single participant plots of the distribution of post-stimulus alpha/beta power across trials for the three conditions. The overarching trend is a singular peak around zero, indicating a unimodal distribution.
Figure 4—figure supplement 4
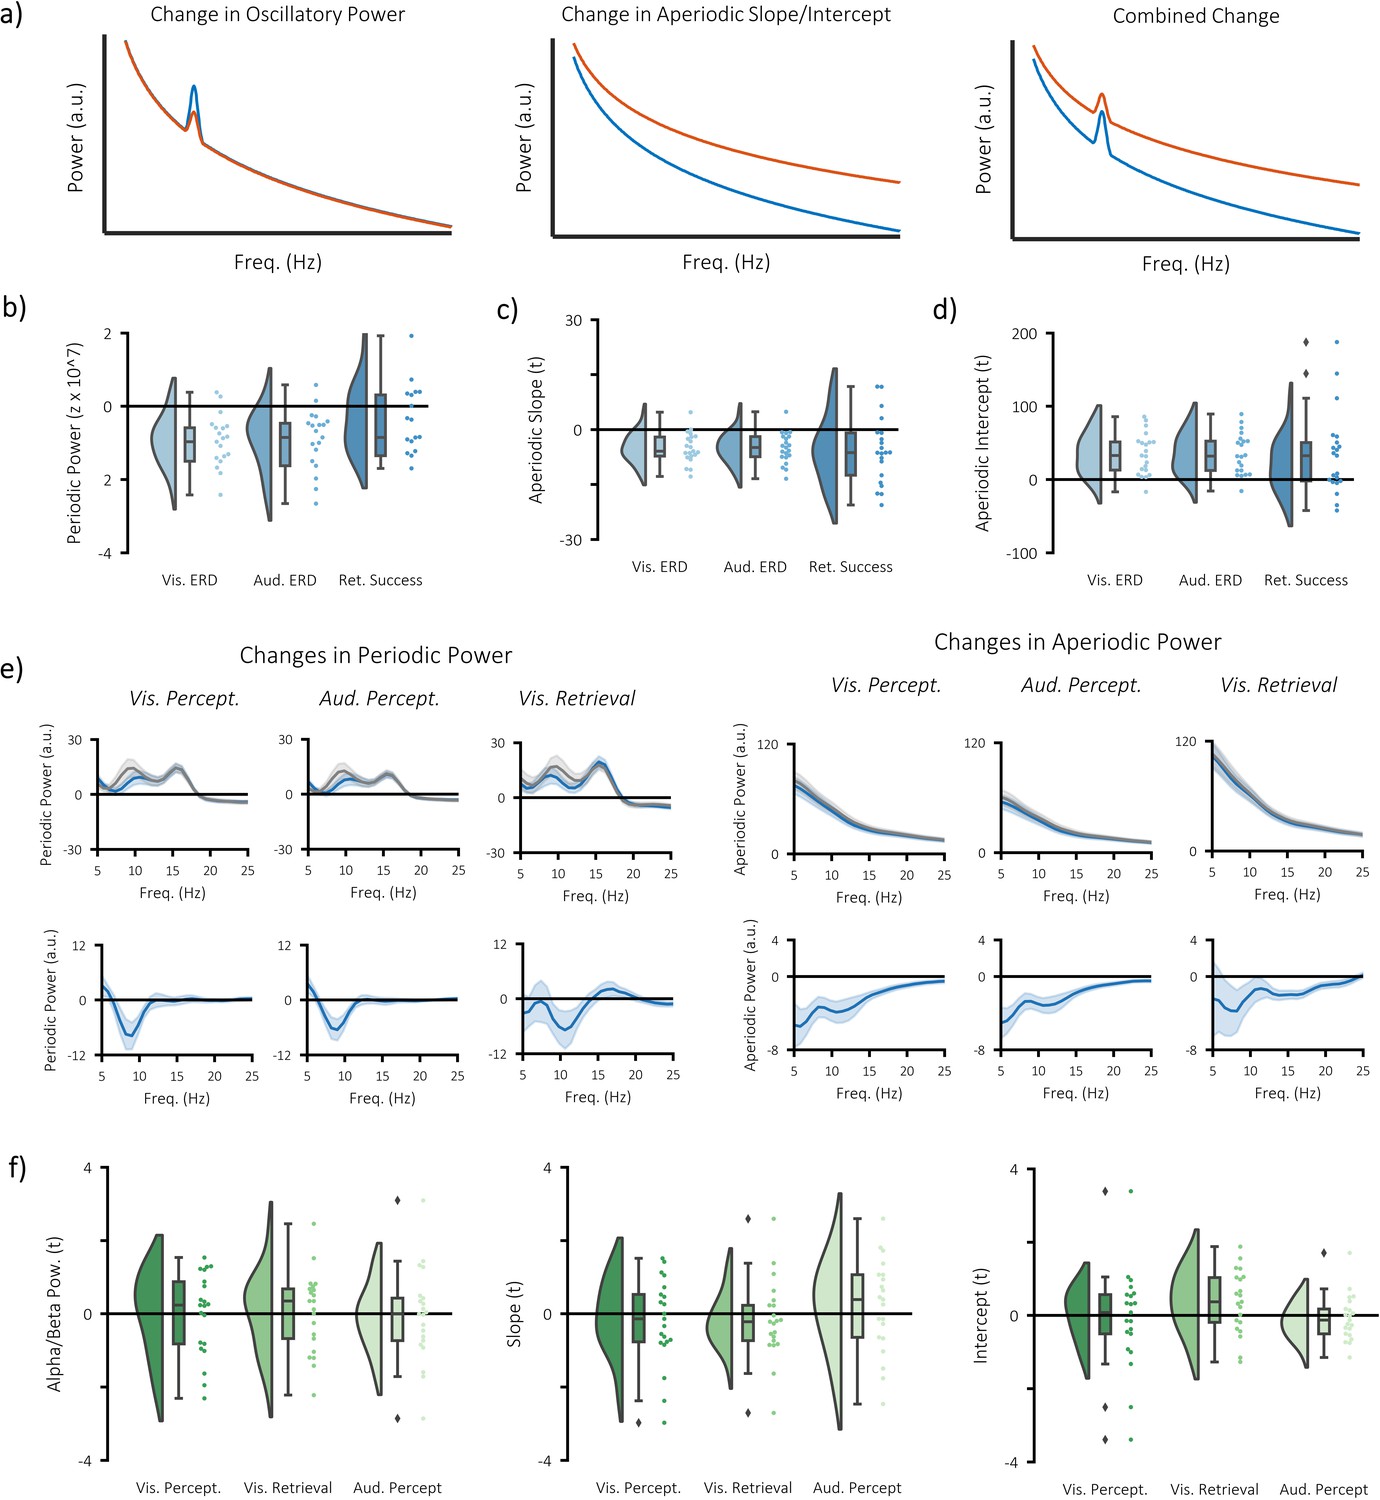
Separate contributions of periodic and aperiodic signal to event-related decreases in power.
(a) wavelet-based time-frequency analytical approaches can detect changes in power that are oscillatory (left), aperiodic (middle), or a combination of the two (right). As a consequence, it becomes difficult to infer what a change in power reflects on a neural level. Methods such as the irregular-resampling auto-spectral analysis (IRASA) separates the power spectrum into periodic components (which reflects oscillatory activity) and aperiodic components (which reflect dynamics of the 1/.f phenomenon). By separating these components, we can identify whether changes in power are a result of changes in oscillatory activity or the 1/f characteristic. (b) significant decreases in periodic alpha/beta power (8–25 Hz) were observed during visual perception (p<0.001, Cohen’s dz = 0.55), auditory perception (p<0.001, Cohen’s dz = 0.46), and visual memory retrieval (p<0.001, Cohen’s dz = 0.48). (c) significant decreases in the slope of the aperiodic signal (i.e. a flattening of the 1/f curve) were observed during visual perception (p=0.002, Cohen’s dz = 0.68), auditory perception (p=0.011, Cohen’s dz = 0.67), but not during visual memory retrieval (p=0.123, Cohen’s dz = 0.52). (d) significant increases in the intercept of the aperiodic signal were observed during visual perception (p=0.002, Cohen’s dz = 0.73) and auditory perception (p=0.049, Cohen’s dz = 0.61), but not during visual memory retrieval (p=0.356, Cohen’s dz = 0.54). (e) frequency spectra for periodic (left) and aperiodic (right) signals. Plots on the top compare post-stimulus (blue) power with pre-stimulus (grey) power during visual/auditory perception and hits (blue) with misses (grey) during visual retrieval. Plots on the bottom depict the difference between the blue and the grey bars. Note that the ~16 Hz peak in the oscillatory signal is mostly likely produced by the MRI scanner, which collected a new slice 16 times a second. The peak could not be filtered out as done so with the wavelet data because the filtering impairs the fractal fit. (f) correlation between stimulus-specific information and periodic (left) and aperiodic (middle/right) measures of power. No significant relationship was observed in any of the measures or any of the tasks.
Figure 4—figure supplement 5
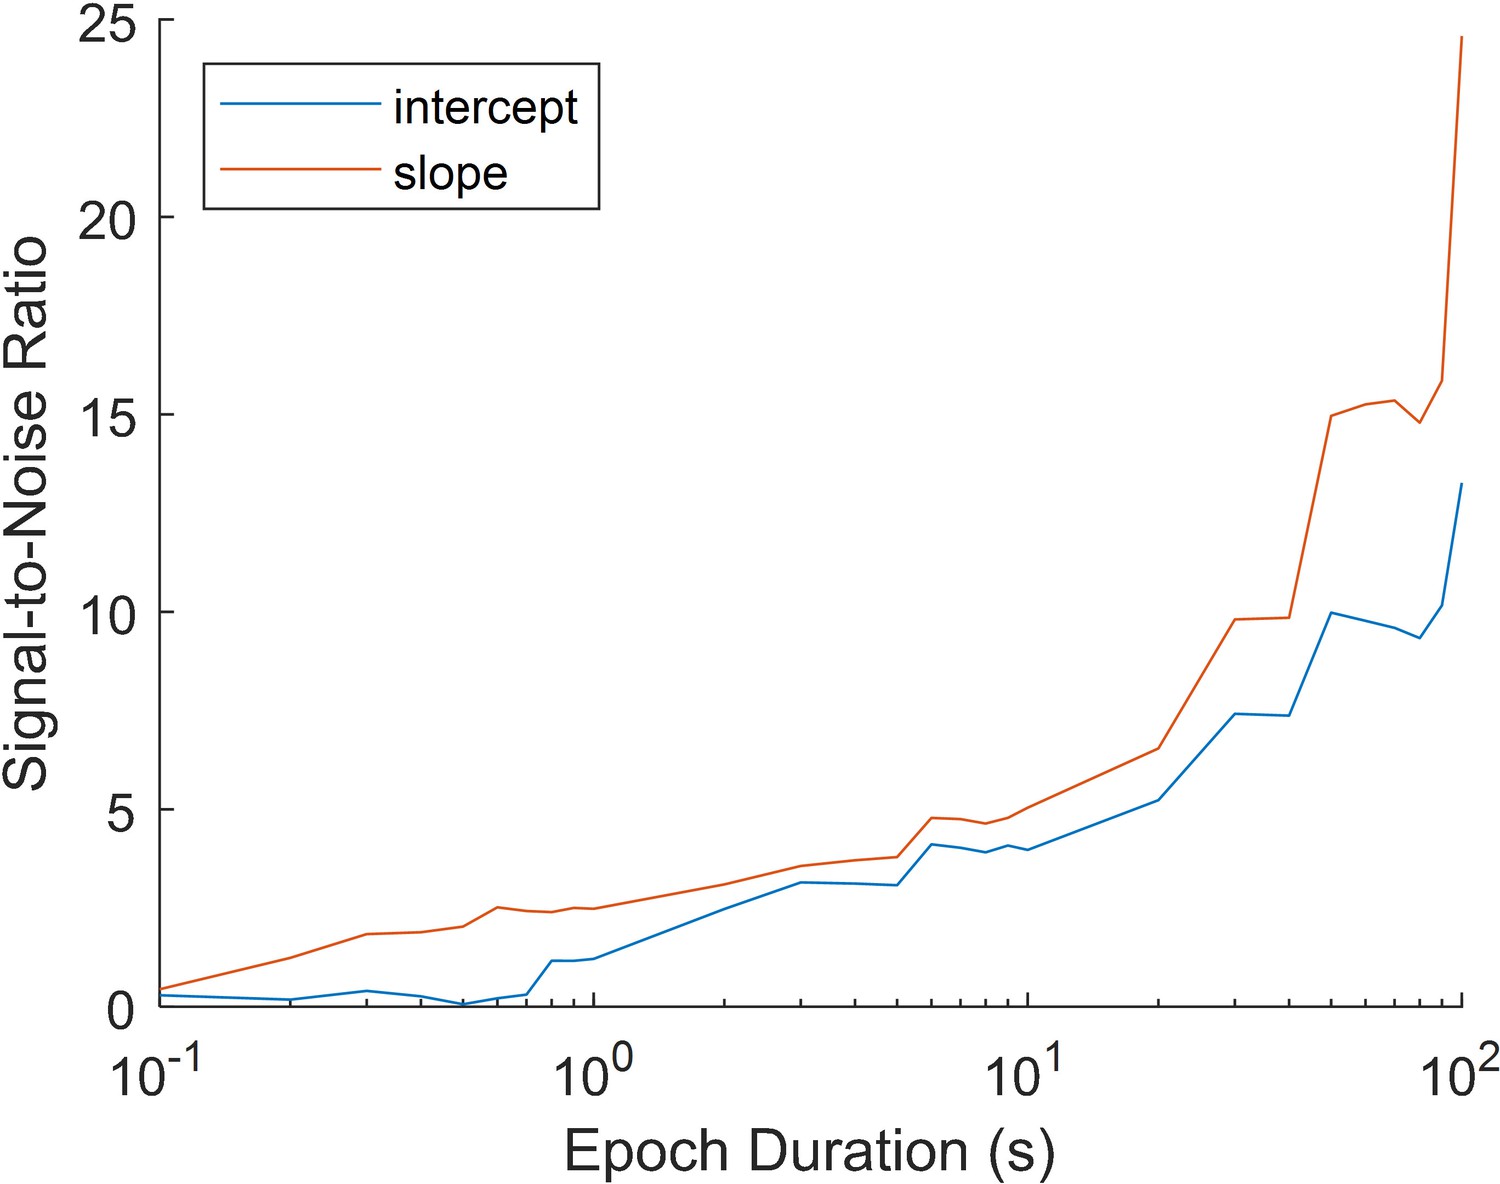
The simulated impact of epoch duration on the estimate of the 1/f curve.
Fractal signal was generated using the Neuro Digital Signal Processing Toolbox (Cole et al., 2019; https://github.com/neurodsp-tools/neurodsp) for epochs with a duration of 0.1 s to 100 s (this was repeated 1000 times for each time bin). IRASA was used to convert the resulting time-series into their fractal power spectrum. The intercept and slope of the fractal curve was then estimated as described in the Materials and methods section. Signal-to-noise was calculated for each epoch duration by dividing the mean slope estimate (across 1000 repetitions) by the standard deviation across estimates. A low signal-to-noise ratio indicates that estimates were not consistent across repetitions, while a high signal-to-noise ratio indicates high consistency across repetitions. The simulation demonstrates that short epochs (<1 s) produce highly unreliable estimates of the slope. Longer epochs (>30 s) produce a more reliable estimate. While long epochs are infeasible in event-related designs, averaging over trials (as in the EEG analysis of Figure 4—figure supplement 4) may help approximate the estimates of longer epochs.
Figure 4—figure supplement 6
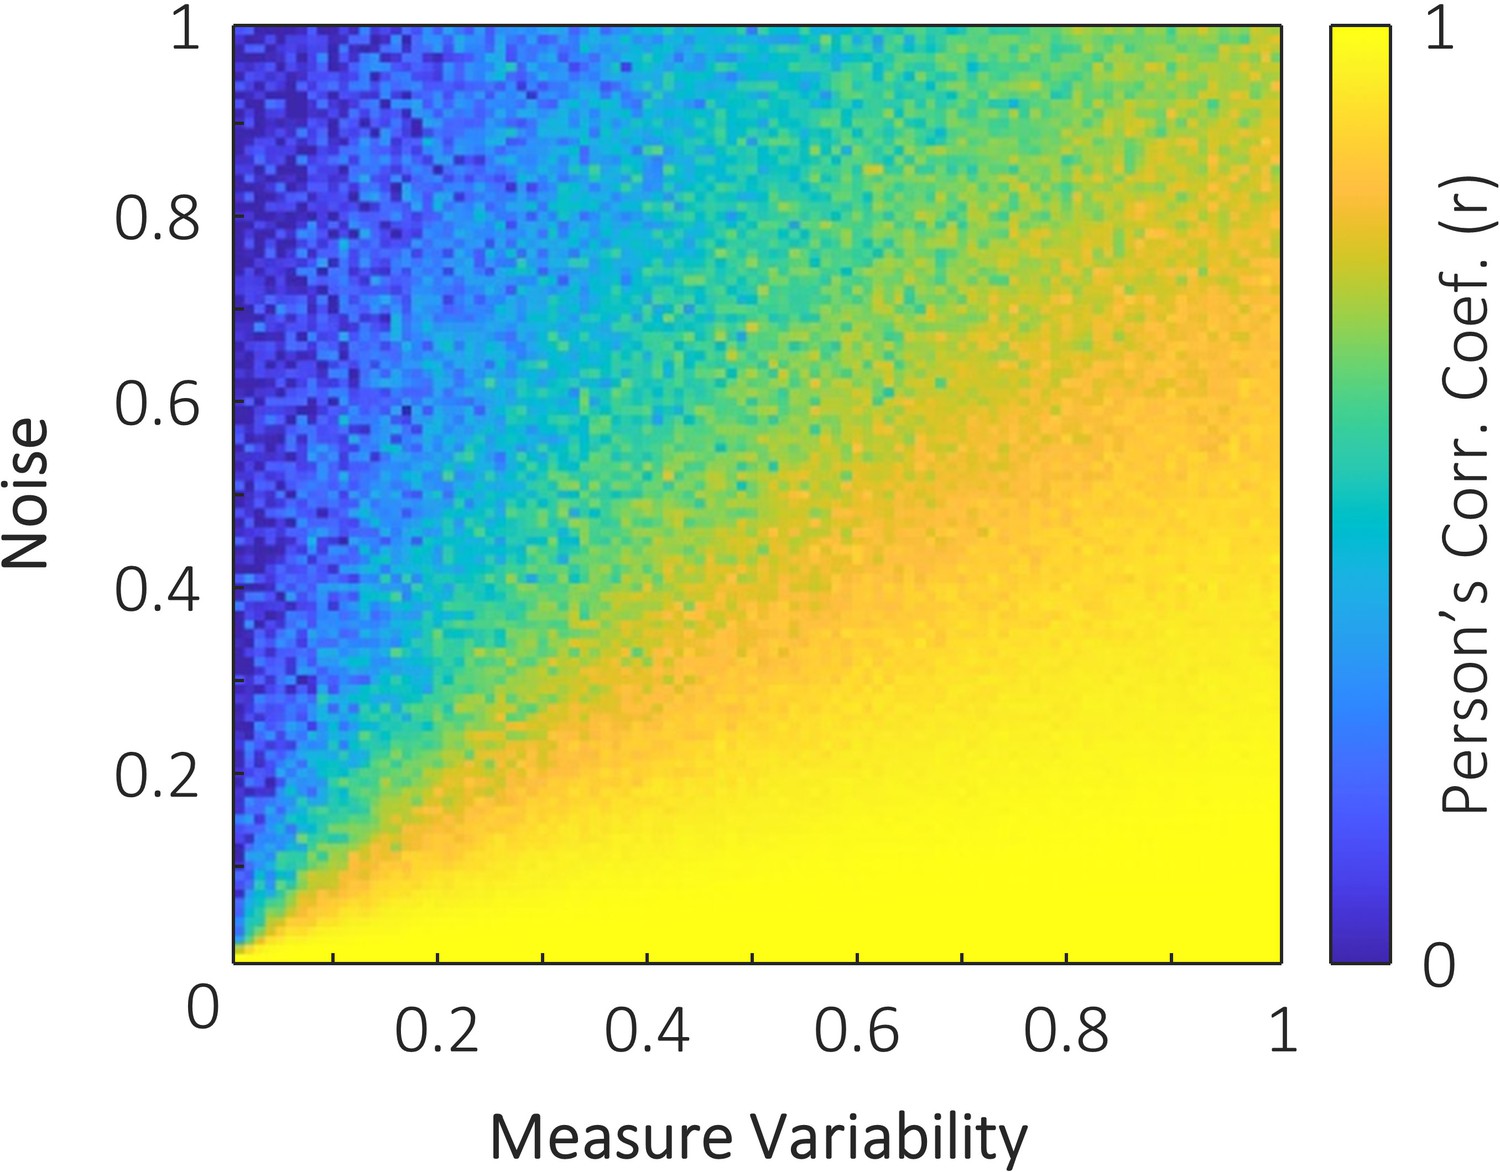
The simulated impact of measure variability and noise on the correlation between two variables.
One variable with 100 samples was generated with values between zero and i, where i denotes the measure variability. When measure variability was small, the range of values across the 100 samples was small. This variable was then duplicated to provide two perfectly correlated variables with variability i. One of these variables was then distorted by noise (that is, each sample of the variable was summed with a random number between 0 and j, where j denotes the noise). These two variables were then correlated. Simulations show that when there is little variability in the measured variables (left side of plot), only a small amount of noise is required to attenuate the correlation between variables. In contrast, when there is high variability in the measured signals, substantially greater noise is required to attenuate the correlation. This may explain the small correlation observed in the visual perception task, relative to the visual retrieval and auditory perception tasks, reported in the main text. As all data were acquired within participants in the same session, we can assume that noise (physiological or non-physiological) is relatively constant across all three tasks. Measure variability however, will vary across tasks. The memory retrieval task is likely to provide highly variable stimulus representations based on memory strength and retroactive interference. The auditory perception task is likely to provide highly variable stimulus representations due to the distracting sounds of the MRI scanner. The visual perception task, however, suffers neither of these issues, and is hence likely to have less measure variability than the other two tasks. With noise constant across conditions, and measure variability smaller in the visual perception task, our simulation would predict that correlation strength would be noticeably weaker in the visual perception task.
Additional files
-
Supplementary file 1
fMRI cluster-based statistics.
- https://cdn.elifesciences.org/articles/49562/elife-49562-supp1-v2.docx
-
Transparent reporting form
- https://cdn.elifesciences.org/articles/49562/elife-49562-transrepform-v2.pdf
Download links
A two-part list of links to download the article, or parts of the article, in various formats.
Downloads (link to download the article as PDF)
Open citations (links to open the citations from this article in various online reference manager services)
Cite this article (links to download the citations from this article in formats compatible with various reference manager tools)
Alpha/beta power decreases track the fidelity of stimulus-specific information
eLife 8:e49562.
https://doi.org/10.7554/eLife.49562


