Persistent Mycobacterium tuberculosis infection in mice requires PerM for successful cell division
- Weill Cornell Medical College, United States
- Weill Cornell Graduate School of Medical Sciences, Cornell University, United States
Figures
Figure 1 with 3 supplements
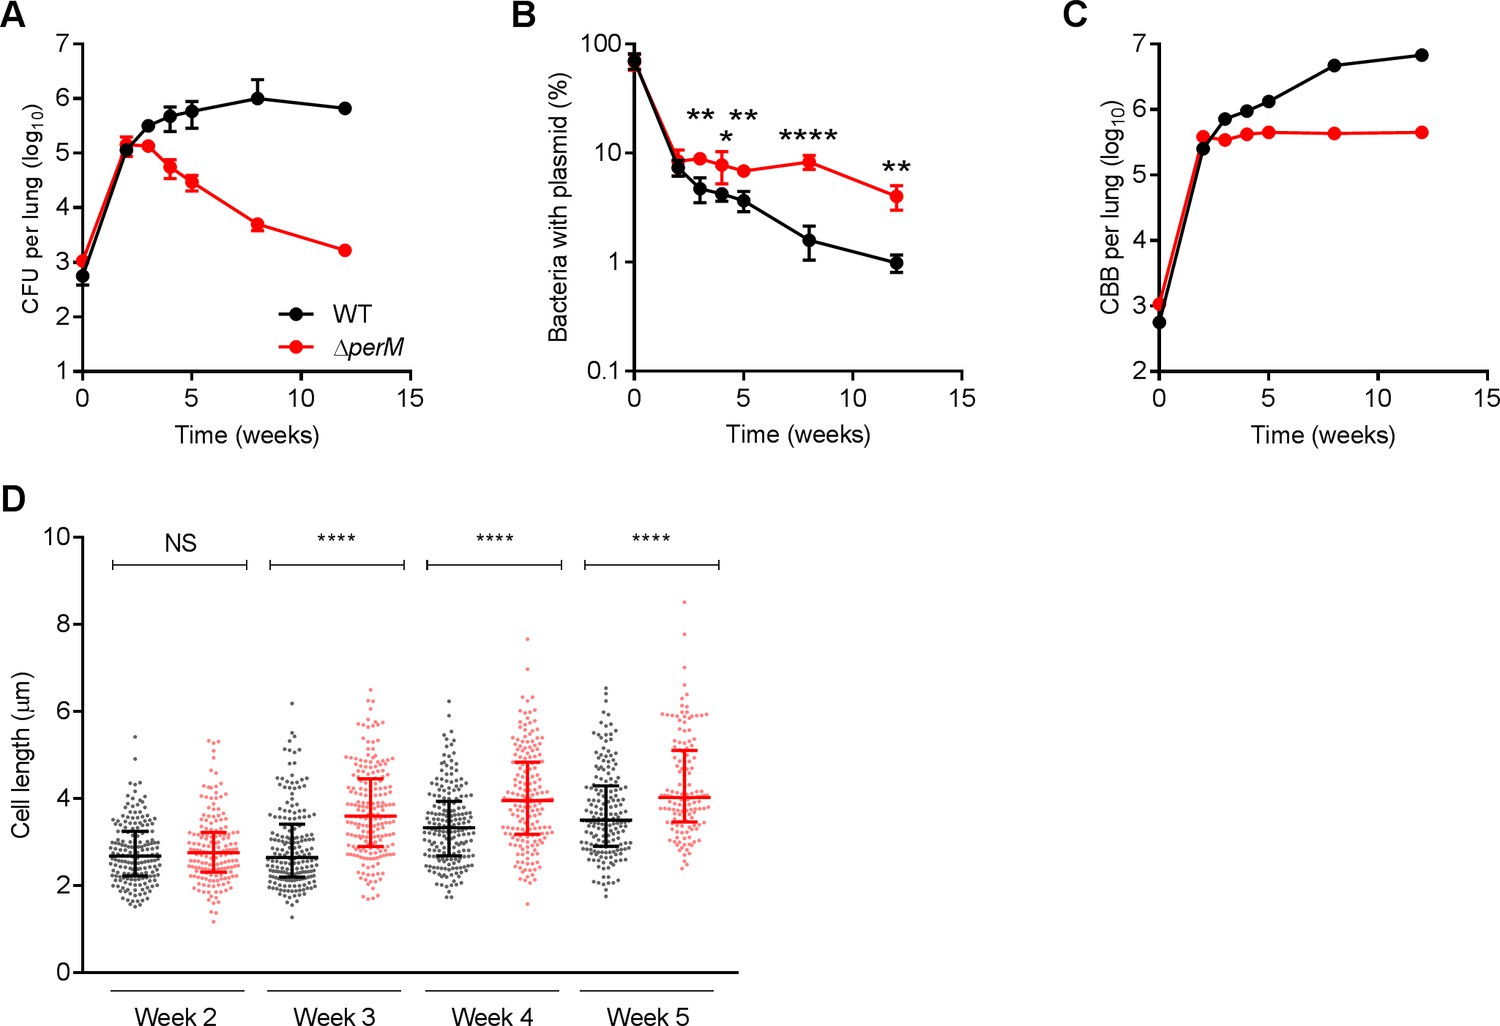
Mtb requires PerM for optimal cell division during chronic mouse infection.
(A) Bacterial titers in lungs of C57BL/6 mice infected with WT Mtb or the ∆perM mutant containing the replication clock plasmid pBP10 at the indicated time points post-infection. Data are means ± SD of five mice. (B) Fractions of bacteria containing the pBP10 plasmid at the indicated time points. Data are means ± SD of five mice. P-values were calculated using multiple t tests and adjusted for multiple comparisons. *, adj-P <0.05; **, adj-P <0.01; ****, adj-P <0.0001. (C) Calculated cumulative bacterial burden (CBB) in mouse lungs. (D) Scatter plots of cell length of WT Mtb (black) or the ∆perM mutant (red) in acid-fast stained lung sections at the indicated time points. The middle lines represent the medians and the top and bottom lines represent the 25th and 75th percentiles. P-values were calculated using Kruskal-Wallis test and corrected for multiple comparisons. ****, adj-P <0.0001. Data in (A–C) are from one experiment, and data in (D) are representative of two independent experiments.
-
Figure 1—source data 1
Summary statistics of Figure 1D.
- https://cdn.elifesciences.org/articles/49570/elife-49570-fig1-data1-v1.pdf
Figure 1—figure supplement 1
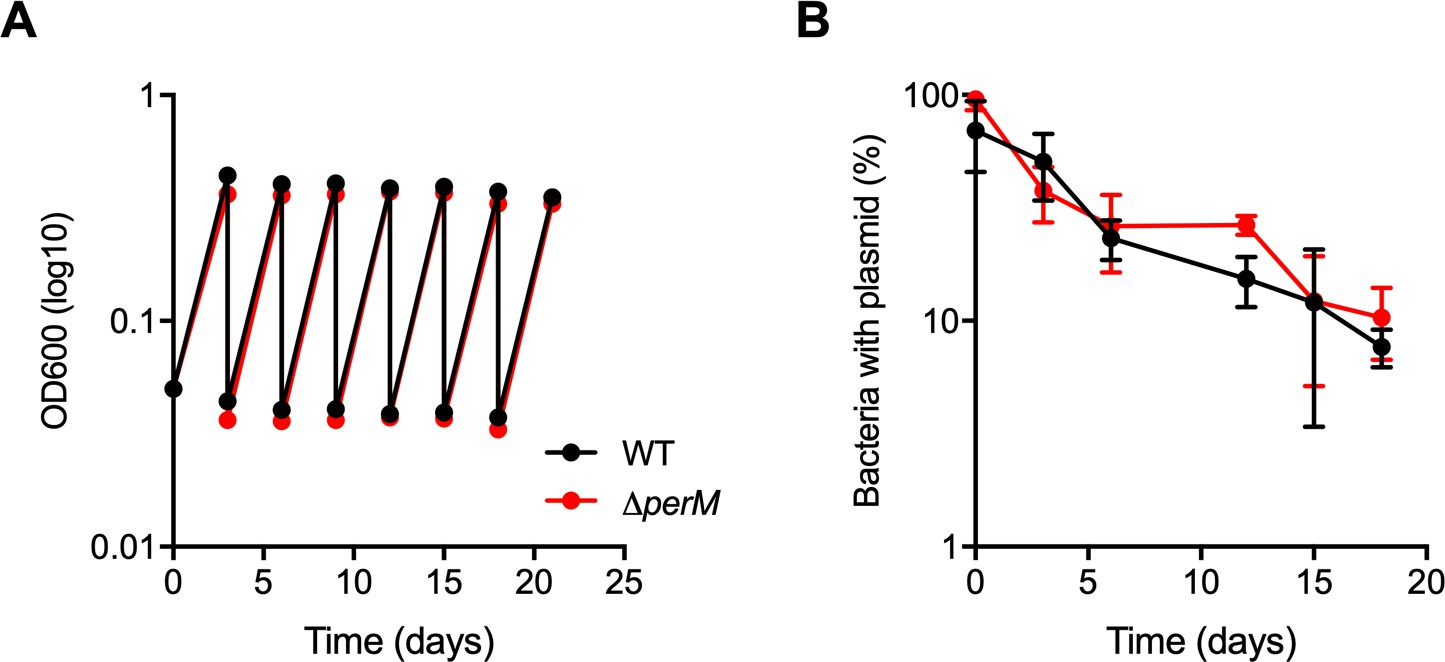
Mtb WT and ∆perM replicate similarly in vitro.
(A) Growth measured by optical density of serially diluted WT-pBP10 and ∆perM-pBP10 cultures. Cultures were diluted every three days to allow for continuous culturing. Data are means ± SD of triplicates (error bars are too small to be detected).(B) Plasmid loss from Mtb WT and the ∆perM mutant in log phase continuous cultures in the absence of antibiotic selection. Data are means ± SEM of triplicates. Data in (A and B) are representative of two independent experiments.
Figure 1—figure supplement 2
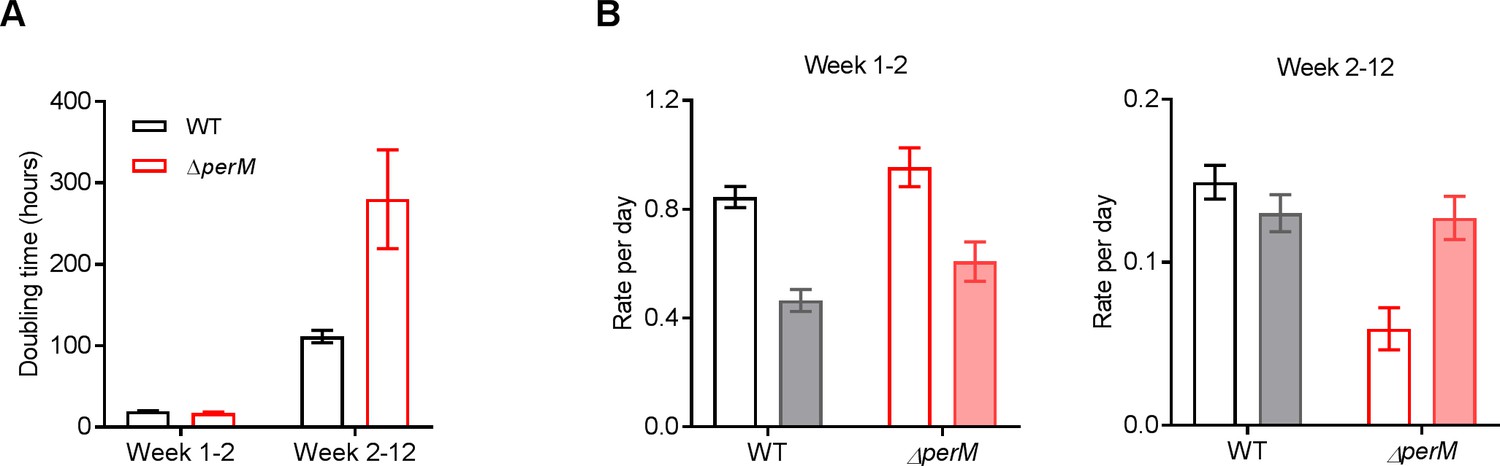
Mtb ∆perM replicates more slowly than WT in the chronic phase of mouse infection.
(A) Calculated doubling time of WT-pBP10 and ∆perM-pBP10 recovered from mouse lungs during the indicated time intervals. Data are represented as doubling time ± SE. (B) Calculated bacterial replication (empty bars) and death (filled bars) rates of WT-pBP10 and ∆perM-pBP10 recovered from mouse lungs during the indicated time intervals. Calculations of the cell replication and death rates are described in Materials and methods. Data are replication or death rates ± SE. Statistical significance for cell replication rates (r) was computed using analysis of covariance (ANCOVA). P = 0.1995 comparing r of WT and ∆perM during week 1-2. P < 0.0001 comparing r of WT and ∆perM during week 2-12. Data in (A and B) are from one experiment.
Figure 1—figure supplement 3
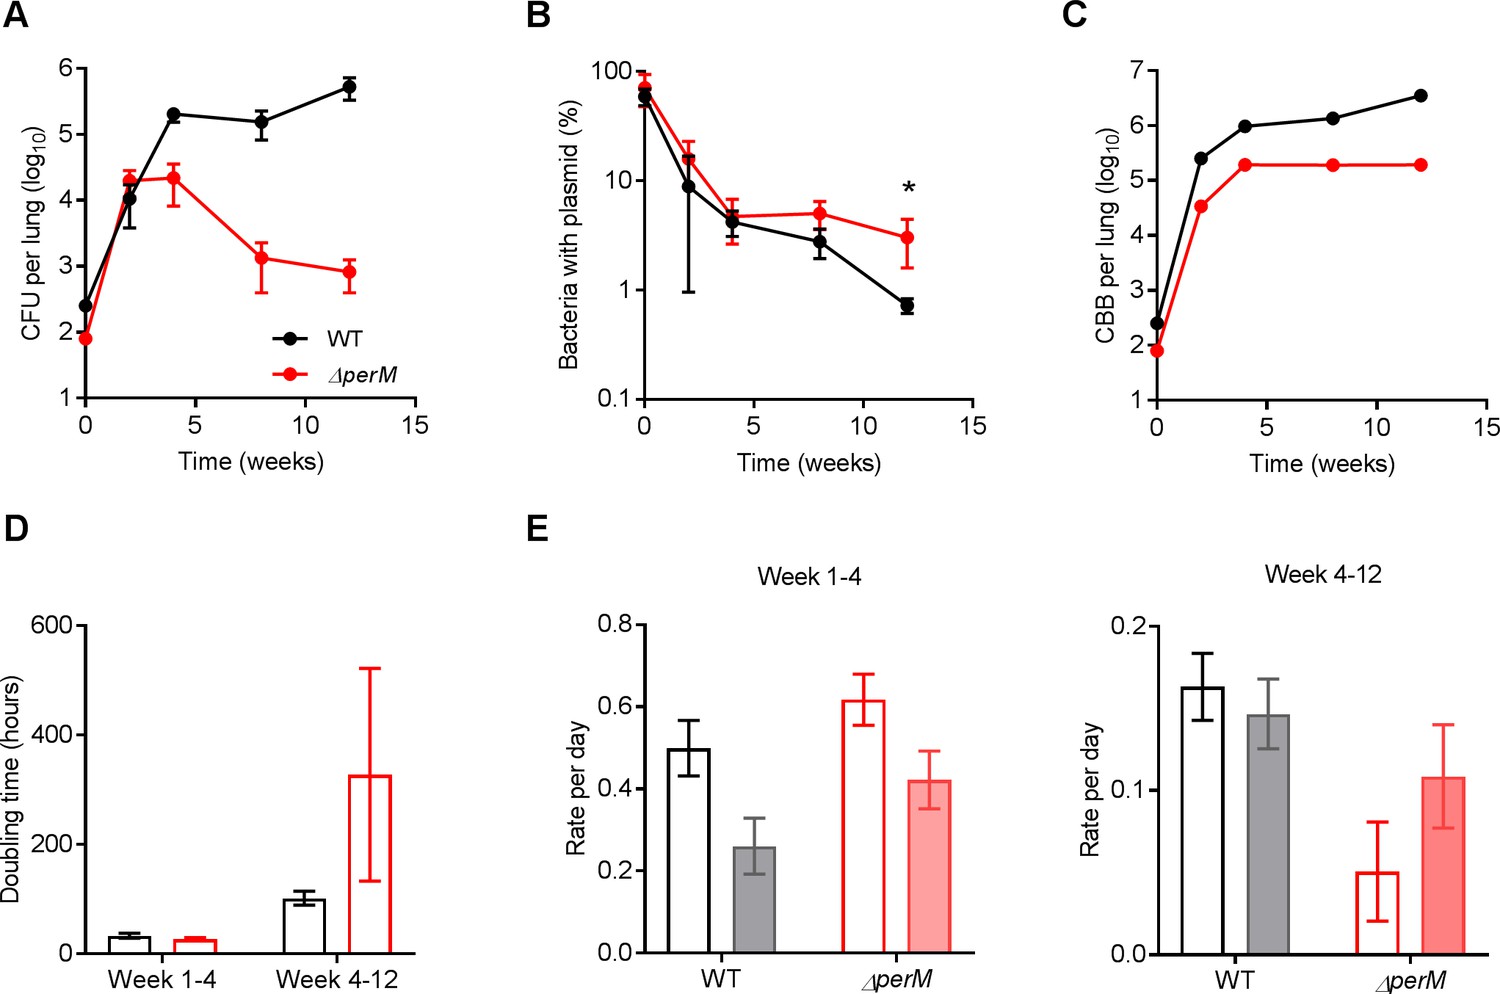
Replication clock experiment with low Mtb inoculum reveals slower cell replication of ∆perM than WT in the chronic phase of mouse infection.
(A) Bacterial burden in lungs of C57BL/6 mice infected with WT-pBP10 or ∆perM-pBP10. Data are means ± SD of five mice. (B) Fractions of bacteria containing the pBP10 plasmid at the indicated time points. Data are means ± SD of five mice. P-values were calculated using multiple t tests and adjusted for multiple comparisons. *, adj-P <0.05. At week 8, adj-P equals 0.066. (C) Calculated cumulative bacterial burden (CBB) in mouse lungs. (D) Calculated doubling time during the indicated time intervals. Data are doubling time ± SE. (E) Calculated cell replication (empty bars) and death (filled bars) rates during the indicated time intervals. Data are rates ± SE. Statistical significance for cell replication rates (r) was computed using ANCOVA. P = 0.2102 comparing r of WT and ∆perM during week 1-4. P = 0.0047 comparing r of WT and ∆perM during week 4-12. Data in (A–E) are from one experiment.
Figure 2 with 2 supplements
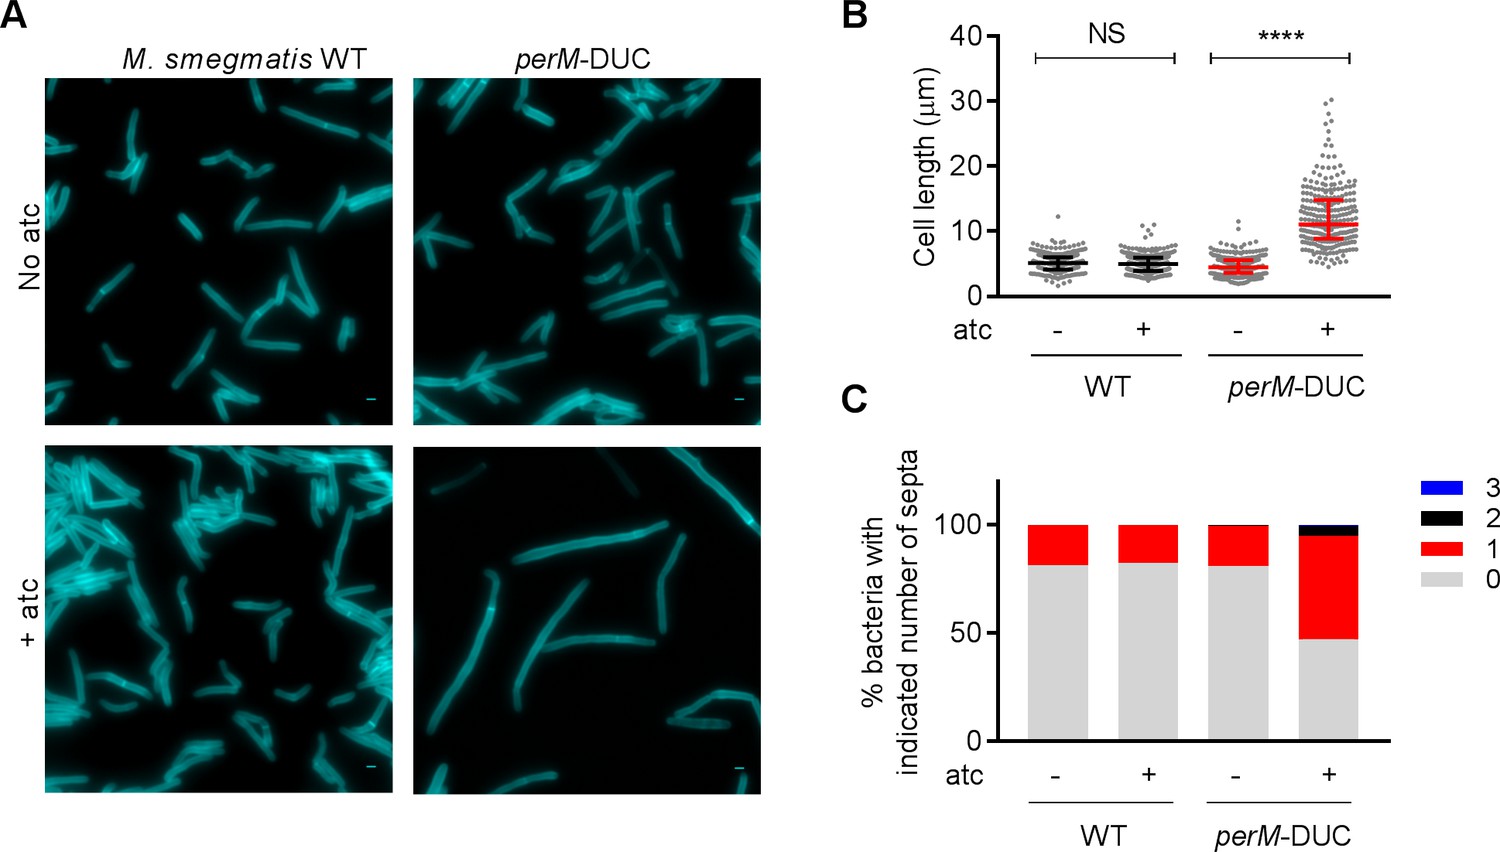
Depletion of PerM leads to a septation defect in M. smegmatis.
(A) Representative microscopy images of WT M. smegmatis and the perM-DUC mutant after 9 hr of incubation in 7H9 medium supplemented with 1 mM HADA and in the absence or presence of 200 ng/ml atc. Scale bar, 1 µm. (B) Scatter plots of bacterial cell length of M. smegmatis strains from (A). The middle lines represent the medians and the top and bottom lines represent the 25th and 75th percentiles. P-values were computed using Kruskal-Wallis test and adjusted for multiple comparisons. ****, adj-P <0.0001. (C) Quantification of bacterial cells that contain 0, 1, 2 or 3 septa of M. smegmatis strains from (A). Data in (A–C) are representative of two independent experiments.
-
Figure 2—source data 1
Summary statistics of Figure 2B.
- https://cdn.elifesciences.org/articles/49570/elife-49570-fig2-data1-v1.pdf
Figure 2—figure supplement 1
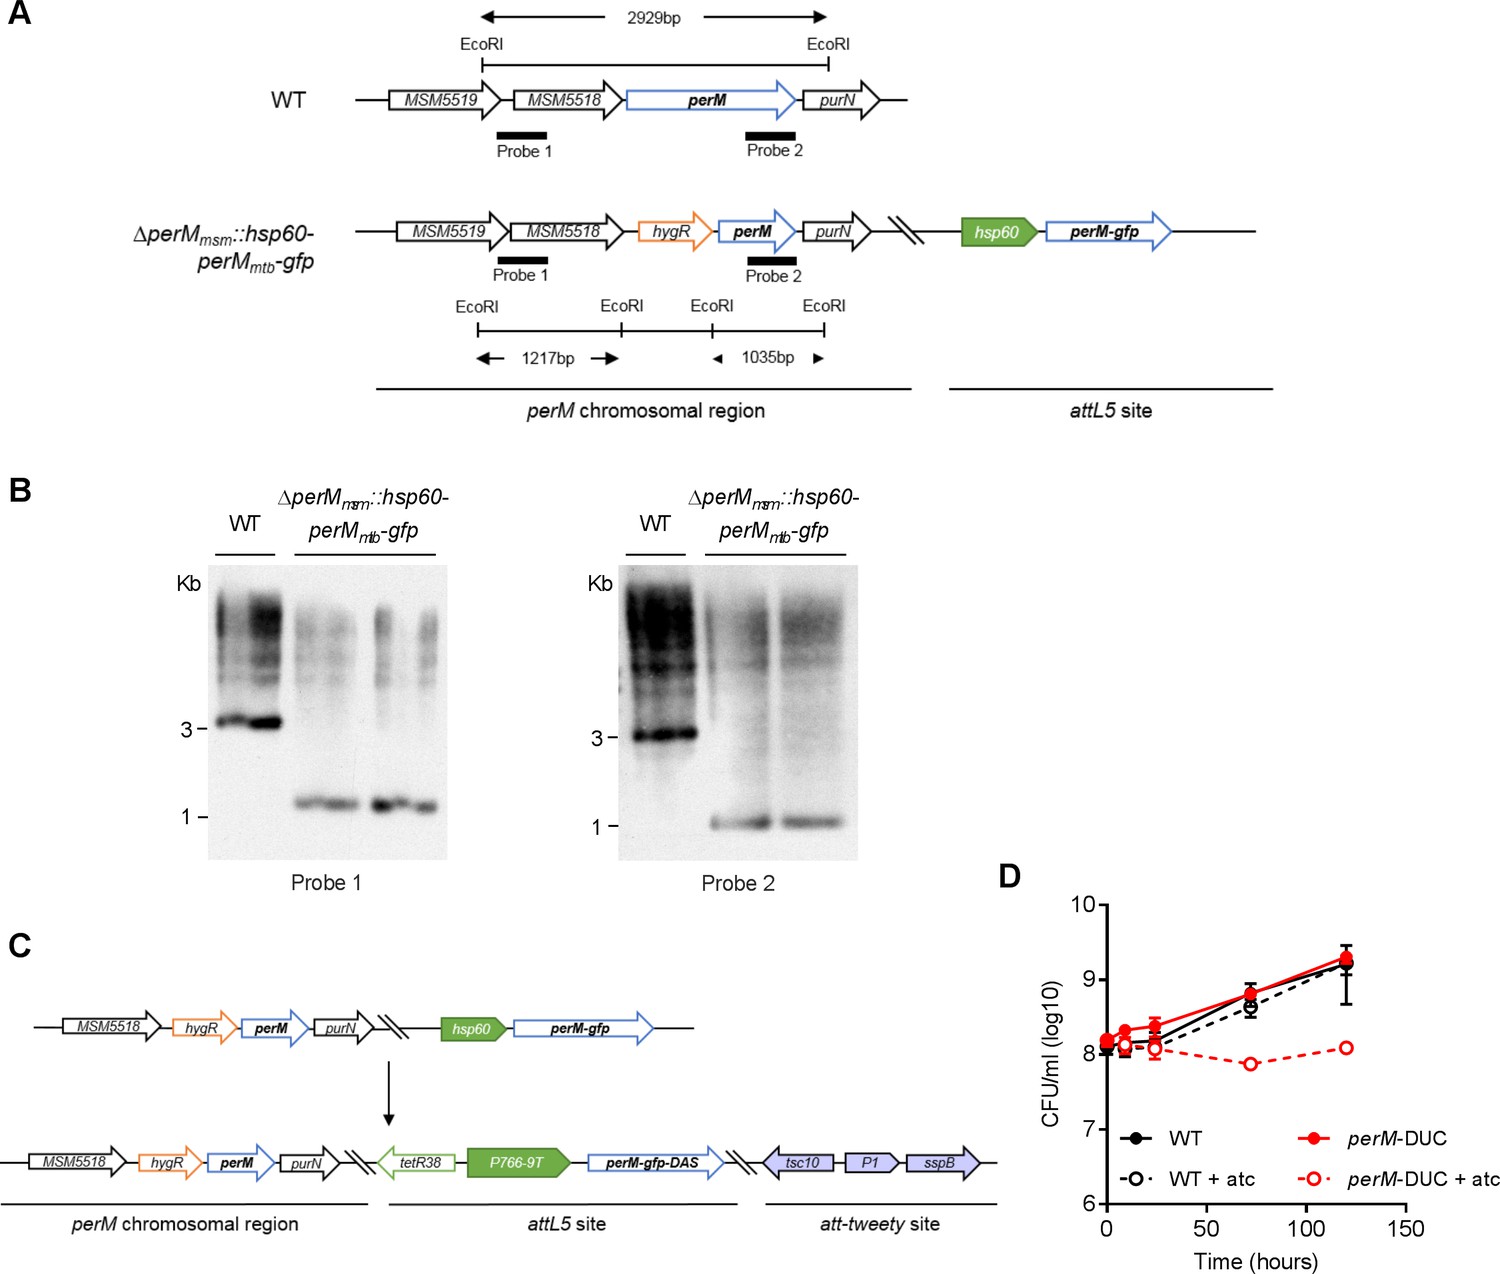
Construction and characterization of a PerMmsm depletion mutant (perM-DUC).
(A) Map of perMmsm genomic region in WT and the att-site mutant ∆perMmsm::hsp60-perMmtb-gfp. To construct the att-site mutant, we first generated a merodiploid strain by integrating a copy of perMmtb-gfp into the attL5 site expressed under the constitutive hsp60 promoter. Next, we replaced the first 971 bp of perMmsm with a hygromycin resistance cassette using homologous recombination. (B) Southern blots of genomic DNA from WT and two att-site mutant candidates after digestion with EcoRI and probed with probe 1 (left) and probe 2 (right) as marked in (A). Bands at around 1 kb from the two candidates showed the successful deletion of perMmsm. (C) Schematic of constructing the perM-DUC mutant from the perM att-site mutant. We first replaced the construct in the attL5 site of ∆perMmsm::hsp60-perMmtb-gfp with DAS tagged perM-gfp expressed under the P766-9T promoter and controlled by reverse tet repressor. A construct that expresses the SspB adaptor protein was integrated into the att-tweety site. (D) Bacterial titers of WT and perM-DUC cultured in standing 7H9 medium with and without atc. At the indicated time points, samples were collected and CFU recovered on 7H10 agar that contains 0.4% charcoal to remove carryover of atc. Data are means ± SD of three replicates and representative of two independent experiments.
Figure 2—figure supplement 2
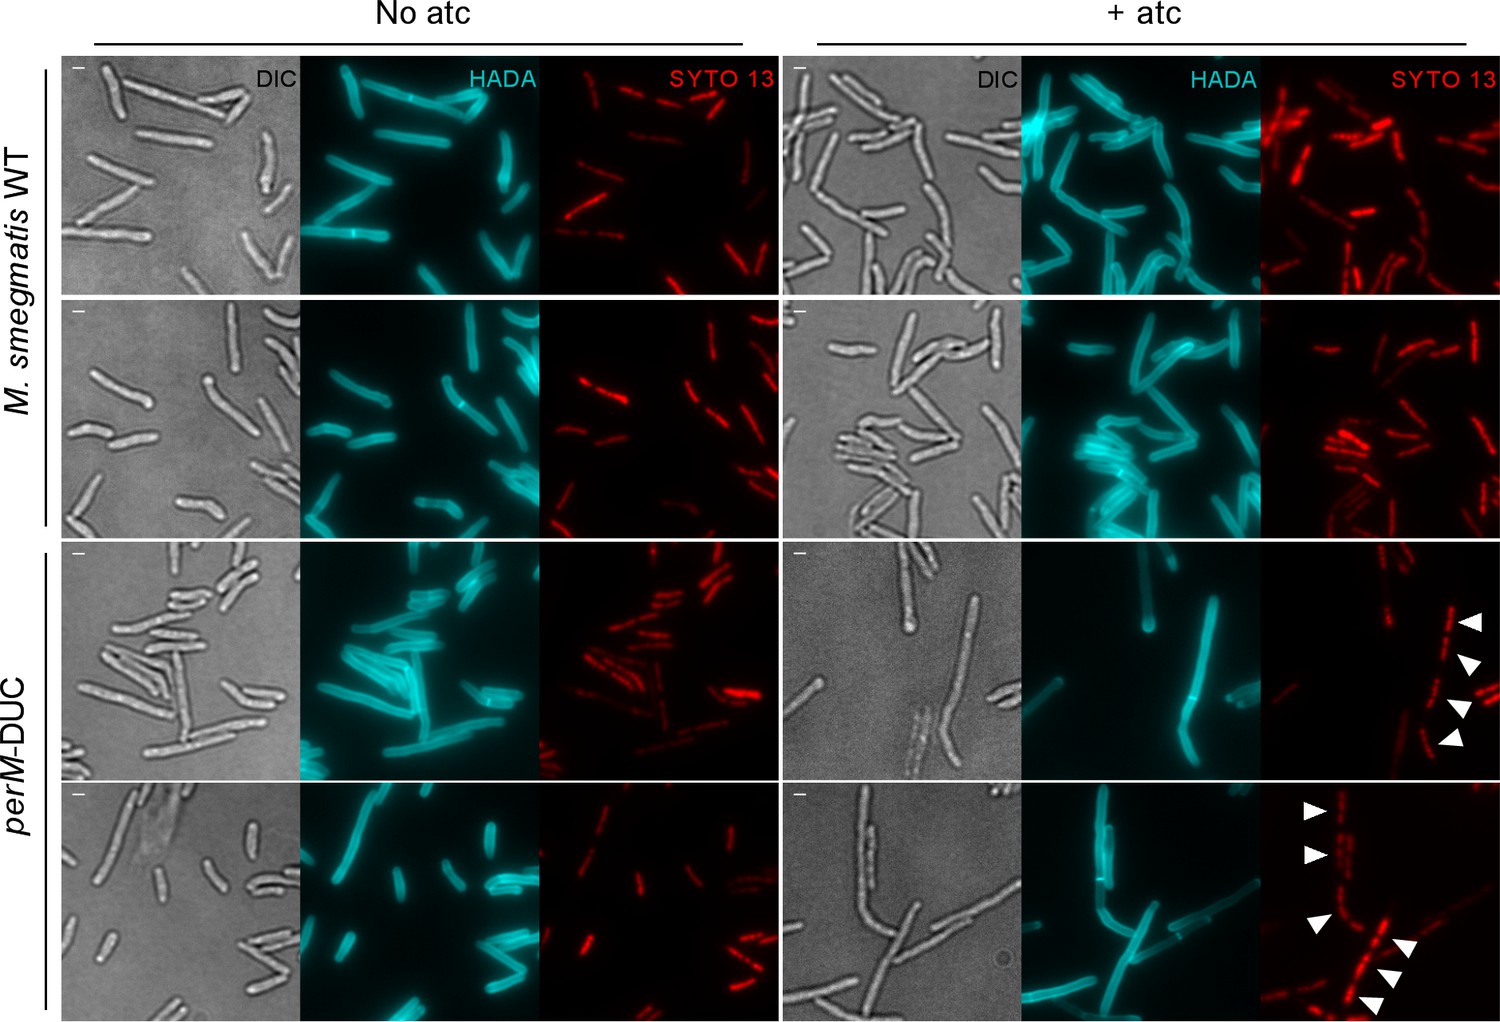
Nucleoid morphology of WT M. smegmatis and perM-DUC in the absence and presence of atc.
Representative microscopy images of WT and perM-DUC incubated in 7H9 medium containing 1 mM HADA and in the absence or presence of 200 ng/ml atc for 9 hr. Cells were stained with 5 µM SYTO 13 to label the DNA. Arrowheads point to multiple stained nucleoids (visualized as distinct globular structures) within the perM-DUC mutant incubated in the presence of atc. Scale bar, 1 µm.
Figure 3
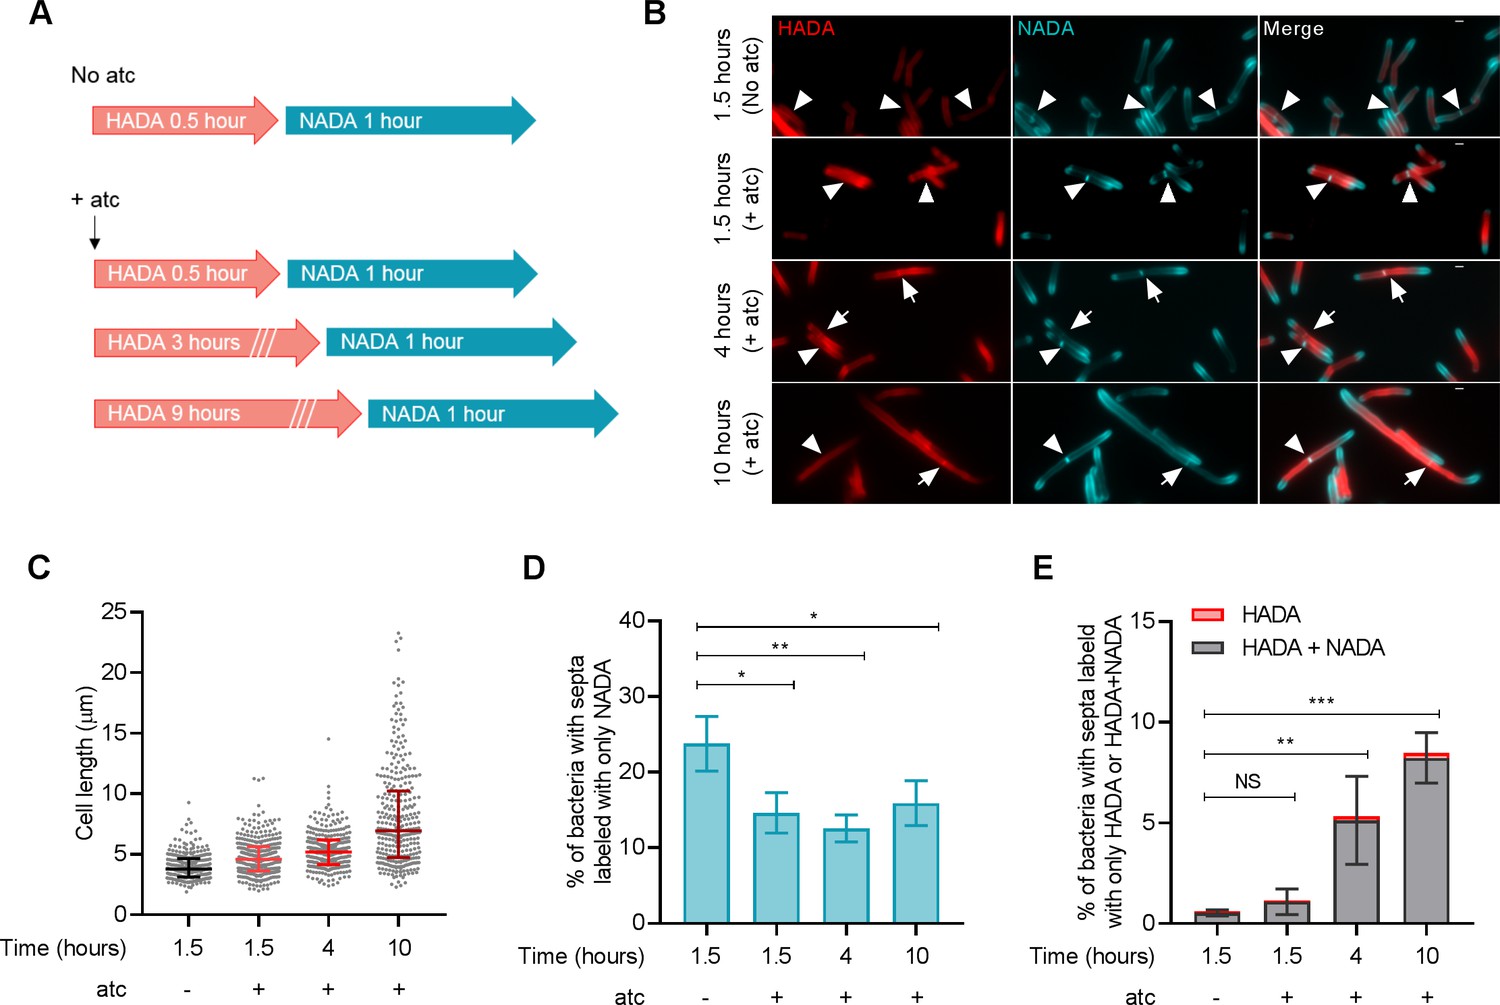
PerM depletion leads to defects in septum formation and resolution in M. smegmatis.
(A) Schematic of peptidoglycan labeling of M. smegmatis perM-DUC. Bacterial cells were incubated in growth medium containing 1 mM HADA and 200 ng/ml atc for 0.5, 3, or 9 hr. Cells were then washed to remove excess HADA and incubated with 1 mM NADA and 200 ng/ml atc for 1 hr. PerM-DUC cells incubated in growth medium containing D-alanine probes but without atc were used as controls. (B) Representative microscopy images of perM-DUC after the sequential peptidoglycan labeling. Arrowheads point to septa labeled with NADA only; and arrows point to septa co-labeled with HADA and NADA. Scale bar, 1 µm. (C) Scatter plots of perM-DUC cell lengths from (B). Lines represent median and the 25th and 75th percentiles. Data are representative of three biological replicates. (D) Proportion of bacteria that contain septa labeled exclusively with NADA. Lines indicate means ± SD of three independent experiments. (E) Proportion of bacteria that contain septa labeled exclusively with HADA or co-labeled with NADA. Lines indicate means ± SD of septa labeled with HADA+NADA from three independent experiments. Statistics are reported on the HADA+NADA datasets. For data in (D and E), P-values were computed using ANOVA and adjusted for multiple comparisons. *, adj-P <0.05; **, adj-P <0.01; ***, adj-P <0.001.
-
Figure 3—source data 1
Summary statistics of Figure 3C.
- https://cdn.elifesciences.org/articles/49570/elife-49570-fig3-data1-v1.pdf
-
Figure 3—source data 2
Summary of Figure 3D and 3E.
- https://cdn.elifesciences.org/articles/49570/elife-49570-fig3-data2-v1.pdf
Figure 4
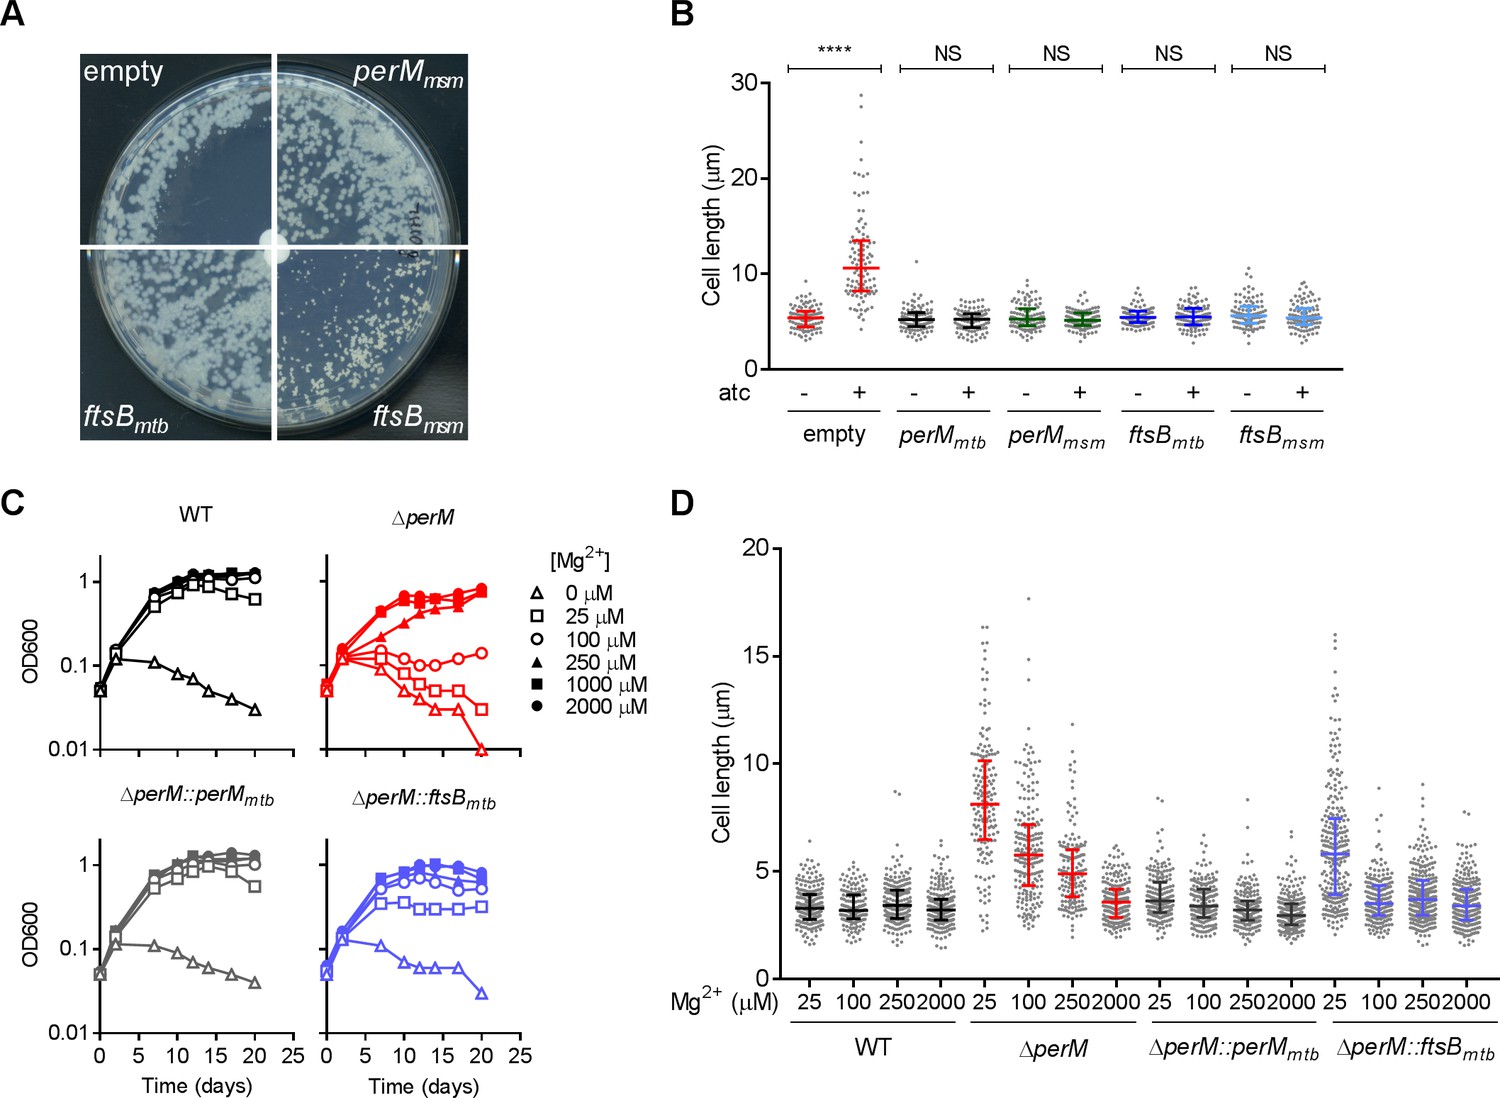
Ectopic ftsB expression rescues the phenotypes caused by PerM depletion in M. smegmatis and perM deletion in Mtb.
(A) M. smegmatis perM-DUC transformed with a control plasmid or plasmids that express perMmsm, ftsBmtb or ftsBmsm under the constitutive hsp60 promoter were cultured on 7H10 agar. The paper disks in the center of the plates contained 50 ng atc, which diffused and created an atc gradient from the center to the periphery. Images of plates were taken on day 4 (perM-DUC-control, perM-DUC-perMmsm and perM-DUC-ftsBmtb) or day 7 (perM-DUC-ftsBmsm). (B) Scatter plots of the lengths of perM-DUC-control, perM-DUC-perMmtb, perM-DUC-perMmsm, perM-DUC-ftsBmtb and perM-DUC-ftsBmsm incubated in 7H9 medium without and with atc for 24 hr. The lines represent the 25th, 50th and 75th percentiles. P-values were computed using Kruskal-Wallis test and adjusted for multiple comparisons. ****, adj-P <0.0001. (C) Growth curves of Mtb incubated in chelated Sauton’s medium supplemented with Mg2+ at the indicated concentrations. (D) Scatter plots of Mtb cell lengths after 5 days of incubation in Sauton’s medium containing Mg2+ at the indicated concentrations. The lines represent the 25th, 50th and 75th percentiles. P-values were computed using Kruskal-Wallis test and corrected for multiple comparisons. The adjusted P-values are <0.0001 for the following comparisons: WT with ∆perM at 25 µM, 100 µM, 250 µM Mg2+, WT with ∆perM::ftsBmtb at 25 µM Mg2+; ∆perM with ∆perM::ftsBmtb at 25 µM Mg2+. Adj-P = 0.0762, 0.1095 and 0.7284 comparing WT to ∆perM::ftsBmtb at 100 µM, 250 µM and 2000 µM Mg2+, respectively. Data in (A–C) are representative of two independent experiments, and data in (D) are from one experiment.
-
Figure 4—source data 1
Summary statistics of Figure 4B.
- https://cdn.elifesciences.org/articles/49570/elife-49570-fig4-data1-v1.pdf
-
Figure 4—source data 2
Summary statistics of Figure 4D.
- https://cdn.elifesciences.org/articles/49570/elife-49570-fig4-data2-v1.pdf
Figure 5 with 3 supplements
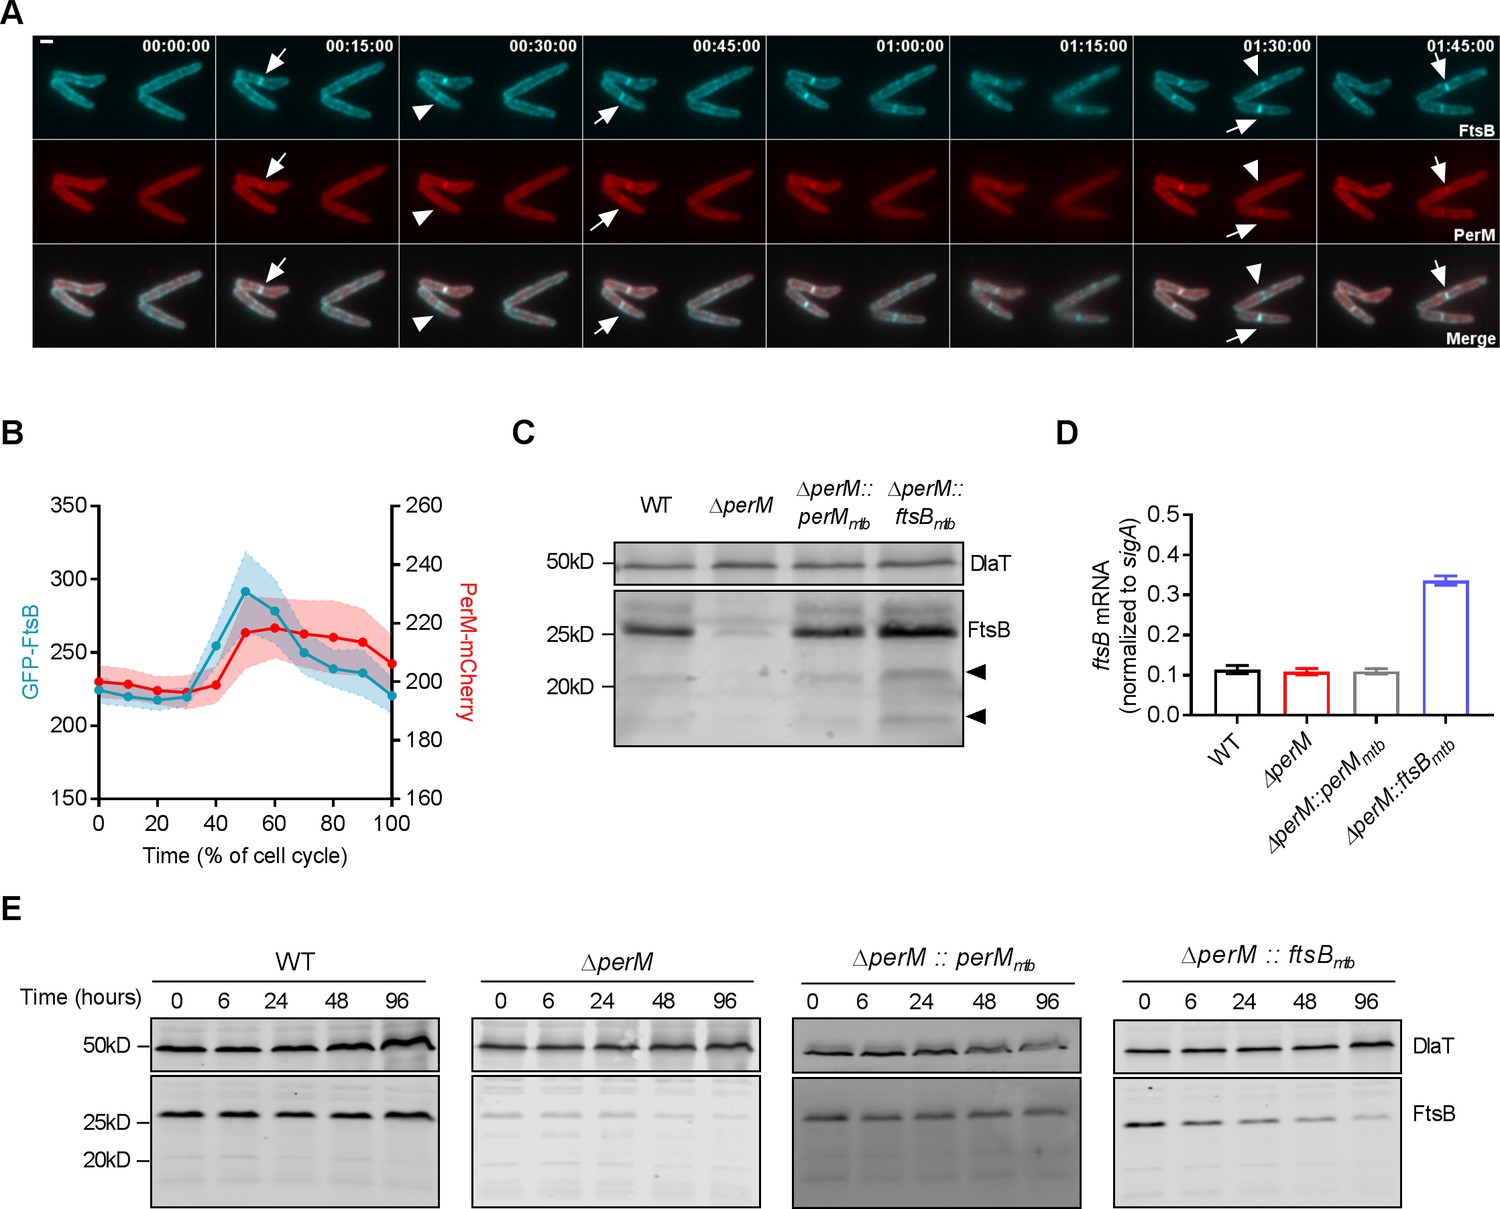
PerM co-localizes with FtsB and stabilizes FtsB.
(A) Representative image series from time lapse movies of replicating M. smegmatis constitutively expressing both GFP-FtsBmtb and PerMmtb-mCherry over the duration of 1 hr and 45 mins. Arrows point to the presence of both FtsB and PerM at the mid-cell, and arrowheads point to the presence of FtsB and lack of PerM at the mid-cells. Scale bar, 1 µm. Numbers in the upper right corner indicate time. (B) Measurements of the maximum fluorescence intensities of GFP-FtsB and PerM-mCherry as a function of the cell cycle from time lapse movies shown in (A). The lines and shaded areas indicate means and the 95% confidence intervals of 20 bacteria. (C) FtsB protein in whole-cell lysates of log-phase Mtb measured by western blotting with anti-FtsB antibody. Arrowheads point to cleavage products of FtsB. Dihydrolipoamide acyltransferase (DlaT) was used as loading control. (D) FtsB mRNA in log-phase Mtb culture measured by quantitative real time PCR. mRNA levels were normalized to expression of the housekeeping gene sigA. Data are means ± SD of triplicates. (E) Detection of FtsB in whole-cell lysates collected from Mtb strains by western blotting with anti-FtsB antibody. 20 µg/ml chloramphenicol were added to each culture at time 0 to inhibit protein synthesis and samples were collected at the indicated time points. Western blotting with anti-DlaT was used as loading control. Data in (C–E) are representative of two independent experiments. Biological replicates of Figure 5C and E are shown in Figure 5—figure supplement 3.
Figure 5—figure supplement 1
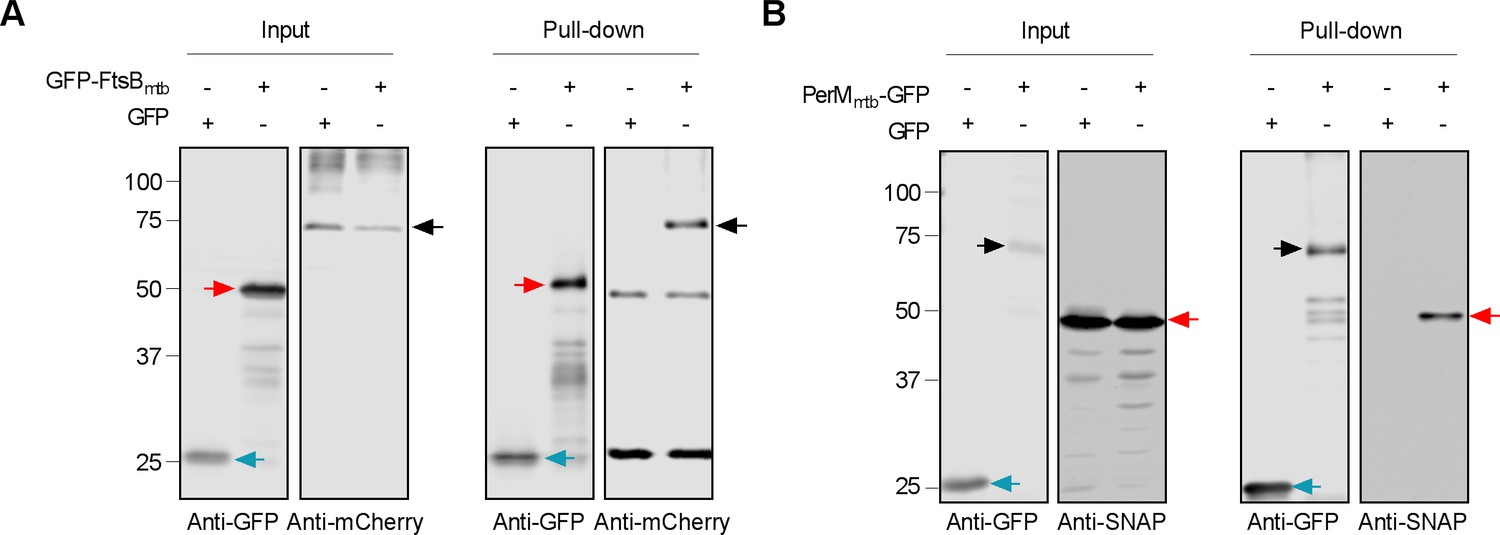
FtsBmtb and PerMmtb interact in vivo.
(A) Co-immunoprecipitation of FtsBmtb and PerMmtb from whole-cell protein lysates of M. smegmatis ∆perM::perMmtb-mCherry::gfp-ftsBmtb. Lysates from M. smegmatis ∆perM::perMmtb-mCherry::gfp served as a control. GFP-containing proteins were immunoprecipitated with anti-GFP mAB-agarose beads. Whole-cell lysates (input) and eluates (pull-down) were analyzed by western blotting with anti-GFP or anti-mCherry antibodies. GFP (cyan arrows), GFP-FtsBmtb (red arrows), PerMmtb-mCherry (black arrows). (B) Reverse pull-down with PerMmtb as ‘bait’ protein from whole-cell protein lysates of M. smegmatis WT::perMmtb-gfp transformed with a plasmid expressing snap-ftsBmtb. Lysates from M. smegmatis WT::gfp transformed with a plasmid expressing snap-ftsBmtb served as a control. Following immunoprecipitation of GFP-containing proteins with anti-GFP magnetic beads, we analyzed whole-cell lysates and eluates with anti-GFP or anti-SNAP antibodies. GFP (cyan arrows), PerMmtb-GFP (black arrows), SNAP-FtsBmtb (red arrows). Data in (A and B) are representative of two independent experiments.
Figure 5—figure supplement 2
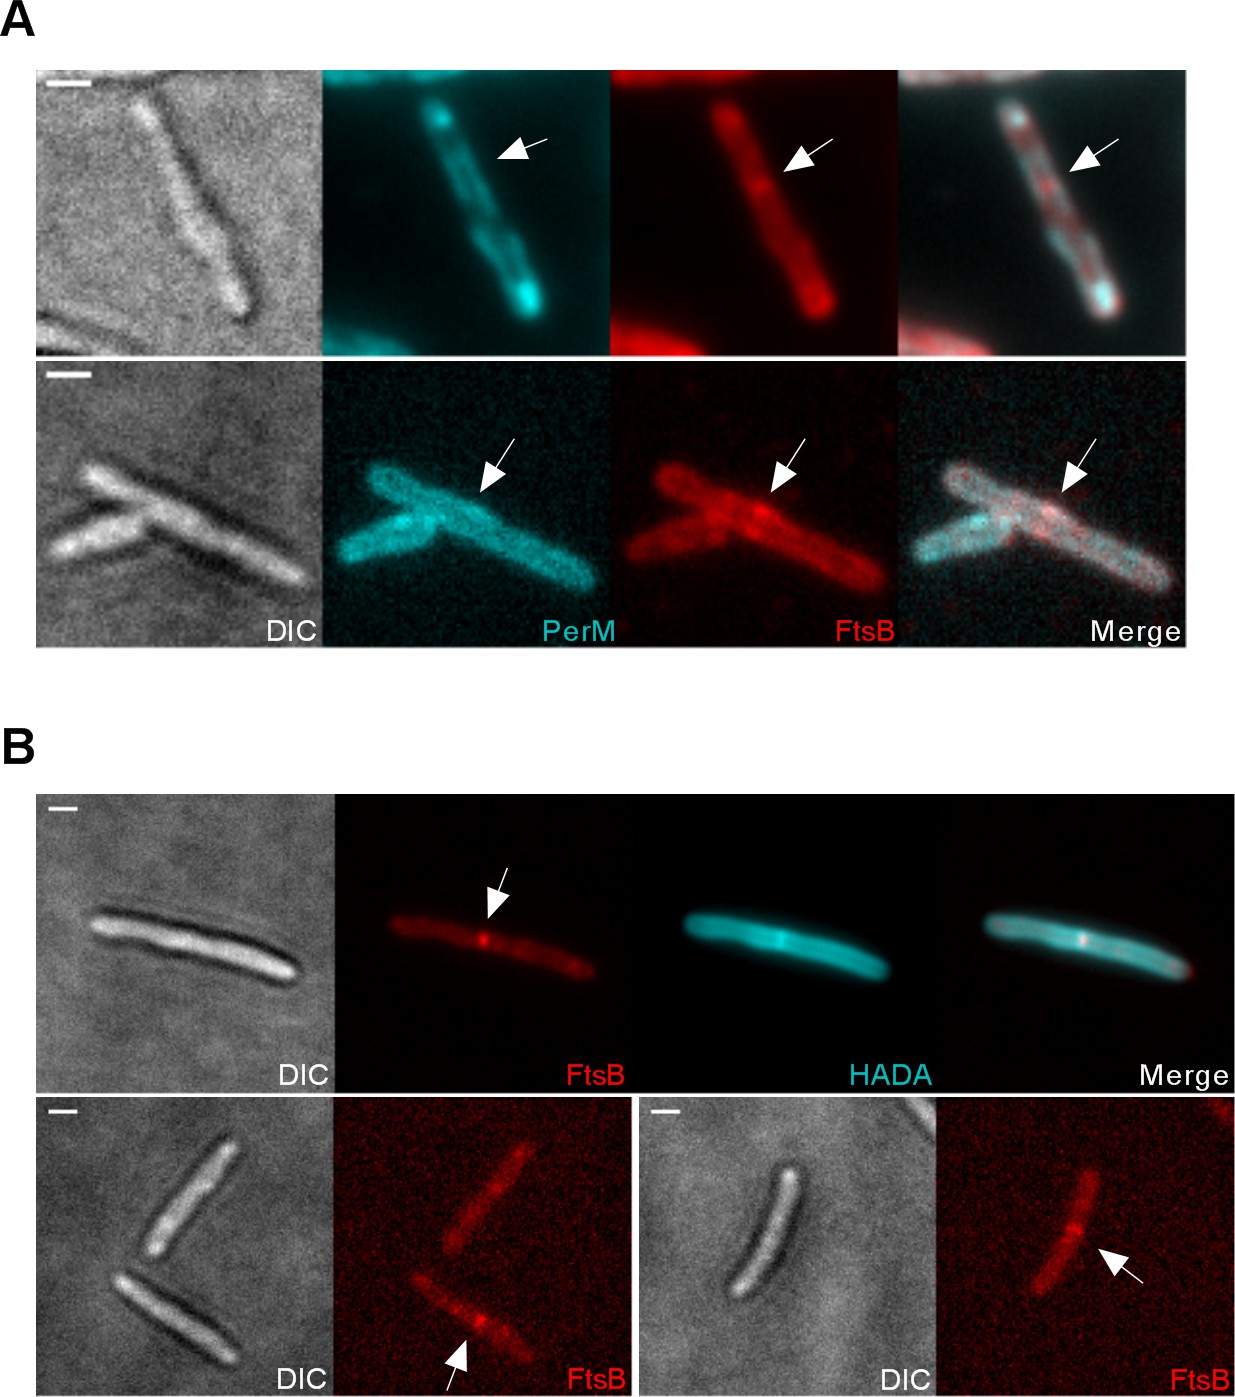
Localization of FtsB to the mid-cell does not depend on the presence of PerM.
(A) Representative microscopy images of M. smegmatis ∆perM expressing PerMmtb-GFP and mCherry-FtsBmtb under constitutive promoters. Arrows point to the absence of PerM and presence of FtsB at the mid-cell. Scale bar, 1 µm. (B) Representative microscopy images of M. smegmatis ∆perM expressing GFP-FtsBmtb under a constitutive promoter. Arrows point to FtsB signals at the mid-cell. Scale bar, 1 µm. Images are representative of two independent experiments. In the top panel, bacteria were incubated in the presence of 1 mM HADA for 6 hr to visualize the septa.
Figure 5—figure supplement 3
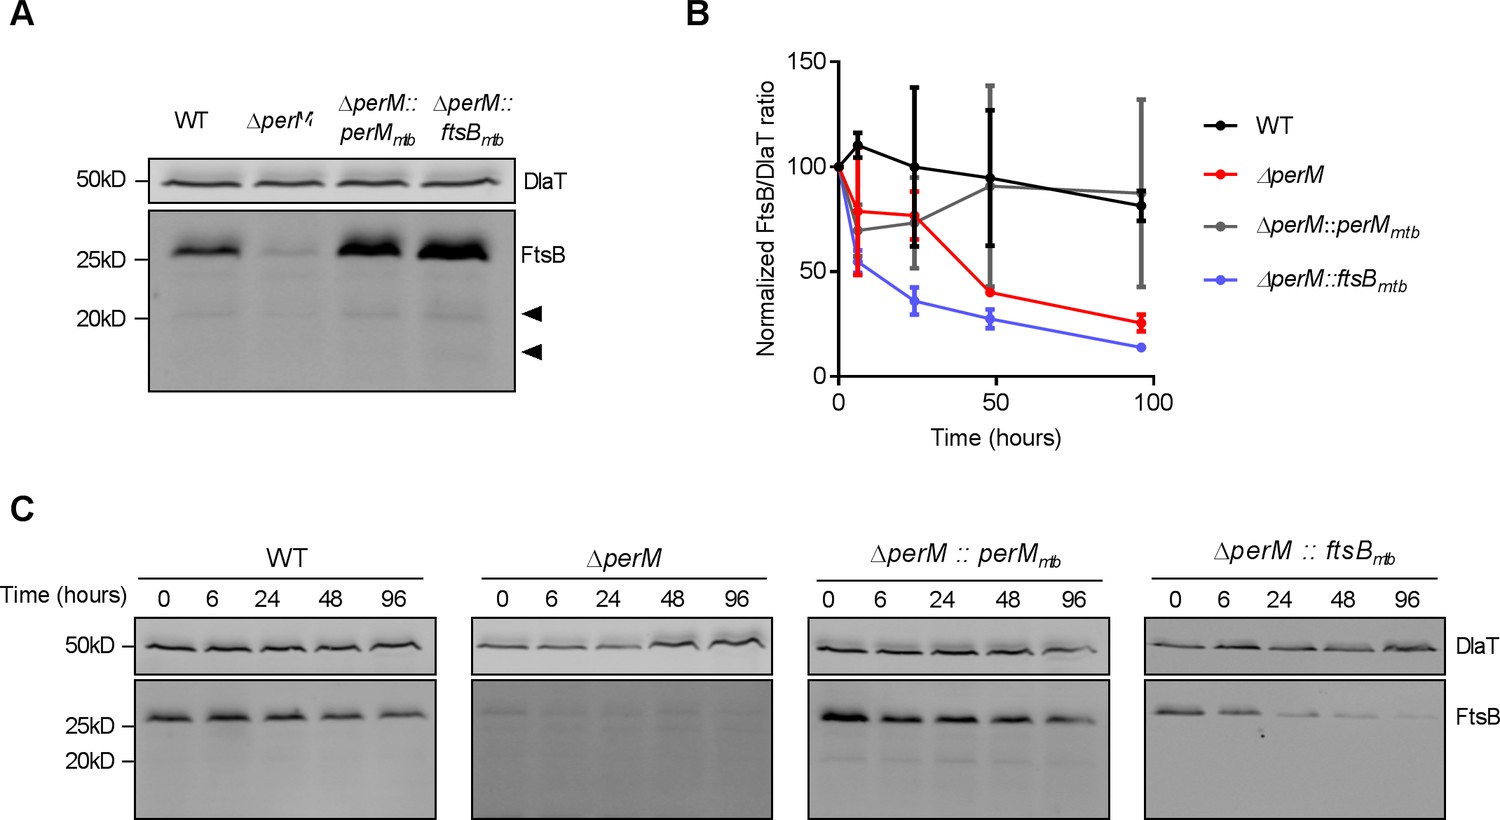
PerM stabilizes FtsB.
(A) Biological replicates of Figure 5C. (B) Quantification of FtsB band intensities from the western blots shown in Figure 5E and Figure 5 - figure supplement 3C. FtsB band intensities were normalized to that of DlaT and the FtsB/DlaT ratios at 0 hour were set to 100% for each strain. Data are means ± SD of biological duplicates. (C) Biological replicates of Figure 5E.
Figure 6 with 1 supplement
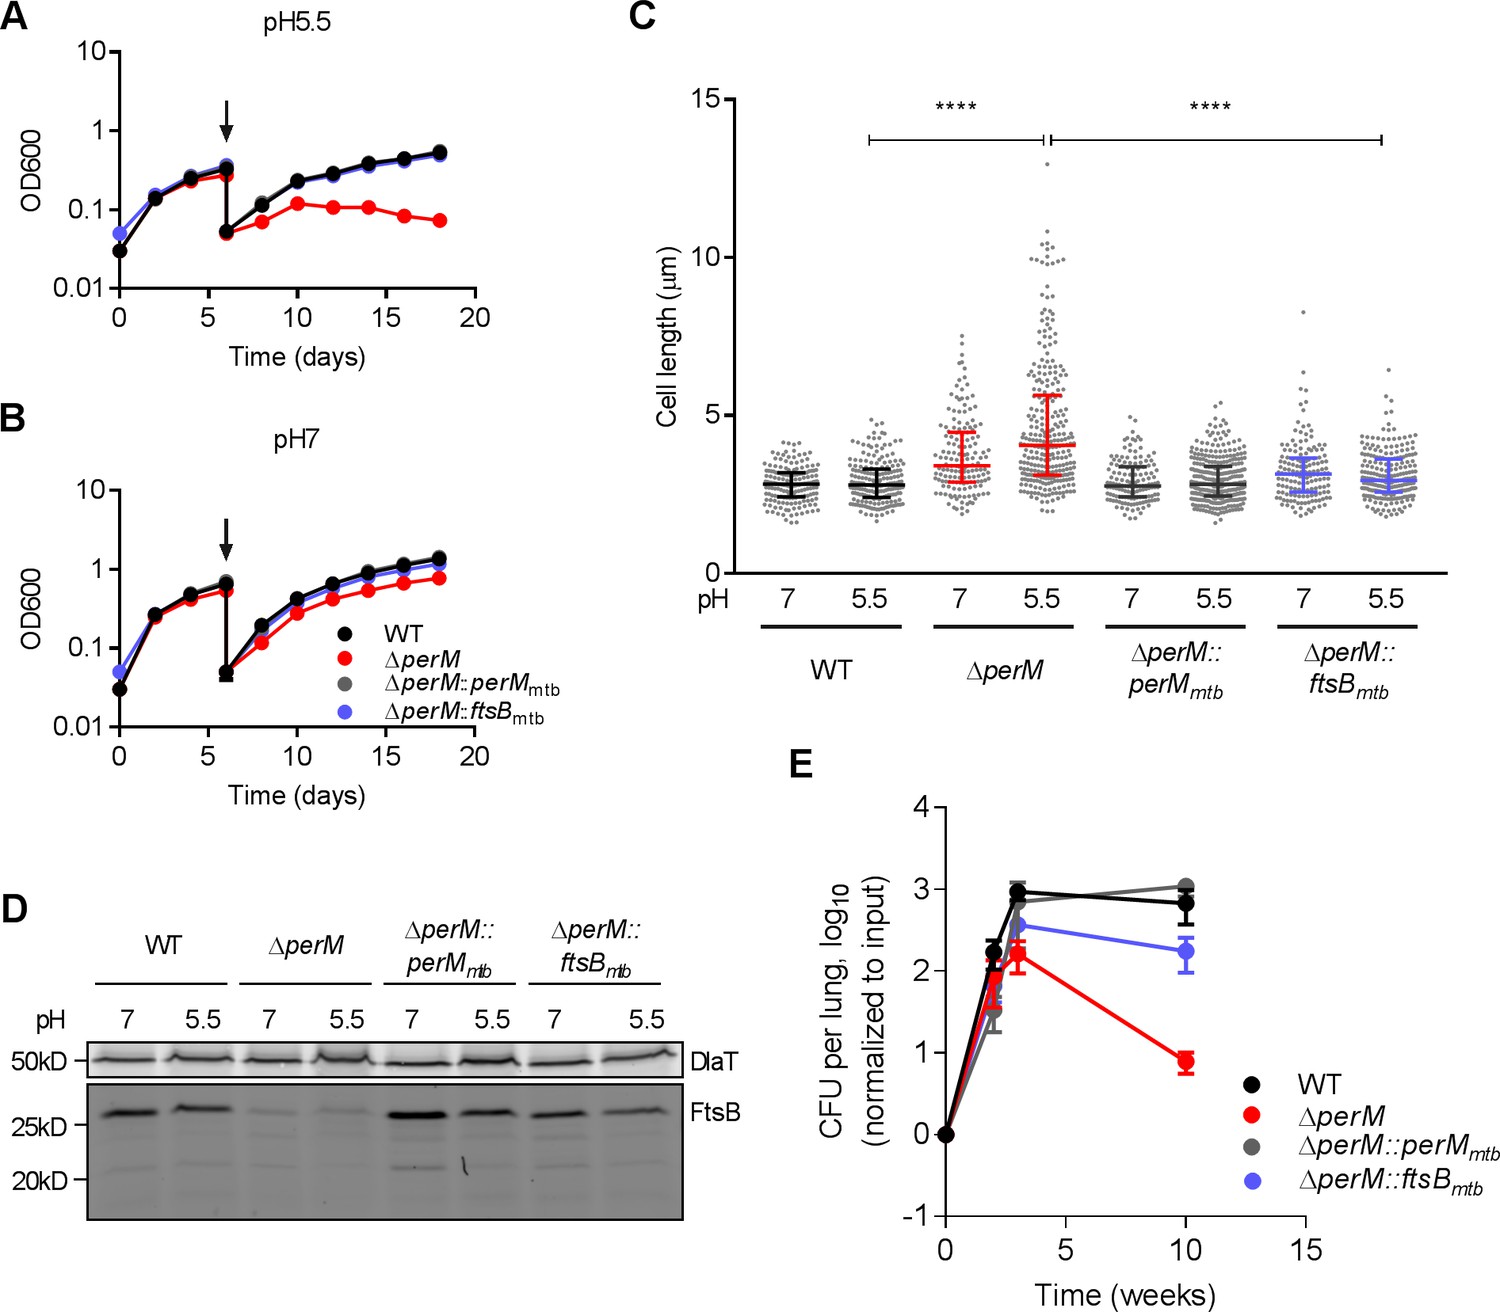
PerM is required for normal growth and cell division of Mtb in host-relevant stress conditions.
(A,B) Growth curves of Mtb strains sequentially cultured in 7H9 medium adjusted to either pH 5.5 (A) or pH 7 (B). At day 6 (arrows), the cultures were diluted in the same medium and samples collected for length quantification. Data are means ± SD of three replicates. (C) Scatter plots of the cell length of Mtb 6 days post incubation at either pH 5.5 or pH 7. The middle lines represent the medians and the bottom and top lines represent the 25th and 75th percentiles. P-values were calculated using Kruskal-Wallis test and corrected for multiple comparisons. ****, adj-P <0.0001. (D) FtsB levels in whole-cell protein lysates assayed by western blotting with anti-FtsB antibody. Whole-cell protein lysates were collected from Mtb cultured in 7H9 medium adjusted to either pH 7 or pH 5.5 for 3 or 6 days. DlaT was used as loading control. (E) Bacterial titers in lungs of C57BL/6 mice infected with indicated Mtb strains. Data are means ± SD of four mice and normalized to input. Data in (A, B and D) are representative of two independent experiments, and data in (C and E) are from one experiment.
-
Figure 6—source data 1
Summary statistics of Figure 6C.
- https://cdn.elifesciences.org/articles/49570/elife-49570-fig6-data1-v1.pdf
Figure 6—figure supplement 1
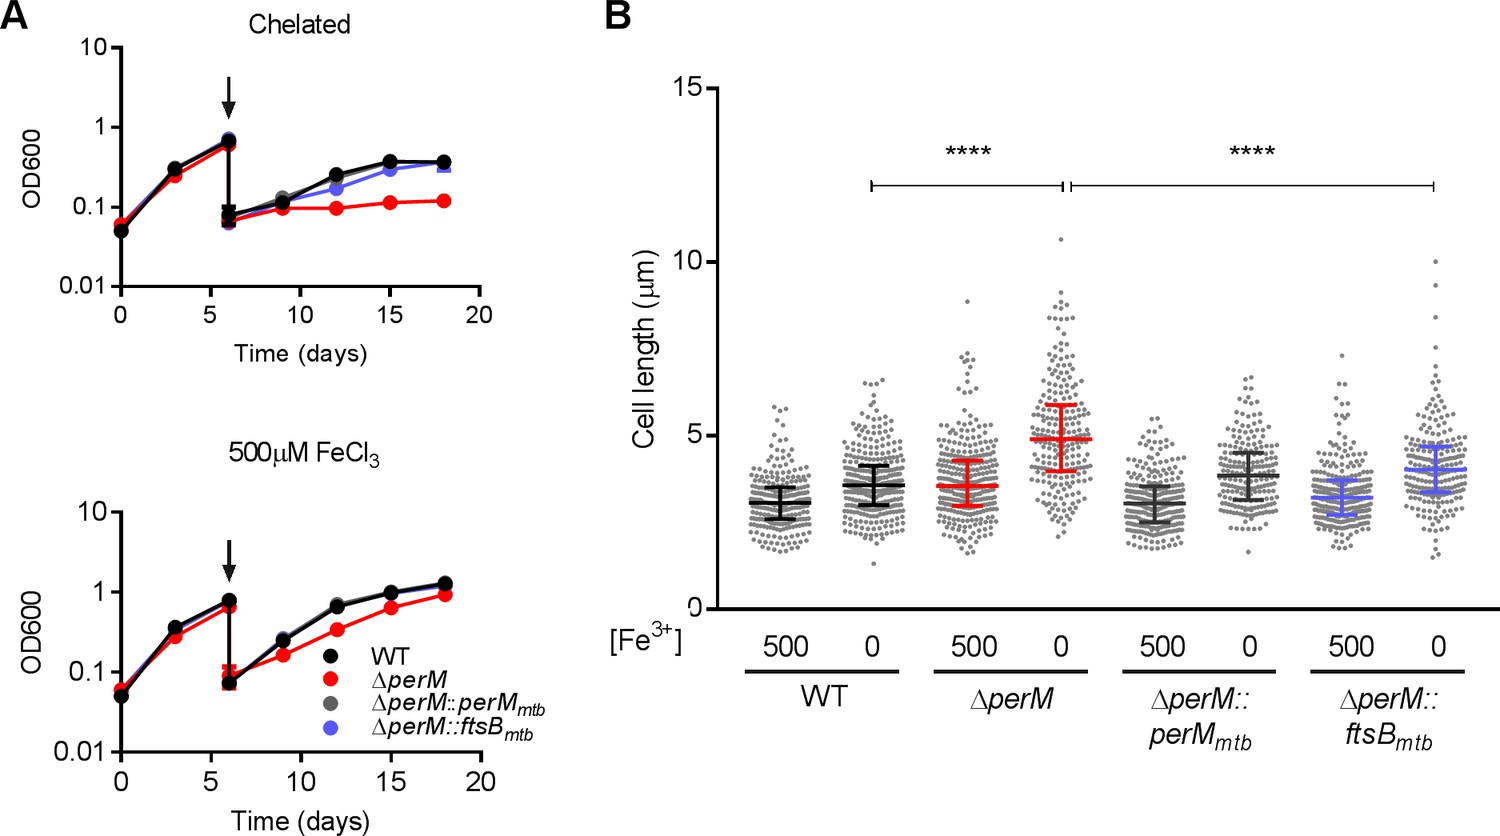
PerM is required for normal growth and cell division of Mtb in low-iron medium.
(A) Growth curves of Mtb sequentially cultured in chelated Sauton’s medium without adding Fe3+ or with addition of 500 µM FeCl3. On day 6, we diluted the cultures in the same medium, and collected samples for length quantifications. Data are means ± SD of three replicates. (B) Scatter plots of the cell lengths of Mtb after incubation in chelated Sauton’s medium or Sauton’s medium supplemented with 500 µM FeCl3 for 6 days. The middle lines represent the medians and the bottom and top lines represent the 25th and 75th percentiles. P-values were calculated using Kruskal-Wallis test and corrected for multiple comparisons. ****, adj-P <0.0001. Data in (A) are representative of two independent experiments, and measurements in (B) are from one experiment.
-
Figure 6—figure supplement 1—source data 1
Summary statistics of Figure 6—figure supplement 1B.
- https://cdn.elifesciences.org/articles/49570/elife-49570-fig6-figsupp1-data1-v1.pdf
Tables
Table 1
Mass spectrometry identification of protein interaction partners of FtsB in Mtb.
| Rv # | Gene | Annotation | Sum total spectrum count |
|---|---|---|---|
| Rv1687c | ABC transporter ATP-binding protein | 20 | |
| Rv2901c | Hypothetical protein | 16 | |
| Rv1280c | oppA | Probable periplasmic oligopeptide-binding lipoprotein OppA | 16 |
| Rv2151c | ftsQ | Cell division protein FtsQ | 15 |
| Rv1697 | Hypothetical protein | 14 | |
| Rv3330 | dacB1 | Probable penicillin-binding protein DacB1 | 14 |
| Rv1698 | mctB | Outer membrane protein MctB | 14 |
| Rv1266c | pknH | Serine/threonine protein kinase | 12 |
| Rv2748c | ftsK | Cell division protein FtsK | 11 |
| Rv0955 | perM | 11 | |
| Rv0050 | ponA1 | Peptidoglycan glycosyltransferase | 10 |
| Rv3493c | MCE-associated alanine and valine rich protein | 10 | |
| Rv0497 | Probable conserved transmembrane protein | 10 | |
| Rv3212 | Conserved alanine valine rich protein | 9 | |
| Rv0046c | ino1 | Inositol-1-phosphate synthase | 8 |
-
Flag-FtsBmtb was immunoprecipitated from whole-cell lysates of Mtb. Whole-cell lysates of an Mtb strain constitutively expressing only the Flag-tag served as control. The protein interaction partners were identified by mass spectrometry and data are from two independent biological replicates.
-
Table 1—source data 1
Mass spectrometry data of FtsB pulldown in Mtb.
- https://cdn.elifesciences.org/articles/49570/elife-49570-table1-data1-v1.xlsx
Key resources table
| Reagent type (species) or resource | Designation | Source or reference | Identifiers | Additional information |
|---|---|---|---|---|
| Strain, strain background (Mycobacterium tuberculosis) | WT | This work | H37Rv | |
| Strain, strain background (Mycobacterium tuberculosis) | ∆perM | doi: 10.1128/AAC.01334-17 | H37Rv | |
| Strain, strain background (Mycobacterium tuberculosis) | ∆perM::perMmtb | This work | H37Rv ∆perM::hsp60-perMmtb | |
| Strain, strain background (Mycobacterium tuberculosis) | ∆perM::ftsBmtb | This work | H37Rv ∆perM::hsp60-ftsBmtb | |
| Strain, strain background (Mycobacterium tuberculosis) | WT-pBP10 | This work Plasmid information in doi: 10.1038/nm.1915 | H37Rv pBP10 plasmid obtained from Dr. David Sherman (University of Washington) | |
| Strain, strain background (Mycobacterium tuberculosis) | ∆perM-pBP10 | This work Plasmid information in doi: 10.1038/nm.1915 | H37Rv pBP10 plasmid obtained from Dr. David Sherman (University of Washington) | |
| Strain, strain background (Mycobacterium tuberculosis) | WT::hsp60-flag | This work | H37Rv | |
| Strain, strain background (Mycobacterium tuberculosis) | WT::hsp60-flag-ftsBmtb | This work | H37Rv | |
| Strain, strain background (Mycobacterium smegmatis) | WT | This work | mc2155 | |
| Strain, strain background (Mycobacterium smegmatis) | perM-DUC | This work | mc2155 ΔperM::T38S38-P766-9T-perMmtb-gfp-das+4::TSC10M1-SD2-SSPB | |
| Strain, strain background (Mycobacterium smegmatis) | perM-DUC-control | This work | mc2155 perM-DUC + hsp60-empty | |
| Strain, strain background (Mycobacterium smegmatis) | perM-DUC- perMmtb | This work | mc2155 perM-DUC + hsp60-perMmtb-gfp | |
| Strain, strain background (Mycobacterium smegmatis) | perM-DUC- perMmsm | This work | mc2155 perM-DUC + hsp60-perMmsm-gfp | |
| Strain, strain background (Mycobacterium smegmatis) | perM-DUC-ftsBmtb | This work | mc2155 perM-DUC + hsp60-ftsBmtb | |
| Strain, strain background (Mycobacterium smegmatis) | perM-DUC-ftsBmsm | This work | mc2155 perM-DUC + hsp60-ftsBmsm | |
| Strain, strain background (Mycobacterium smegmatis) | ΔperM::P38-perMmtb-mcherry:: hsp60-gfp-ftsBmtb | This work | mc2155 | |
| Strain, strain background (Mycobacterium smegmatis) | ΔperM::P38-perMmtb-mcherry:: hsp60-gfp | This work | mc2155 | |
| Strain, strain background (Mycobacterium smegmatis) | WT::P38-gfp + hsp60-snap-ftsBmtb | This work | mc2155 | |
| Strain, strain background (Mycobacterium smegmatis) | WT::P38-perMmtb-gfp + hsp60-snap-ftsBmtb | This work | mc2155 | |
| Strain, strain background (Mycobacterium smegmatis) | ΔperM::P38-perMmtb-gfp::hsp60-mcherry-ftsBmtb | This work | mc2155 | |
| Strain, strain background (Mycobacterium smegmatis) | ΔperM::P38-gfp-ftsBmtb | This work | mc2155 | |
| Strain, strain background (Mycobacterium smegmatis) | ΔperM::hsp60-gfp-ftsBmtb | This work | mc2155 | |
| Antibody | Anti-Flag M2 affinity gel | Sigma | A2220 | |
| Antibody | Anti-GFP mAb-agarose beads | MBL | D153-8 | |
| Antibody | Anti-GFP mAb-magnetic beads | MBL | D153-11 | |
| Antibody | Anti-FtsB (Rabbit polyclonal) | GenScript | U1550BG270 | (1:1000) |
| Antibody | Anti-DlaT (Rabbit polyclonal) | doi: 10.1126/science.1067798 | Antibody from Drs. Carl Nathan and Ruslana Bryk (Weill Cornell Medicine) (1:10000) | |
| Antibody | Anti-GFP (Mouse monoclonal) | Clontech | 632380 | (1:8000) |
| Antibody | Anti-mCherry (Mouse monoclonal) | Clontech | 632543 | (1:1000) |
| Antibody | Anti-SNAP (Rabbit polyclonal) | New England BioLabs | P9310S | (1:1000) |
| Antibody | donkey anti-rabbit 680 | LI-COR Biosciences | 926–68023 | (1:10000) |
| Antibody | donkey anti-rabbit 800 | LI-COR Biosciences | 926–32213 | (1:10000) |
| Antibody | goat anti-mouse 800 | LI-COR Biosciences | 926–32210 | (1:5000) |
| Peptide, recombinant protein | FLAG peptide | Sigma | F3290 | (100 ng/µl) |
| Software, algorithm | Prism 7 | Graphpad | ||
| Software, algorithm | ImageJ | doi: 10.1038/nmeth.2089 | ||
| Software, algorithm | Icy | doi:10.1038/nmeth.2075 | ||
| Software, algorithm | Scaffold 4 | |||
| Other | SYTO 13 Green Fluorescent Nucleic Acid Stain | Thermo Fisher Scientific | S7575 | (5 μM) |
| Other | HADA | doi: 10.1002/anie.201206749;doi: 10.1038/nprot.2014.197 | (1 mM) Synthesized by the Chemical Synthesis Core Facility at MSKCC | |
| Other | NADA | doi: 10.1002/anie.201206749;doi: 10.1038/nprot.2014.197 | (1 mM) Synthesized by the Chemical Synthesis Core Facility at MSKCC |
Additional files
Download links
A two-part list of links to download the article, or parts of the article, in various formats.
Downloads (link to download the article as PDF)
Open citations (links to open the citations from this article in various online reference manager services)
Cite this article (links to download the citations from this article in formats compatible with various reference manager tools)
Persistent Mycobacterium tuberculosis infection in mice requires PerM for successful cell division
eLife 8:e49570.
https://doi.org/10.7554/eLife.49570


