The HCN domain couples voltage gating and cAMP response in hyperpolarization-activated cyclic nucleotide-gated channels
- University of Milan, Italy
- TU-Darmstadt, Germany
- Columbia University, United States
Figures
Figure 1

Hydrophobic and hydrophilic interactions established by the HCN domain with the voltage sensor domain and the C-linker.
(A) Side view of two opposite subunits of HCN1 (PDB_ID: 5U6O) with the HCN domain (HCND) shown in orange, the voltage sensor domain VSD (TM S1-S4) in violet and C-linker ‘elbow’ (helices A’ and B’) in green. The pore domain (TM S5-S6), the CNBD and helices C’-D’-E’-F’ of the C-linker are in grey. (B) Blow-up of the structure in (A) showing the position of residues F109 and I135 of the HCND engaged in hydrophobic interactions with the VSD of the same subunit. Red spheres represent the van der Waals surface of the side chains of F109 and I135. (C) Detailed view of the electrostatic interactions between the HCND and the C-linker helices belonging to the adjacent and opposite subunit (light green, adjacent; dark green, opposite). R112 and M113 of HCND interact, respectively, with E436 and K4226 of the C-linker. Salt bridges are represented as dashed black lines. Residues of interest are labelled in red using hHCN1 numbering. HCNa,b and c are labelled according to Lee and MacKinnon (2017). (D) Top view of the tetrameric arrangement of the C-linker helices A’ and B’ showing their interactions with the HCND. The side chains of the residues engaged in the electrostatic interactions connecting the HCNDs to the C-linker ring are shown as red sticks. A’ and B’ helices of the C-linker belonging to the adjacent or opposite subunit (referring to the labelled HCN domain on the top left only) are colored in light and dark green, respectively.
Figure 2 with 3 supplements
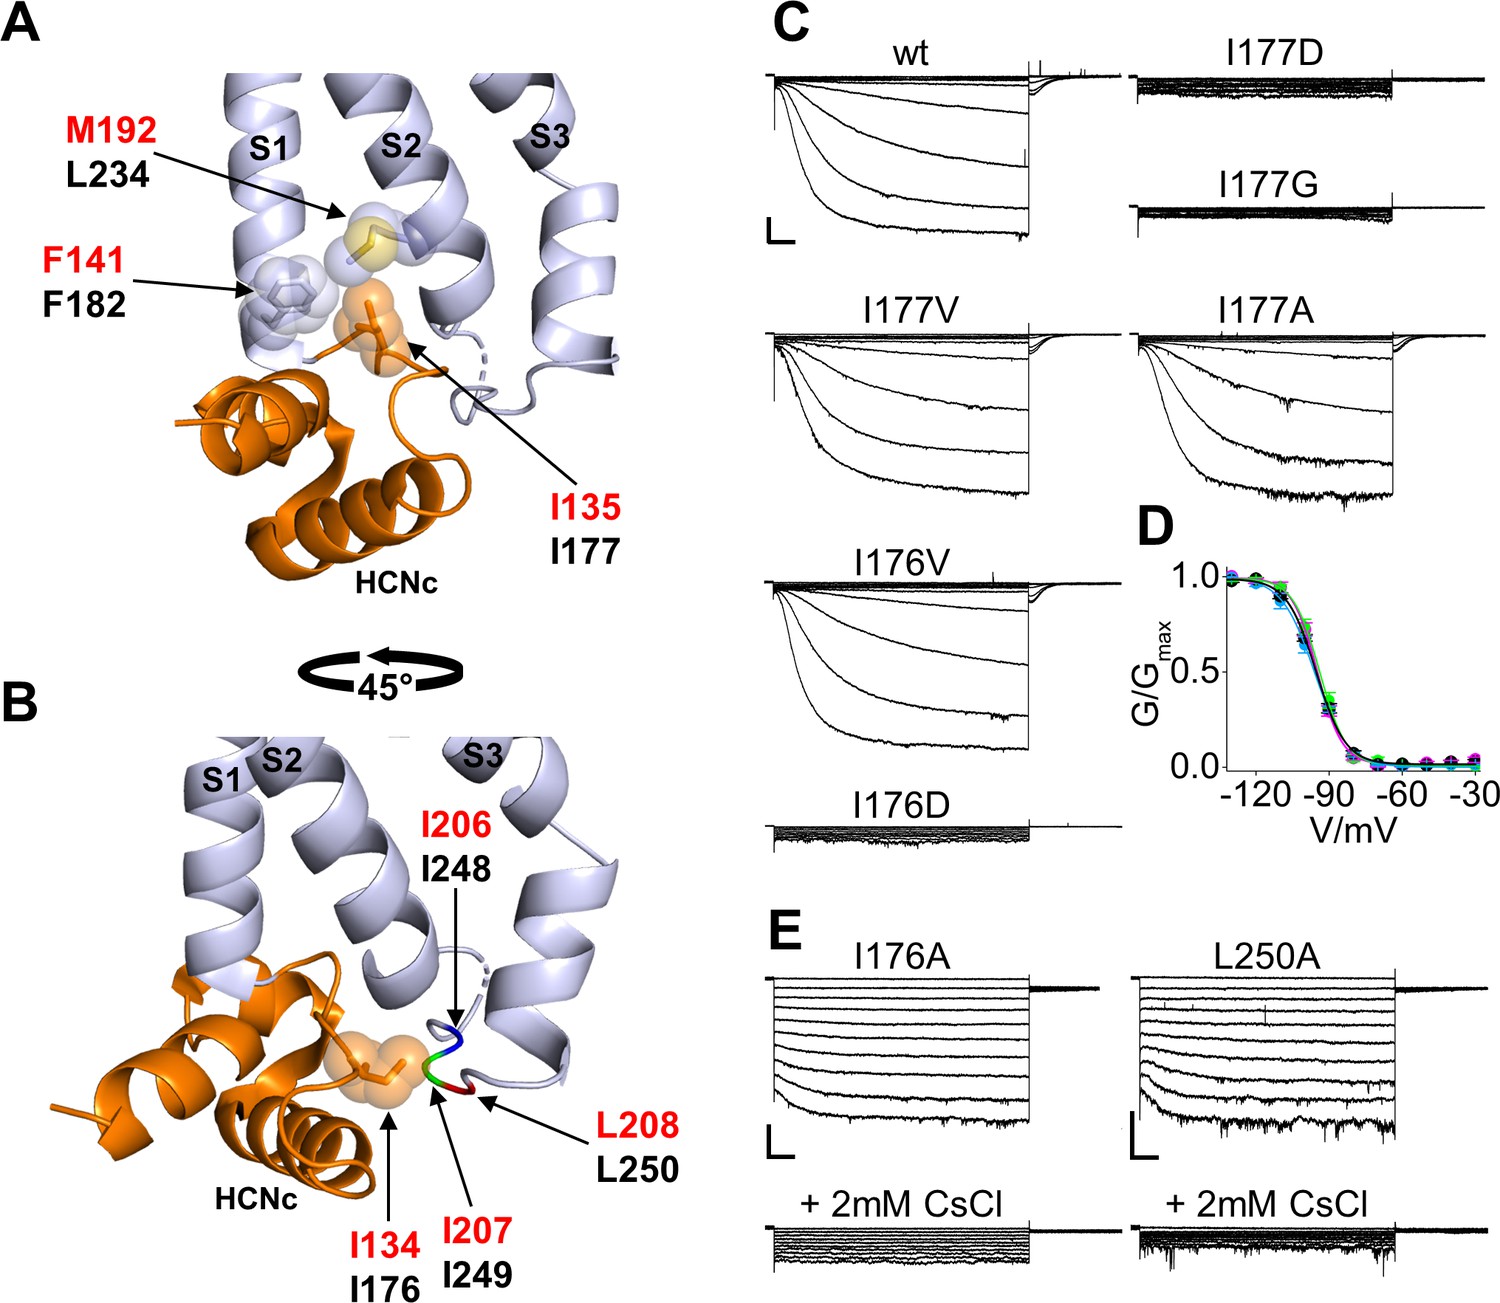
Interaction of HCND with the voltage sensor domain: mutational analysis in the first hydrophobic pocket.
(A) Detailed view of one HCN1 subunit (PDB_ID: 5U6O) color coded as in Figure 1 showing I135 side chain inserted in the hydrophobic pocket formed by F141 in the TM S1 and M192 in the TM S2 of the VSD. The side chains of the residues involved in the hydrophobic interactions are shown as sticks surrounded by spheres representing the occupied van der Waals surface. (B) Detailed view of I134 pointing towards the cytosolic S2-S3 loop. The backbones of hydrophobic residues I206, I207, and L208 of the loop are shown in different colors; their side chains are not assigned in the structure (PDB_ID: 5U6O). Red labels: hHCN1 numbering; black labels: mHCN2 numbering. (C) Representative whole-cell currents of wt HCN2 channels and I177D/G/V/A and I176V/D mutants. The voltage step protocol is described in Materials and methods. (D) Activation curves (mean values ± SEM) from wt (black), I177V (green), I177A (cyan) and I176V (magenta) mutant channels. Lines show data fit to a Boltzmann function (Equation (1) in Materials and methods). Calculated half activation potential (V1/2) and inverse slope factor (k) values together with details on statistical analysis are reported in Supplementary file 1A. (E) Representative whole-cell current of I176A or L250A mutant channels, before (top) and after (bottom) the addition of 2 mM CsCl to the external solution. Scale bars are 100 pA x 500 ms.
Figure 2—figure supplement 1
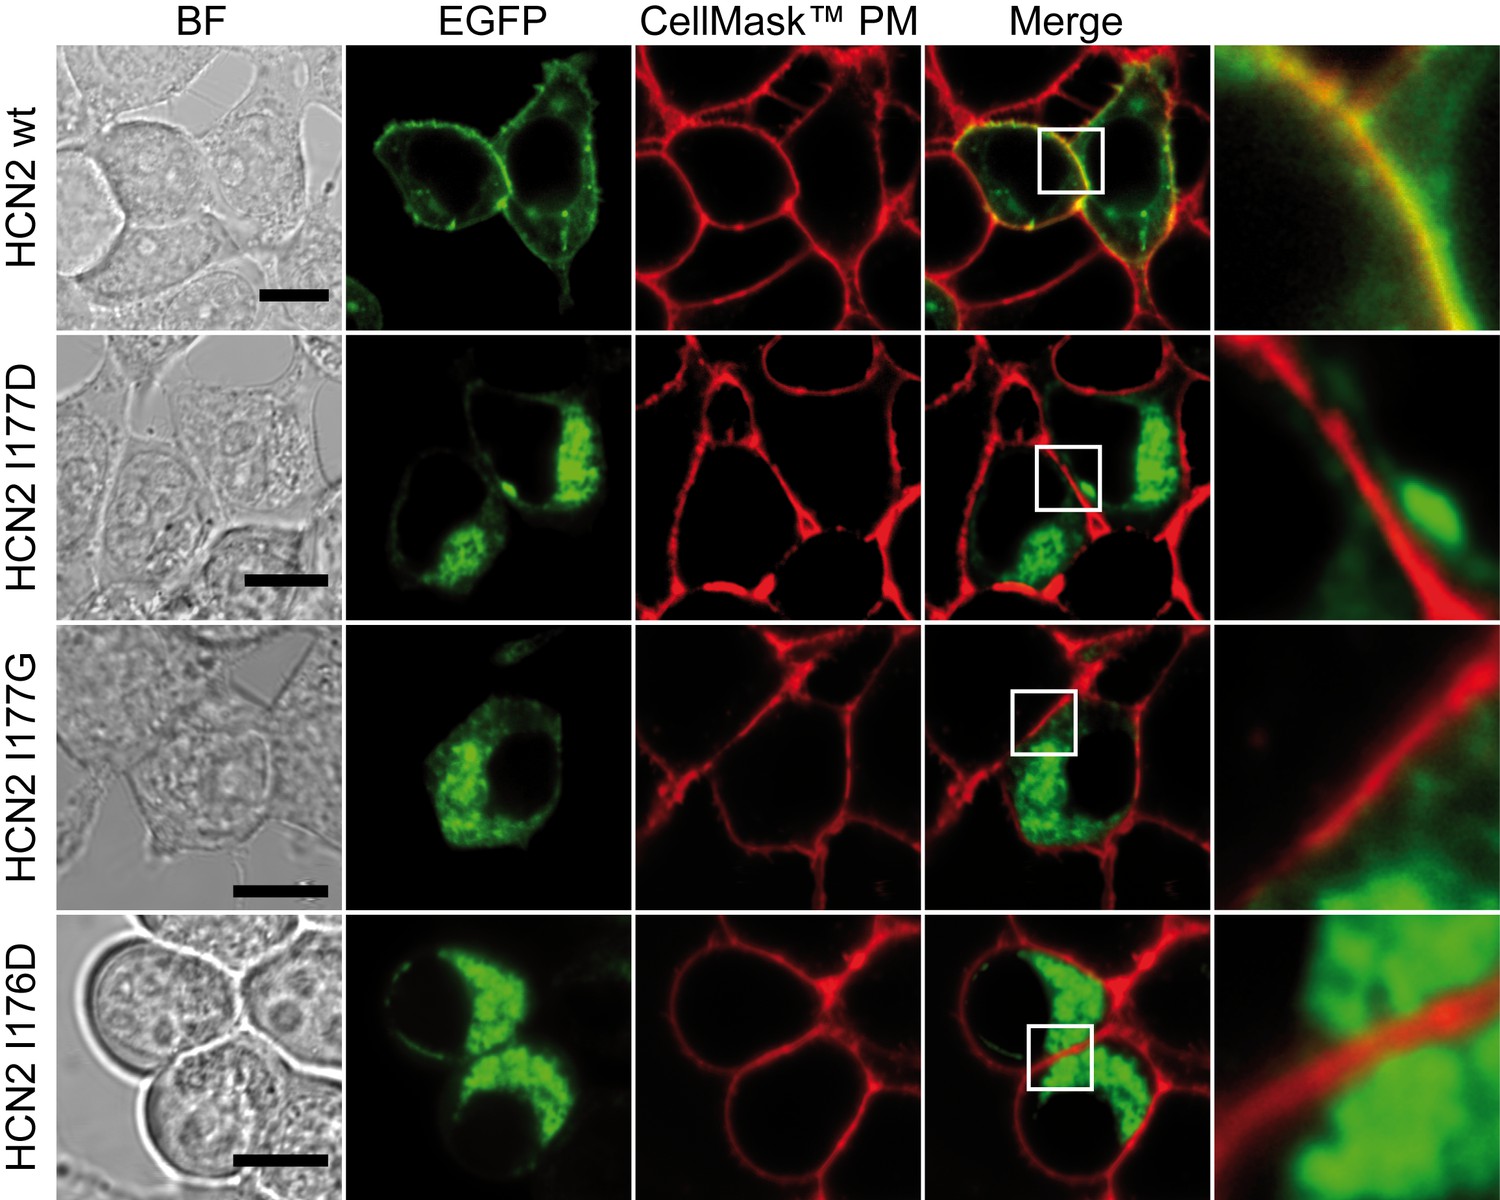
Cellular localization of EGFP-HCN2 I177D/G and I176D mutant channels.
HEK293T cells were transfected with the constructs indicated on the left of each panel and analysed by confocal microscopy. From left: the first column shows the Bright Field (BF) image, scale bar is 10 µm; the second and third columns show in green the signal corresponding to the emissions of the EGFP fused to the ion channel and in red the Plasma Membrane staining with CellMask Deep Red (Invitrogen), respectively. The fourth column shows the merged images of EGFP and Plasma Membrane Staining: colocalization signal is indicated by the presence of yellow color as highlighted in the detailed views (white square) reported in the last column. Note the loss of colocalization with Plasma Membrane signal when I177D, I177G or I176D mutants are expressed.
Figure 2—figure supplement 2
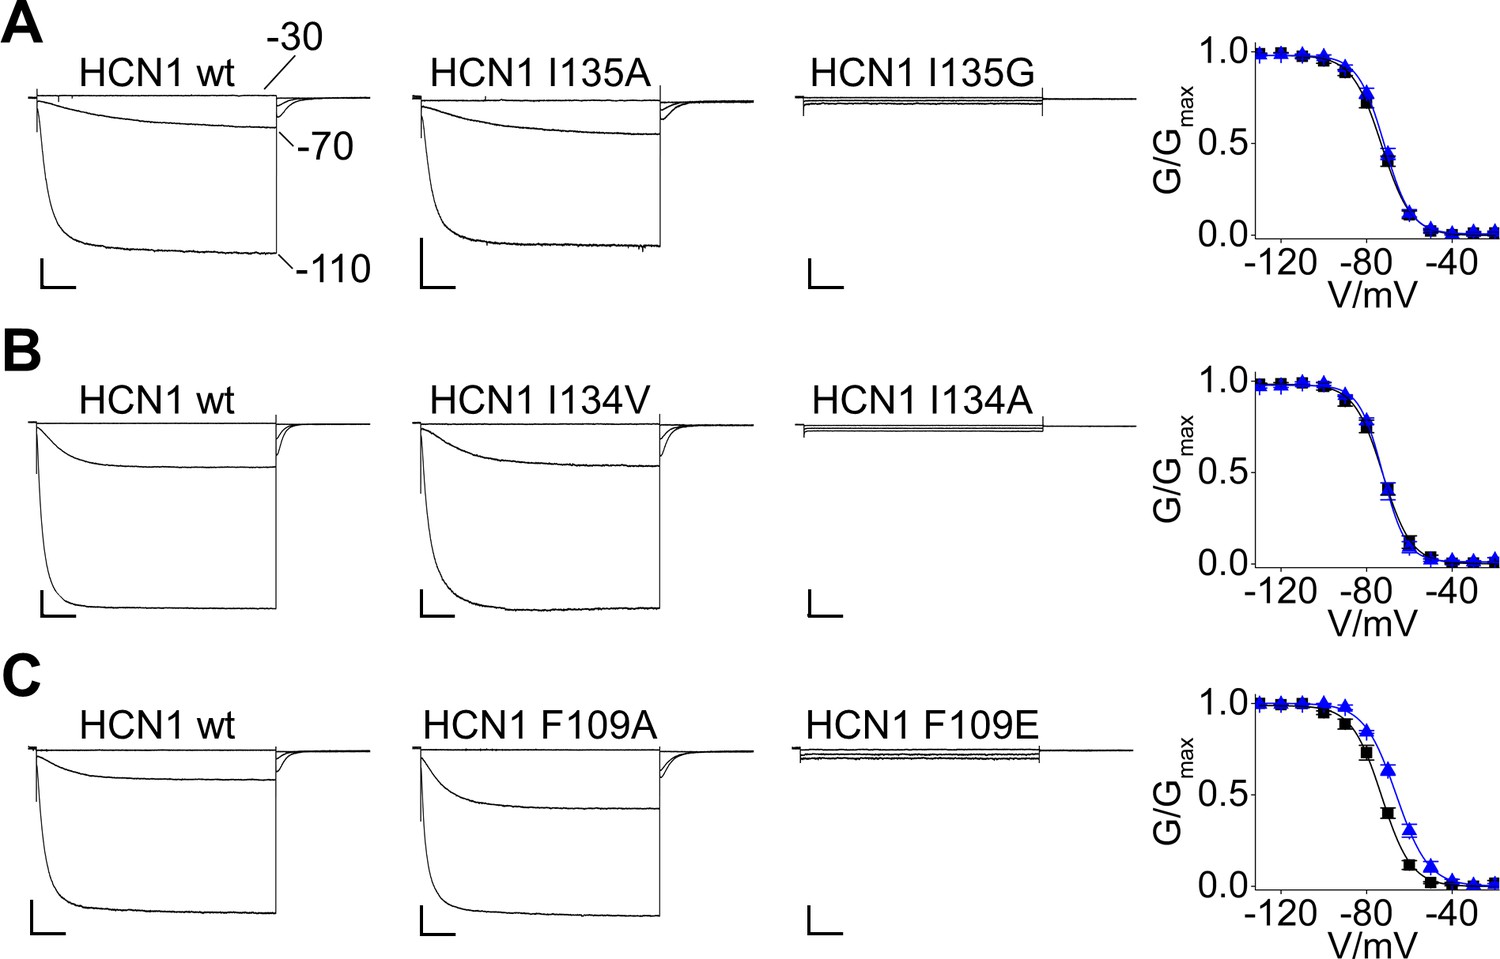
Analysis of currents recorded from HCN1 I134, I135 and F109 mutants.
Representative whole-cell currents recorded, at the indicated voltages, from HEK293T cells transiently expressing wt, I135A, I135G, I134V, I134A, F109A and F109E mutants. The graphs on the right show mean tail current activation curves of wt (black squares) and I135A (blue triangles) (A), I134V (blue triangles) (B) or F109A (blue triangles) (C). Lines show data fit to a Boltzmann function (Materials and methods) providing half activation potential (V1/2) and inverse slope factor (k) values reported in Supplementary file 1B. Values are shown as mean ± SEM. Scale bar is 200 pA x 500 ms.
Figure 2—figure supplement 3
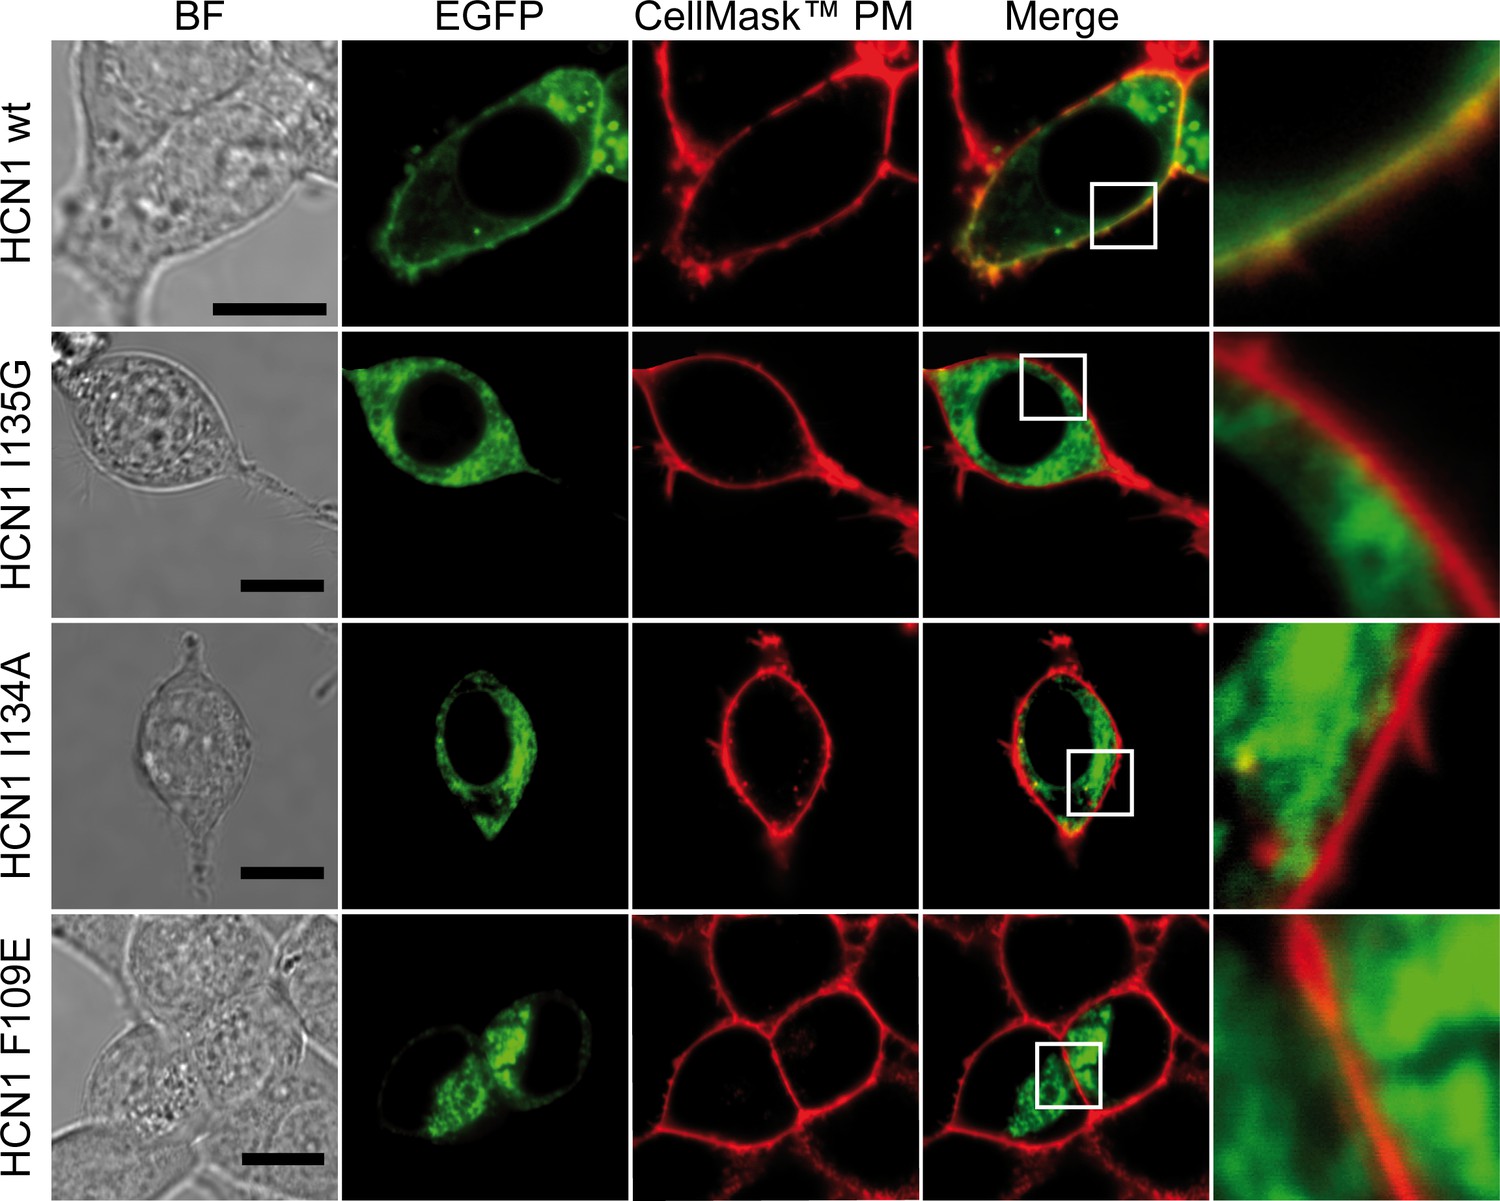
Cellular localization of EGFP-HCN1 I135G, I134A and F109E mutant channels.
HEK293T cells were transfected with the constructs indicated on the left of each panel and analysed by confocal microscopy. From left: the first column shows the Bright Field (BF) image, scale bar is 10 µm; the second and third columns show in green the signal corresponding to the emissions of the EGFP fused to the ion channel and in red the Plasma Membrane staining with CellMask Deep Red (Invitrogen), respectively. The last column shows the merged images of EGFP and Plasma Membrane Staining: colocalization signal is indicated by the presence of yellow color as highlighted in the detailed views (white square) reported in the last column. Note the loss of colocalization with Plasma Membrane signal when I135G, I134A or F109E mutants are expressed.
Figure 3
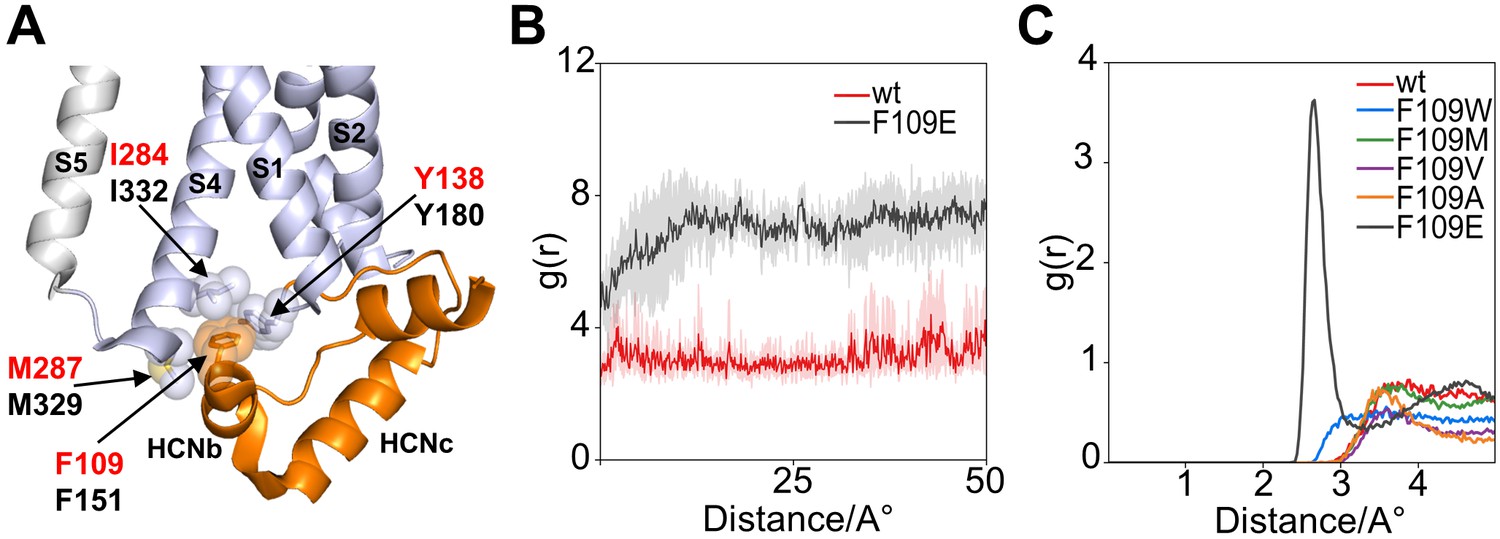
Interaction of HCND with the voltage sensor domain: MD simulation on the second hydrophobic pocket.
(A) Enlarged view of HCN1 subunit (PDB_ID: 5U6O) color coded as in Figure 1 showing the hydrophobic interactions of F109 with I284 and M287 from TM S4 and Y138 from the loop connecting HCND to TM S1. Spheres represent the van der Waals surface occupied by the side chains. Helices S1 and S4 of the VSD, S5 of the pore domain, HCNb and HCNc of the HCND are labelled. Residues are labelled either in red or black using hHCN1 or mHCN2 numbering, respectively. (B) Shortest measured distances between side chain atoms of residue 109 and Y138 in wt (red) and F109E (black) channels over simulation time (50ns). For each simulation time step, the distance between all atoms of then respective side chains were measured and the shortest found distance was plotted over time. Solid lines indicate the average over the four subunits with translucent error bands in the back. It can be seen that the distance for F109E increases during the first 10ns of simulation because the side chain rotates out of the hydrophobic pocket. In contrast, the wt side chain stays inserted in the pocket and close to residue 138. (C) Radial distribution function g(r) for water oxygen atoms around the side chain of residue 109. The g(r) plot describes the probability of finding a water molecule at a given distance from the side chain. Only F109E is fully solvated and shows a peak for the first solvation shell of the γ caboxyl group.
Figure 4 with 2 supplements
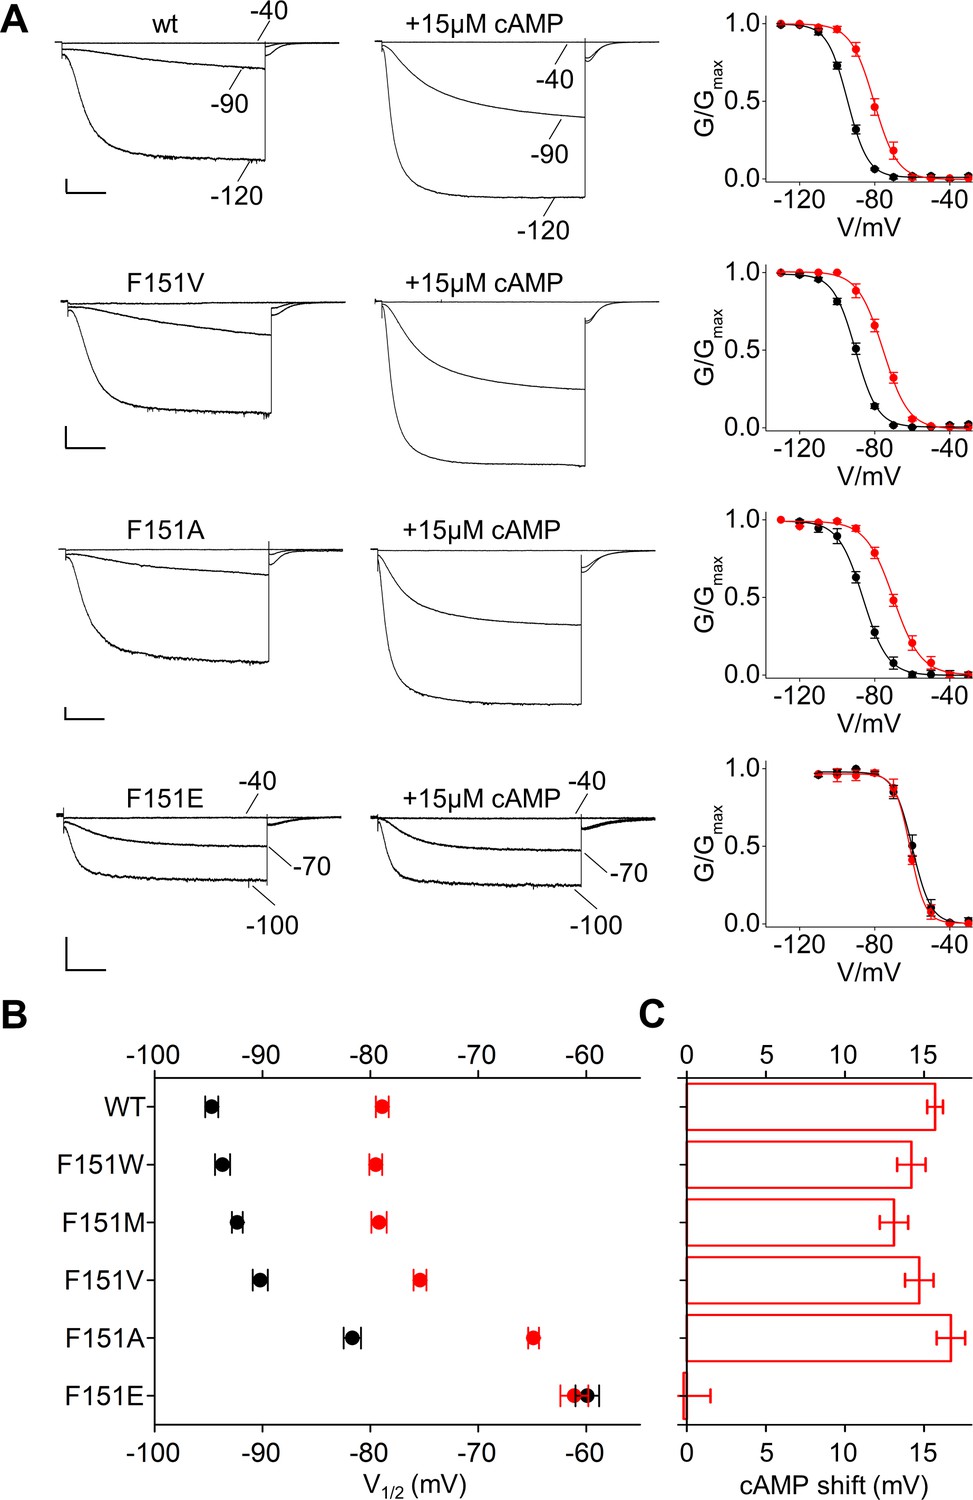
Interaction of HCND with the voltage sensor domain: mutational analysis of HCN2 residue F151.
(A) Representative whole-cell currents recorded, at the indicated voltages, from HCN2 wt, F151V, F151A and F151E channels in the absence and in the presence of 15 µM cAMP. Graphs to the right show corresponding mean activation curves, without (black) and with (red) cAMP. Lines show data fit to a Boltzmann function (Materials and methods) providing half activation potential (V1/2) and inverse slope factor (k) values reported in Supplementary file 1A. (B) Mean V1/2 values of all F151 mutants, including F151M/W (currents and activation curves shown in Figure 4—figure supplement 1). Black symbols, control; red symbols, + 15 µM cAMP. (C) cAMP-induced shift in V1/2. Values measured for F151W/M/V/A are not significantly different from wt. Data are shown as mean ± SEM. Scale bar: 200 pA x 500 ms. V1/2 values, slope factors and statistical analysis are reported in Supplementary file 1A.
Figure 4—figure supplement 1
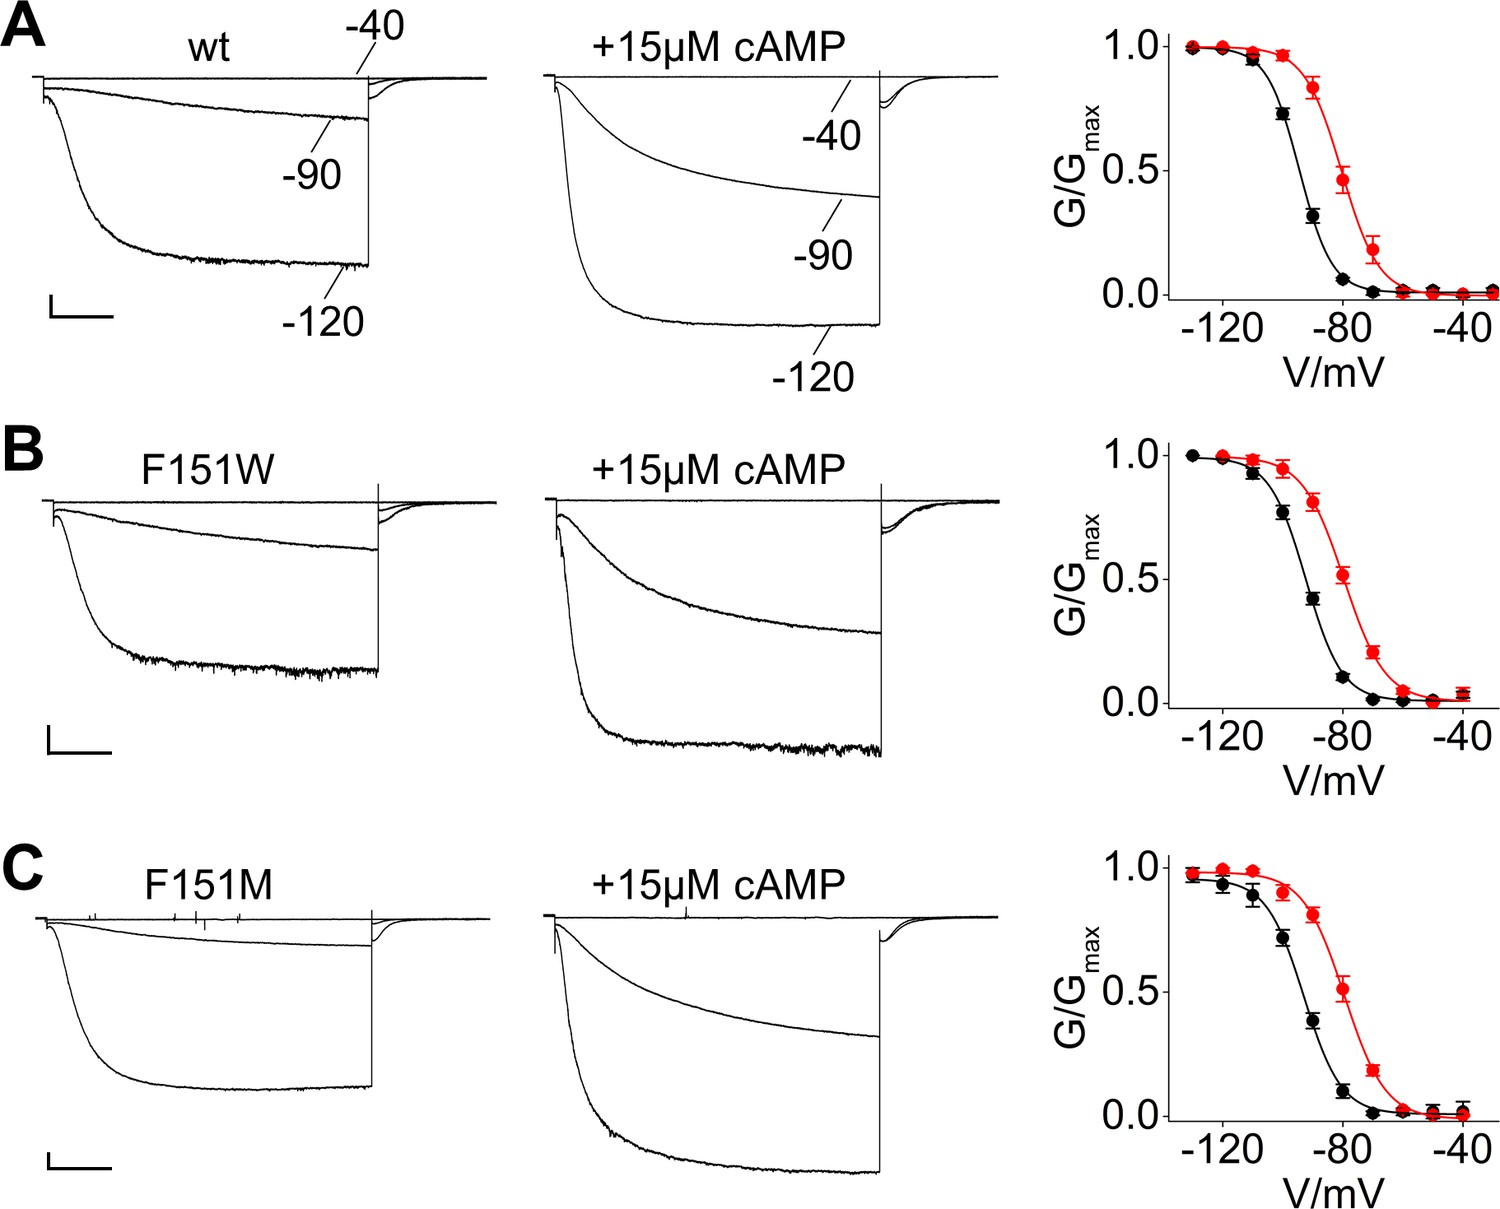
Analysis of currents recorded from HCN2 F151 mutants.
Representative whole-cell currents recorded, at the indicated voltages, from HEK293T cells transiently expressing wt (A), F151W (B) and F151M (C) HCN2 channel both in the absence and in the presence of 15 µM cAMP as indicated. Right graphs show mean tail current activation curves in the absence (black circles) and in the presence of cAMP (red circles). Lines show data fit to a Boltzmann function (Materials and methods) providing half activation potential (V1/2) and inverse slope factor (k) values reported in Supplementary file 1A. Values are shown as mean ± SEM. Scale bar: 200 pA x 500 ms. Wild-type currents are the same of Figure 4.
Figure 4—figure supplement 2
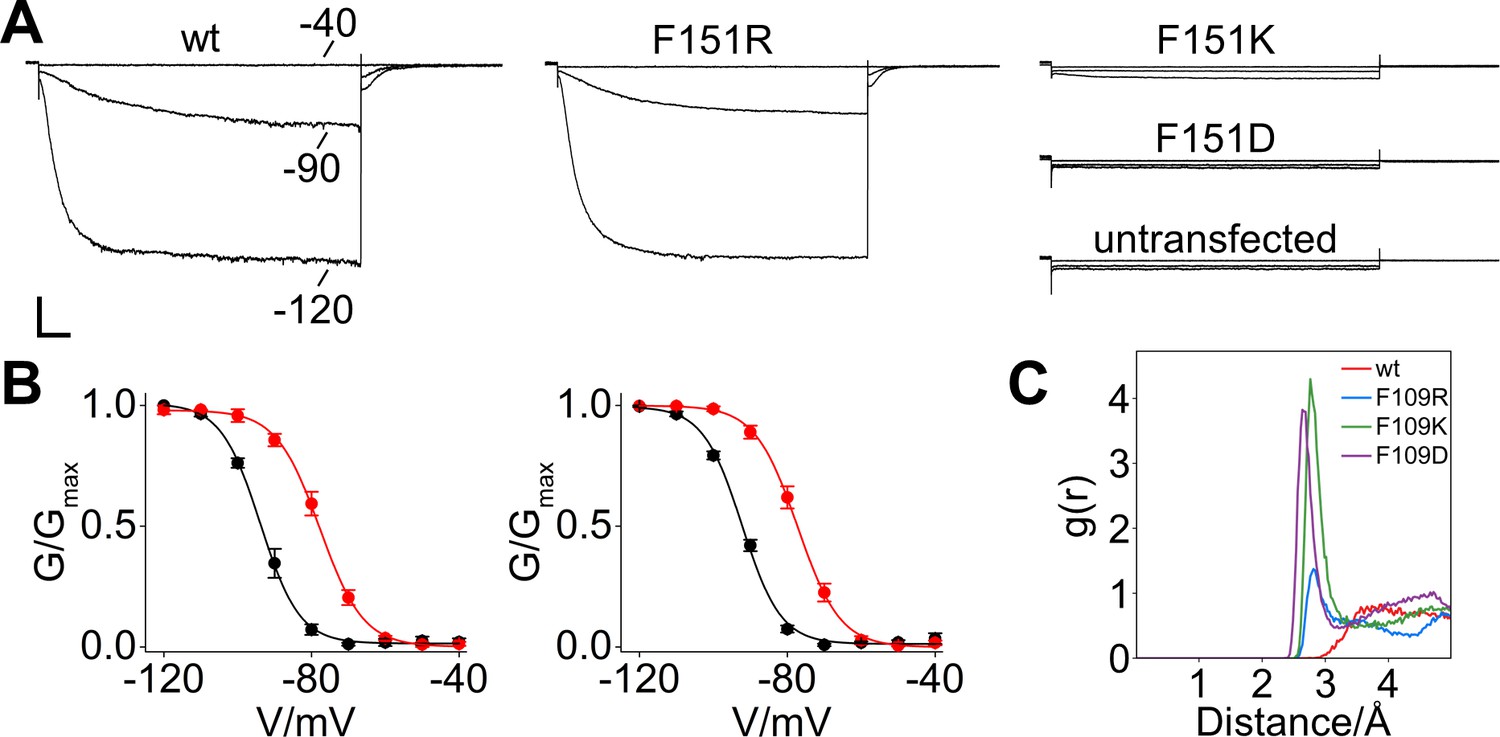
Patch-clamp analysis and MD simulation of HCN2 F151R, F151K and F151D channels.
(A) Representative whole-cell currents recorded, at the indicated voltages, from HEK293T cells transiently expressing wt, F151R, F151K and F151D HCN2 channels. (B) Mean tail current activation curves in the absence (black circles) and in the presence of cAMP (red circles) from wt (left) and F151R (right) channels. Lines show data fit to a Boltzmann function (Materials and methods) providing half activation potential (V1/2) and inverse slope factor (k) values reported in Supplementary file 1A. Values are shown as mean ± SEM. Scale bar is 200 pA x 500 ms. (C) Radial distribution function (g(r)) for water oxygen atoms around the side chain of residue 109. The g(r) plot describes the probability of finding a water molecule at a given distance from the side chain. The side chains of residues F109K and F109D are fully solvated and show characteristic peaks for the first solvation shell of their β carboxyl- and ε amino group, respectively. In contrast, F109R shows only limited solvation of the guanidinium group.
Figure 5 with 1 supplement
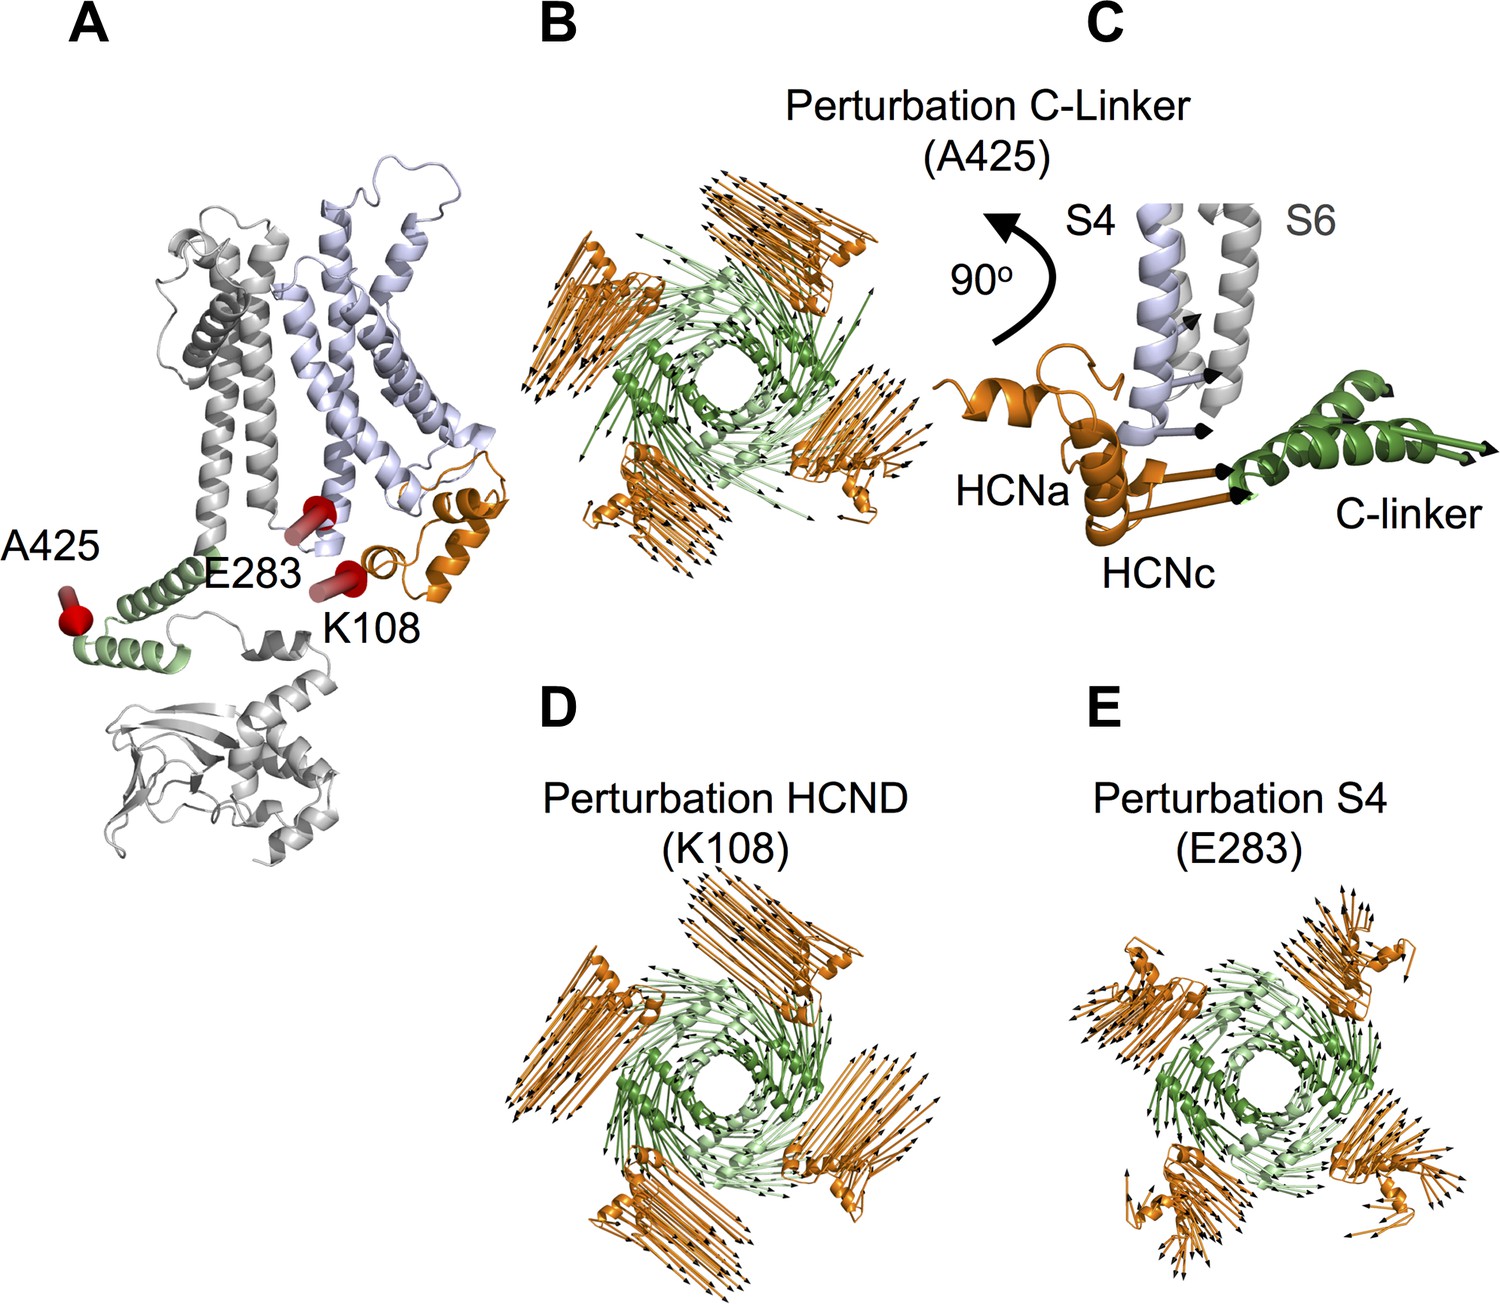
Linear response theory simulations demonstrate the mechanical coupling of C-linker, HCN domain and S4 helix in HCN1.
(A) One HCN1 subunit (PDB_ID: 5U6O) color coded as in Figure 1. Positions and directions of force-displacements on residue A425 of the C-linker ‘elbow’, residue K108 of the HCN domain, and residue E283 of the S4 helix are indicated by red arrows. (B) Movements of the C-linker and HCND after perturbing the HCN1 structure at C-linker residue A425. The image shows C-linkers and HCNDs in the tetramer from an extracellular perspective. The arrows illustrate the directional movement of the domains (shown in the same color). (C) Side view of the structure in (B) focusing only on HCND and S4 helix from one subunit and C-linker from the opposite subunit. The selected arrows show the direction of movements of all three domains after perturbing the ‘elbow’. (D) and (E) Movements of C-linker and HCND from same perspective as in (B) after perturbing the HCN1 structure at HCND residue K108 (D) or S4 helix residue E283 (E). All perturbations resulted in the same rotational movement of C-linker and HCND.
Figure 5—figure supplement 1
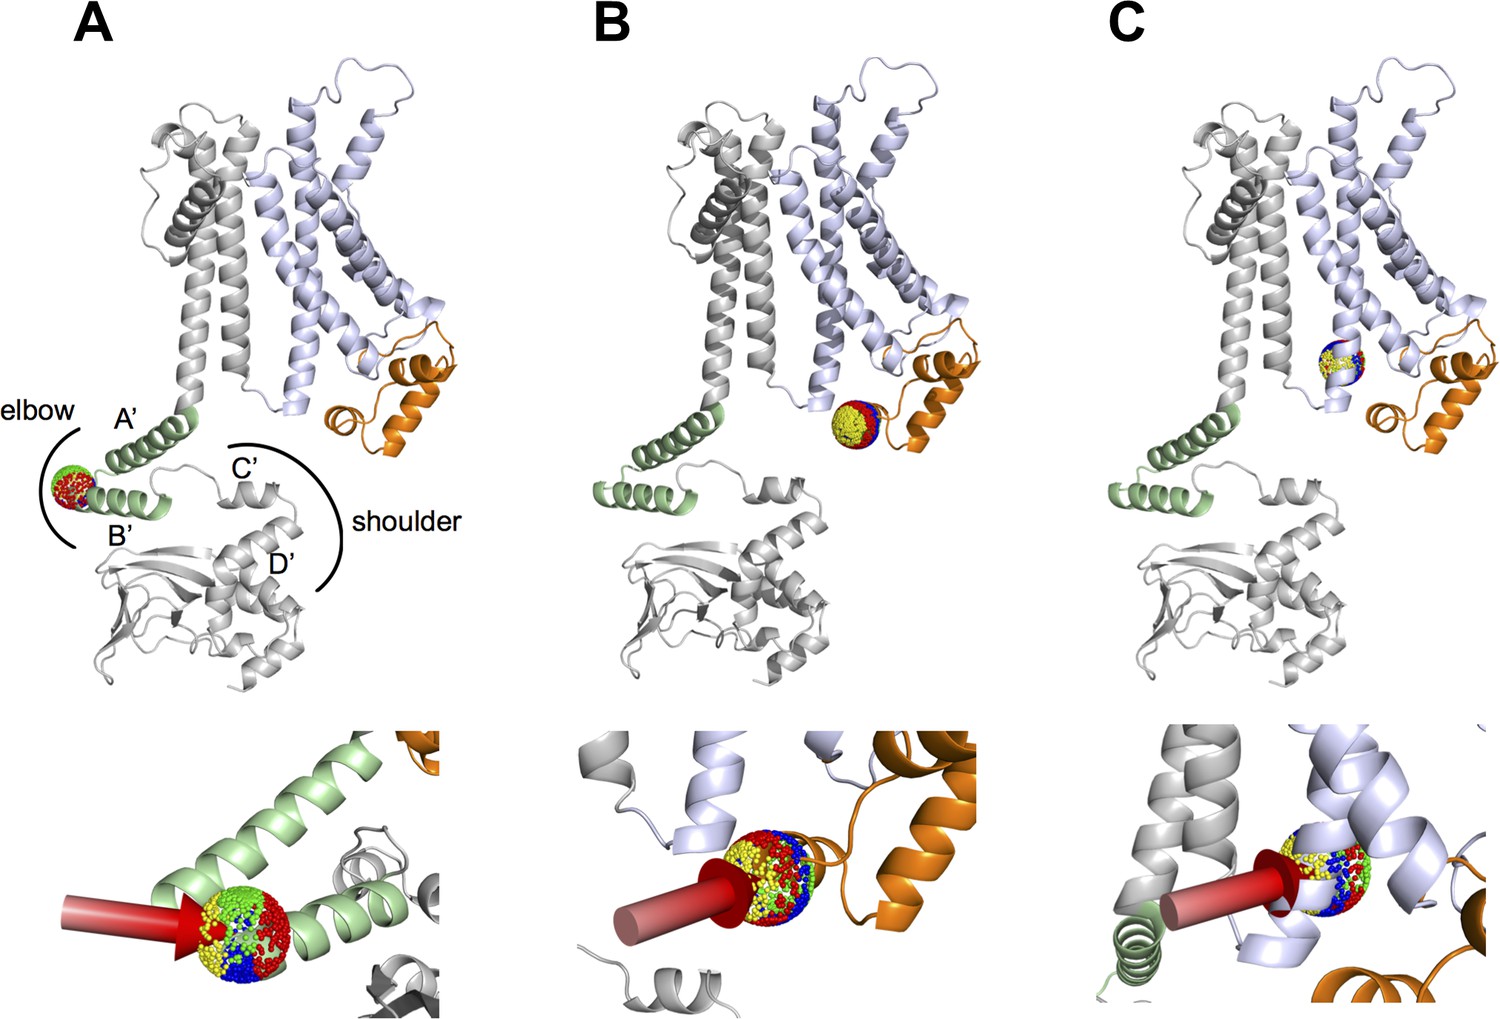
Linear response theory null model of HCN1 channel and clustering of different perturbation directions.
The HCN1 protein (PDB_ID: 5U6O) was perturbed simultaneously on all four monomers at defined residues, by using 1000 external force vectors (shown as colored beads in spheres) with strength of 1600 (in a.u). For clarity, only a single subunit of HCN1 is shown. The VSD is in violet, the HCND in orange and the C-linker is labelled as ‘elbow’ (A’ and B’ green helices) and ‘shoulder’ (C’ and D’ grey helices). Top row, positions of perturbation in the monomer: (A), A425 in the elbow. (B), K108 in the HCND; (C) E283 in S4 of the VSD. Bottom row: rotated blow-up views of perturbation sites. Perturbation directions belonging to the same cluster are represented as beads of the same color (red, blue, yellow or green) in the sphere. Clustering was based on the displacement of the ‘shoulder’ of the C-linker (residues 446–465) (Gross et al., 2018). The yellow cluster in (A) identifies the perturbation vectors that generated a rotational movement of the C-linker similar to that elicited by cAMP binding (reference movement) (Gross et al., 2018). The coloring of the clusters in (B) and (C) was adjusted so that the clusters of force directions that best match the reference displacements in (A) are also represented in yellow. The red arrows show the vectors from the center of the clusters that elicited the movements shown in Figure 5.
Figure 6 with 2 supplements
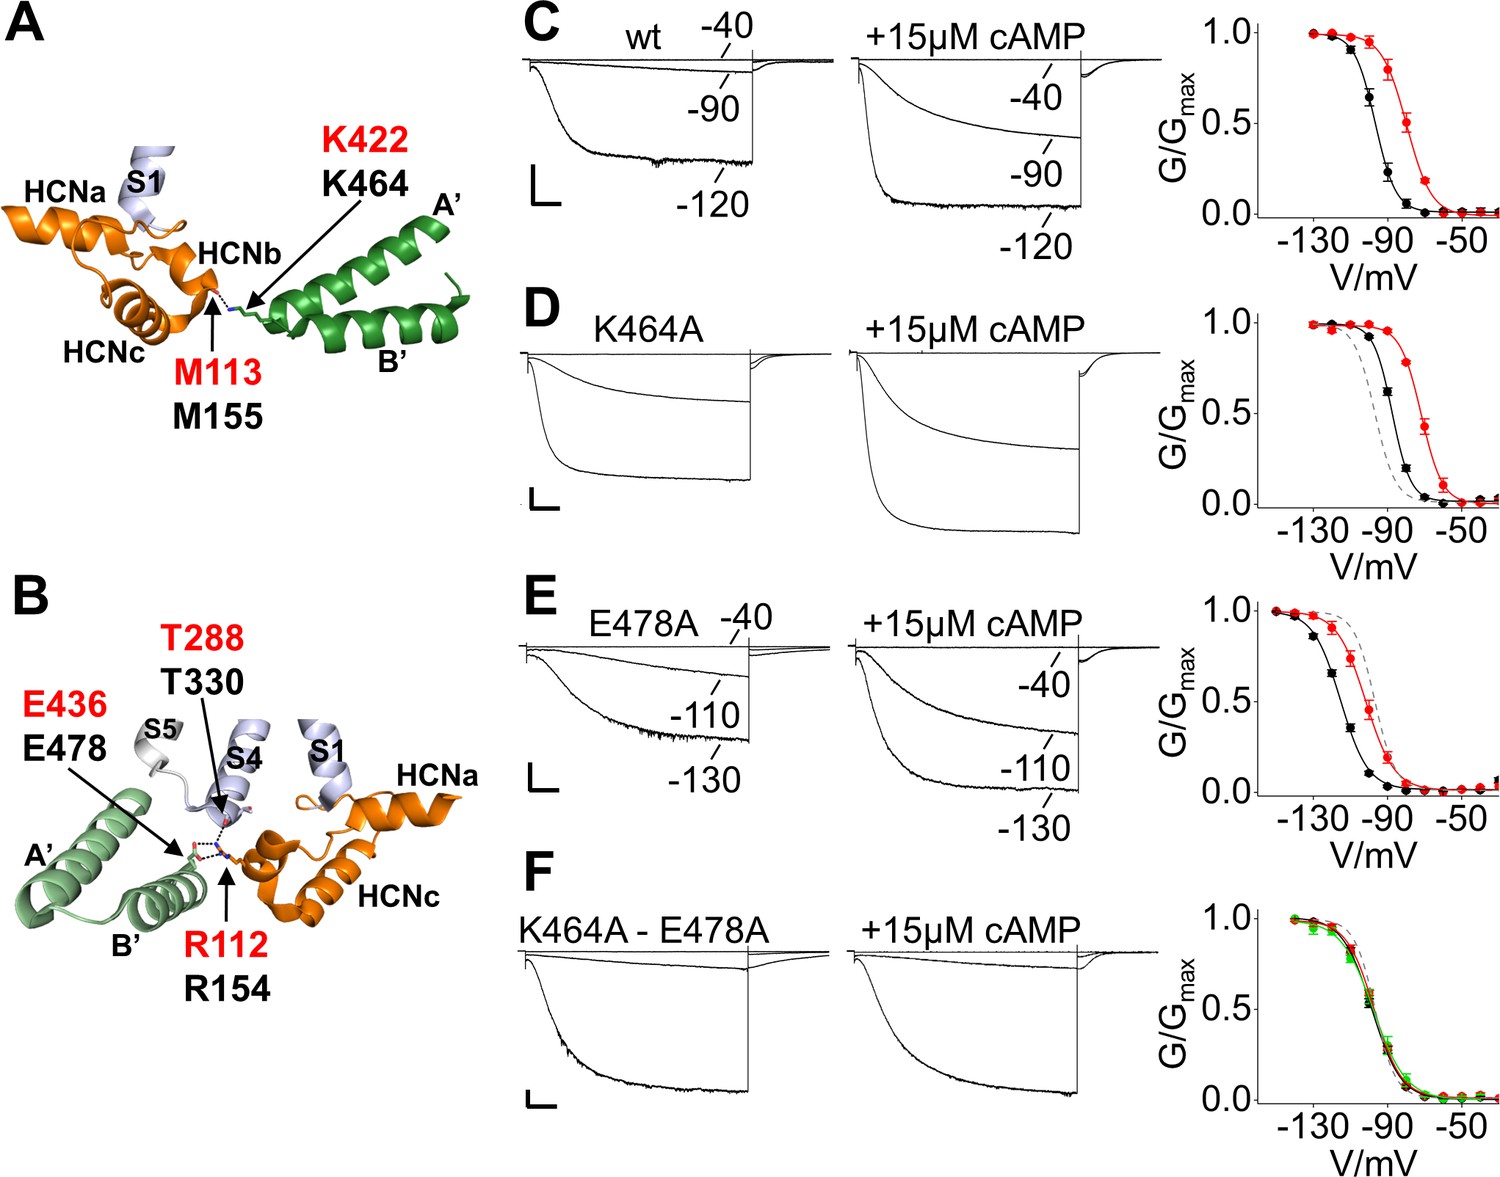
Salt bridge interactions between the HCN domain and the C-linker control cAMP effect in HCN2.
(A) In HCN1 subunit (PDB_ID: 5U6O) (color coded as in Figure 1), the main chain carbonyl group of M113 in the HCN domain contacts the side chain of K422 residue on the C-linker of the opposite subunit (dark green). Salt bridges are represented as dashed black lines. Residues of interest are labelled either in red or black using hHCN1 or mHCN2 numbering, respectively. HCNa, b and c are labelled according to Lee and MacKinnon (2017). (B) R112 of the HCN domain contacts both the side chain of E436 on the C-linker of the adjacent subunit (light green) and the main chain carbonyl group of T288 located in the S4 helix of its own subunit (violet). Representative whole-cell currents recorded from (C) wt, (D) K464A, (E) E478A and (F) K464A-E478A mutant HCN2 channels, in the absence and in the presence of cAMP. Test potentials are the same indicated in the wt traces, if not otherwise specified. Graphs on the right show mean activation curves in the absence (black circles) and in the presence of 15 µM or 100 µM of cAMP (red and green circles, respectively). Lines show data fit to a Boltzmann function (Materials and methods). Half activation potential (V1/2) and inverse slope factor (k) values are reported in Supplementary file 1A together with details on statistical analysis. Values are shown as mean ± SEM. Scale bar is 200 pA x 500 ms. The fitting of the activation curve of the wt in control solution (black curve in C) is shown as a gray dashed line (D-F) for visual comparison with the activation curves of the mutant channels.
Figure 6—figure supplement 1
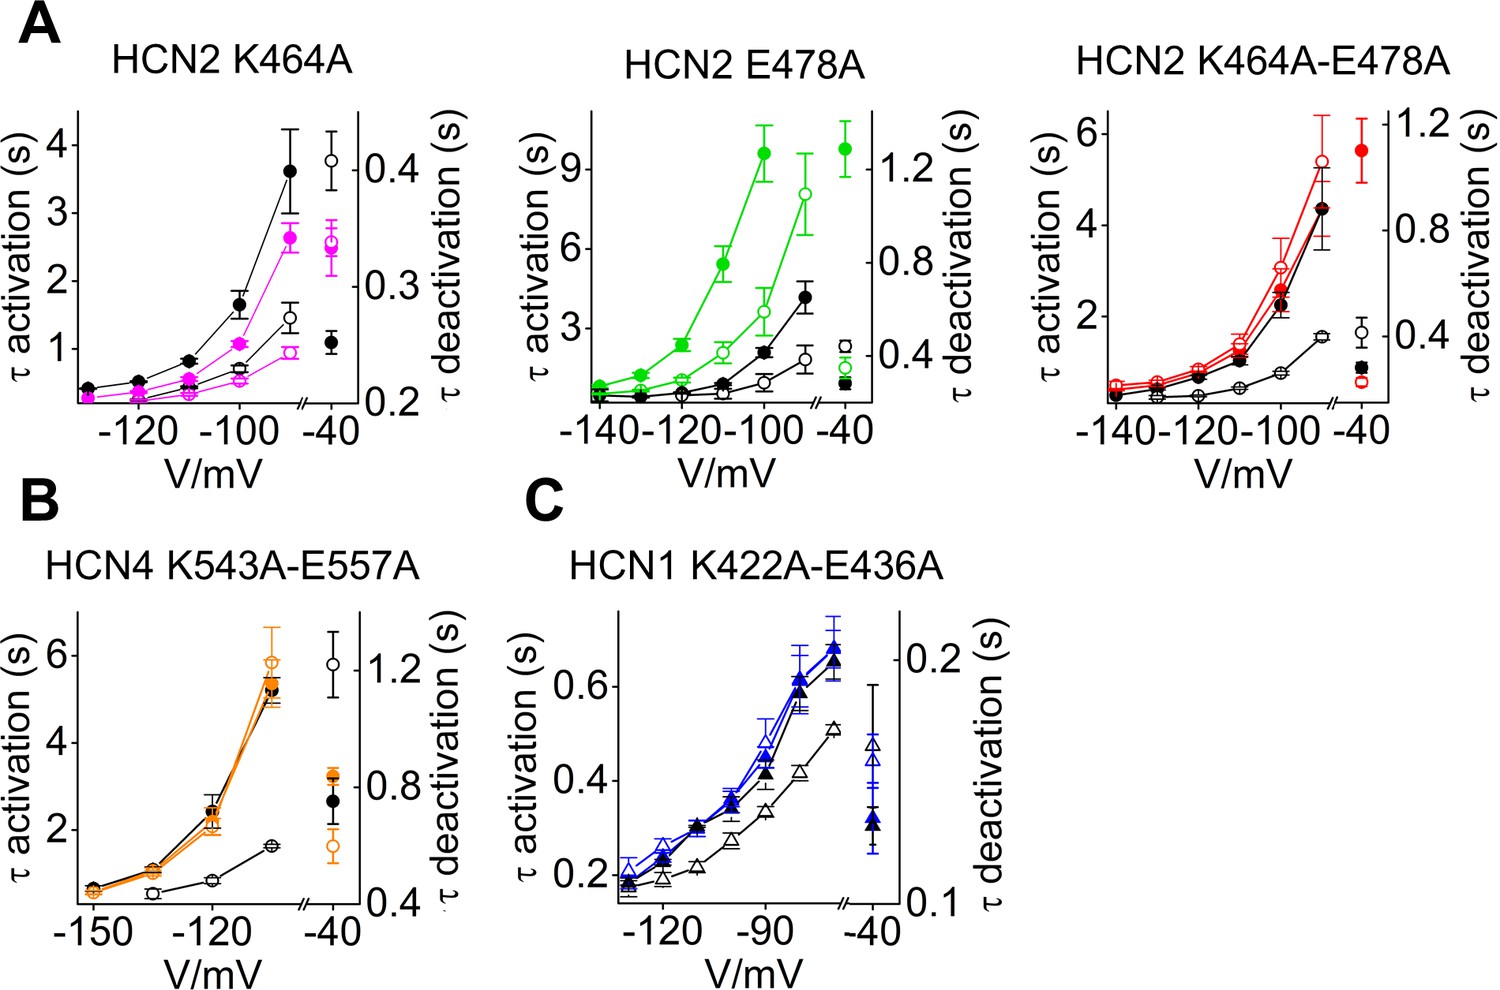
Kinetics analysis of C-linker mutants in HCN isoforms.
Mean activation and deactivation time constants (before and after the x-axis break, respectively) of (A) HCN2, (B) HCN4 and (C) HCN1, wt (black symbols) and mutant (colored symbols) channels in the presence (empty symbols) and in the absence (filled symbols) of cAMP. Note that in the case of HCN1 (C) the effect of cAMP was evaluated by comparing wt and K422A-E436A channels (empty triangles) to their respective R549E mutants (R549E and K422A-E436A-R549E, filled triangles). For explanation, see text. Time constant of activation and deactivation were calculated, at the indicated voltages, by fitting a single exponential function (Equation 2 in Materials and methods) to current traces. Tau of deactivation were calculated by fitting tail currents collected at −40 mV after a fully activating pulse at −130 mV (HCN2), −135 mV (HCN4) and −120 mV (HCN1).
Figure 6—figure supplement 2
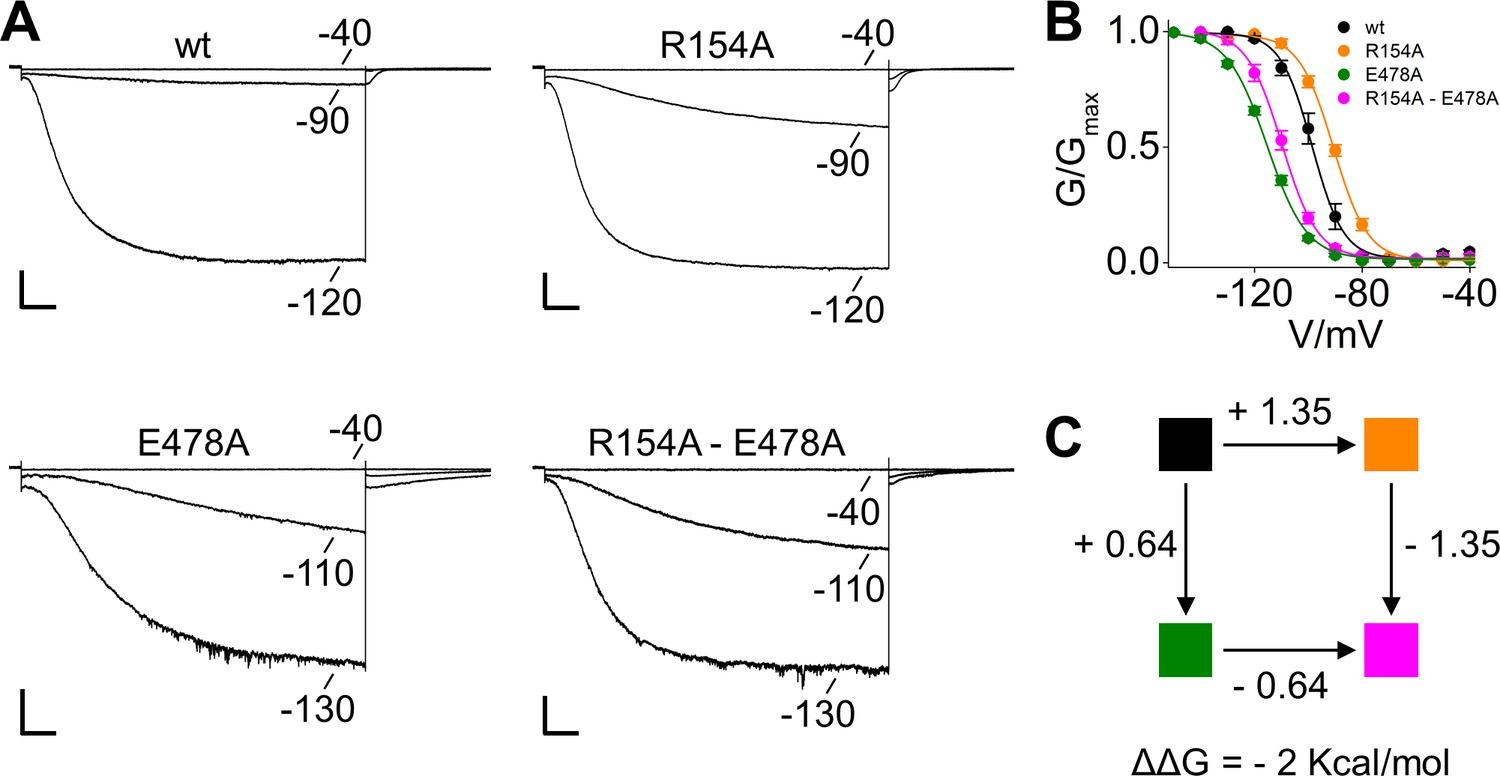
Mutant cycle analysis of coupling between HCN4 R154A and E478A mutations.
(A) Representative whole-cell currents recorded, at the indicated voltages, from HEK293T cells transiently expressing wt, the single mutants R154A, E478A and the double mutant R154A-E478A. (B) Mean tail current activation curves of wt (black), R154A (orange), E478A (green) and R154A-E478A (magenta). Lines show data fit to a Boltzmann function (Materials and methods) providing half activation potential (V1/2) and inverse slope factor (k) values reported in Supplementary file 1A. Values are shown as mean ± SEM. Scale bar is 200 pA x 500 ms. (C), Mutant cycle analysis (Chowdhury et al., 2014) scheme for the R154 and E478 pair with each corner box colored as the G/V curves in (B) from which k and V1/2 values were derived by fitting a Boltzmann curve (Supplementary file 1A). The free energy difference between the open and closed states of the channel, ΔGapp = (RT/k)V1/2, are as follow: −9.8 ± 1.1,–8.5 ± 0.8,–9.2 ± 1.3,–9.8 ± 1.5 for wt, R154A, E478A and R154A-E478A, respectively. The perturbation energy upon mutation, ΔGp = Δ(RT/k)V1/2, is indicated along each path. The magnitude of non-additivity ΔΔG was calculated as reported in Material and methods. ΔGapp, ΔGp and ΔΔG are in kcal/mol.
Figure 7 with 1 supplement

C-linker mutations preventing cAMP effect in all HCN isoforms.
(A) Half activation voltage (V1/2 ± SEM) values of HCN1 wt, K422A-E436A, R549E and K422A-E436A-R549E (blue symbols), HCN2 wt and K464A-E478A (green symbols), HCN4 wt and K543A-E557A (orange symbols), in control solution (filled symbols) and in the presence of 15 µM (HCN1 and HCN2) and 30 µM (HCN4) cAMP (empty symbols). (B) cAMP-induced shift in the V1/2 (in mV) calculated from data in (A). For HCN1, the cAMP effect was calculated by subtracting wt and double mutant values from their corresponding R549E mutants. Details on statistical analysis are reported in Supplementary file 1B.
Figure 7—figure supplement 1
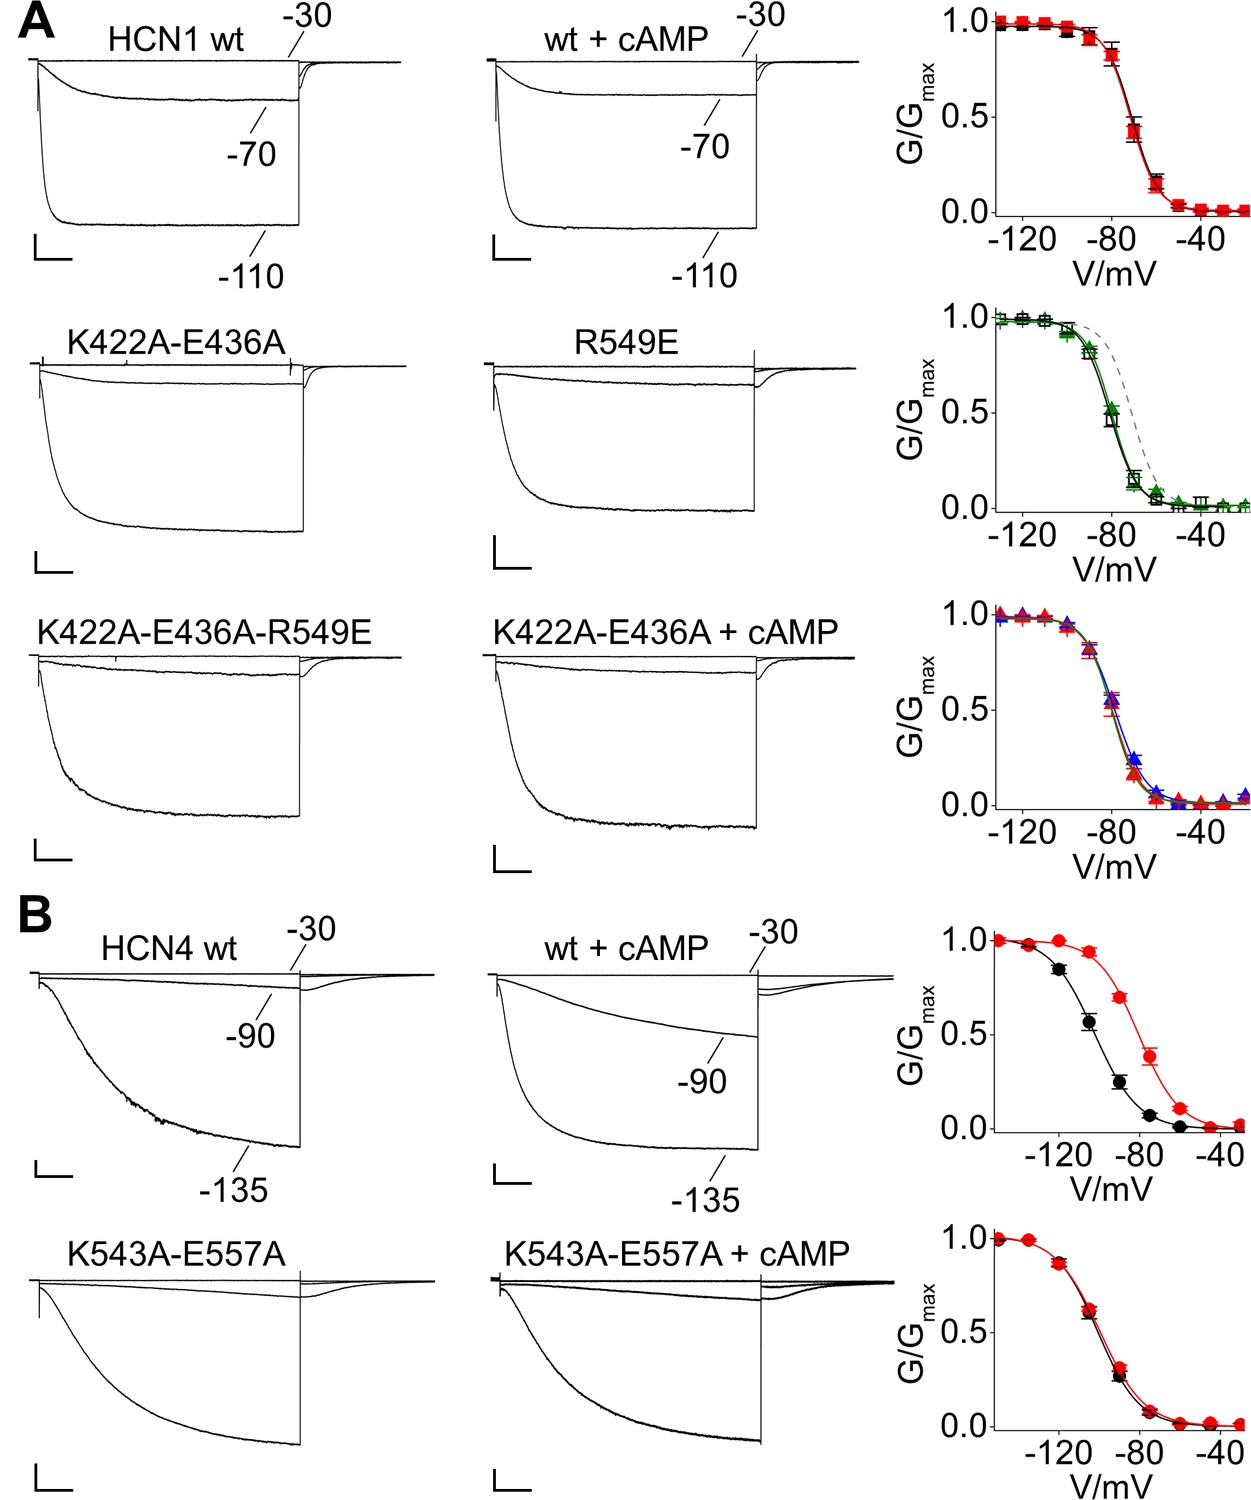
Properties of the C-linker double mutants in HCN1 and HCN4.
(A) Representative whole-cell currents (left and center) and mean activation curves (right) of: HCN1 wt in control solution (black filled squares) and in the presence of 15 µM cAMP (red squares); R549E (empty black squares) and K422A-E436A (green triangles), plotted together with the fitting of the activation curve of the wt (grey line) to show that the left shifted position of their activation curves coincides; either addition of R549E (K422A-E436A-R549E) (blue triangles) or addition of 100 µM cAMP (K422A-E436A + cAMP) (red triangles) does not shift the activation curve of the double mutant (green triangles). (B) Representative whole-cell currents of HCN4 wt and K543A-E557A double mutant recorded in the absence and in the presence of saturating concentration (30 µM) of cAMP. Right graphs show mean tail current activation curves in the absence (black circles) and in the presence of 30 µM cAMP (red circles). Values are shown as mean ± SEM. Scale bar is 200 pA x 500 ms. Lines show data fit to a Boltzmann function (Materials and methods) providing half activation potential (V1/2) and inverse slope factor (k) values reported in Supplementary file 1B.
Author response image 1
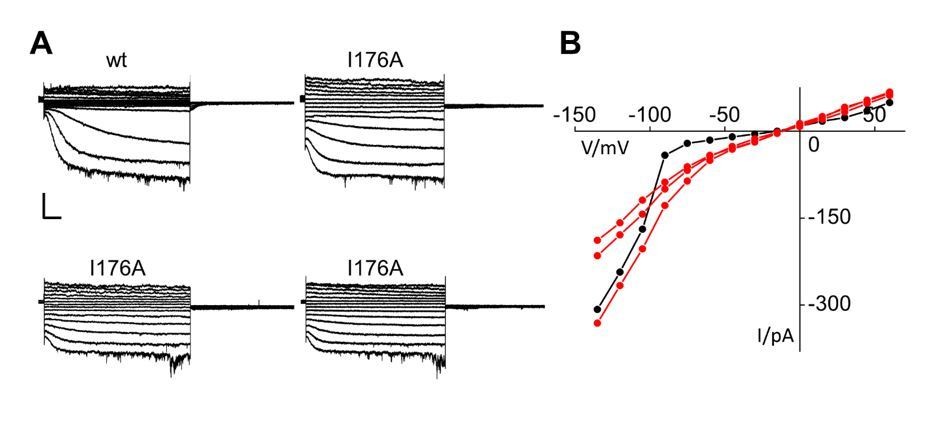
Patch clamp analysis of HCN2 I176A mutant.
(A) Representative whole-cell currents of HCN2 wt and I176A channels recorded from +50 to -120 mV with -15mV increment. A wt trace with a low current amplitude similar to those of I176A was selected for this comparison. Scale bar is 100 pA x 500 ms (B) Current-voltage plot of traces in (A). HCN2 wt is shown in black; I176A curves are shown in red.
Videos
Video 1
Mechanical continuum between C-linker, HCND and VSD.
Morphing video of HCN1 showing the concerted movement of C-linker, HCND and VSD. The structural models used for the morphing were derived from computational data obtained with the linear response theory (LRT) analysis of the HCN1 model (Gross et al., 2018) following application of a force vector of 400 a.u. to position A425. For simplicity, the top half of the transmembrane domain has been omitted from the illustration. The C-terminal half of S4 helix of VSD is coloured in blue; A’ and B’ helices of the C-linker are in green; HCND is in orange.
Tables
Key resources table
| Reagent type (species) or resource | Designation | Source or reference | Identifiers | Additional information |
|---|---|---|---|---|
| Gene (human) | HCN1 | Xention Ltd. (Cambridge,UK) | NM_021072.3 | |
| Gene (mouse) | HCN2 | PMID: 11331358 | NM_008226.2 | |
| Gene (rabbit) | HCN4 | PMID: 10212270 | NM_001082707 | |
| Strain, strain background (E. coli) | Stbl2 | Thermo Fisher Scientific | ||
| Cell line (human) | HEK 293T | ATCC (Authenticated by STR profiling) | RRID:CVCL_0063 | Tested for mycoplasma: negative result |
| Recombinant DNA reagent | pcDNA 3.1 (plasmid) | Clontech Laboratories | ||
| Recombinant DNA reagent | pCI (plasmid) | Promega | ||
| Recombinant DNA reagent | pEGFP (plasmid) | Clontech Laboratories | ||
| Transfected construct (human) | HCN1 (cDNA) | Xention Ltd (Cambridge,UK) | All HCN1 mutants transfected in the paper were obtained starting from this wt cDNA. For further details please see Materials and methods | |
| Transfected construct (mouse) | HCN2 (cDNA) | Laboratory of Steven A. Siegelbaum | All HCN2 mutants transfected in the paper were obtained starting from this wt cDNA. For further details please see Materials and methods | |
| Transfected construct (rabbit) | HCN4 (cDNA) | PMID: 10212270 | All HCN4 mutants transfected in the paper were obtained starting from this wt cDNA. For further details please see Materials and methods | |
| Transfected construct (human) | GFP-HCN1 (cDNA) | This paper | All GFP-HCN1 mutants transfected in the paper were obtained starting from this wt cDNA. For further details please see Materials and methods | |
| Transfected construct (mouse) | GFP-HCN2 (cDNA) | PMID: 15564593 | All GFP-HCN2 mutants transfected in the paper were obtained starting from this wt cDNA. For further details please see Materials and methods | |
| Commercial assay or kit | QuickChange Lightning Site- Directed Mutagenesis Kit | Agilent | ||
| Commercial assay or kit | Exprep Plasmid SV kit | GeneAll | ||
| Commercial assay or kit | Thermo Scientific TurboFect Transfection Reagent | Thermo Fisher Scientific | ||
| Chemical compound, drug | Adenosine 3', 5'-cyclic monophosphate (cAMP) | SIGMA | ||
| Chemical compound, drug | CellMask Deep Red Plasma membrane Stain | Thermo Fisher Scientific | ||
| Software, algorithm | pClamp - Clampfit | Molecular Devices | RRID:SCR_011323 | Version 10.7 |
| Software, algorithm | pClamp - Clampex | Molecular Devices | RRID:SCR_011323 | Version 10.7 |
| Software, algorithm | EZ-Patch | Elements srl https://elements-ic.com/ | Version 1.0.0 | |
| Software, algorithm | Gromacs | http://www.gromacs.org/ | RRID:SCR_008395 | Version 9.22 |
| Software, algorithm | Modeller | http://salilab.org/modeller/modeller.html | RRID:SCR_014565 | Version 2018.x |
| Software, algorithm | Python | http://www.python.org | RRID:SCR_008394 | Version 3.7.3 |
| Software, algorithm | Pymol | https://pymol.org | RRID:SCR_000305 | Version 2.2.0 |
| Software, algorithm | Fiji ImageJ | http://fiji.sc/ |
Additional files
-
Supplementary file 1
(A) Fitting parameters of the activation curves in HCN2 (Figures 2,4,6,7). From left to right: half-activation voltage (V1/2), inverse slope factor (k) obtained by fitting data to a Boltzmann function (Material and methods) in absence or presence of cAMP; n = number of cell tested in each condition; cAMP-induced shift in V1/2; number of cells that expressed a measurable HCN current. *p<0.05 by One-way ANOVA with Fisher’s test compared to wt HCN2; §p<0.05 by Student’s T-test compared to control condition (without cAMP); n.s. not statistically different; n.t. not tested; n.d. not detectable. cAMP concentration was 15 µM in all cases, except for last row (HCN2 K464-E478A#, 100 µM cAMP). (B) Fitting parameters of the activation curves in HCN1 and HCN4 (Figures 2,7). From left to right: half-activation voltage (V1/2), inverse slope factor (k) obtained by fitting data to a Boltzmann function (Material and methods) in absence or presence of cAMP; n = number of cell tested in each condition; cAMP-induced shift in V1/2; number of cells that expressed a measurable HCN current. *p<0.05 by One-way ANOVA with Fisher’s test compared to wild-type HCN1 or HCN4; §p<0.05 by Student’s T-test compared to control condition (without cAMP); n.s. not statistically different; n.t. not tested; n.d. not detectable. cAMP concentration used for HCN1 and HCN4 was 15 µM and 30 µM respectively. (C) Number of molecules for each simulation of molecular dynamics performed on HCN1. POPC: 1-palmitoyl-2-oleoyl-glycero-3-phosphocholine; TIP3P: water model; K: K+ ion; CL: Cl- ion
- https://cdn.elifesciences.org/articles/49672/elife-49672-supp1-v2.docx
-
Transparent reporting form
- https://cdn.elifesciences.org/articles/49672/elife-49672-transrepform-v2.docx
Download links
A two-part list of links to download the article, or parts of the article, in various formats.
Downloads (link to download the article as PDF)
Open citations (links to open the citations from this article in various online reference manager services)
Cite this article (links to download the citations from this article in formats compatible with various reference manager tools)
The HCN domain couples voltage gating and cAMP response in hyperpolarization-activated cyclic nucleotide-gated channels
eLife 8:e49672.
https://doi.org/10.7554/eLife.49672


