Stereotyped transcriptomic transformation of somatosensory neurons in response to injury
- National Institute of Dental and Craniofacial Research, United States
- National Institute of Child Health and Human Development, United States
Figures
Figure 1 with 1 supplement
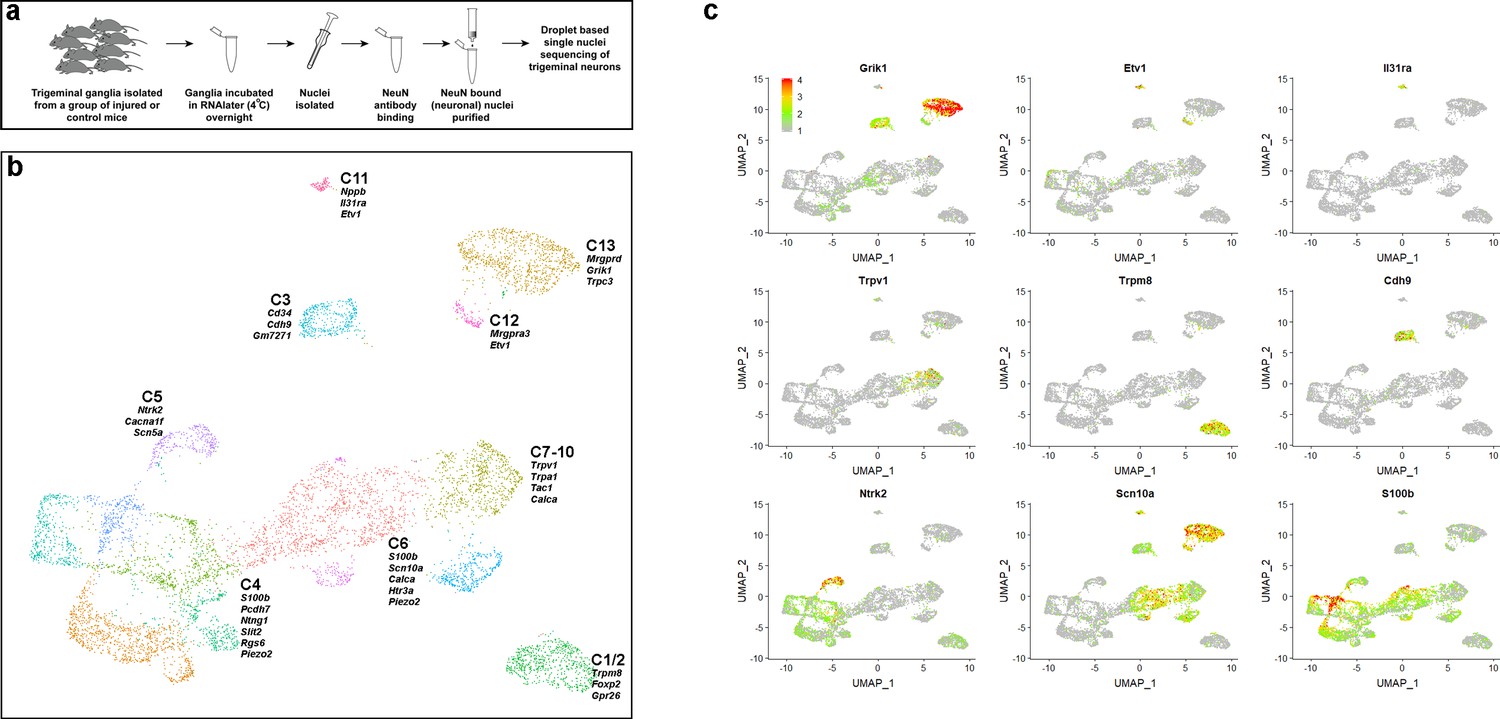
sn-RNA sequence analysis of trigeminal neurons from uninjured control mice.
(a) Schematic representation of strategy used for selective sn-sequencing of trigeminal neurons. (b) UMap representation of cluster analysis for sn-data from 7546 trigeminal neurons; each cluster is assigned a distinct color. The designations (C1–C13) are based on earlier single cell data (Nguyen et al., 2017) and do not distinguish between the new classes of cells identified here (see Supplementary file 4 for detailed description of trigeminal neural classes). Several prominent genes that help distinguish the classes are listed. (c) Expression profiles of select genes in the UMap representation with relative cellular expression colored as indicated by the scale-bar. The expression profiles highlight the segregation of gene expression between clusters.
Figure 1—figure supplement 1
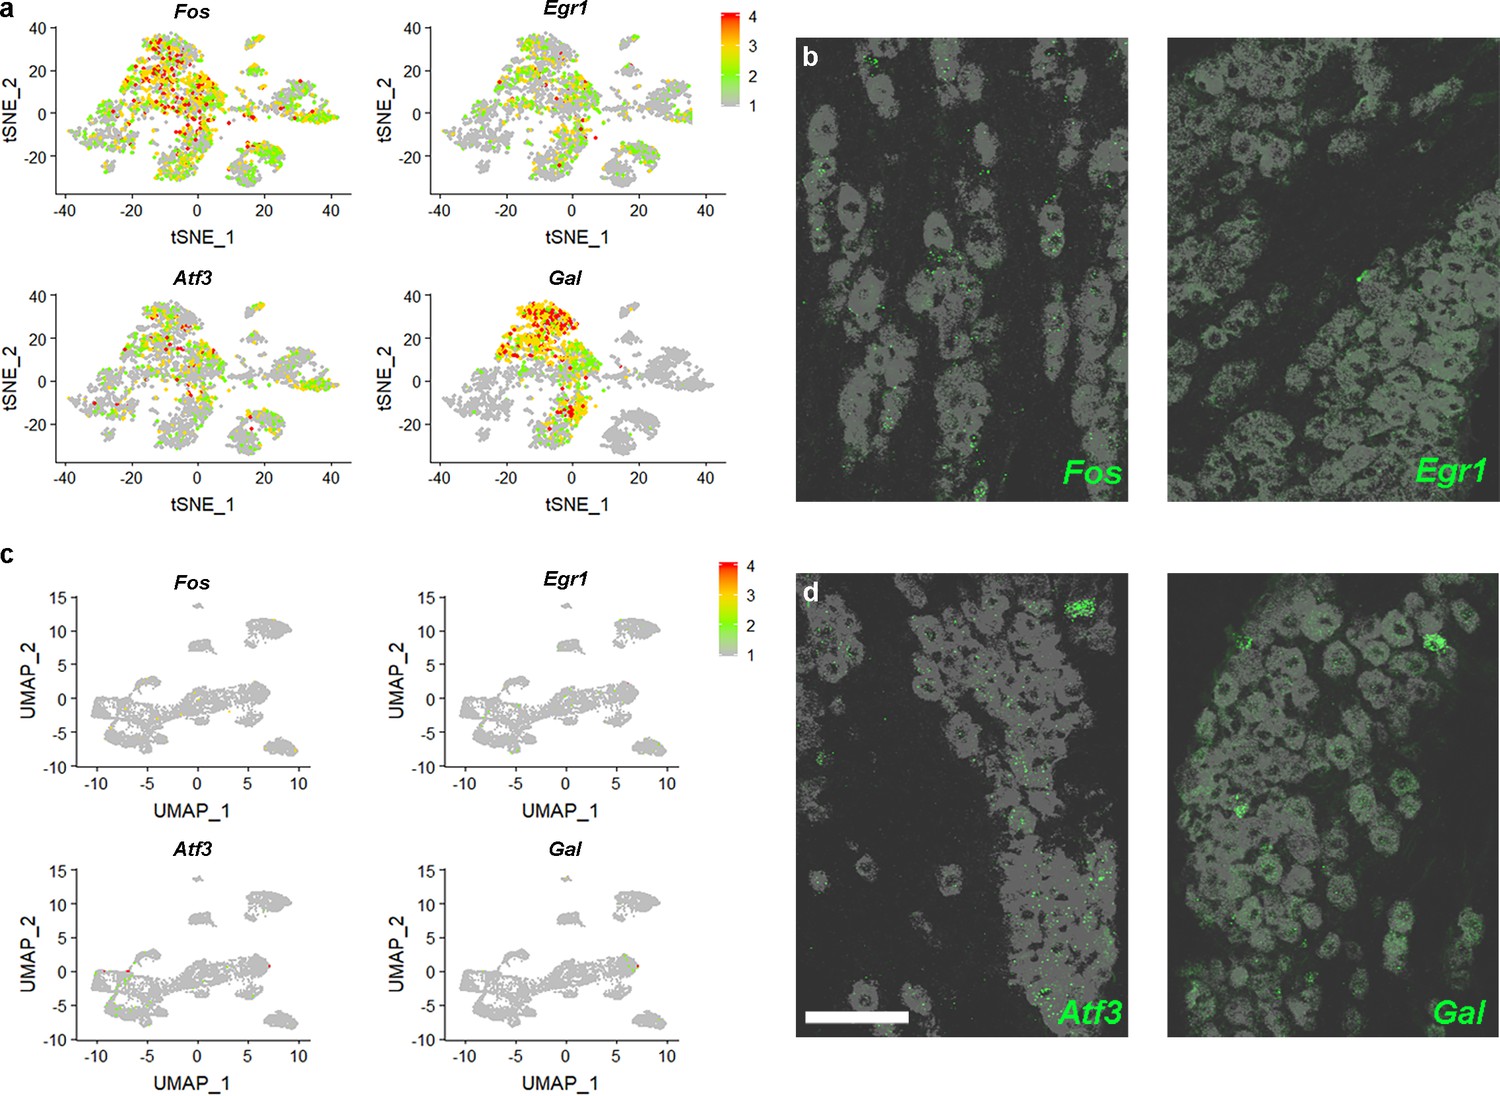
Isolation of trigeminal neurons modifies cellular expression of genes.
(a) Relative expression (see scale-bar) of immediate early genes Fos and Egr1 as well as injury response genes Atf3 and Gal in a tSNE representation of single cell sequencing data (Nguyen et al., 2017) shows that these transcripts were present in many cells. (b) Representative images of ISH for Fos and Egr1 (green) in the trigeminal ganglion demonstrate little or no expression in vivo; gray image: expression of the pan-neuronal probe Tubb3, detected by double labeling; scale-bar = 100 μm. (c) Expression of the four genes in the sn-data is almost undetectable. (d) Double label ISH showing that expression of Atf3 and Gal (green) versus Tubb3 (gray) match predictions from sn-data rather than the earlier single cell analysis (Nguyen et al., 2017).
Figure 2 with 3 supplements
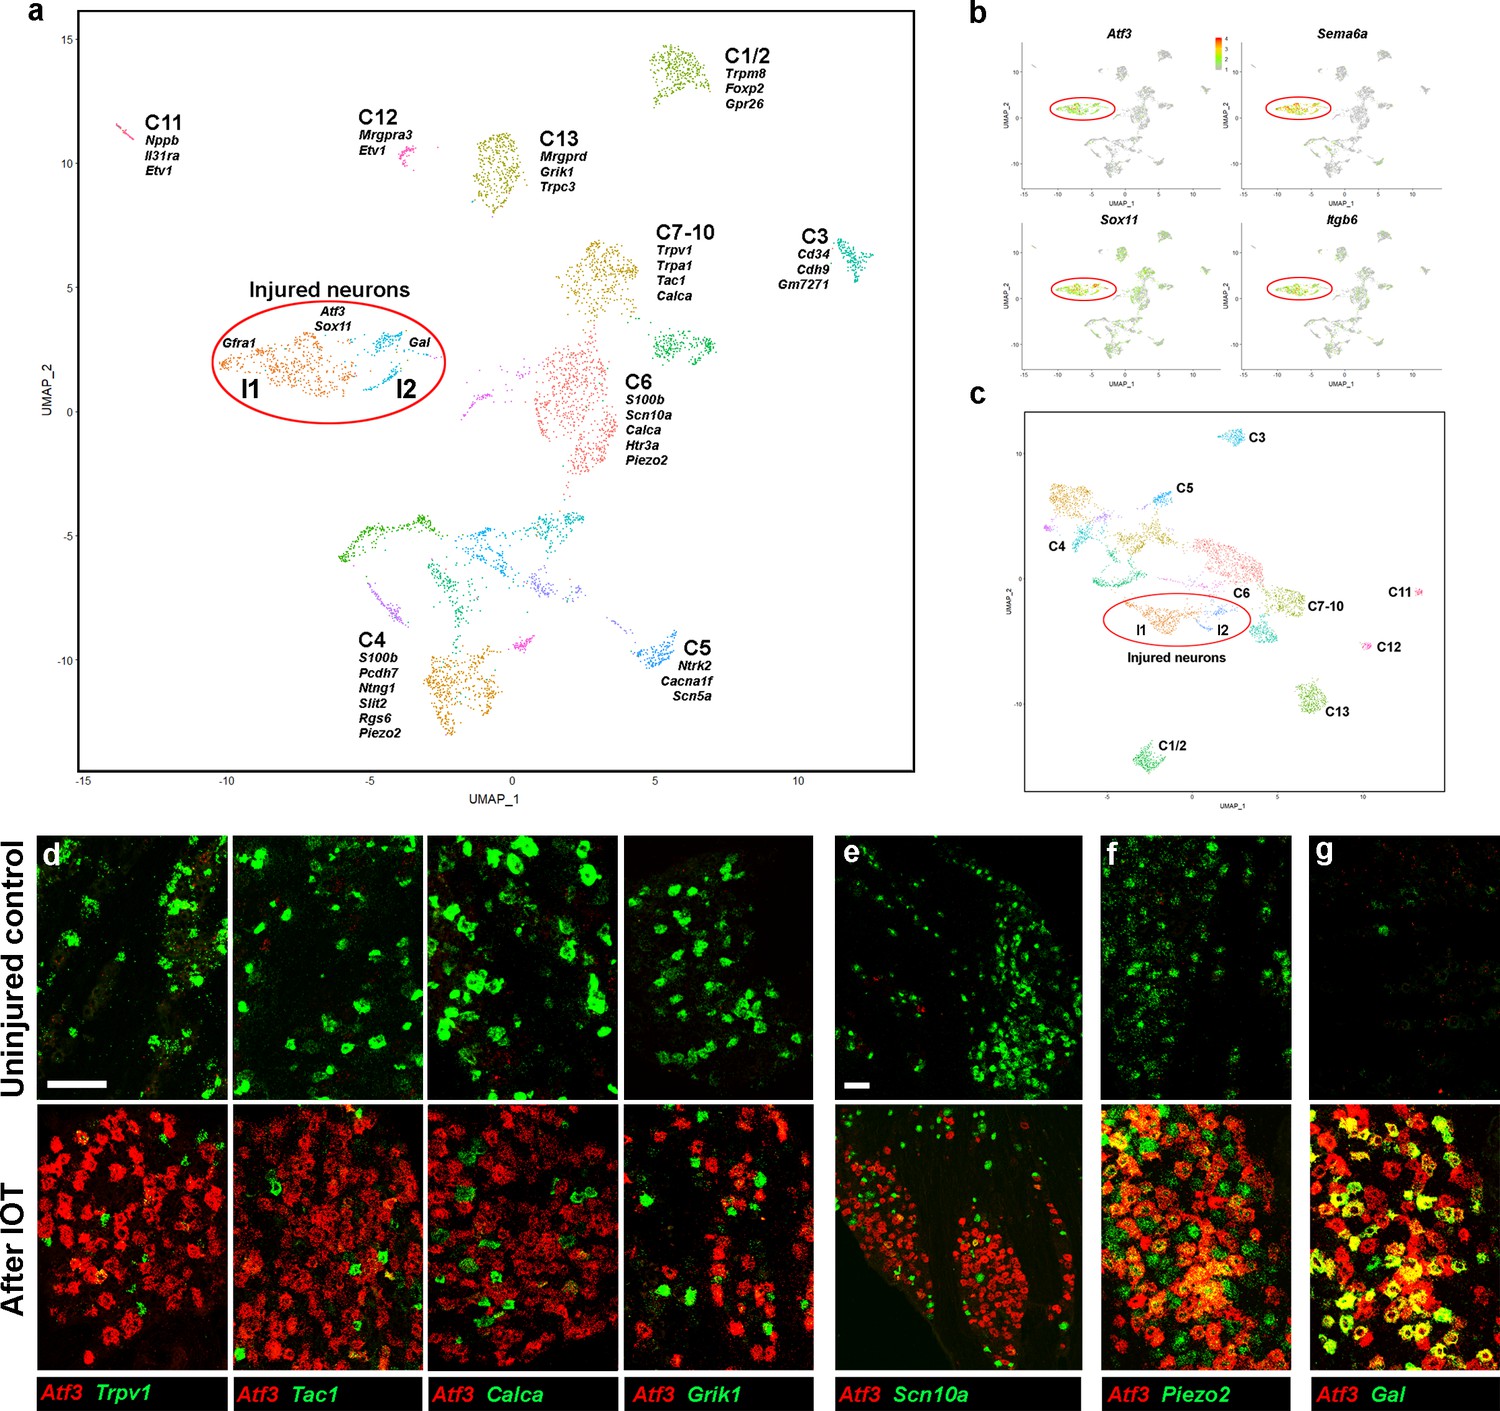
Analysis of trigeminal neurons two days after IOT.
(a) UMap representation of sn-cluster analysis from 4611 trigeminal neurons isolated 2 days after IOT. Each cluster is assigned a distinct color and new injury-related clusters I1 and I2 are circled. The designations of uninjured neurons (C1–C13) are based on earlier single cell data (Nguyen et al., 2017) and do not distinguish between the new classes of cells identified here (see Supplementary file 4 for detailed description of trigeminal neural classes). (b) Expression profiles of select injury-related genes (relative cellular expression colored as indicated by the scale-bar) highlight strong upregulation of these genes in the I1 and I2 clusters (circled). (c) Re-clustered data: excluding genes that were prominently up- or down-regulated in injured neurons from analysis. I1 and I2 class cells (circled) still segregate from uninjured cell classes. (d–g) Representative images of double label ISH for Atf3 (red) and select genes (green) in trigeminal ganglia from control mice (upper panels) and animals 2 days after IOT (lower panels), illustrate (d, e) down-regulation of expression of several key genes (green) in injured neurons labeled by Atf3 (red). (f) There was less effect on expression of Piezo2 (green) in Atf3-positive cells (red); (g) Gal (green) was detected in a subset of injured neurons expressing Atf3 (red). (e) Lower magnification image showing that Scn10a (green) is almost totally excluded from regions of the ganglion where many neurons express Atf3 (red); scale bars = 100 μm for both magnifications; see Supplementary file 1 for quantitation and statistical analysis of ISH data.
Figure 2—figure supplement 1
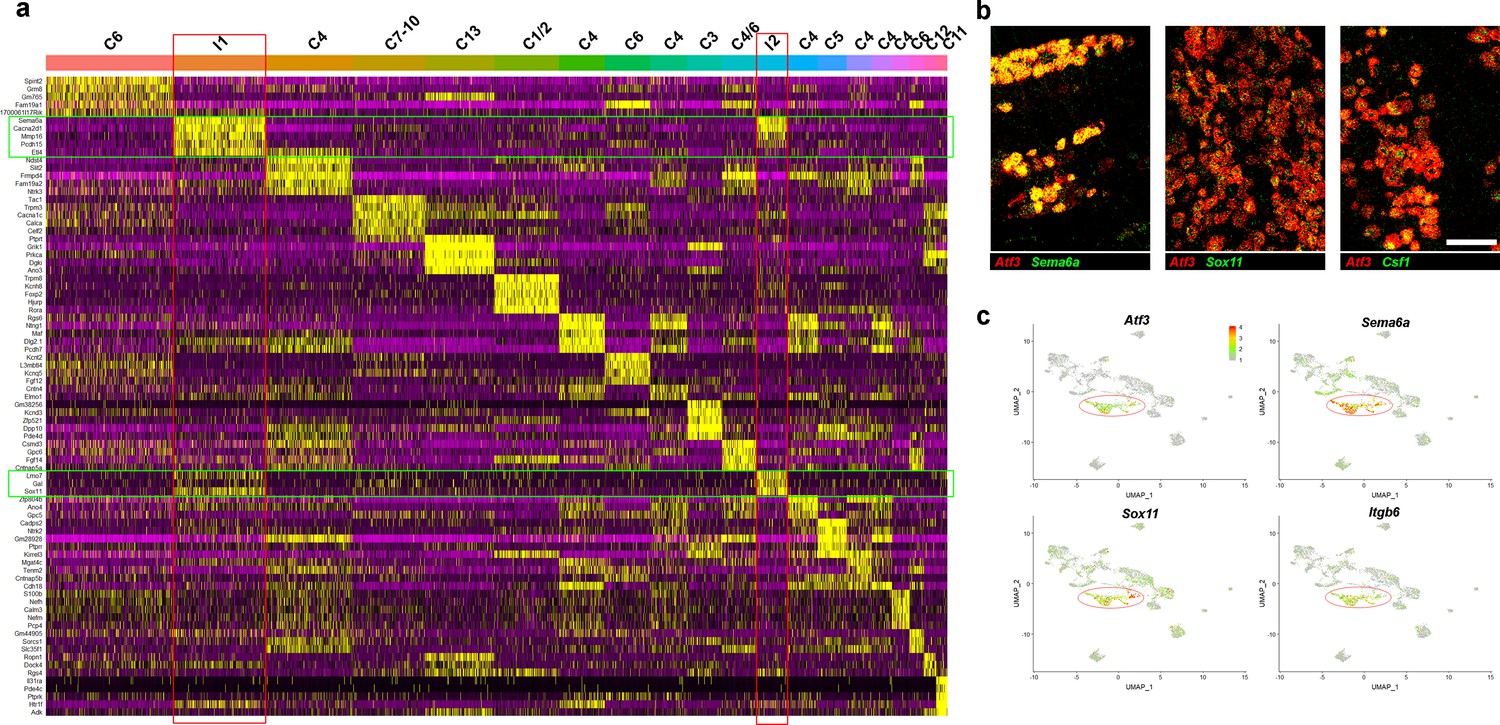
Characterization of trigeminal neurons two days after spared nerve injury.
(a) Heatmap showing expression of marker genes in classes of trigeminal neuron identified 2 days after injury. The five markers best identifying each class were determined from the sn-data; any marker is only plotted once; each column represents one cell. Increasing relative expression level is indicated: purple (low) to black (average) to yellow (high). Bars above the heatmap are colored and named to match Figure 2a. The injury-related classes I1 and I2 are highlighted by red boxes, and injury markers are indicated by green boxes. Note the low expression of most trigeminal neuron markers in I1 and I2. (b) Representative images of double label ISH demonstrating extensive co-expression of Atf3 (red) and other injury-related transcripts (green); scale-bar = 100 μm. (c) Expression of injury-related transcripts in the clustering of sn-data shown in Figure 1c. Note that injured cells and injury-related transcripts still segregate from other trigeminal neural classes in injured cells (circled).
Figure 2—figure supplement 2

Differences between I1 and I2 classes of injured neurons and relationship to uninjured neurons Gene expression in the sn-analysis shown in Figure 2 (relative expression indicated by scale-bar).
Selected genes highlight expression differences between the two injured neurons classes I1 and I2 (labeled and circled in red). Most of these genes are also expressed in uninjured neurons; in each case classes expressing higher levels of the transcript are also identified (see Figure 1 for details). Genes selectively detected in I1 generally are expressed in large diameter neurons (classes C4-C6) whereas genes that mark I2 are mainly detected in other classes. This suggests that traces of original neural class are preserved in the injured neurons, with I1 derived from large diameter neurons and I2 from smaller cells. Note that Ntng1, which marks a subset of C4 and C5 neurons only labels a subset of the I1 cluster further supporting these conclusions. Also shown are Gfra1 and Gal expression: these genes are selectively upregulated in I1 and I2 cells (respectively). See Supplementary file 2 for additional details of gene expression differences between the I1 and I2 classes.
Figure 2—figure supplement 3
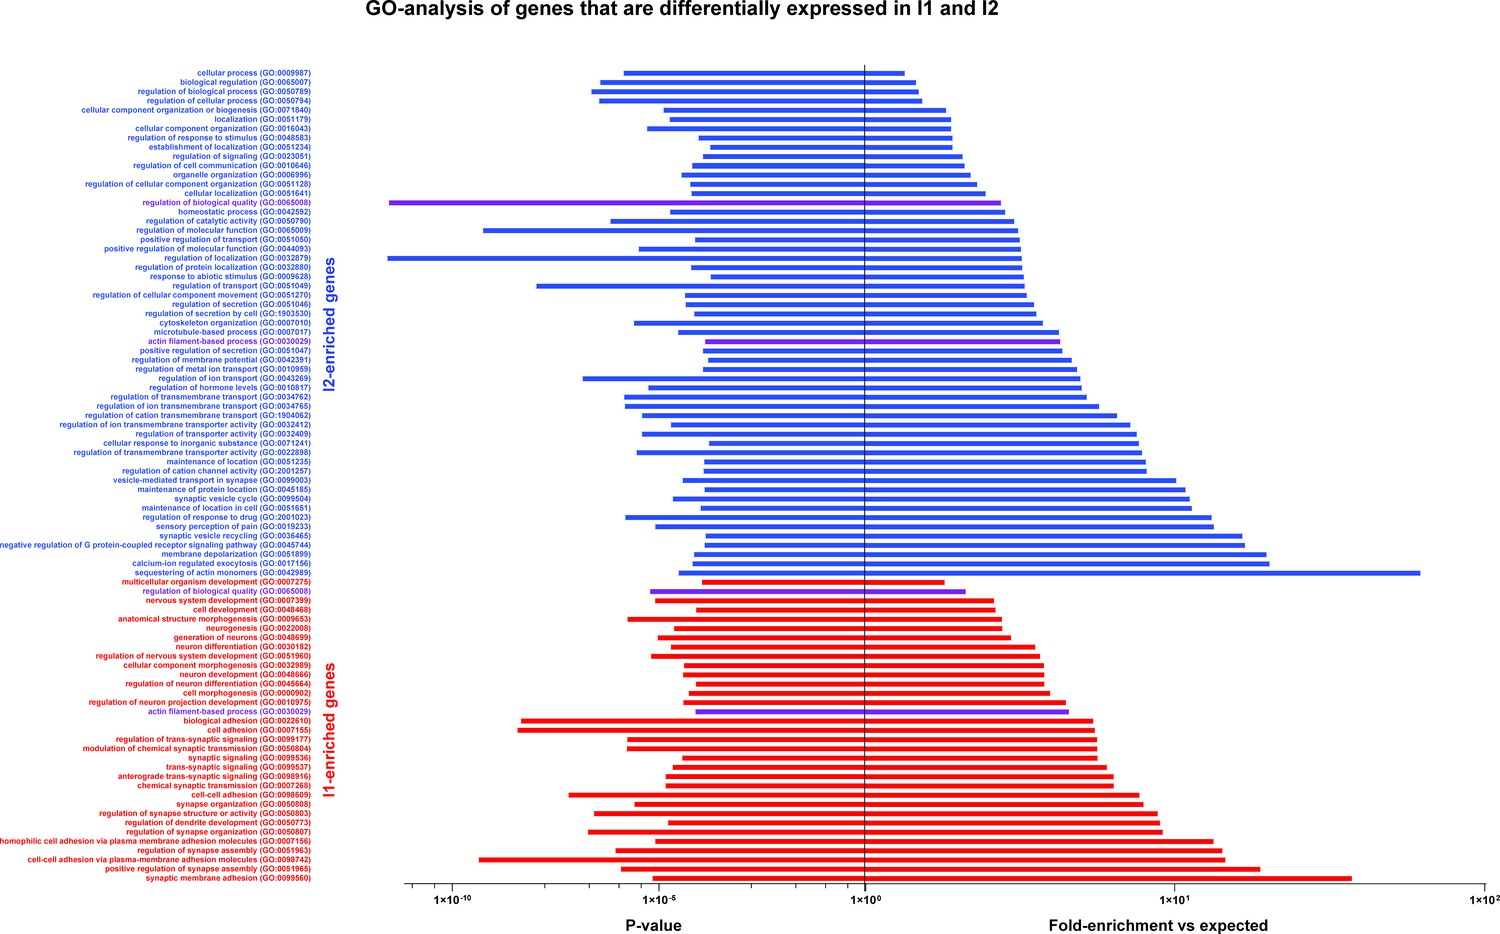
GO-analysis of genes that are differentially expressed in I1 and I2.
GO-analysis was carried out for genes that were identified as upregulated in one injured class relative to the other; all significantly enriched terms are shown. Both sets of genes identified several GO-terms that were significantly over-represented by I1 (red), I2 (blue) or both sets of markers (purple). Note that the term sensory perception of pain (GO:0019233) is over-represented by I2-enriched genes in keeping with predictions from sn-analysis that it is likely to be composed of injured small diameter neurons.
Figure 3
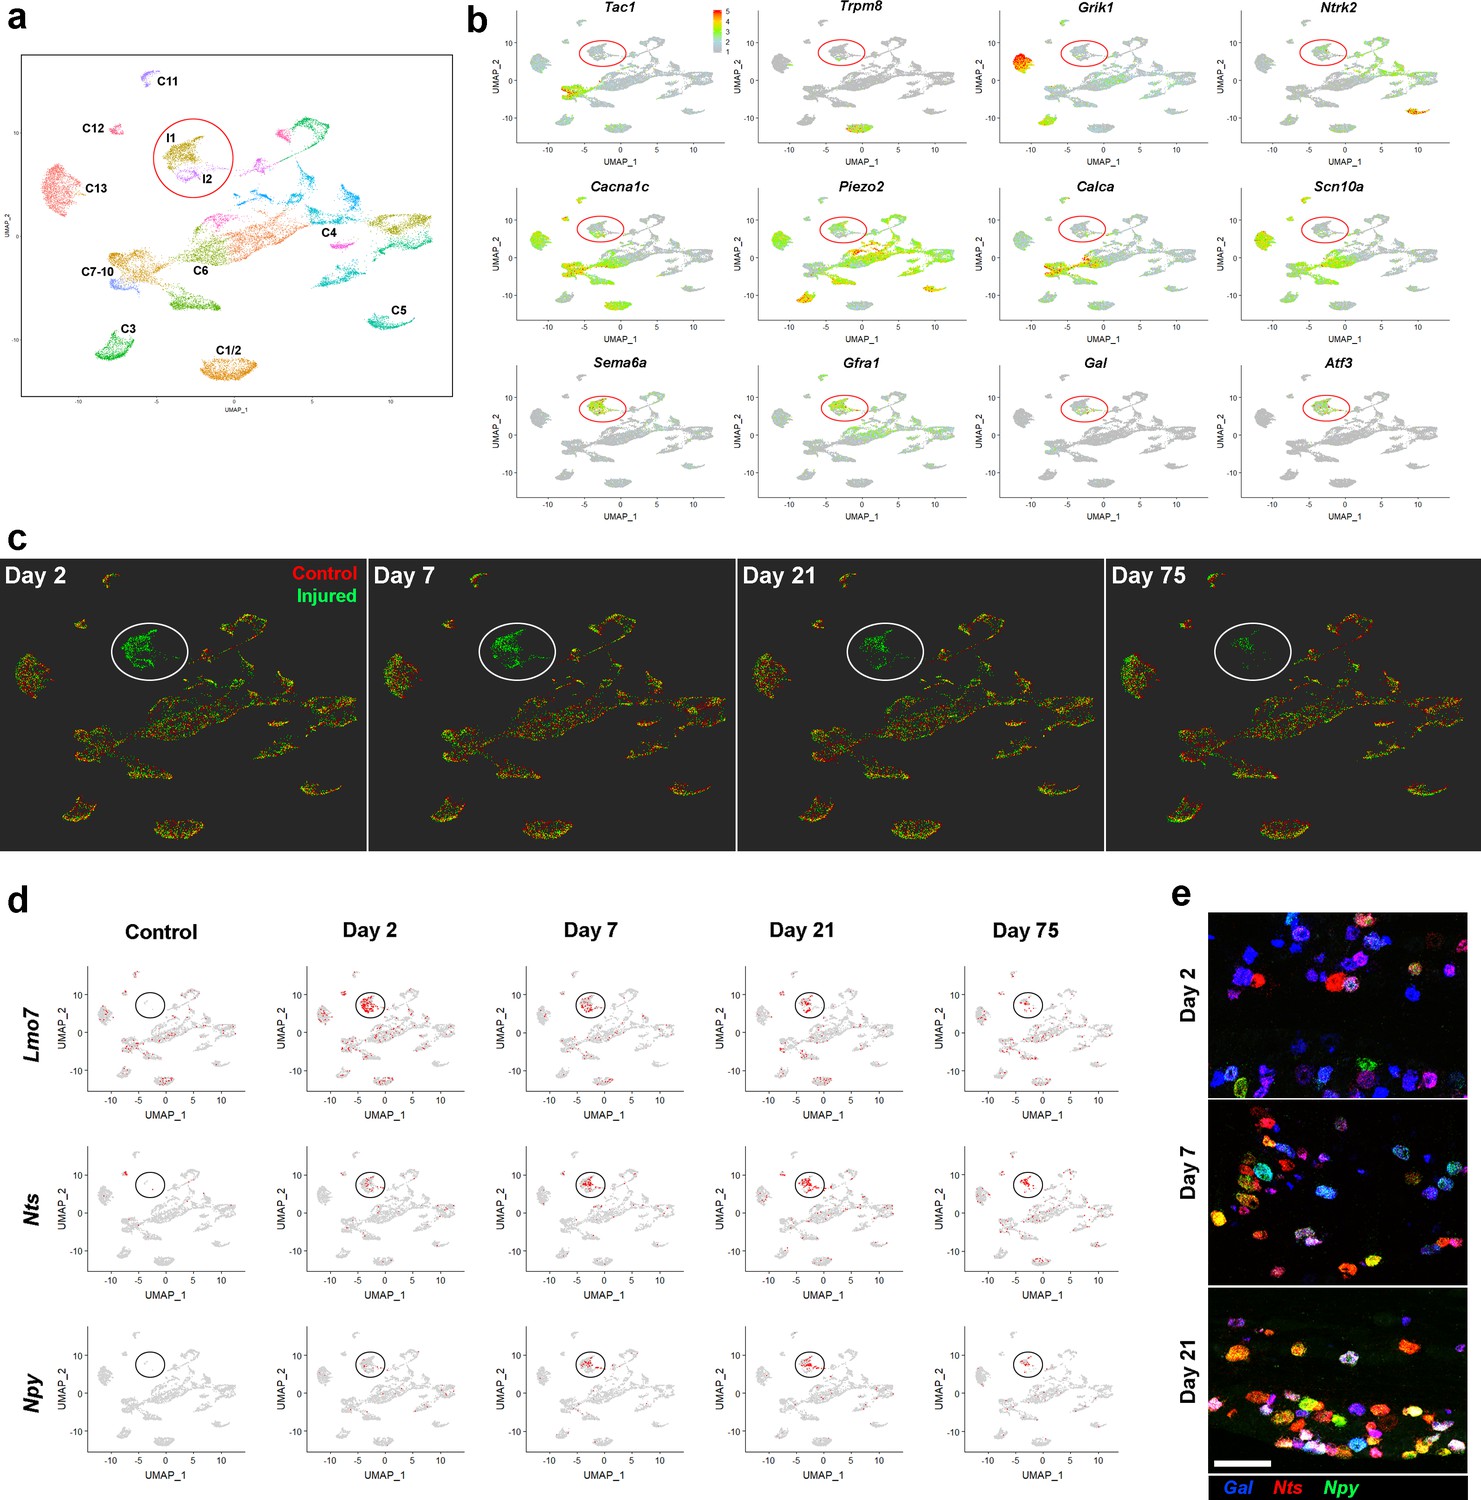
Stability of the IOT induced injured neural state.
(a) UMap representation of sn-data: co-clustering of 20,692 trigeminal neurons from control uninjured mice and from mice at day 2, day 7, day 21, day 75 after IOT; injury-related classes I1 and I2 are circled; colors distinguish clusters identified in this analysis. (b) Expression of select genes (relative cellular expression indicated by the scale-bar) shows down-regulation of several key somatosensory genes in the injured neurons (circled) and upregulation of injury-related transcripts. (c) Cells from each of the four time-points after injury (green) are shown separately in UMap representations. For comparison the uninjured control data (red) are included in each plot. Throughout the time-course, both the injured neurons (circled) and uninjured neural classes remained stable in this representation of multidimensional space. Notably, however, the number of injured neurons decreased at 21 and 75 days. (d) UMap representation showing expression of three injury induced genes (gray, no expression; red, expression; injured cell-classes circled). Note that Lmo7 shows decreased expression after Day 2, whereas expression of Nts and Npy increases at these later time-points. (e) Representative images of triple label ISH using probes for the injury induced neuropeptides Gal (blue), Nts (red) and Npy (green) expose the complex co-expression patterns of these genes after IOT and upregulation of Nts and Npy at later time-points; scale-bar = 100 μm.
Figure 4
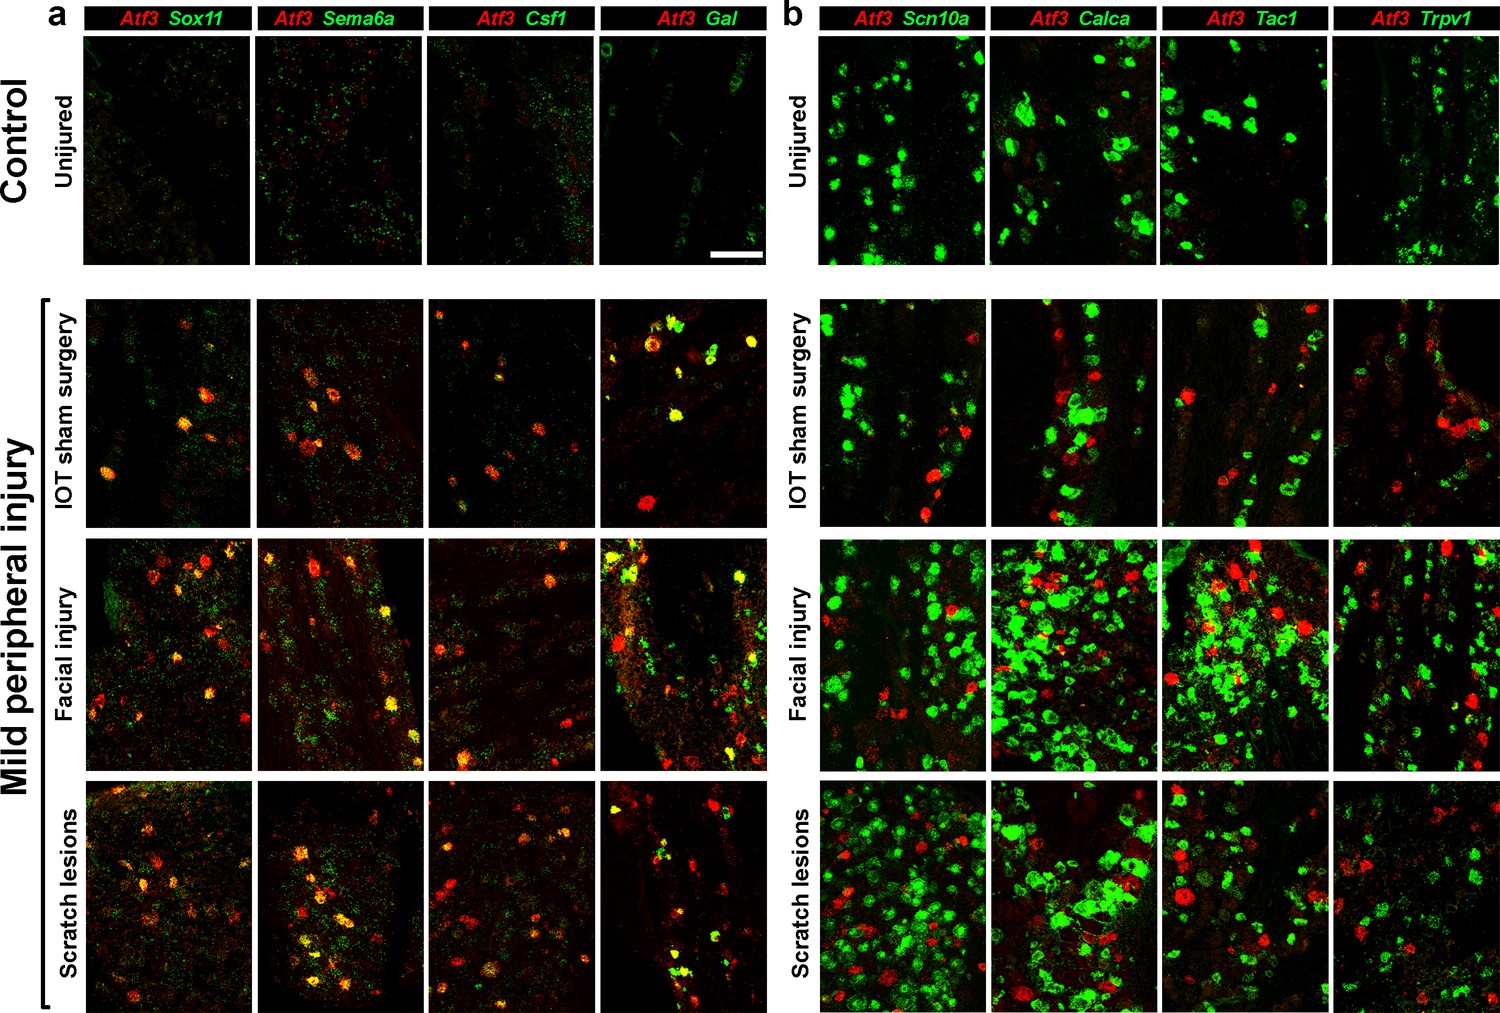
Several types of peripheral injury triggered gene expression changes paralleling those induced by IOT.
Representative images of double label ISH, (Atf3, red) illustrate. (a) upregulation of other injury-related genes (green) and (b) down regulation of key somatosensory transcripts (green) in damaged neurons expressing Atf3. Uninjured control mice typically showed no Atf3 expression (top panels). In contrast three types of mild peripheral injury, IOT sham surgery, facial injury and lesions to the head and neck resulting from scratching (lower panels) induced Atf3-expression in a subset of regionally localized trigeminal neurons. Time points analyzed here were 2 days after injury for IOT sham surgery and facial injury models; scale-bar = 100 μm, see Supplementary file 1 for quantitation of data.
Figure 5 with 3 supplements
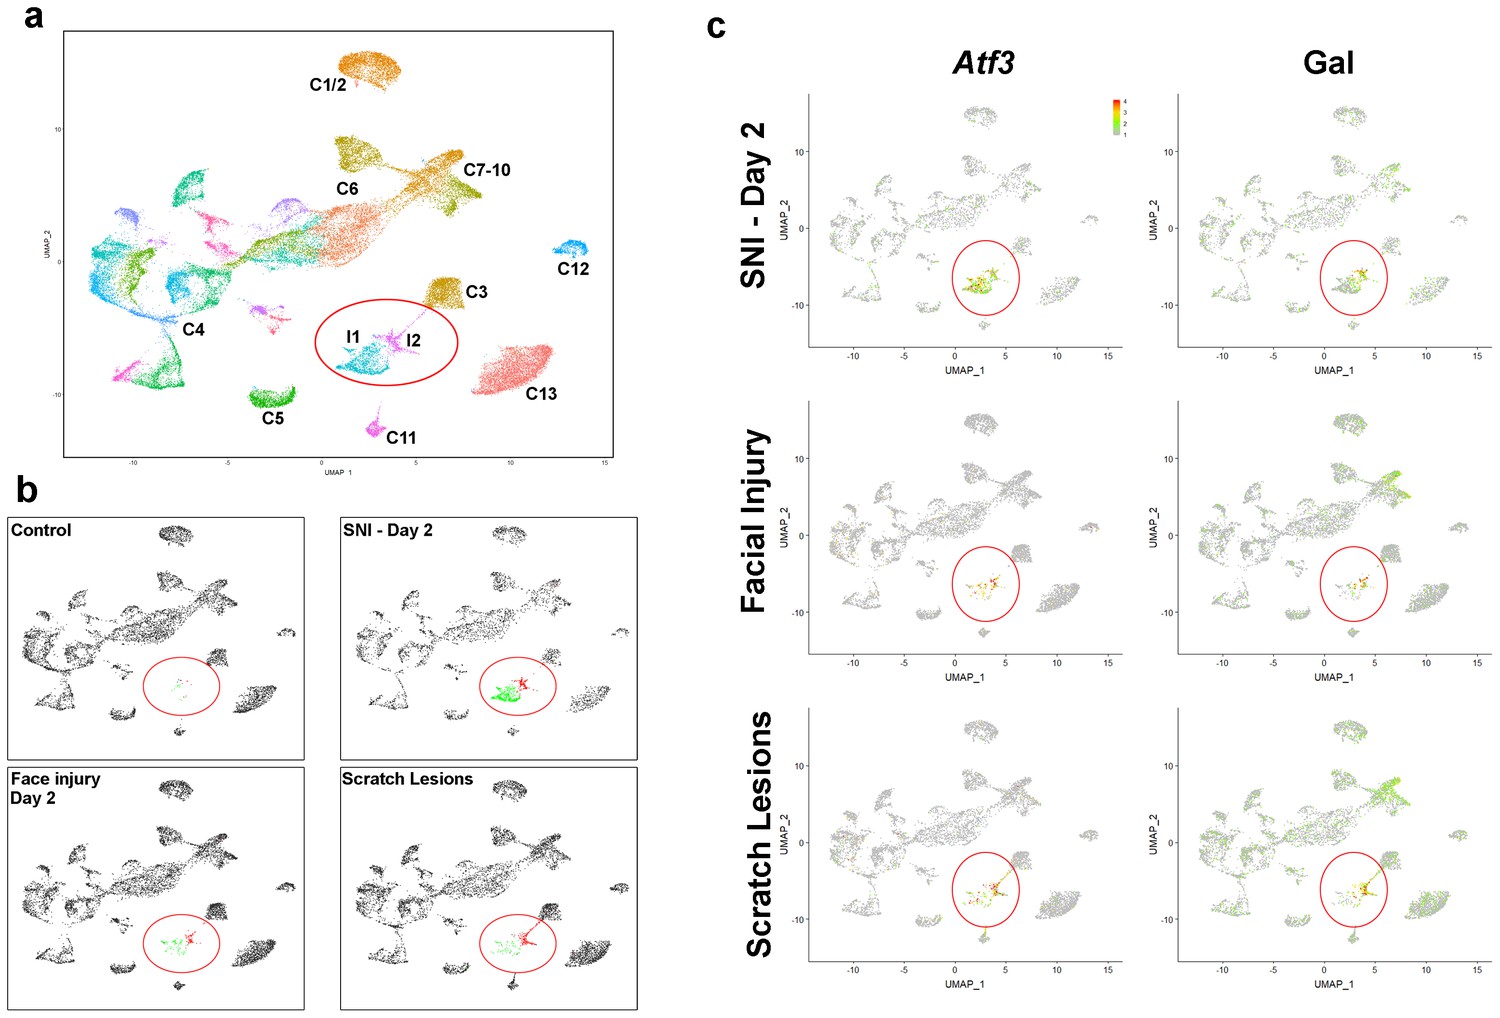
Neurons damaged by facial injury or scratching induce the same transcriptomic states as SNI.
(a) Co-clustering of sn-data (40,359 trigeminal neurons from a combination of control uninjured mice; mice at day 2, day 7, day 21, day 75 after SNI; facial injury-day 2, and scratch lesion models); each cluster is assigned a distinct color and injury-related classes I1 and I2 are circled. The designations (C1–C13) are based on earlier single cell data (Nguyen et al., 2017) and do not distinguish between the new classes of cells identified here (see Supplementary file 4 for detailed description of trigeminal neural classes). (b) Separate UMap plots of the data from the control, SNI-day 2, face injury and scratch injury models in the combined clustering; uninjured cells, gray, I1 cells, green; I2 cells, red; injured classes are circled. Note that both types of peripheral injury produce the same classes of injured cells as SNI; in both cases the proportion of I2 cells was higher than after nerve transection. Uninjured neurons cluster just as in control animals for all three injury models. (c) Injury induced transcripts Atf3 and Gal were prominently expressed by injured neural classes (circled) in all three models; relative expression colored as indicated by scale-bar. However, peripheral injury also up-regulated expression of Gal in C7-10 cells in line with ISH results (Figure 3).
Figure 5—figure supplement 1

Peripheral injury induces gene expression changes matching those triggered by cutting major nerve branches.
(a) Cluster analyses of sn-data from 8660 trigeminal neurons isolated from mice with facial injury (left panel) and 7829 neurons from mice with scratch lesion (right panel). Injured neurons (black) are circled; other colors denote distinct clusters of cells, designations (C1–C13) are based on earlier single cell data (Nguyen et al., 2017). (b) Gene expression in the sn-analyses shown in (a), scale-bar indicates relative expression level; injured cells are circled. (c) Dot plot representation of gene expression in the cluster analysis shown in Figure 5; control data are not included for injured cells because very few control neurons were identified as clustering in either I1 or I2 (Figure 5). Dot color indicates dataset: uninjured control (green); SNI-day 2 (blue); facial injury (red); scratch lesion (purple). Relative expression level color-coded from gray to pure color (see scale-bar); the percent of neurons expressing a gene is depicted by dot size (lower scale). Note the highly consistent gene expression patterns in all clusters before and after injury, regardless of injury type. One exception is integrin beta 6 Itgb6, which was not upregulated in many cells after facial injury but was expressed in I1 and I2 in the other models.
Figure 5—figure supplement 2
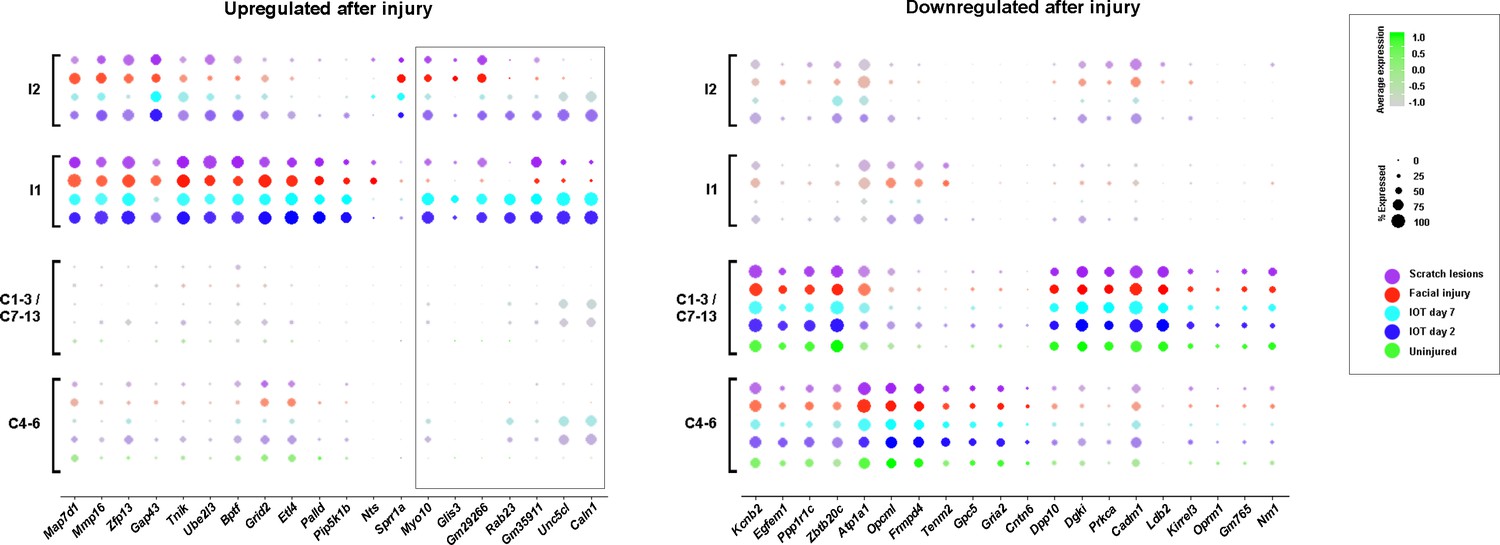
Additional quantitation of genes up- and downregulated in injured trigeminal neurons Dot plot representation of gene expression in the cluster analysis shown in Figure 5.
Dot color indicates dataset: uninjured control (green); SNI-day 2 (blue); SNI-day 7 (cyan); facial injury (red); scratch lesion (purple); uninjured neurons have been pooled according to predicted size: large diameter (C4-6); small diameter (C1−3/C7-13). Relative expression level color-coded from gray to pure color as indicated); the percent of neurons expressing a gene is depicted by dot size (indicated). Control data are not included for injured cells because very few control neurons were identified as clustering in either I1 or I2 (Figure 5). Note many upregulated and most down regulated genes show great similarity in all injury models but some upregulated transcripts (boxed) were more prominent in the IOT injury model than after milder peripheral injury.
Figure 5—figure supplement 3

GO-analysis of genes that are up- and downregulated in injured neurons.
GO-analysis was carried out for genes that were identified as upregulated or downregulated in injured neurons relative to uninjured neurons; all significantly enriched terms are shown. Upregulated genes were enriched in GO-terms such as developmental process, system development, nervous system development, cell motility and cell adhesion. By contrast, down regulated genes were enriched in GO-terms related to neural function including synaptic signaling, regulation of sodium transport, regulation of transmembrane potential, action potential, sensory representation of pain.
Figure 6 with 1 supplement
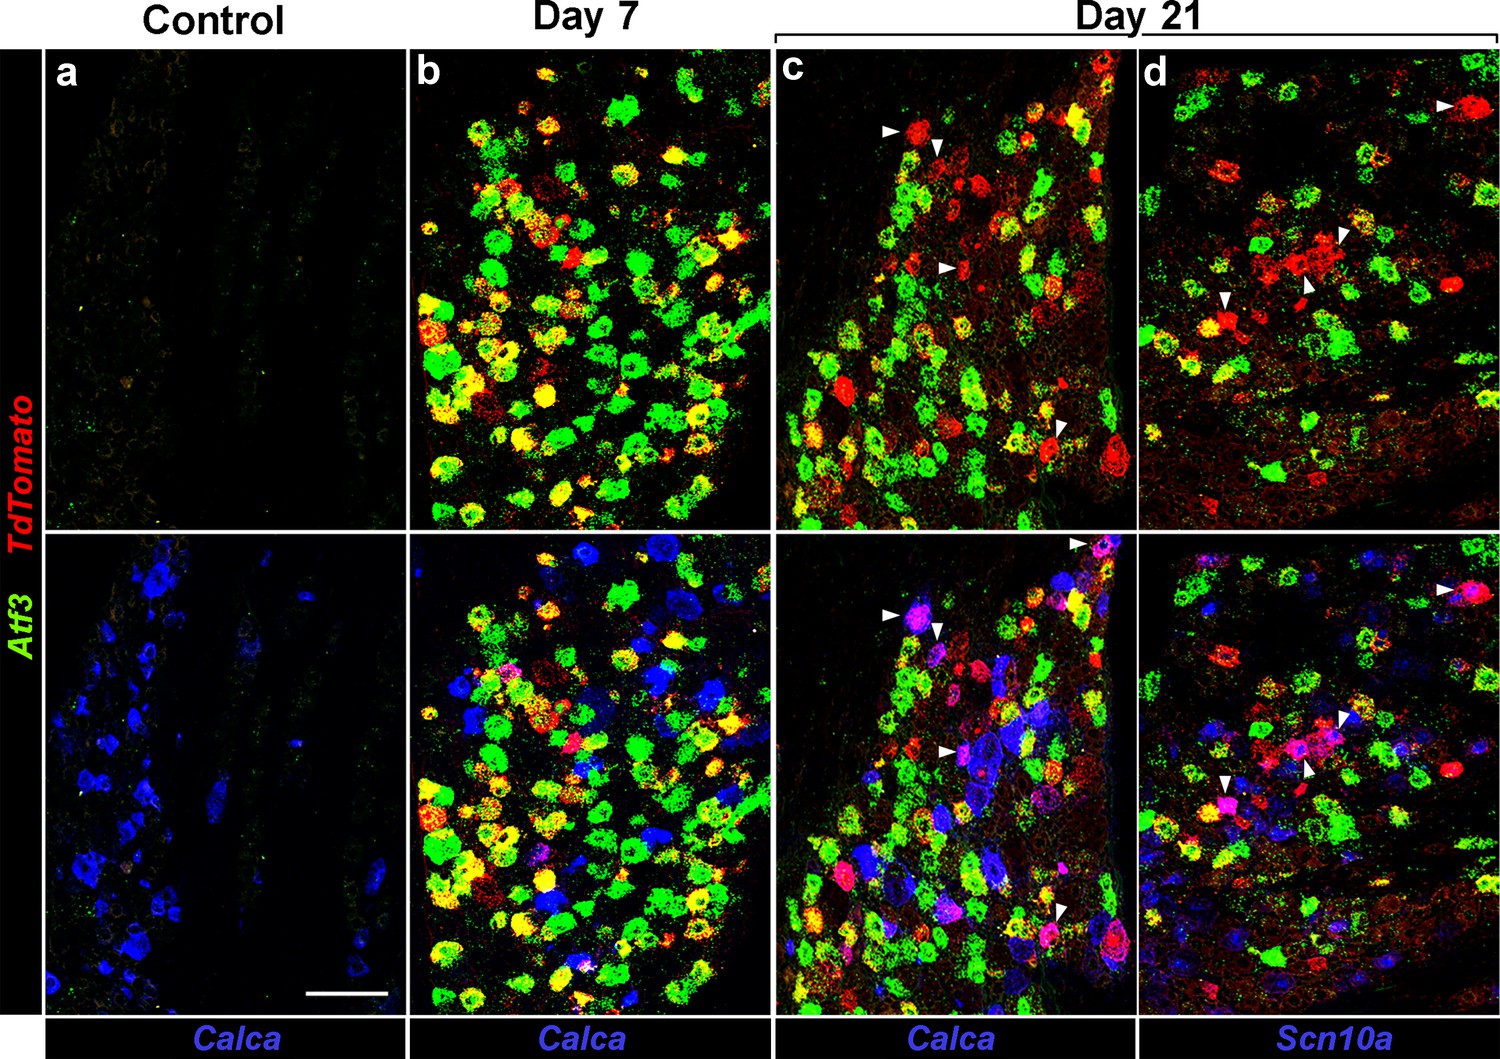
Injured neurons revert to an uninjured transcriptional state.
Representative triple label ISH showing sections from Atf3-IRES-Cre mice where a subset of peripheral neurons has been transduced by AAV9-CAG-flex-tdTomato; (a) Before injury (Control), (b) 7 days and (c,d) 21 days after IOT. Upper panels show staining for Atf3 (green) and tdTomato (red): before injury no positive cells were detected; day 7 most tdTomato positive neurons also expressed Atf3; day 21 about half the tdTomato positive neurons were Atf3-negative. Note because of the viral approach not all Atf3-positive cells express tdTomato. Lower panels show the same images but include expression of Calca or Scn10a (blue) demonstrating that these genes are rarely co-expressed with Atf3 but are regularly found in cells labeled by tdTomato but not Atf3; arrowheads (c,d) point to tdTomato-positive cells which also express (c) Calca or (d) Scn10a. Scale-bar = 100 μm; see Supplementary file 1 for quantitation and statistical analysis.
Figure 6—figure supplement 1
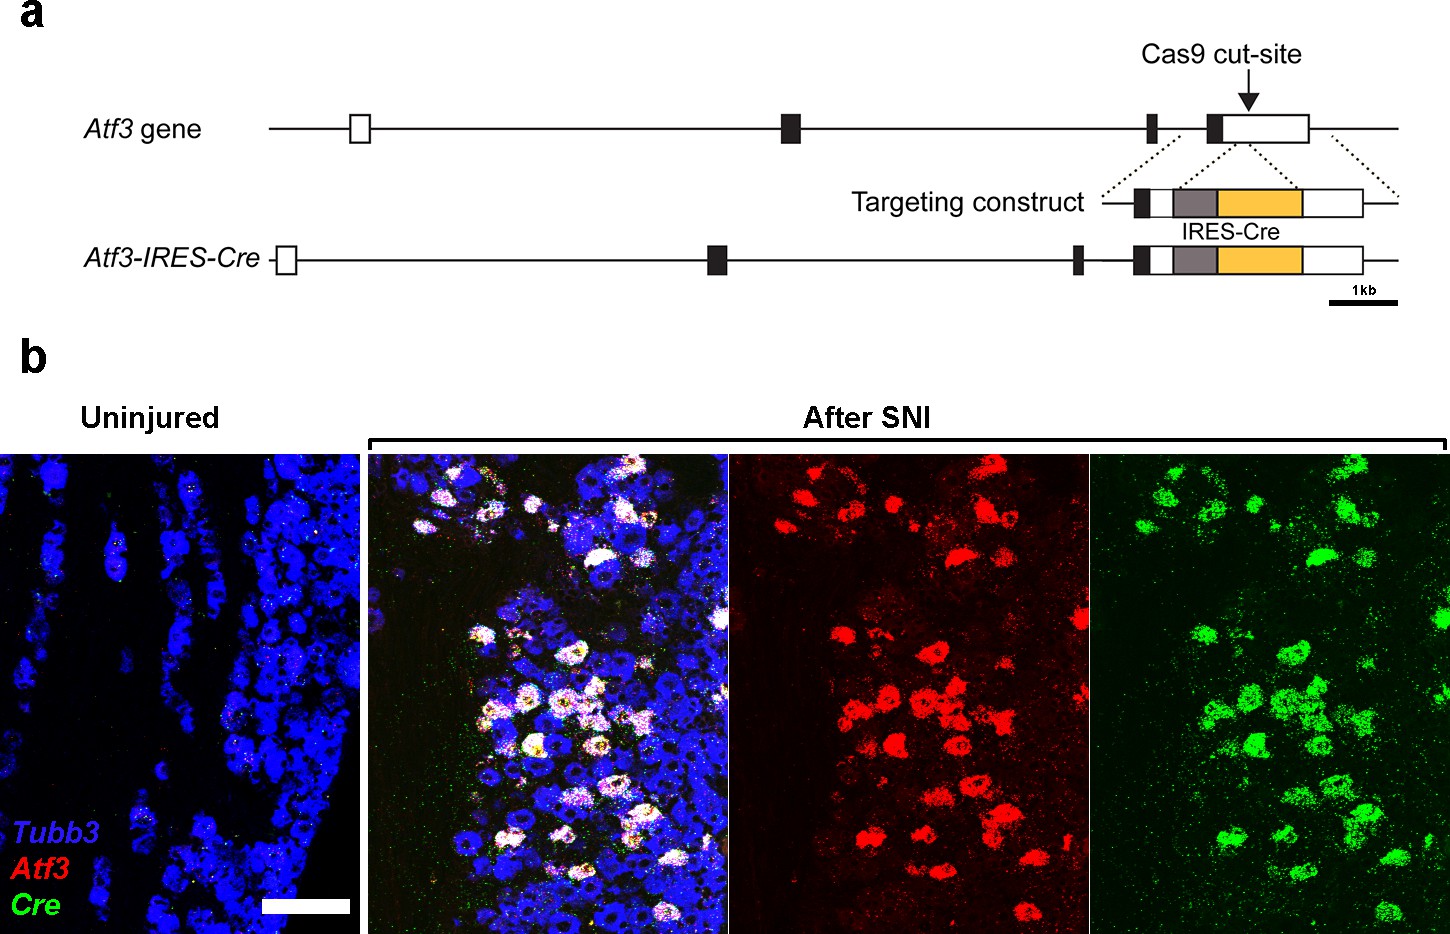
Generation and characterization of Atf3-IRES-Cre mice.
(a) Scale representation of the Atf3 gene (5’ to 3’ left to right); exons shown boxed with coding sequence black and the targeted Cas9 cleavage site in the non-coding 3’ regions indicated. The targeting construct and targeted locus are shown below: gray box, IRES, yellow box Cre. Positive founders were identified by diagnostic nested PCR. (b) Representative images of triple label ISH of sections through the trigeminal ganglion. Left panel before injury neurons (Tubb3-positive, blue) did not express Atf3 (red) or Cre (green). 2 days after IOT surgery a subset of trigeminal neurons were now positive for Atf3. As expected, all Atf3 cells also expressed Cre; scale-bar = 100 μm. See also Figure 6 demonstrating Cre-recombinase activity in this line.
Tables
Table 1
Genes up- and down-regulated in injured trigeminal neurons.
Genes that are affected by IOT were identified by comparing expression in the two injured neuron classes relative to other classes. (a) Selected up-regulated genes, their proposed functional role and previous assignment as injury-related transcripts (Cobos et al., 2018; Guan et al., 2016; Shin et al., 2019; Wlaschin et al., 2018) and/or as genes involved in neural regeneration (Mahar and Cavalli, 2018). (b) Selected down-regulated genes, their functional classification and previous assignment as injury-related transcripts (Shin et al., 2019). See Supplementary file 2; Supplementary file 3; Supplementary file 4 for more information about genes expression changes in injured neurons including magnitude of changes and probability that expression is altered and Figure 2—figure supplement 3 for GO-analysis.
| Table 1a | ||
|---|---|---|
| Gene | Reported functional roles | Reported previously1, 2 |
| Atf3 | Transcriptional regulation: (up and downregulation) ATF/CREB family of transcription factors | a, b, c, D |
| Sema6a | Semaphorin: receptor for Plxna2 role in cell-cell signaling and appropriate neural projection | a, b, c |
| Sox11 | Transcription factor: regulates survival and axonal growth in embryonic sensory neurons | a, b, D |
| Gal | Neuropeptide: modulation and inhibition of action potentials | a, b, c |
| Npy | Neuropeptide: neuropeptide with multiple roles including reducing pain perception | a, b, c |
| Nts | Neuropeptide: multiple roles in neurotransmission/modulation | a, b, c |
| Mmp16 | Metallopeptidase: extracellular matrix degradation | a, b, c |
| Itgb6 | Integrin subunit: cell-cell interactions | |
| Itga7 | Integrin subunit: cell-cell interactions | a, c |
| Myo10 | Headless myosin: roles in development and cell migration | a, c |
| Gfra1 | Receptor for GDNF: promotes neural survival and differentiation of neurons | a |
| Lmo7 | Signaling: negative feedback regulator of transforming growth factor | a, b |
| Pou2f1 | Transcription factor: prominent in development | a, c |
| Table 1b | ||
|---|---|---|
| Gene | Reported functional roles | Reported previously3 |
| Grik1 | Ligand-gated ion channel subunit: kainate receptor type 1 | a |
| Prkca | Signal transduction: protein kinase c alpha | |
| Trpc3 | Ion channel: Trpc3 linked to mechanosensory transduction | |
| Scn10a | Sodium ion channel subunit: Nav1.8 linked to pain sensation in humans and mice | a |
| Scn9a | Sodium ion channel subunit: Nav1.7 linked to pain sensation in humans and mice | |
| Scn1a | Sodium ion channel subunit: Nav1.1 linked to pain sensation in humans and mice | a |
| Calca | Neuropeptide: CGRP, role in neuroinflammation and pain | |
| Tac1 | Neuropeptide: substance P, acts as a neurotransmitter/modulator, role in pain | a |
| Kcnb2 | Potassium channel subunit | a |
| Cacnb4 | Calcium channel subunit | |
| Trpm3 | Ion channel: Trpm3 linked to pain signaling in mice | |
| Oprm1 | G protein coupled receptor: mu-opioid receptor | |
| Snap25 | Synaptosome associated protein: role in neurotransmitter release | a |
-
1Upregulated after SNI (a) Shin et al. (2019), (b) Wlaschin et al. (2018), (c) Cobos et al. (2018).
2Role in neural regeneration (D) Mahar and Cavalli (2018).
-
3Downregulated after SNI (a) Shin et al. (2019).
Key resources table
| Reagent type (species) or resource | Designation | Source or reference | Identifiers | Additional information |
|---|---|---|---|---|
| Gene (Mus musculus) | Atf3 | NA | ENSMUSG00000026628 | |
| Strain, strain background (Mus musculus) | C57BL/6 | Charles River | Strain code: 027 | |
| Genetic reagent (Mus musculus) | Atf3-IRES-Cre | This paper | Knockin mouse; details Figure 6—figure supplement 1 | |
| Genetic reagent (Mus musculus) | TetO-mCherry-2A-Gnaq* | This paper | Random insertion transgene (See Materials and methods) | |
| Genetic reagent (Mus musculus) | Fos-tTA | The Jackson Laboratory | JAX: 018306 | Reijmers et al., 2007 |
| Genetic reagent (Adeno-associated virus) | AAV9-CAG-FLEX-tdTomato-WPRE | Addgene; Oh et al., 2014 | Addgene: 51503-AAV9 | 2.1 × 10^13 GC/µl |
| Antibody | Anti-NeuN (rabbit polyclonal) | Millipore | Cat#ABN78; RRID:AB_10807945 | (1:2000) |
| Sequence- based reagent | crRNA | Dharmacon Inc. | Edit-R Modified Synthetic crRNA | Target sequence: GCAGAAGTGTCTACCTTGAT |
| Peptide, recombinant protein | Cas9 | PNA Bio Inc. | CP01 | |
| Commercial assay or kit | RNAscope multiplex fluorescent development kit | Advanced Cell Diagnostics | ACD: 320851 | |
| Commercial assay or kit | RNAscope probe-Mm-S100b | Advanced Cell Diagnostics | ACD: 431731 | |
| Commercial assay or kit | RNAscope probe-Mm-Slit2 | Advanced Cell Diagnostics | ACD: 449691 | |
| Commercial assay or kit | RNAscope probe-Mm-Ntng1 | Advanced Cell Diagnostics | ACD: 488871 | |
| Commercial assay or kit | RNAscope probe-Mm-Rgs6 | Advanced Cell Diagnostics | ACD: 521211 | |
| Commercial assay or kit | RNAscope probe-Mm-Cacna1h | Advanced Cell Diagnostics | ACD: 459751 | |
| Commercial assay or kit | RNAscope probe-Mm-Scn5a | Advanced Cell Diagnostics | ACD: 429881 | |
| Commercial assay or kit | RNAscope probe-Mm-Htr3a | Advanced Cell Diagnostics | ACD: 411141 | |
| Commercial assay or kit | RNAscope probe-Mm-Mrgprd | Advanced Cell Diagnostics | ACD: 417921 | |
| Commercial assay or kit | RNAscope probe-Mm-Scn10a | Advanced Cell Diagnostics | ACD: 426011 | |
| Commercial assay or kit | RNAscope probe-Mm-Atf3 | Advanced Cell Diagnostics | ACD: 426891 | |
| Commercial assay or kit | RNAscope probe-Mm-TrpV1 | Advanced Cell Diagnostics | ACD: 313331 | |
| Commercial assay or kit | RNAscope probe-Mm-Tac1 | Advanced Cell Diagnostics | ACD: 410351 | |
| commercial assay or kit | RNAscope probe-Mm-Calca | Advanced Cell Diagnostics | ACD: 420361 | |
| Commercial assay or kit | RNAscope probe-Mm-Grik1 | Advanced Cell Diagnostics | ACD: 438771 | |
| Commercial assay or kit | RNAscope probe-Mm-Piezo2 | Advanced Cell Diagnostics | ACD: 400191 | |
| Commercial assay or kit | RNAscope probe-Mm-Gal | Advanced Cell Diagnostics | ACD: 400961 | |
| Commercial assay or kit | RNAscope probe-Mm-Nts | Advanced Cell Diagnostics | ACD: 420441 | |
| Commercial assay or kit | RNAscope probe-Mm-Npy | Advanced Cell Diagnostics | ACD: 313321 | |
| Commercial assay or kit | RNAscope probe-Mm-Sox11 | Advanced Cell Diagnostics | ACD: 440811 | |
| Commercial assay or kit | RNAscope probe-Mm-Sema6a | Advanced Cell Diagnostics | ACD: 508101 | |
| Commercial assay or kit | RNAscope probe-Mm-Csf1 | Advanced Cell Diagnostics | ACD: 315621 | |
| Commercial assay or kit | RNAscope probe-TdTomato | Advanced Cell Diagnostics | ACD: 317041 | |
| Commercial assay or kit | RNAscope probe-Fos | Advanced Cell Diagnostics | ACD: 316921 | |
| Commercial assay or kit | RNAscope probe-Egr1 | Advanced Cell Diagnostics | ACD: 423371 | |
| Commercial assay or kit | Chromium single cell 3’ reagent kit (v2) | 10X Genomics | Cat# 120237 | |
| Commercial assay or kit | Chromium i7 Multiplex Kit, 96 rxns | 10x Genomics | Cat# 120262 | |
| Commercial assay or kit | Chromium Single Cell A Chip Kit | 10x Genomics | Cat# 120236 | |
| Software, algorithm | Seurat | Butler et al., 2018; Stuart et al., 2018 | RRID:SCR_016341 | https://satijalab.org/ |
| Software, algorithm | CellRanger | 10x Genomics | ||
| Software, algorithm | Drop-seq | McCarroll Lab | http://mccarrolllab.org/dropseq/ | |
| Software, algorithm | R | R Project for Statistical Computing | RRID:SCR_001905 | http://www.r-project.org/ |
| Software, algorithm | R Studio | R Studio | rstudio.com | |
| Software, algorithm | Prism v8 | GraphPad | RRID:SCR_002798 | |
| Software, algorithm | PhotoShop CC | Adobe | RRID:SCR_014199 | |
| Other | RNAlater | ThermoFisher | Cat# AM7021 | |
| Other | Glass dounce homogenizer | Fisher Scientific | Cat# 357538 | |
| Other | 40 µm cell strainer | ThermoFisher | Cat# 08-771-1 | |
| Other | SUPERaseIn RNase Inhibitor | ThermoFisher | Cat# AM2696 | 0.2 U/ml |
| Other | Anti-rabbit IgG microbeads | Miltenyi Biotec | Cat# 130-048-602 | |
| Other | LS columns | Miltenyi Biotec | Cat# 130-042-401 | |
| Other | MACS MultiStand | Miltenyi Biotec | Cat# 130-042-303 | |
| Other | MidiMACS Separator | Miltenyi Biotec | Cat# 130-042-302 | |
| Other | Ultra-Turrax T10 | Laboratory Supply Network, Inc. | IKA:3737001 | |
| Other | Dispersing element S10N-5G for Ultra-Turrax T10 | Laboratory Supply Network, Inc. | IKA:3304000 |
Additional files
-
Supplementary file 1
Quantitation and statistical analysis of ISH data.
Quantitation was carried out by counting positive neurons in multilabel ISH images of trigeminal ganglion sections from 3 mice of a given genotype and injury model. Expression ratios were calculated for each section and used to determine mean and standard deviation. Significant differences in the proportion of a given population of neurons expressing a marker were determined using Welch's t-test (one-tailed); p-values>0.0001 are reported explicitly.
- https://doi.org/10.7554/eLife.49679.017
-
Supplementary file 2
Genes that differentiate I1 from I2.
The clustering in Figure 5 was used as a framework to search for markers for the I1 versus I2 clusters using the FindMarkers function and the default Wilcoxon rank sum test in Seurat; a minimum criterion for inclusion was expression in 20% of cells. Markers for I1 and I2 are displayed in separate sheets (click through tabs at the bottom of the spreadsheet).
- https://doi.org/10.7554/eLife.49679.018
-
Supplementary file 3
Markers for each injury model.
The clustering in Figure 5 was used as a framework to search for markers in the I1+I2 clusters versus all other clusters for each injury model using the FindMarkers function and the default Wilcoxon rank sum test in Seurat; expression in more than 20% of injured or noninjured cells was a criterion for inclusion. Genes are displayed in separate sheets labeled according to model and time (click through tabs at the bottom of the spreadsheet). It should be noted that even after removal of injury-affected genes from the variable genes used in clustering, the injury-related classes were still resolved (Figure 2). Therefore, although these are the most prominent effects of a particular injury on trigeminal neural gene expression the effects of these types of injury are likely to be far more extensive.
- https://doi.org/10.7554/eLife.49679.019
-
Supplementary file 4
Markers for each of the trigeminal neural classes.
Markers for the classes identified in the clustering (Figure 5) were determined using the FindAllMarkers function and the default Wilcoxon rank sum test in Seurat; a minimum expression in 20% of neurons was set as the inclusion limit. One class per sheet (click through tabs at the bottom of the spreadsheet to see the different cell classes). I1 and I2 are the injured neurons; note clusters C1/2, C3, C5, C7/9/10, C8, C11, C12, C13 correspond directly to classes identified earlier (Nguyen et al., 2017). Clusters C4 and C6 from that analysis were divided further by the sequencing of nuclei. The new classes of these neurons have been designated C4, C6 or C4-C6 based on their UMap location and expression profiles; these are arbitrarily distinguished as (a), (b), (c)... etc. based solely on the number of neurons in a given cluster (see Figure 5). Note that although there are many advantages of sn-RNA sequencing, there are several drawbacks for example highly expressed ISH markers: Mrgprd (C13), Mrgrpa3 (C12), Nppb (C11), Trpv1 (C7/9/10 and C8), Cd34 (C3) show far lower pct. one values (i.e. greater dropout) than in single cell analysis. Some transcripts for example Hjurp (C1/2) are probably not expressed genes; Hjurp is located adjacent to Trpm8 (the primary marker of C1/2 cells) in the mouse genome but was not detected at high level in sc-sequencing (Nguyen et al., 2017). As Hjurp plays a role in cell division it is unlikely to be a neural marker. There are also some minor problems associated with the alignment of reads to the pre-mRNA build of the mouse genome including clear mis-naming of a few genes (Dlg2 is named Dlg2.1 in this build; some transcripts map to Bacs: RP23 and RP24 etc.). The pre-mRNA basis for mapping reads also led to removal of genes that fall in intervals where genes overlap because introns are considered part of the coding sequence. One notable example of this is the pan-neuronal marker Tubb3 that is in an interval spanned by a predicted gene (Gm20388) and is thus consistently missing from published mouse sn-data and our analysis. These problems are unlikely to have a strong effect on clustering or the main conclusions drawn from sn-analyses.
- https://doi.org/10.7554/eLife.49679.020
-
Transparent reporting form
- https://doi.org/10.7554/eLife.49679.021
Download links
A two-part list of links to download the article, or parts of the article, in various formats.
Downloads (link to download the article as PDF)
Open citations (links to open the citations from this article in various online reference manager services)
Cite this article (links to download the citations from this article in formats compatible with various reference manager tools)
Stereotyped transcriptomic transformation of somatosensory neurons in response to injury
eLife 8:e49679.
https://doi.org/10.7554/eLife.49679


