Genetically diverse uropathogenic Escherichia coli adopt a common transcriptional program in patients with UTIs
- University of Michigan, United States
- Texas A&M University, United States
Figures
Figure 1 with 5 supplements
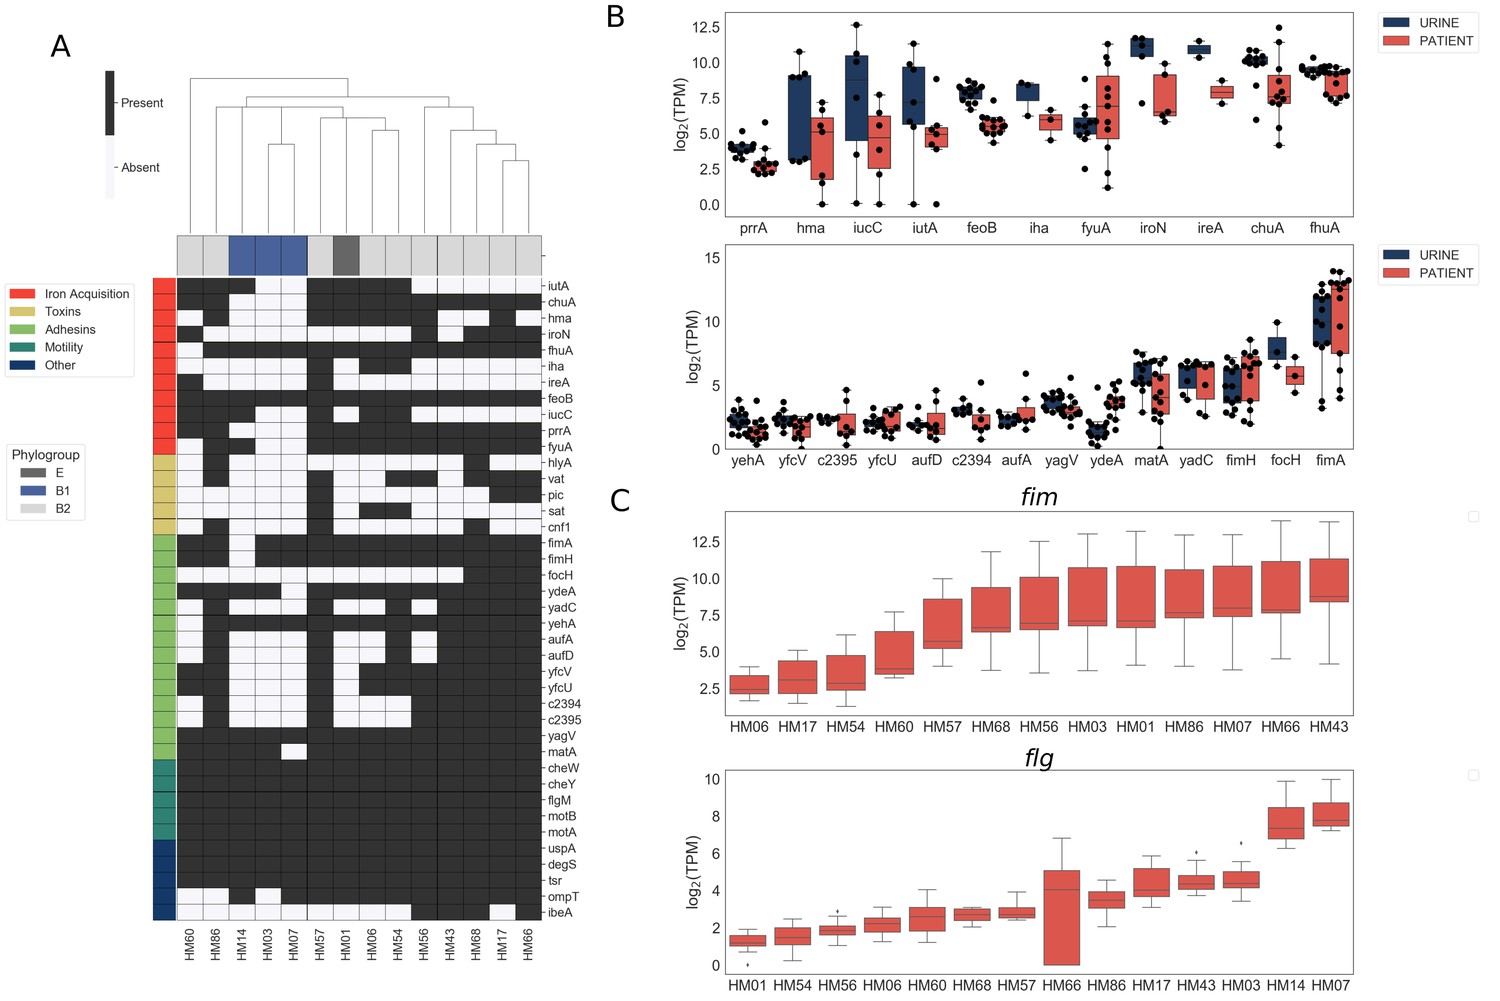
Clinical UPEC isolates carry a highly variable set of virulence factors.
Phenotypic and genotypic information about the strains can be found in Figure 1—figure supplement 1, Figure 1—figure supplement 2, Table 1, and Table 2. (A) Clinical UPEC isolates were examined for presence of 40 virulence factors. Virulence factors were identified based on homology using BLAST searches (≥80% identity,≥90% coverage). The heatmap shows presence (black) or absence (white) of virulence factors across 14 UPEC strains. Hierarchical clustering based on presence/absence of virulence factors shows separate clustering of B1 isolates. (B) Log2 TPM for iron acquisition genes (top panel) and adhesins (bottom panel) in urine and patient samples. Gene expression of other virulence factors is shown in Figure 1—figure supplement 3. Correlations of virulence factor expression among in vitro and patient samples is shown in Figure 1—figure supplement 4. (C) Log2 TPM of fim (top panel) and flg (bottom panel) operons across the 14 UPEC strains during in vitro urine culture and human UTI.
Figure 1—figure supplement 1
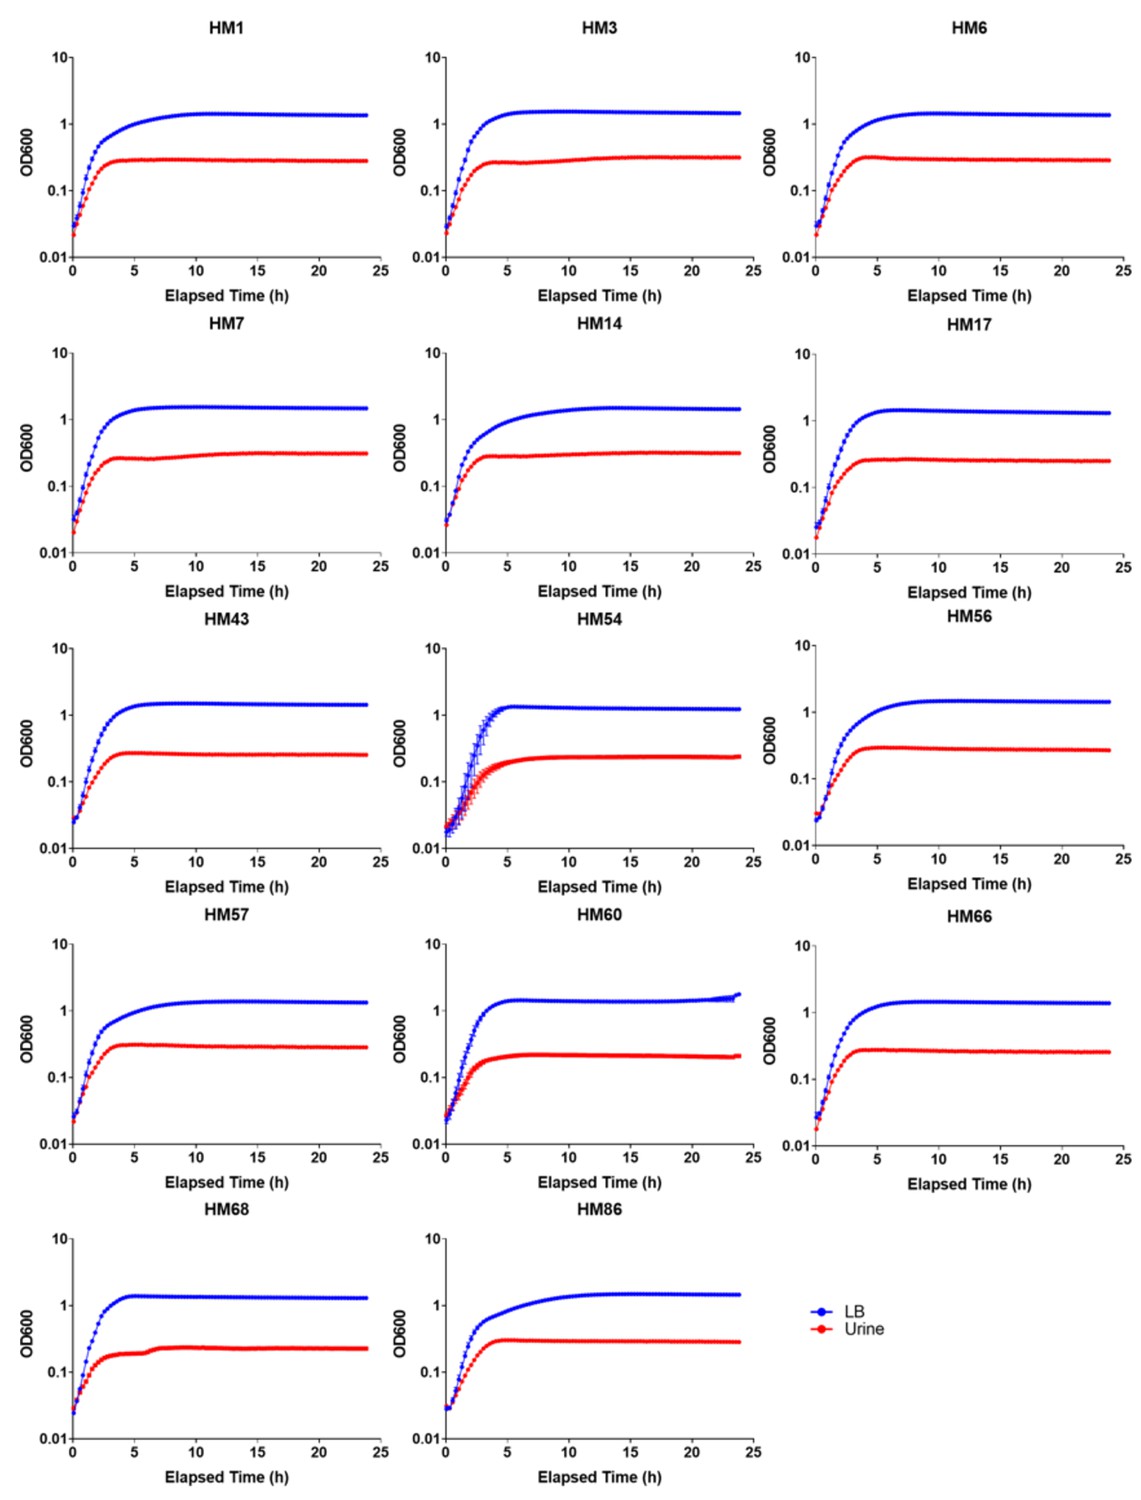
Growth curves for 14 clinical UPEC strains cultured in LB or filter-sterilized urine.
https://doi.org/10.7554/eLife.49748.005
Figure 1—figure supplement 2
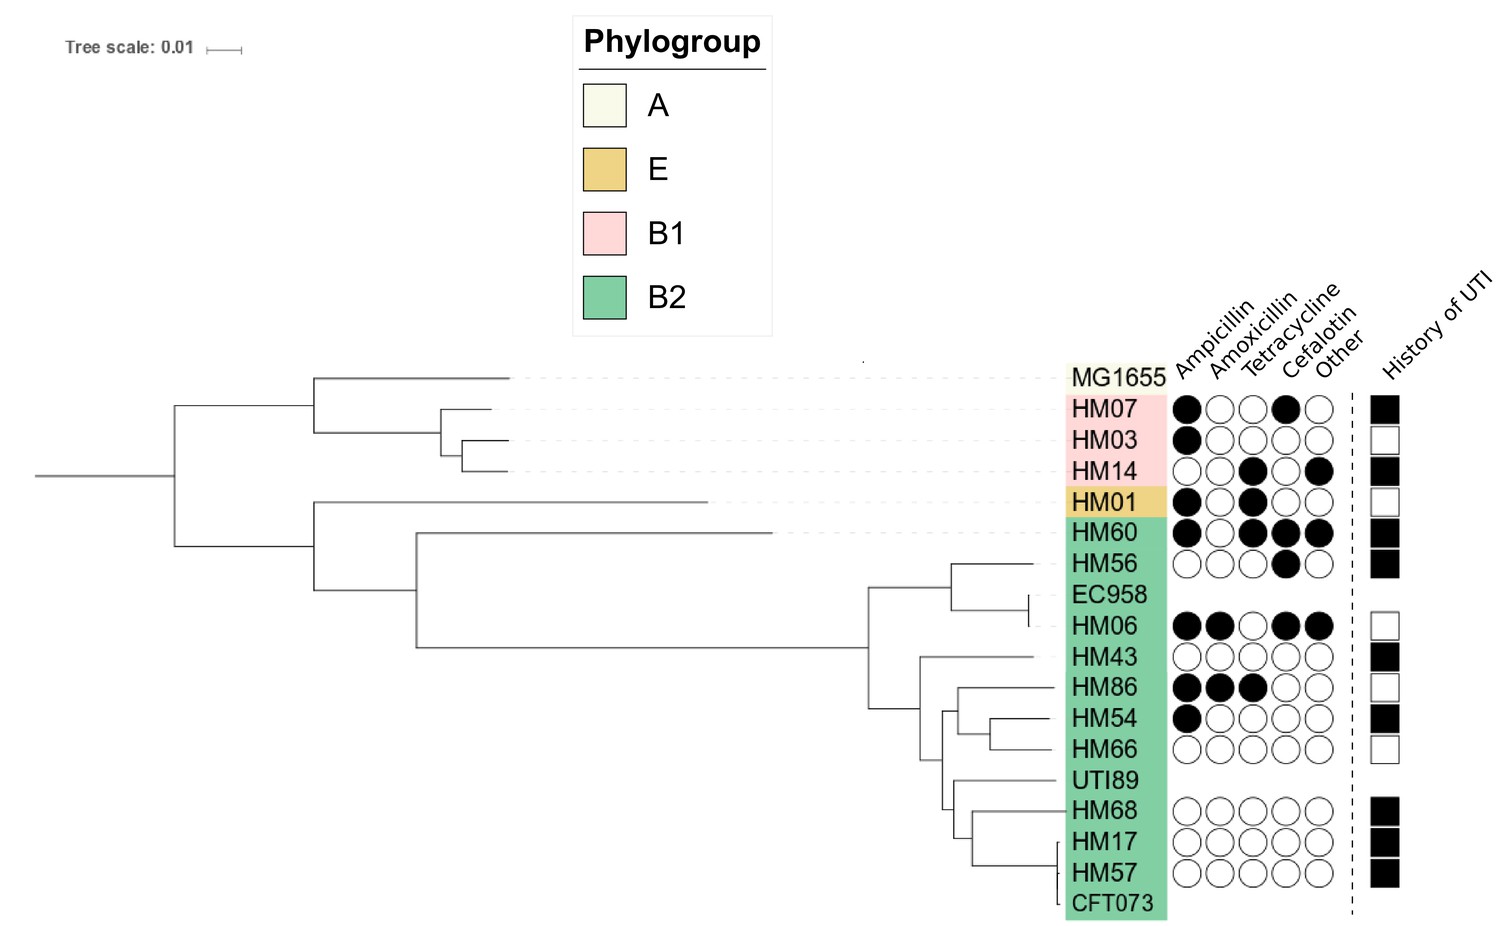
Phylogenetic tree reconstruction of 14 clinical UPEC strains isolated in this study.
Antibiotic resistance profiles are indicated by filled in black circles (as determined by VITEK2 system (BioMerieux).) Patients with recurrent UTIs are indicated by filled in black square. MG1655, EC958, UTI89 and CFT073 are included for reference.
Figure 1—figure supplement 3
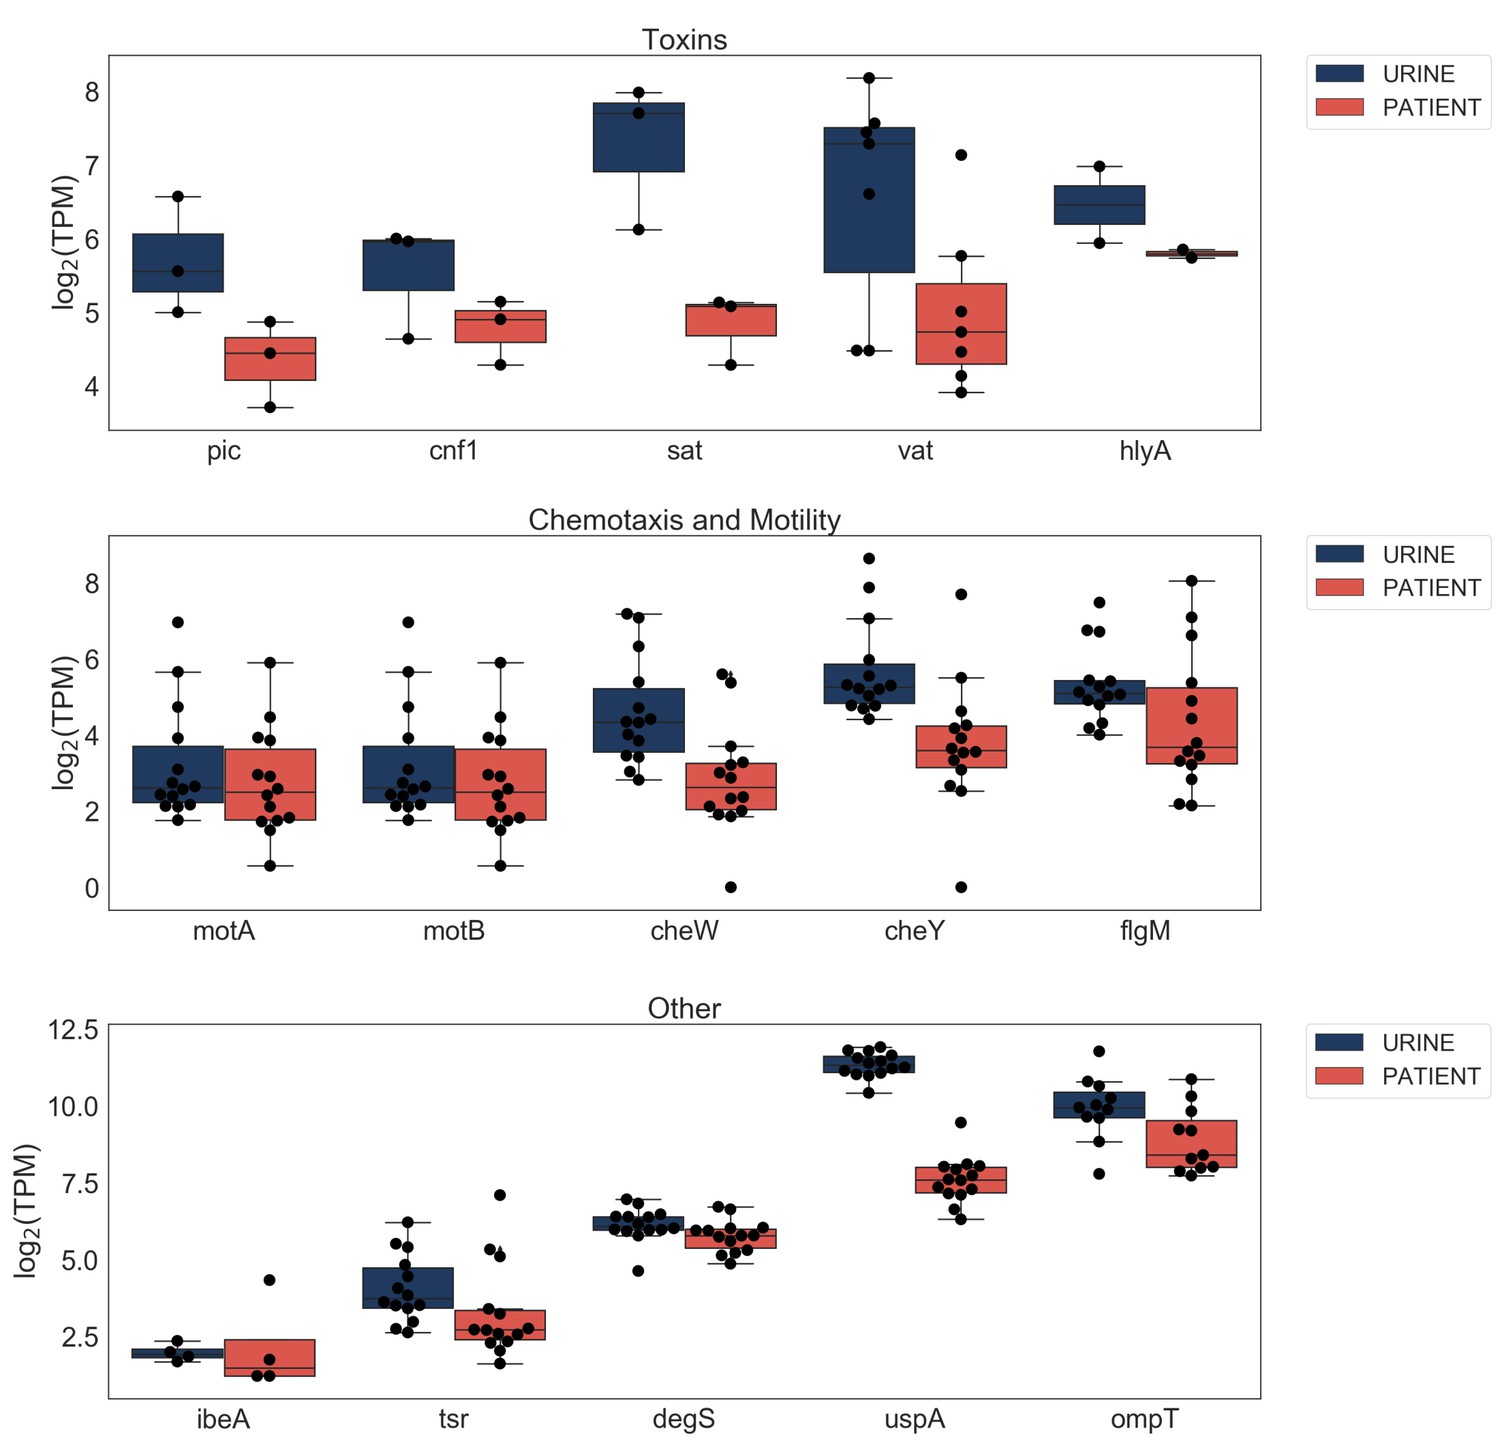
Expression of virulence factor genes in urine and patient samples.
https://doi.org/10.7554/eLife.49748.007
Figure 1—figure supplement 4
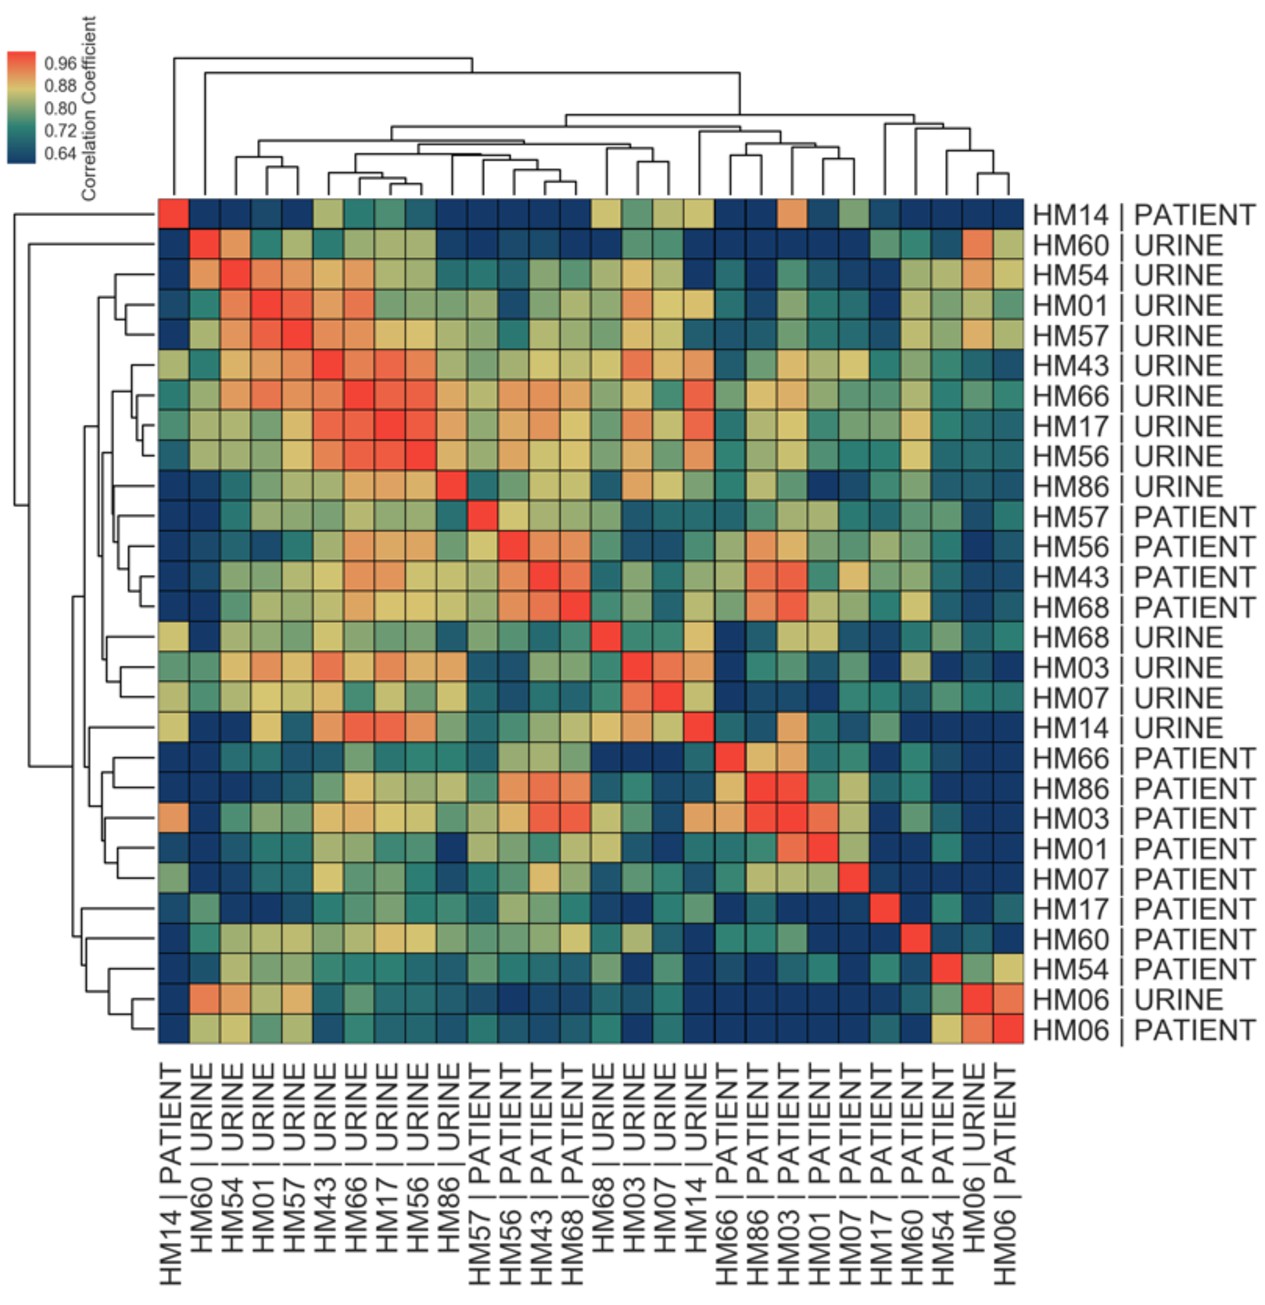
Correlations among in vitro and patient samples measured by Pearson correlation coefficient of normalized gene expression of 40 virulence factors plotted according to hierarchical clustering of samples.
https://doi.org/10.7554/eLife.49748.008
Figure 1—figure supplement 5
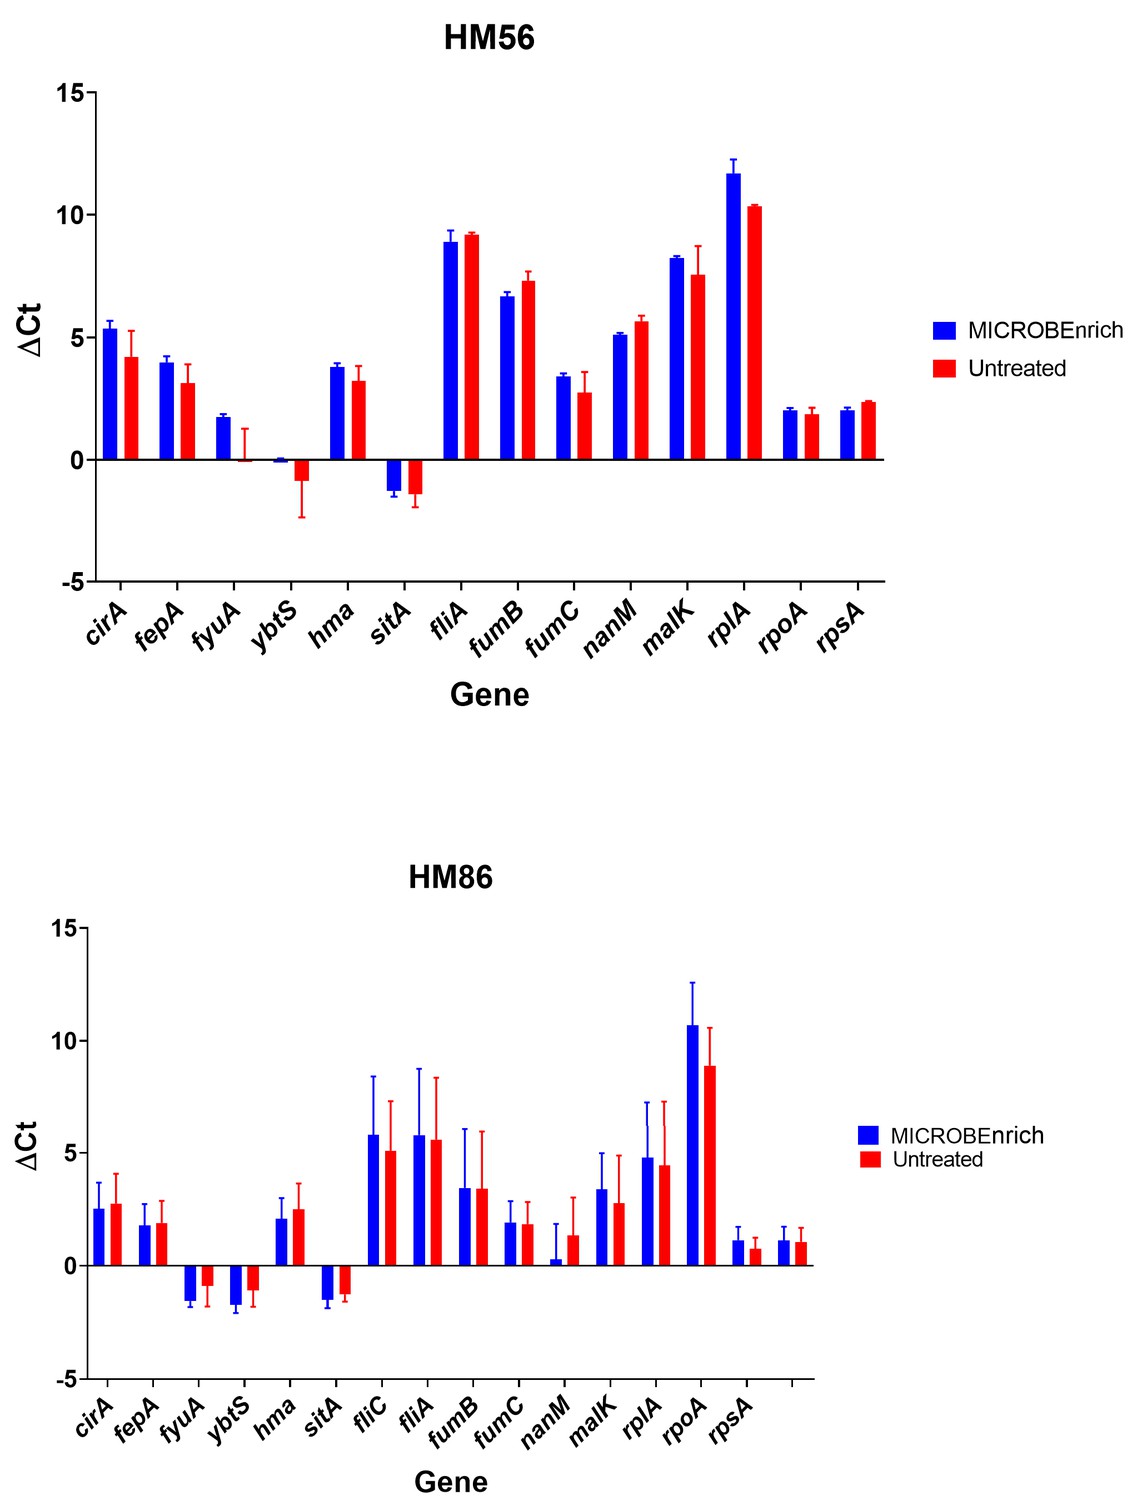
Treatment with MICROBEnrich does not affect measures of gene expression.
Gene expression of a panel of genes was measured for HM86 (n = 3), and HM56 (n = 2) after 5 hr culture in filter-sterilized urine. After isolation RNA samples were either treated with MICROBEnrich or left untreated. Gene expression for each gene was measured by qRT-PCR. ΔCt between the gene of interest and gapA is shown.
Figure 2 with 3 supplements

Core genome expression in patients is highly correlated.
The analysis details are described in Materials and methods, and figure supplements. (A)-(B) Histogram of Pearson correlation coefficients among all samples cultured in vitro (A) or isolated from patients (B) based either on core genome or accessory genome comparisons. Accessory genome includes genes that were found in at least two but fewer than 14 of the clinical isolates. (C) Correlations among in vitro and patient samples measured by Pearson correlation coefficient of normalized gene expression plotted according to hierarchical clustering of samples. (D) Pearson correlation coefficient among all samples cultured in vitro (URINE | URINE, median = 0.92), among all samples isolated from patients (PATIENT | PATIENT, median = 0.91), between samples cultured in urine and samples isolated from patients (URINE | PATIENT, median = 0.73), and between matching urine/patient samples (ex. HM14 | URINE vs HM14 | PATIENT), (URINE | PATIENT:matched, median = 0.74). (E) Principal component analysis of normalized gene expression of 14 clinical isolates in patients and in vitro urine cultures shows distinct clustering of in vitro and patient isolates.
-
Figure 2—source data 1
Genes differentially expressed between B1 and B2 phylogroup strains during in vitroculture in urine.
- https://doi.org/10.7554/eLife.49748.014
-
Figure 2—source data 2
Genes differentially expressed between B1 and B2 phylogroup strains during human UTI.
- https://doi.org/10.7554/eLife.49748.015
Figure 2—figure supplement 1

Saturation curves.
Number of mapped reads was plotted against number of expressed genes detected for each sample (in vitro samples are shown in blue; patient samples are shown in red). Vertical line shows 3 million reads cut off at which samples appear to reach saturation.
Figure 2—figure supplement 2
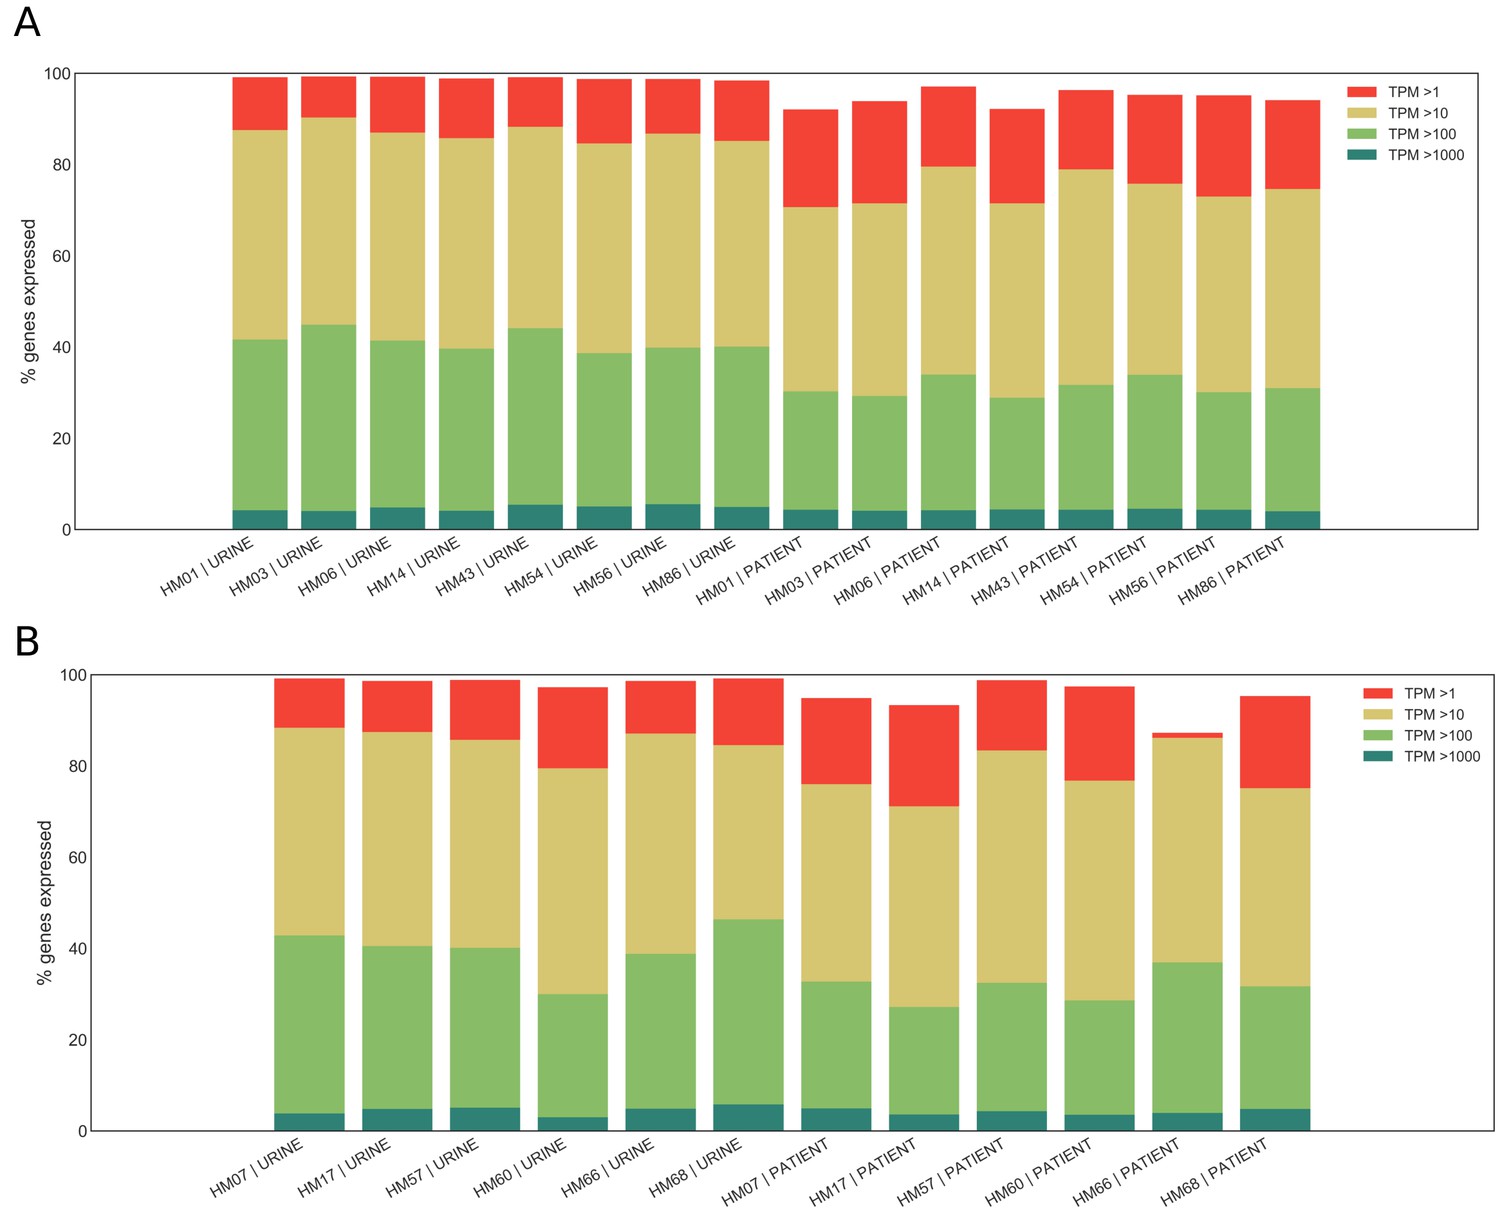
Expression ranges of core genome genes.
(A) Percentage of genes in the core genome that are expressed at a given level (>1 TPM,>10 TPMs,>100 TPMs,>1000 TPMs, where TPMs are transcripts per million) is shown for patient samples that reached saturation (see Supplementary Figure 2) and corresponding in vitro samples. (B) Percentage of genes in the core genome that are expressed at a given level (>1 TPM,>10 TPMs,>100 TPMs,>1000 TPMs) is shown for patient samples that did not reach saturation and corresponding in vitro samples.
Figure 2—figure supplement 3

Effect of phylogenetic group on core genome expression.
(A) and (C) Clustering of UPEC strains cultured in filter-sterilized urine based on PCA analysis of core genome gene expression. (B) and (D) Clustering of UPEC isolated from patients based on PCA analysis of core genome gene expression. Samples in (A) and (B) are colored based on their phylogroup designation. Samples in (C) and (D) are colored based on whether the strain was isolated from a patient with recurrent UTI (Y) or without recurrent UTI (N).
Figure 3 with 1 supplement

Patient-associated transcriptional signature is consistent with rapid bacterial growth.
(A) The DESeq2 R package was used to compare in vitro urine cultures gene expression to that in patients. Each UPEC strain was considered an independent replicate (n = 14). Genes were considered up-regulated (down-regulated) if log2 fold change in expression was higher (lower) than 2 (vertical lines), and P value < 0.05 (horizontal line). Using these cutoffs, we identified 149 upregulated genes, and 343 downregulated genes. GO/pathway analysis showed that a large proportion of these genes belonged to one of the four functional categories (see legend). For each category, only the genes that have met the significance cut off are shown. The sugar transporters upregulated in UTI patients are shown in figure supplement. (B) Mean normalized expression for genes belonging to differentially expressed functional categories/pathways. The number of up or down-regulated genes belonging to each category is indicated next to the category name.
-
Figure 3—source data 1
Genes upregulated during human UTI.
- https://doi.org/10.7554/eLife.49748.021
-
Figure 3—source data 2
Genes downregulated during human UTI.
- https://doi.org/10.7554/eLife.49748.022
Figure 3—figure supplement 1

Gene expression of four sugar transporters upregulated in UTI patients.
Heatmap shows Log2 of normalized gene expression of ptsG, fruA, fruB and gntU for each in vitro and patient sample.
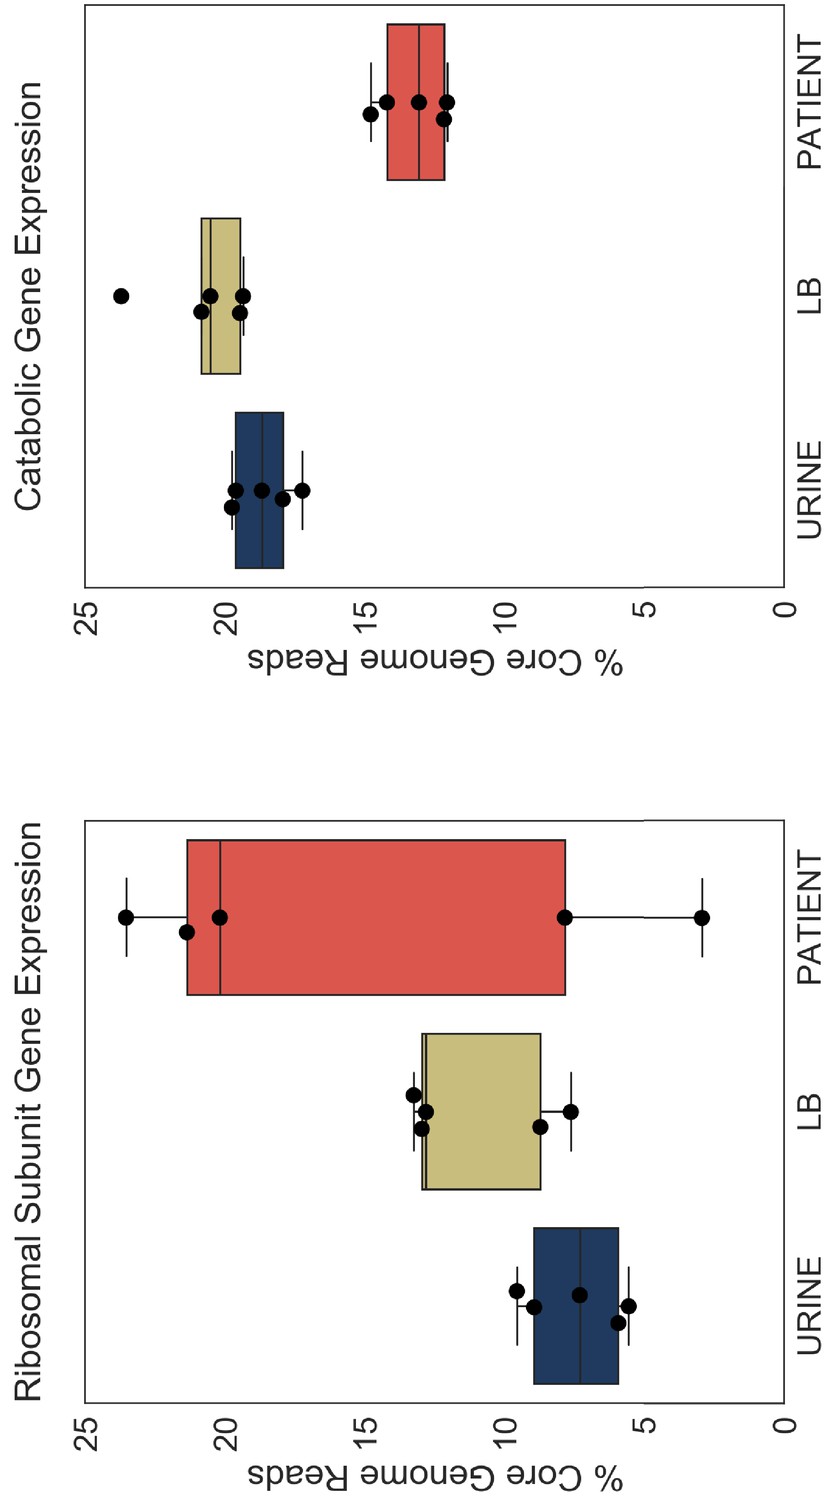
Figure 4 with 1 supplement
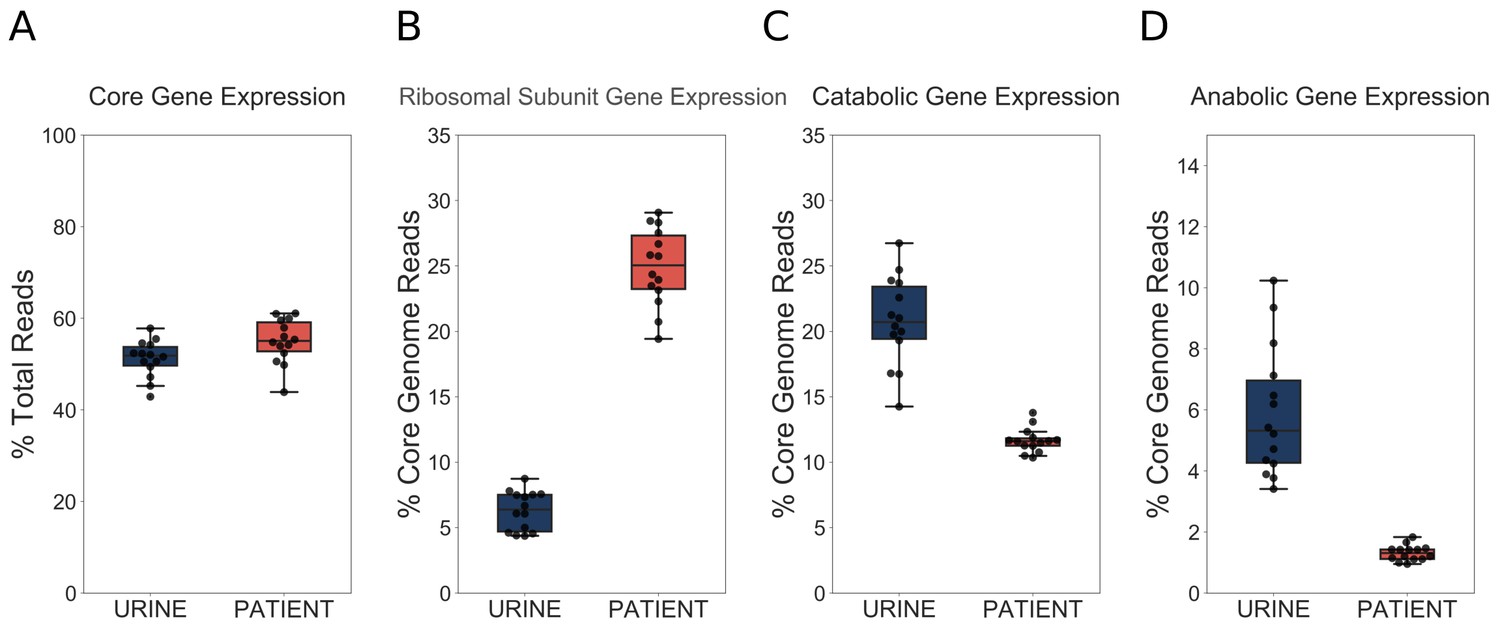
UPEC optimize growth potential via resource reallocation during UTI.
(A) Percentage of reads that aligned to the core genome (2653 genes) out of total mapped reads. (B) Percentage of core genome reads that mapped to r-proteins (ribosomal subunit proteins, 48 genes). (C) Percentage of core genome reads that mapped to catabolic genes (defined as genes regulated by Crp and present in the core genome (277 genes). (D) Percentage of core genome reads that mapped to amino acid biosynthesis genes (54 genes). The equivalent analysis of Subashchandrabose et al. (2014) dataset is shown in the figure supplement.
Figure 4—figure supplement 1
Resource reallocation analysis of Subashchandrabose et al. (2014) dataset.
Left panel. Percentage of core genome reads that mapped to r-proteins (ribosomal subunit proteins, 48 genes) in five clinical strains from Subashchandrabose et al. study. The outlier patient sample that has only 2% of core genome mapped to r-proteins could potentially be attributed to very low depth of sequencing for that sample (HM26, see Table 6). Right panel. Percentage of core genome reads that mapped to catabolic genes. URINE: in vitro culture in filter-sterilized urine, LB: in vitro culture in LB, PATIENT: human UTI.
Figure 5
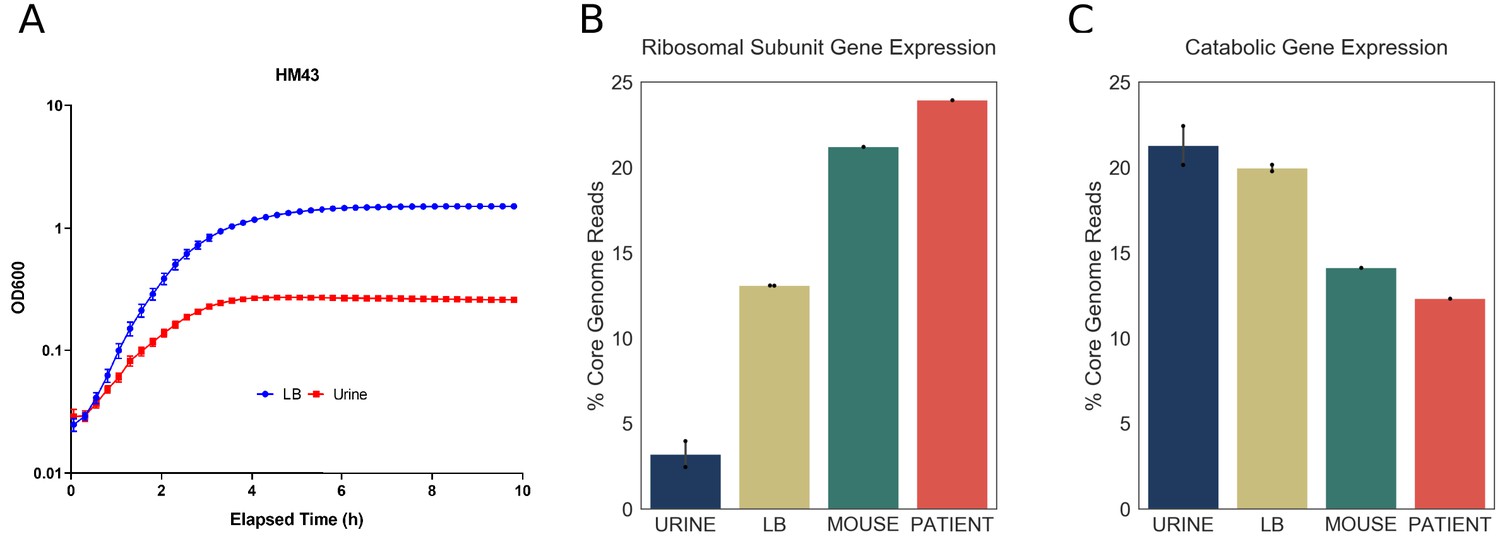
Increased expression of ribosomal subunit transcripts is a host specific response.
(A) Growth curve for HM43 strain cultured in LB and filter-sterilized urine. (B) Percentage of HM43 core genome reads that mapped to ribosomal subunit proteins under different conditions (URINE: in vitro culture in filter-sterilized urine, LB: in vitro culture in LB, MOUSE: mice with UTI, PATIENT: human UTI. (C) Percentage of HM43 core genome reads that mapped to catabolic genes under different conditions.
Figure 6
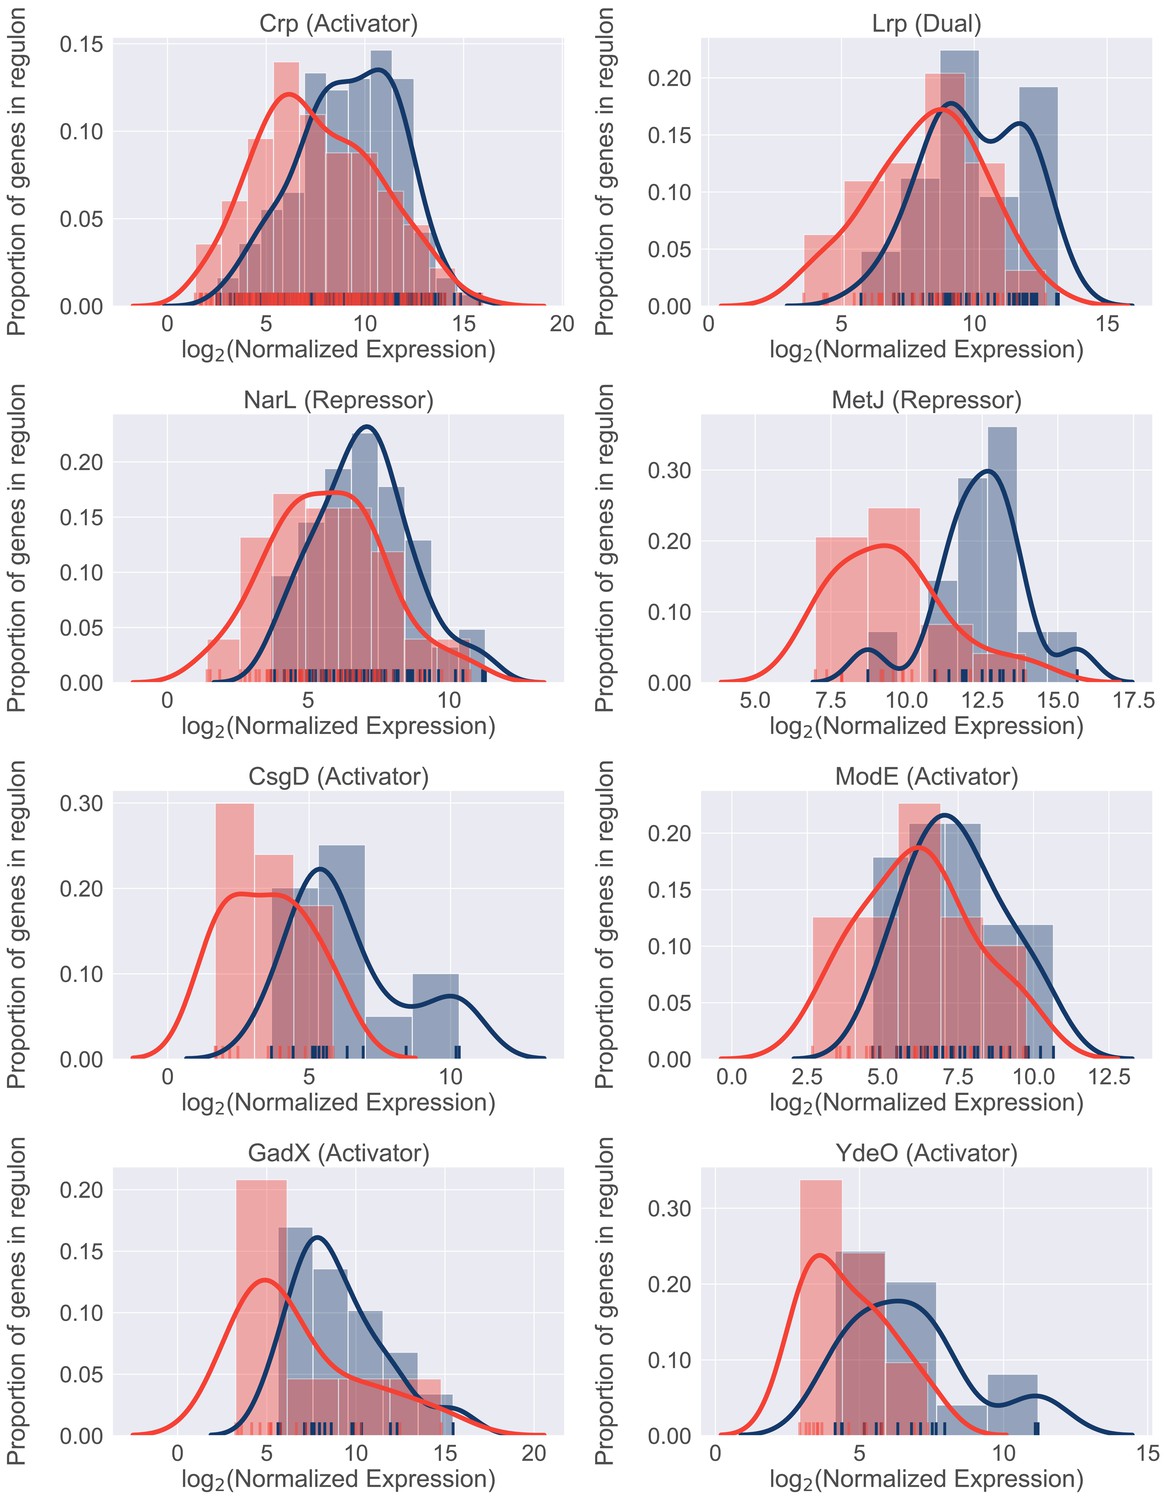
Differential regulon expression suggests role for multiple regulators in resource reallocation.
Regulon expression for 8 out of 22 regulons enriched for genes downregulated in the patients. Expression of each gene in the regulon during in vitro culture (blue) or during UTI (red) is shown along the x-axis. Histograms show proportion of genes in the regulon expressed at any given level.
Tables
Table 1
Sequence type for 14 clinical UPEC isolates
https://doi.org/10.7554/eLife.49748.002| Strain | Sequence type | Adk | fumC | gyrB | Icd | Mdh | purA | recA |
|---|---|---|---|---|---|---|---|---|
| HM01 | 69 | 21 | 35 | 27 | 6 | 5 | 5 | 4 |
| HM03 | 101 | 43 | 41 | 15 | 18 | 11 | 7 | 6 |
| HM06 | 131 | 53 | 40 | 47 | 13 | 36 | 28 | 29 |
| HM07 | 641* | 9 | 6 | 33* | 131 | 24 | 8 | 7 |
| HM14 | Novel | 6 | 4 | 4 | 16 | 24 | 13 | 14 |
| HM17 | 73 | 36 | 24 | 9 | 13 | 17 | 11 | 25 |
| HM43 | Novel* | 40* | 14 | 19 | 36 | 17 | 10 | 203 |
| HM54 | 404* | 14* | 14 | 10 | 14 | 17 | 7 | 74 |
| HM56 | 538 | 13 | 40 | 19 | 13 | 36 | 28 | 30 |
| HM57 | 73 | 36 | 24 | 9 | 13 | 17 | 11 | 25 |
| HM60 | 648 | 92 | 4 | 87 | 96 | 70 | 58 | 2 |
| HM66 | 80 | 13 | 24 | 19 | 14 | 23 | 1 | 10 |
| HM68 | 998 | 13 | 52 | 156 | 14 | 17 | 25 | 17 |
| HM86 | 127 | 13 | 14 | 19 | 36 | 23 | 11 | 10 |
Table 2
In silico determined serotypes for 14 clinical UPEC strains
https://doi.org/10.7554/eLife.49748.003| Strain | H_type | O_type |
|---|---|---|
| HM01 | H4 | O25 |
| HM03 | H21 | NA |
| HM06 | H4 | O25 |
| HM07 | H45 | O45 |
| HM14 | H10 | O8 |
| HM17 | H1 | O6 |
| HM43 | H23 | NA |
| HM54 | H5 | O75 |
| HM56 | H4 | O13/O135 |
| HM57 | H1 | O2/O50 |
| HM60 | H10 | O102 |
| HM66 | H7 | O7 |
| HM68 | H6 | O2/O50 |
| HM86 | H31 | O6 |
Table 3
Summary of alignment statistics (% mapped).
https://doi.org/10.7554/eLife.49748.016| Sample: | Total reads | Mapped reads | % Mapped | % Mapped to CDS | % Mapped to misc_RNA | % Mapped to rRNA | % Mapped to tRNA | % Mapped to sRNA | % Mapped to tmRNA |
|---|---|---|---|---|---|---|---|---|---|
| HM01 | UR | 17288419 | 16480326 | 95.3 | 74.91 | 5.51 | 0.01 | 0.26 | 10.2 | 5.49 |
| HM01 | UTI | 18496607 | 3717040 | 20.1 | 80.44 | 3.36 | 0 | 0.51 | 3.42 | 2.45 |
| HM03 | UR | 21354719 | 20927541 | 98 | 77.77 | 4.78 | 0 | 0.36 | 9.49 | 5.21 |
| HM03 | UTI | 16544044 | 8059076 | 48.7 | 80.18 | 2.45 | 0 | 0.86 | 2.23 | 1.35 |
| HM06 | UR | 23359847 | 22847374 | 97.8 | 78.72 | 3.96 | 0 | 0.33 | 6.3 | 3.23 |
| HM06 | UTI | 57993519 | 4709092 | 8.1 | 76.94 | 2.62 | 0 | 0.36 | 1.55 | 0.87 |
| HM07 | UR | 21312224 | 20980473 | 98.4 | 75.2 | 6.02 | 0 | 0.19 | 10.32 | 4.79 |
| HM07 | UTI | 70804688 | 2097350 | 3 | 73.71 | 4.14 | 0 | 0.6 | 2.08 | 0.77 |
| HM14 | UR | 21927302 | 21533817 | 98.2 | 76.13 | 5.33 | 0 | 0.15 | 9.97 | 5.16 |
| HM14 | UTI | 15944762 | 12968218 | 81.3 | 80.51 | 2.21 | 0 | 0.46 | 2.25 | 1.5 |
| HM17 | UR | 19790215 | 19360294 | 97.8 | 77.41 | 4.29 | 0 | 0.13 | 7.02 | 3.32 |
| HM17 | UTI | 23874585 | 1842583 | 7.7 | 74.35 | 4.14 | 0 | 0.73 | 2.73 | 1.6 |
| HM43 | UR | 18541484 | 18239826 | 98.4 | 76.54 | 5.03 | 0 | 0.21 | 9.07 | 4.76 |
| HM43 | UTI | 58306859 | 8138559 | 14 | 80.38 | 2.76 | 0 | 0.37 | 3.95 | 2.38 |
| HM54 | UR | 21612581 | 21162544 | 97.9 | 74.96 | 4.13 | 0.01 | 0.12 | 7.17 | 4.06 |
| HM54 | UTI | 18000843 | 6301998 | 35 | 77.33 | 3.05 | 0.01 | 0.52 | 1.54 | 0.98 |
| HM56 | UR | 17494135 | 17130847 | 97.9 | 77.93 | 4.09 | 0 | 0.09 | 7.14 | 3.56 |
| HM56 | UTI | 25408755 | 14935948 | 58.8 | 79.41 | 2.59 | 0 | 0.58 | 1.98 | 1.17 |
| HM57 | UR | 19253078 | 18966748 | 98.5 | 77.07 | 4.85 | 0 | 0.08 | 8.26 | 3.86 |
| HM57 | UTI | 105629816 | 926795 | 0.9 | 71.48 | 4.2 | 0 | 0.65 | 2.63 | 1.5 |
| HM60 | UR | 15898045 | 15651916 | 98.5 | 76.35 | 4.14 | 0 | 0.09 | 7.47 | 4.05 |
| HM60 | UTI | 76149837 | 764255 | 1 | 70.69 | 3.76 | 0 | 0.7 | 1.84 | 1.04 |
| HM66 | UR | 17184018 | 16736066 | 97.4 | 74.15 | 4.93 | 0 | 0.12 | 9.53 | 5.28 |
| HM66 | UTI | 25954183 | 79859 | 0.3 | 65.41 | 2.71 | 0 | 0.46 | 1.42 | 0.67 |
| HM68 | UR | 15841639 | 15562711 | 98.2 | 78.31 | 2.84 | 0 | 0.14 | 6.03 | 3.67 |
| HM68 | UTI | 65413931 | 2401089 | 3.7 | 73.11 | 4.8 | 0 | 0.83 | 4.58 | 2.73 |
| HM86 | UR | 15019669 | 14606346 | 97.2 | 76.06 | 4.09 | 0 | 0.16 | 6.99 | 3.54 |
| HM86 | UTI | 10667404 | 6413794 | 60.1 | 78.33 | 2.8 | 0 | 0.77 | 3.08 | 1.62 |
Table 4
Summary of alignment statistics (raw counts).
https://doi.org/10.7554/eLife.49748.017| Sample: | CDS | misc_RNA | rRNA | tRNA | sRNA | tmRNA |
|---|---|---|---|---|---|---|
| HM01 | UR | 12345933 | 907900 | 1504 | 43435 | 1680592 | 905367 |
| HM01 | UTI | 2989889 | 124744 | 143 | 19133 | 126985 | 91056 |
| HM03 | UR | 16274560 | 999727 | 44 | 76181 | 1985885 | 1090263 |
| HM03 | UTI | 6461781 | 197433 | 24 | 69006 | 179905 | 109081 |
| HM06 | UR | 17985174 | 904287 | 43 | 76160 | 1439268 | 738927 |
| HM06 | UTI | 3623181 | 123428 | 23 | 17015 | 72873 | 40864 |
| HM07 | UR | 15776986 | 1262236 | 177 | 39363 | 2165537 | 1005391 |
| HM07 | UTI | 1546060 | 86761 | 30 | 12681 | 43708 | 16065 |
| HM14 | UR | 16393471 | 1148443 | 86 | 32625 | 2146180 | 1110769 |
| HM14 | UTI | 10441062 | 286490 | 50 | 59823 | 291189 | 194198 |
| HM17 | UR | 14986237 | 830647 | 48 | 24865 | 1358261 | 642452 |
| HM17 | UTI | 1370047 | 76227 | 15 | 13494 | 50273 | 29443 |
| HM43 | UR | 13960276 | 916836 | 21 | 37450 | 1653607 | 867656 |
| HM43 | UTI | 6541810 | 225003 | 29 | 30200 | 321597 | 194030 |
| HM54 | UR | 15863933 | 873414 | 1662 | 25326 | 1517844 | 858505 |
| HM54 | UTI | 4873058 | 192289 | 353 | 32932 | 97321 | 61939 |
| HM56 | UR | 13349576 | 701313 | 78 | 15697 | 1222601 | 609922 |
| HM56 | UTI | 11860835 | 386845 | 52 | 86723 | 295607 | 175048 |
| HM57 | UR | 14617905 | 919256 | 157 | 15069 | 1567276 | 732845 |
| HM57 | UTI | 662515 | 38910 | 13 | 6057 | 24340 | 13929 |
| HM60 | UR | 11949731 | 647306 | 62 | 13601 | 1169464 | 633959 |
| HM60 | UTI | 540215 | 28718 | 11 | 5361 | 14062 | 7958 |
| HM66 | UR | 12409693 | 825583 | 51 | 19323 | 1595303 | 884439 |
| HM66 | UTI | 52232 | 2161 | 0 | 366 | 1137 | 534 |
| HM68 | UR | 12187024 | 442312 | 22 | 22226 | 938831 | 571220 |
| HM68 | UTI | 1755457 | 115276 | 16 | 19970 | 110052 | 65627 |
| HM86 | UR | 11110009 | 597368 | 551 | 23424 | 1021292 | 517105 |
| HM86 | UTI | 5023803 | 179823 | 46 | 49276 | 197828 | 103919 |
Table 5
GO modules differentially expressed in UTI patients.
https://doi.org/10.7554/eLife.49748.018| Go id | Annotated | Significant | Expected | P value | Term |
|---|---|---|---|---|---|
| GO:0006518 | 89 | 24 | 16.63 | 0.03134 | peptide metabolic process |
| GO:0016052 | 76 | 36 | 14.2 | 0.00403 | carbohydrate catabolic process |
| GO:0044262 | 75 | 29 | 14.01 | 0.0022 | cellular carbohydrate metabolic process |
| GO:0015980 | 70 | 20 | 13.08 | 0.02632 | energy derivation by oxidation of organic compounds |
| GO:0043043 | 69 | 19 | 12.89 | 0.04306 | peptide biosynthetic process |
| GO:0046395 | 65 | 25 | 12.14 | 0.00556 | carboxylic acid catabolic process |
| GO:0006412 | 63 | 18 | 11.77 | 0.03421 | translation |
| GO:0008643 | 55 | 30 | 10.28 | 0.02488 | carbohydrate transport |
| GO:1903825 | 39 | 12 | 7.29 | 0.04583 | organic acid transmembrane transport |
| GO:0008033 | 38 | 13 | 7.1 | 0.0159 | tRNA processing |
| GO:1905039 | 38 | 12 | 7.1 | 0.03786 | carboxylic acid transmembrane transport |
| GO:0046365 | 38 | 21 | 7.1 | 0.04177 | monosaccharide catabolic process |
| GO:0034219 | 37 | 20 | 6.91 | 0.0005 | carbohydrate transmembrane transport |
| GO:0042710 | 35 | 11 | 6.54 | 0.04746 | biofilm formation |
| GO:0044010 | 34 | 11 | 6.35 | 0.03879 | single-species biofilm formation |
| GO:0006400 | 34 | 11 | 6.35 | 0.03879 | tRNA modification |
| GO:0072329 | 32 | 15 | 5.98 | 0.02795 | monocarboxylic acid catabolic process |
| GO:0009401 | 30 | 11 | 5.6 | 0.01501 | phosphoenolpyruvate-dependent sugar phosphotransferase system |
| GO:0010608 | 29 | 10 | 5.42 | 0.03121 | posttranscriptional regulation of gene expression |
| GO:0034248 | 26 | 9 | 4.86 | 0.03925 | regulation of cellular amide metabolic process |
| GO:0006417 | 26 | 9 | 4.86 | 0.03925 | regulation of translation |
| GO:0015749 | 24 | 13 | 4.48 | 0.03338 | monosaccharide transmembrane transport |
| GO:0051248 | 23 | 9 | 4.3 | 0.01728 | negative regulation of protein metabolic process |
| GO:0044275 | 22 | 11 | 4.11 | 0.04263 | cellular carbohydrate catabolic process |
| GO:0032269 | 22 | 8 | 4.11 | 0.03829 | negative regulation of cellular protein metabolic process |
| GO:0015807 | 19 | 7 | 3.55 | 0.04819 | L-amino acid transport |
| GO:0017148 | 18 | 8 | 3.36 | 0.01044 | negative regulation of translation |
| GO:0034249 | 18 | 8 | 3.36 | 0.01044 | negative regulation of cellular amide metabolic process |
| GO:1902475 | 17 | 7 | 3.18 | 0.02607 | L-alpha-amino acid transmembrane transport |
| GO:0009409 | 14 | 8 | 2.62 | 0.00144 | response to cold |
| GO:0042255 | 14 | 9 | 2.62 | 0.00021 | ribosome assembly |
| GO:0019321 | 14 | 8 | 2.62 | 0.03705 | pentose metabolic process |
| GO:0046835 | 13 | 6 | 2.43 | 0.02143 | carbohydrate phosphorylation |
| GO:0006526 | 12 | 8 | 2.24 | 0.00034 | arginine biosynthetic process |
| GO:0042542 | 10 | 5 | 1.87 | 0.02449 | response to hydrogen peroxide |
| GO:0019323 | 10 | 7 | 1.87 | 0.02539 | pentose catabolic process |
Table 6
Summary of alignment statistics (% mapped) for Subashchandrabose et al. (2014).
https://doi.org/10.7554/eLife.49748.025| Sample: | Total | Mapped reads | % Mapped | Mapped to CDS | Mapped to misc_RNA | Mapped to rRNA | Mapped to tRNA | Mapped to tmRNA |
|---|---|---|---|---|---|---|---|---|
| HM46 | UR | 84195438 | 81447525 | 96.74 | 2.41 | 0.05 | 60.55 | 0.01 | 0.01 |
| HM26 | UTI | 20253252 | 1000968 | 4.94 | 16.75 | 0.24 | 21.24 | 0.09 | 0.16 |
| HM46 | UTI | 63338418 | 10783798 | 17.03 | 6.93 | 0.12 | 40.3 | 0.1 | 0.1 |
| HM27 | LB | 67422498 | 65065615 | 96.5 | 2.25 | 0.04 | 55.6 | 0.02 | 0.01 |
| HM27 | UTI | 67258748 | 18308171 | 27.22 | 9.25 | 0.13 | 45.49 | 0.08 | 0.2 |
| HM26 | UR | 62242978 | 59994538 | 96.39 | 2.31 | 0.08 | 60.58 | 0.01 | 0.01 |
| HM65 | LB | 73451346 | 71221338 | 96.96 | 2.53 | 0 | 51.41 | 0.01 | 0 |
| HM69 | LB | 137690758 | 133649727 | 97.07 | 3.49 | 0.05 | 67.26 | 0.01 | 0.01 |
| HM69 | UTI | 72509214 | 38506559 | 53.11 | 6.52 | 0.13 | 42.09 | 0.04 | 0.21 |
| HM46 | LB | 78018026 | 75590297 | 96.89 | 2.78 | 0.06 | 56.9 | 0.01 | 0.01 |
| HM27 | UR | 98185180 | 94683534 | 96.43 | 2.82 | 0.03 | 61 | 0.01 | 0.01 |
| HM26 | LB | 70919896 | 68671798 | 96.83 | 2.02 | 0.06 | 55.74 | 0.02 | 0.01 |
| HM65 | UR | 76024008 | 73555939 | 96.75 | 2.49 | 0 | 55.04 | 0.01 | 0 |
| HM65 | UTI | 73446576 | 59696718 | 81.28 | 6.19 | 0 | 40.3 | 0.04 | 0 |
| HM69 | UR | 67112750 | 64834311 | 96.61 | 2.45 | 0.04 | 52.92 | 0.01 | 0.01 |
Table 7
Summary of alignment statistics (% mapped) for Subashchandrabose et al. (2014).
https://doi.org/10.7554/eLife.49748.026| Sample | CDS | misc_RNA | rRNA | tRNA | tmRNA |
|---|---|---|---|---|---|
| HM46 | UR | 1960841 | 36901 | 49312604 | 7302 | 5604 |
| HM26 | UTI | 167663 | 2366 | 212641 | 949 | 1605 |
| HM46 | UTI | 747702 | 12948 | 4345881 | 10289 | 11281 |
| HM27 | LB | 1463627 | 26081 | 36173268 | 11717 | 5088 |
| HM27 | UTI | 1693448 | 24245 | 8329004 | 14427 | 36287 |
| HM26 | UR | 1387110 | 48847 | 36345620 | 6532 | 5837 |
| HM65 | LB | 1801858 | 0 | 36612190 | 7263 | 1 |
| HM69 | LB | 4664579 | 71881 | 89896218 | 13828 | 7949 |
| HM69 | UTI | 2511733 | 51962 | 16206680 | 17070 | 81355 |
| HM46 | LB | 2099493 | 42356 | 43011663 | 11135 | 8549 |
| HM27 | UR | 2673283 | 31185 | 57757240 | 10152 | 8399 |
| HM26 | LB | 1385766 | 38971 | 38278745 | 11081 | 5724 |
| HM65 | UR | 1828039 | 0 | 40486611 | 5675 | 1 |
| HM65 | UTI | 3697360 | 0 | 24059705 | 24055 | 2 |
| HM69 | UR | 1587484 | 26322 | 34308170 | 4737 | 7686 |
Table 8
Summary of alignment statistics (% mapped) for mouse UTI study.
https://doi.org/10.7554/eLife.49748.028| Sample | Total reads | Mapped reads | % Mapped | Mapped to CDS | Mapped to misc_RNA | Mapped to rRNA | Mapped to tRNA | Mapped to sRNA | Mapped to tmRNA |
|---|---|---|---|---|---|---|---|---|---|
| HM43 | LB | rep1 | 63966646 | 62813946 | 98.2 | 73.01 | 5.49 | 0 | 0.2 | 11.03 | 6.41 |
| HM43 | LB | rep2 | 37833957 | 37090863 | 98.04 | 71.59 | 5.91 | 0 | 0.2 | 11.63 | 6.69 |
| HM43 | UR | rep1 | 43179946 | 42293006 | 97.95 | 63 | 8.9 | 0 | 0.06 | 19.96 | 11.94 |
| HM43 | UR | rep2 | 44176952 | 43093840 | 97.55 | 53.64 | 10.94 | 0.01 | 0.03 | 27.8 | 17.9 |
| HM43 | mouse | 44314537 | 3690174 | 8.33 | 76.72 | 2.75 | 0 | 0.24 | 6.11 | 4 |
Table 9
Summary of alignment statistics (% mapped) for mouse UTI study.
https://doi.org/10.7554/eLife.49748.029| Sample | CDS | misc_RNA | rRNA | tRNA | sRNA | tmRNA |
|---|---|---|---|---|---|---|
| HM43 | LB | rep1 | 45862961 | 3449232 | 327 | 123950 | 6929261 | 4028787 |
| HM43 | LB | rep2 | 26554546 | 2192539 | 204 | 74396 | 4312075 | 2482416 |
| HM43 | UR | rep1 | 26644071 | 3765281 | 218 | 26488 | 8439668 | 5049595 |
| HM43 | UR | rep2 | 23115456 | 4714597 | 2962 | 14049 | 11979913 | 7714978 |
| HM43 | mouse | 2831120 | 101419 | 55 | 8994 | 225533 | 147467 |
Table 10
GSEA results.
Gene sets found to be enriched in differentially expressed genes. For example, Lrp, Repressor indicates gene set repressed by Lrp (data obtained from RegulonDB 9.4). Expression indicates whether regulon expression was higher in patients of during in vitro culture in urine. Regulon size: number of genes in the gene set; Matched size: number of genes found in data set; NES: normalized enrichment score; FDR: false discovery rate.
| Function | Expression (higher in) | Regulon size | Matched size | NES | FDR | |
|---|---|---|---|---|---|---|
| Lrp | Repressor | Urine | 85 | 27 | 2.29079978 | 0 |
| NarL | Repressor | Urine | 87 | 65 | 2.24435801 | 0 |
| Lrp | Activator | Urine | 38 | 19 | 2.21269565 | 0 |
| MetJ | Repressor | Urine | 15 | 14 | 2.12885223 | 0.00083422 |
| Crp | Activator | Urine | 425 | 277 | 2.12150402 | 0.00066738 |
| CsgD | Activator | Urine | 13 | 12 | 2.01197693 | 0.00250267 |
| GadX | Activator | Urine | 23 | 15 | 1.89350304 | 0.00929563 |
| ModE | Activator | Urine | 31 | 28 | 1.87289606 | 0.0108449 |
| YdeO | Activator | Urine | 18 | 14 | 1.81975146 | 0.02002136 |
| Fur | Repressor | Urine | 110 | 66 | 1.76658693 | 0.02752936 |
| PhoP | Activator | Urine | 45 | 33 | 1.7607379 | 0.0256334 |
| RcsB | Activator | Urine | 58 | 28 | 1.70667558 | 0.03781812 |
| Hns | Repressor | Urine | 144 | 62 | 1.69880665 | 0.03657748 |
| GadE | Activator | Urine | 70 | 38 | 1.69400478 | 0.03515655 |
| RcsA | Activator | Urine | 42 | 24 | 1.68615633 | 0.03448122 |
| NarP | Activator | Urine | 32 | 29 | 1.65675898 | 0.04045982 |
| NarP | Repressor | Urine | 33 | 26 | 1.6406359 | 0.04279074 |
| FhlA | Activator | Urine | 30 | 15 | 1.62536048 | 0.04514074 |
| FliZ | Repressor | Urine | 20 | 15 | 1.60948953 | 0.04750681 |
| LexA | Repressor | Patients | 59 | 43 | −1.696072 | 0.03586007 |
| Cra | Repressor | Patients | 59 | 50 | −1.7121855 | 0.04267527 |
| PurR | Repressor | Patients | 31 | 31 | −1.752299 | 0.04410253 |
| FadR | Activator | Patients | 12 | 11 | −1.9871524 | 0.00342544 |
Key resources table
| Reagent type (species) or resource | Designation | Source or reference | Identifiers | Additional information |
|---|---|---|---|---|
| Strain, strain background (Escherichia coli) | Uropathogenic Escherichia coli HM01 | This study | Strain isolation described in Study Design section below | |
| Strain, strain background (Escherichia coli) | Uropathogenic Escherichia coli HM03 | This study | Strain isolation described in Study Design section below | |
| Strain, strain background (Escherichia coli) | Uropathogenic Escherichia coli HM06 | This study | Strain isolation described in Study Design section below | |
| Strain, strain background (Escherichia coli) | Uropathogenic Escherichia coli HM07 | This study | Strain isolation described in Study Design section below | |
| Strain, strain background (Escherichia coli) | Uropathogenic Escherichia coli HM14 | This study | Strain isolation described in Study Design section below | |
| Strain, strain background (Escherichia coli) | Uropathogenic Escherichia coli HM17 | This study | Strain isolation described in Study Design section below | |
| Strain, strain background (Escherichia coli) | Uropathogenic Escherichia coli HM43 | This study | Strain isolation described in Study Design section below | |
| Strain, strain background (Escherichia coli) | Uropathogenic Escherichia coli HM54 | This study | Strain isolation described in Study Design section below | |
| Strain, strain background (Escherichia coli) | Uropathogenic Escherichia coli HM56 | This study | Strain isolation described in Study Design section below | |
| Strain, strain background (Escherichia coli) | Uropathogenic Escherichia coli HM57 | This study | Strain isolation described in Study Design section below | |
| Strain, strain background (Escherichia coli) | Uropathogenic Escherichia coli HM60 | This study | Strain isolation described in Study Design section below | |
| Strain, strain background (Escherichia coli) | Uropathogenic Escherichia coli HM66 | This study | Strain isolation described in Study Design section below | |
| Strain, strain background (Escherichia coli) | Uropathogenic Escherichia coli HM68 | This study | Strain isolation described in Study Design section below | |
| Strain, strain background (Escherichia coli) | Uropathogenic Escherichia coli HM86 | This study | Strain isolation described in Study Design section below | |
| Strain, strain background (Escherichia coli) | Uropathogenic Escherichia coli HM26 | (Subashchandrabose et al., 2014) | ||
| Strain, strain background (Escherichia coli) | Uropathogenic Escherichia coli HM27 | (Subashchandrabose et al., 2014) | ||
| Strain, strain background (Escherichia coli) | Uropathogenic Escherichia coli HM46 | (Subashchandrabose et al., 2014) | ||
| Strain, strain background (Escherichia coli) | Uropathogenic Escherichia coli HM65 | (Subashchandrabose et al., 2014) | ||
| Strain, strain background (Escherichia coli) | Uropathogenic Escherichia coli HM69 | (Subashchandrabose et al., 2014) | ||
| Strain, strain background (Mus musculus) | CBA/J | |||
| commercial assay or kit | MICROBEnrich Kit | Thermo Fisher | AM1901 | |
| commercial assay or kit | RNeasy kit | Qiagen | 74104 | |
| commercial assay or kit | Turbo DNase kit | Thermo Fisher | AM2238 | |
| commercial assay or kit | iScript cDNA synthesis kit | Bio Rad | 1708890 | |
| commercial assay or kit | ScriptSeq Complete Gold Kit (Epidemiology) | Illumina | Discontinued | |
| commercial assay or kit | ScriptSeq Complete Kit (Bacteria) | Illumina | Discontinued | |
| commercial assay or kit | PowerUP SYBR Green Master Mix | Bio Rad | A25779 | |
| commercial assay or kit | Dynabeads mRNA DIRECT Purification kit | Thermo Fisher | 61011 | |
| chemical compound, drug | RNAprotect | Qiagen | 76526 | |
| software, algorithm | Trimmomatic | (Bolger et al., 2014) | 0.36 | |
| software, algorithm | Bowtie2 | (Langmead and Salzberg, 2012) | 2.3.4 | |
| software, algorithm | samtools | (Li, 2011) | 1.5 | |
| software, algorithm | HTseq | (Anders et al., 2015) | 0.9.1 | |
| software, algorithm | Get_homologues | (Contreras-Moreira and Vinuesa, 2013) | 20170807 | |
| software, algorithm | DESeq2 | (Love et al., 2014) | 1.22.2 |
Additional files
-
Supplementary file 1
Primers used for qPCR experiments.
- https://doi.org/10.7554/eLife.49748.032
-
Transparent reporting form
- https://doi.org/10.7554/eLife.49748.033
Download links
A two-part list of links to download the article, or parts of the article, in various formats.
Downloads (link to download the article as PDF)
Open citations (links to open the citations from this article in various online reference manager services)
Cite this article (links to download the citations from this article in formats compatible with various reference manager tools)
Genetically diverse uropathogenic Escherichia coli adopt a common transcriptional program in patients with UTIs
eLife 8:e49748.
https://doi.org/10.7554/eLife.49748


