Genomic adaptations in information processing underpin trophic strategy in a whole-ecosystem nutrient enrichment experiment
- Arizona State University, United States
- USDA-ARS Crops Pathology and Genetic Research Unit, United States
- J Craig Venter Institute, United States
- Universidad Nacional Autónoma de México, Mexico
- Rice University, United States
- University of Montana, United States
Figures
Figure 1
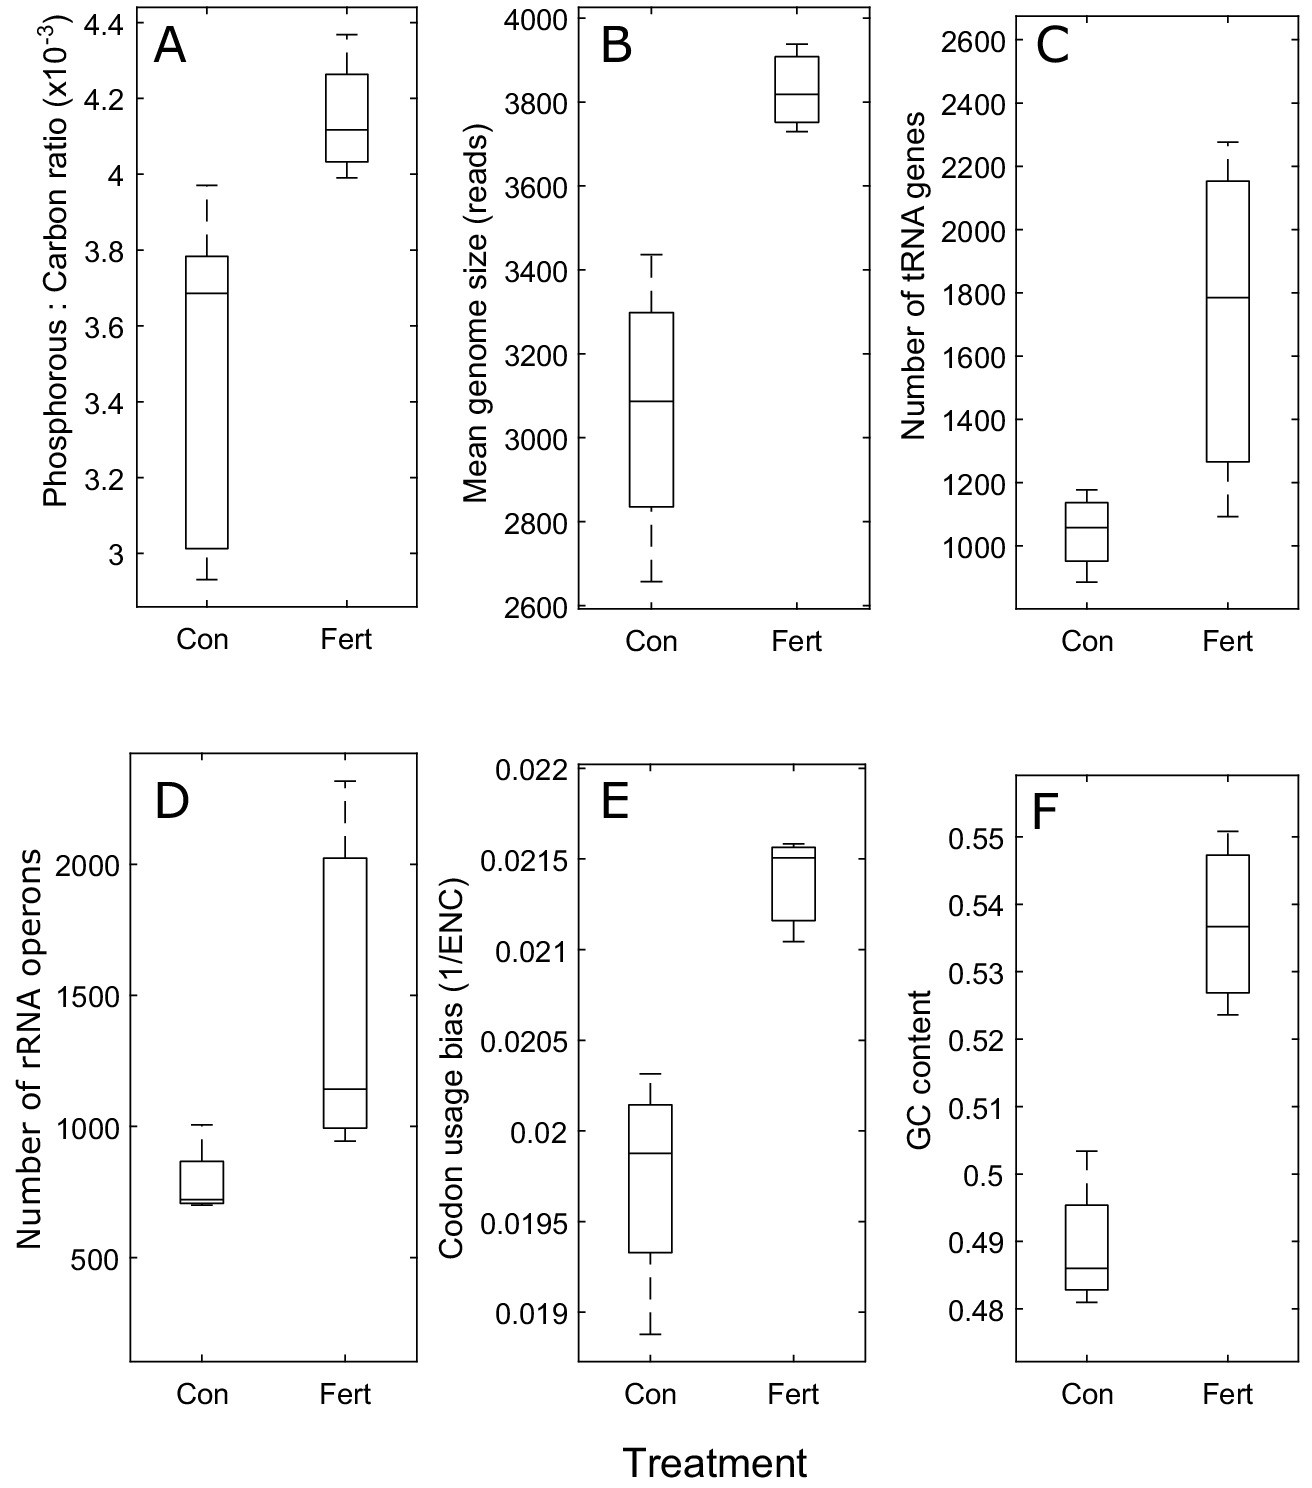
Community-level trait responses to nutrient enrichment.
(A–F) As predicted, the mean value for each information-processing trait was higher in the fertilized treatment (Fert) than in the unfertilized treatment (Con). Because the faster-growing organisms generally have more P-rich ribosomes, seston P:C ratio also increased after fertilizer treatment (as shown in panel [A]). Boxes show 25/75% quantiles, center horizontal lines show medians, and vertical lines show the data range. In panel (E), a community’s codon usage bias is the inverse mean effective number of codons (1/ENC) of a metagenome’s ribosomal protein sequences, with higher 1/ENC values indicating increased codon usage bias.
Figure 2
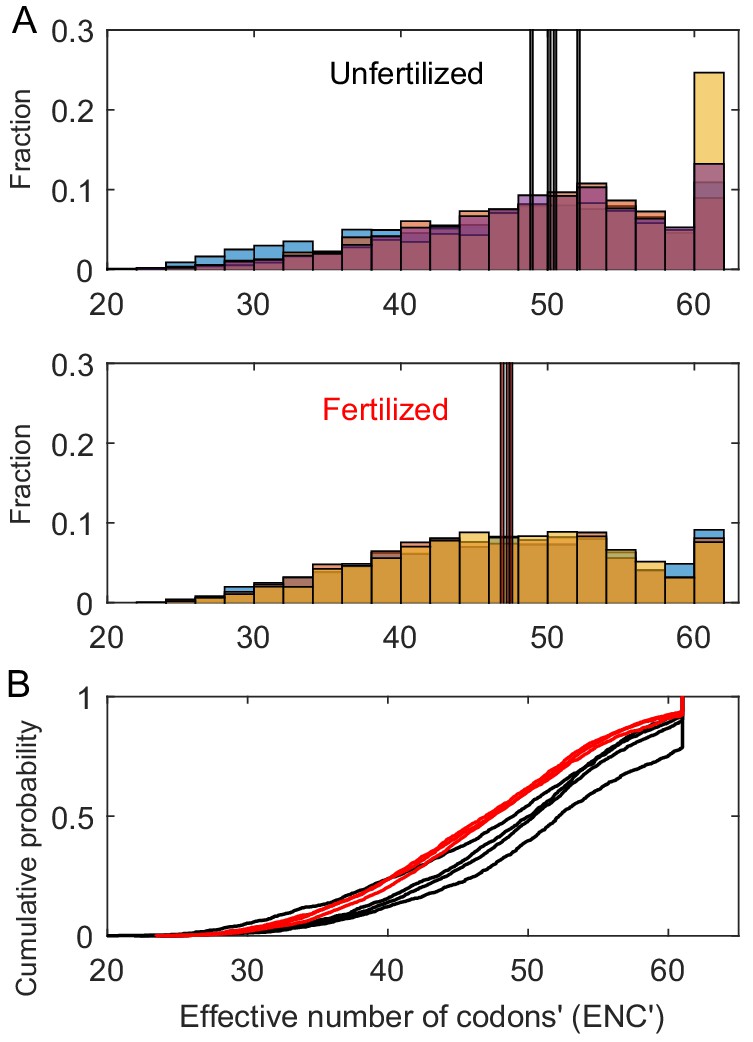
Histograms and cumulative distributions of the codon usage biases (ENC′ values) of the ribosomal protein sequences in the metagenomes, with lower ENC′ values indicating increased codon usage bias and thus increased speeds and/or accuracies of translation of ribosomes.
(A) Histograms showing that the unfertilized communities have more sequences with nearly no detectable codon usage bias (values of 60–61), higher median ENC′ values (indicated by the tall vertical lines), and typically fewer sequences with high codon usage bias (ENC′ values from 20 to 40). Bar colors and their overlapping shades indicate different samples. (B) Cumulative distributions showing that, overall, the fertilized communities’ distributions have fatter left-tails, so higher frequencies of ENC′ values < 50 and thus more frequent codon usage bias. The Y-axis shows the proportion of ENC′ values ≤ ENC′ value designated by the plotted curves (fertilized = red curves, unfertilized = black curves).
Figure 3
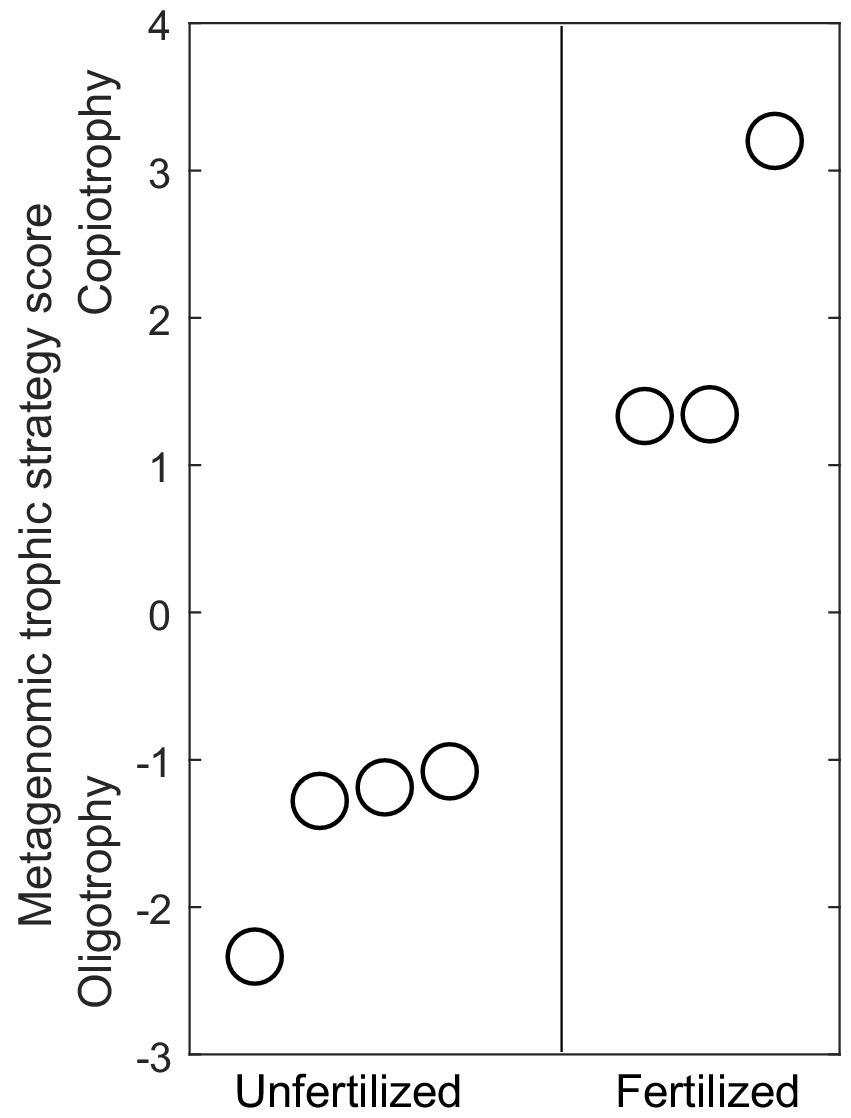
The principal component scores quantifying the position of metagenomes along a single dimension representing the oligotrophy-copiotrophy strategy continuum for information-processing traits.
Higher scores on the vertical axis indicate communities whose information-processing traits are better suited for copiotrophy (increased maximum growth rate in resource abundant environments), whereas low scores indicate adaptation to oligotrophy (increased resource use efficiency in low nutrient environments). Nutrient enrichment explains 86% of the variance in metagenomes along this axis of growth and trophic strategy (R2 = 86%, p=0.004). Within each treatment, circular symbols are spaced horizontally for visual clarity.
Appendix 1—figure 1
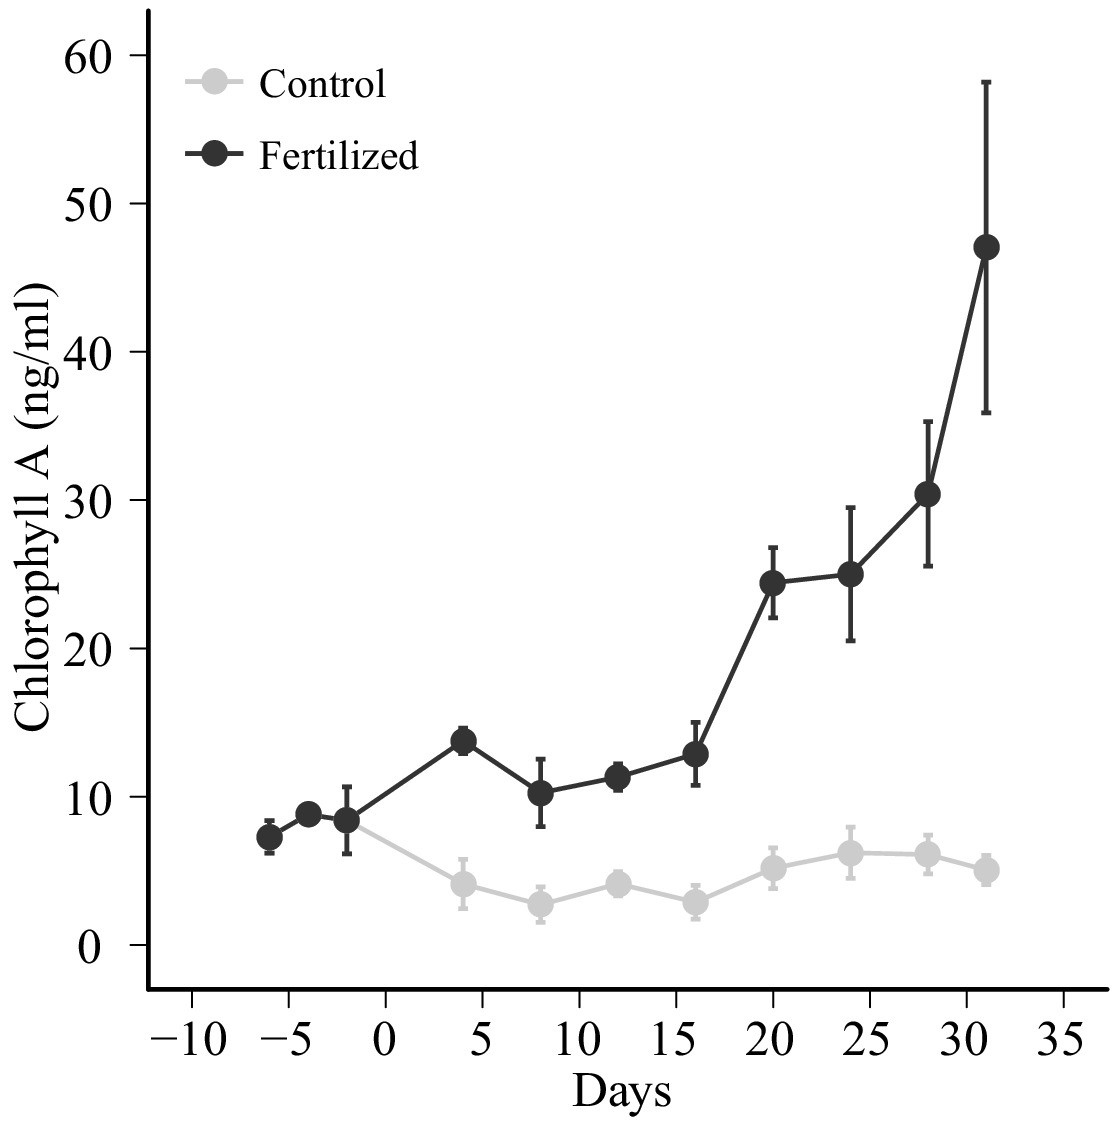
Chlorophyll a concentration increased with nutrient enrichment, whereas it remained relatively invariant in the unfertilized treatment.
Appendix 1—figure 2

Principal coordinates analysis (PCoA) of the community phylogenetic structure inferred from the metagenomes shows that the phylogenetic composition of samples, as indicated by each point, is substantially different between unfertilized and fertilized treatments.
Microbial community phylogenetic composition also varied notably within the unfertilized mesocosms, falling into two clusters driven by variation in the relative abundance of Alphaproteobacterum, whereas enriched communities all shared relatively similar phylogenetic composition, indicating a convergence of effects of fertilization on community composition.
Appendix 1—figure 3
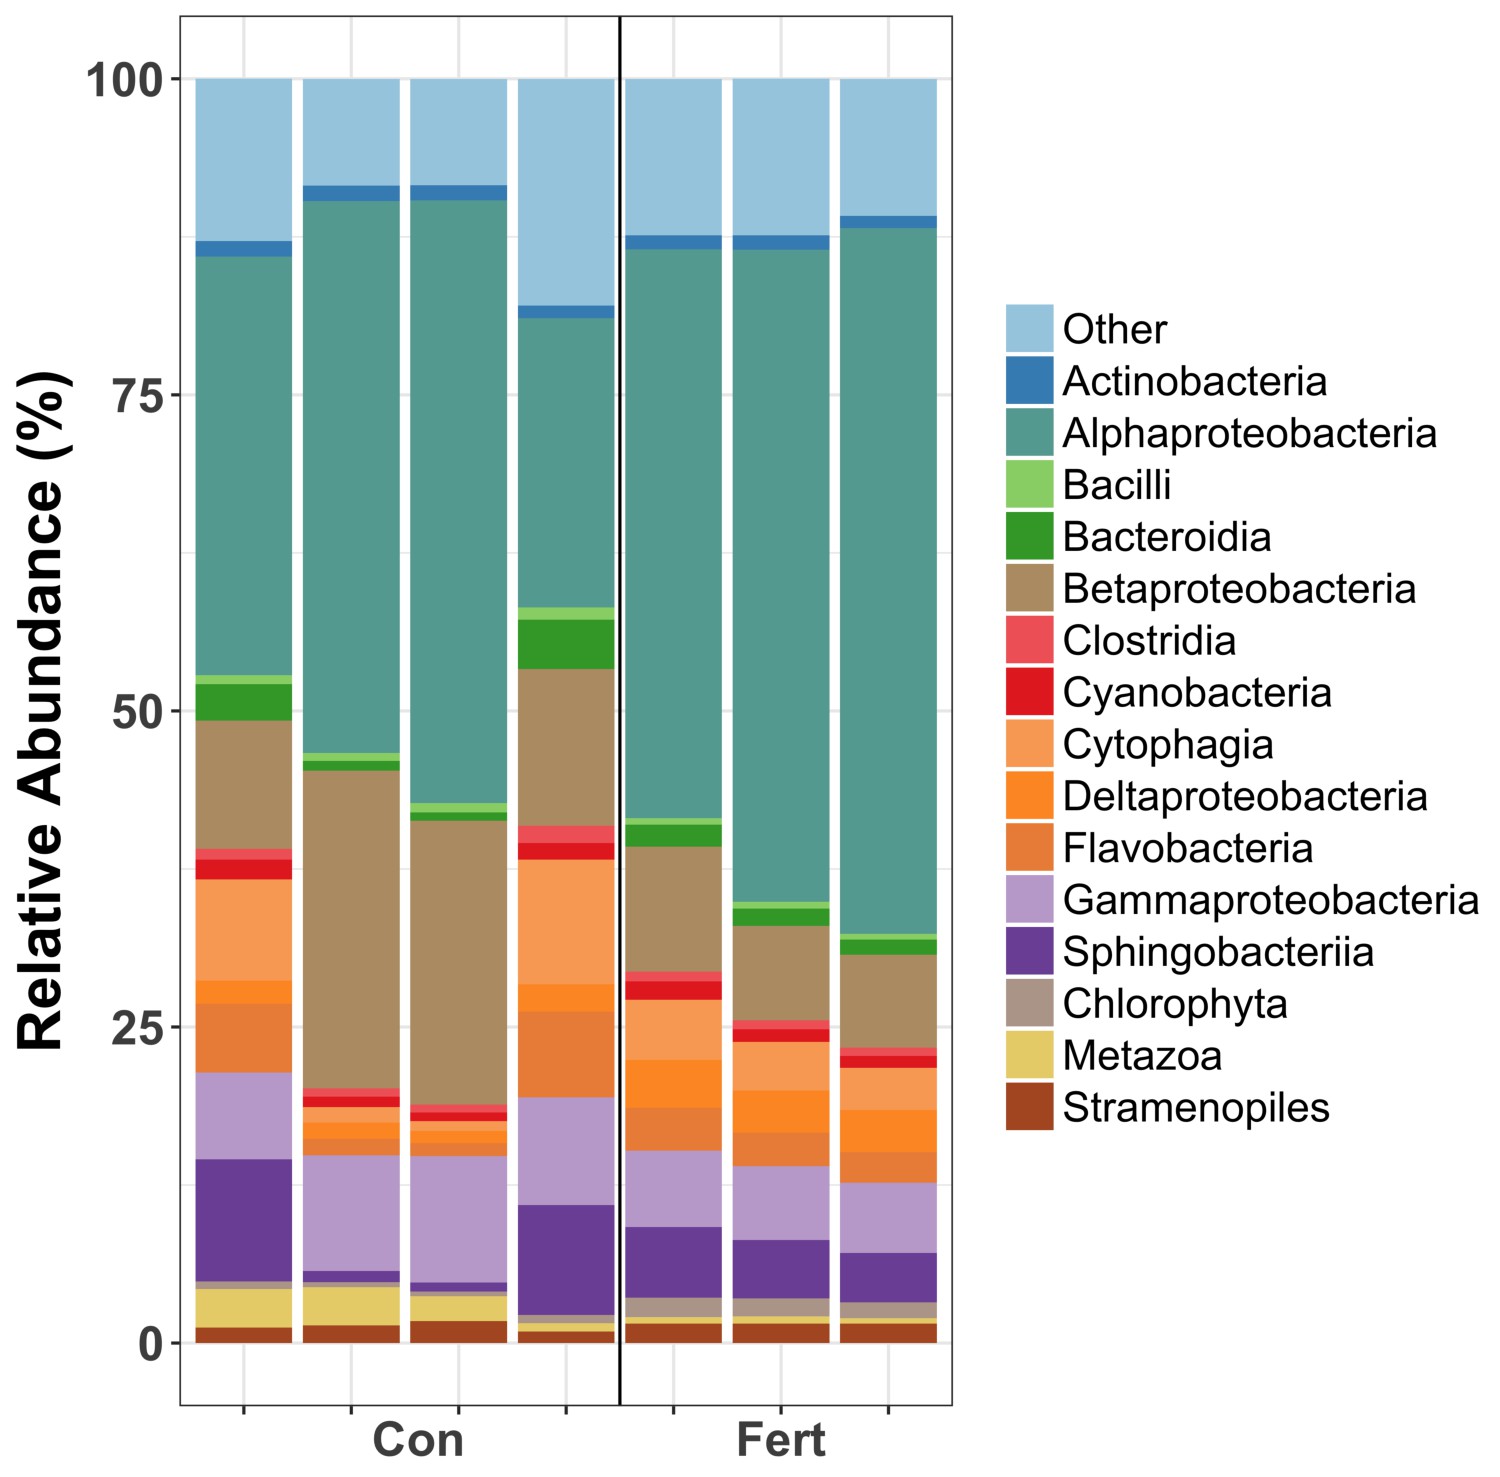
Relative abundances of taxonomic phyla in the samples from the unfertilized (Cont) and fertilized (Fert) treatments.
Appendix 1—figure 4
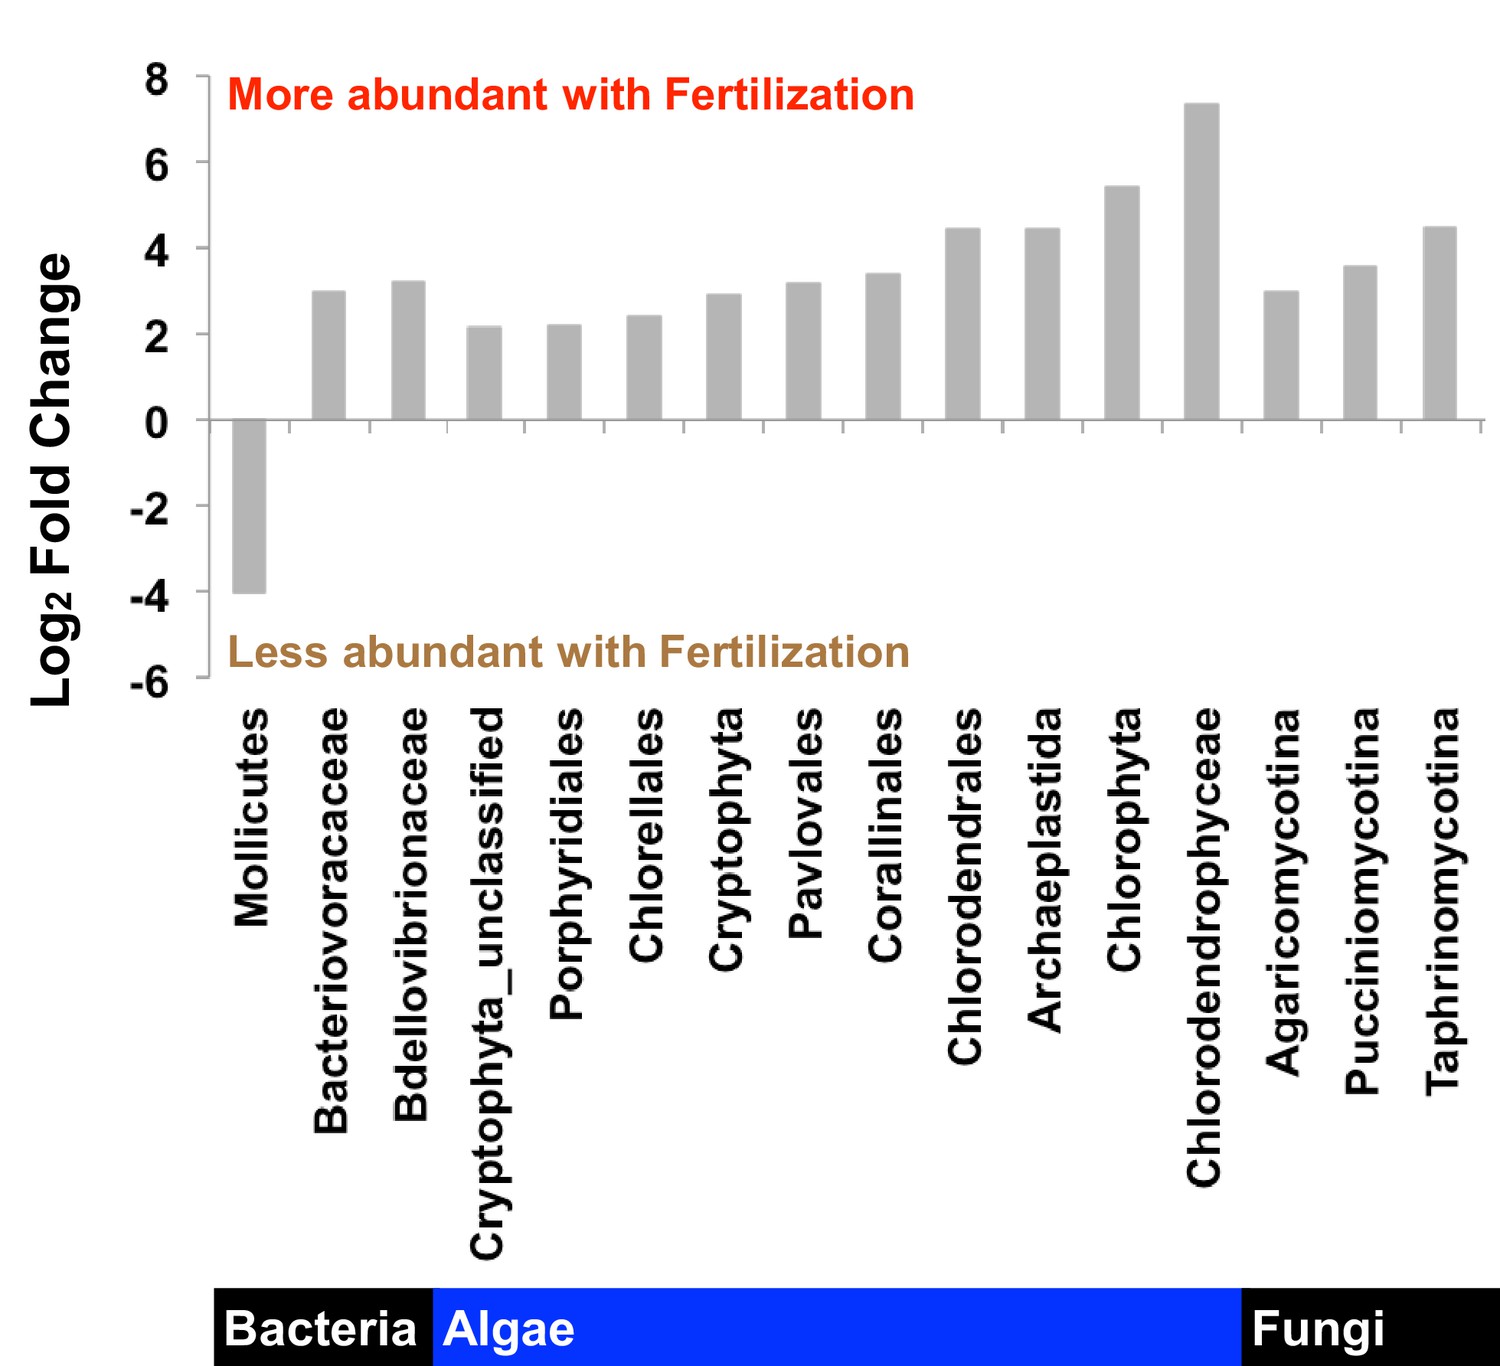
The significant relative abundance changes in taxonomic classes suggested by the statistical analysis of the phylogenetic composition determined by APIS.
The statistical analysis is based on the statistical methods developed in the EdgeR package (Robinson et al., 2010). Note that less than 50% of reads could be annotated. All p<0.01.
Tables
Appendix 1—table 1
Differences in the variance of community-level traits between treatments.
| Community-level trait | Variance | Ratio of variances | Bonett's test p-value | |
|---|---|---|---|---|
| Unfertilized | Fertilized | |||
| P:C ratio | 2.09 × 10⁻⁷ | 2.06 × 10⁻⁸ | 0.13 | 0.058 |
| Mean genome size | 105,315.4 | 10,984.8 | 0.1 | 0.174 |
| Log number of rRNA genes | 0.0056 | 0.0422 | 7.55 | <0.001 |
| Log number of tRNA genes | 0.0148 | 0.1396 | 9.46 | 0.013 |
| GC content | 0.0001 | 0.0002 | 1.9 | 0.56 |
| Mean ENC | 3.0554 | 0.3034 | 0.1 | 0.169 |
| Median ENC | 2.5861 | 0.413 | 0.16 | 0.275 |
| Mean ENC' | 2.5494 | 0.0824 | 0.03 | 0.056 |
| Median ENC' | 1.832 | 0.0671 | 0.04 | 0.069 |
Additional files
-
Source data 1
Data on the metagenomic traits and concentrations of seston chlorophyll a, phosphorus, nitrogen, and carbon in water samples from Lagunitas pond, Cuatro Ciénegas, Mexico.
- https://cdn.elifesciences.org/articles/49816/elife-49816-data1-v2.xlsx
Download links
A two-part list of links to download the article, or parts of the article, in various formats.
Downloads (link to download the article as PDF)
Open citations (links to open the citations from this article in various online reference manager services)
Cite this article (links to download the citations from this article in formats compatible with various reference manager tools)
Genomic adaptations in information processing underpin trophic strategy in a whole-ecosystem nutrient enrichment experiment
eLife 9:e49816.
https://doi.org/10.7554/eLife.49816


