VEGF/VEGFR2 signaling regulates hippocampal axon branching during development
- Biochemistry Center (BZH), University of Heidelberg, Germany
- Medicine Faculty Mannheim, Heidelberg University, Germany
- University of Frankfurt, Germany
- Max Planck Institute for Brain Research, Germany
- Buchmann Institute for Molecular Life Sciences (BMLS), University of Frankfurt, Germany
- German Cancer Research Center (DKFZ), Germany
Figures
Figure 1 with 1 supplement
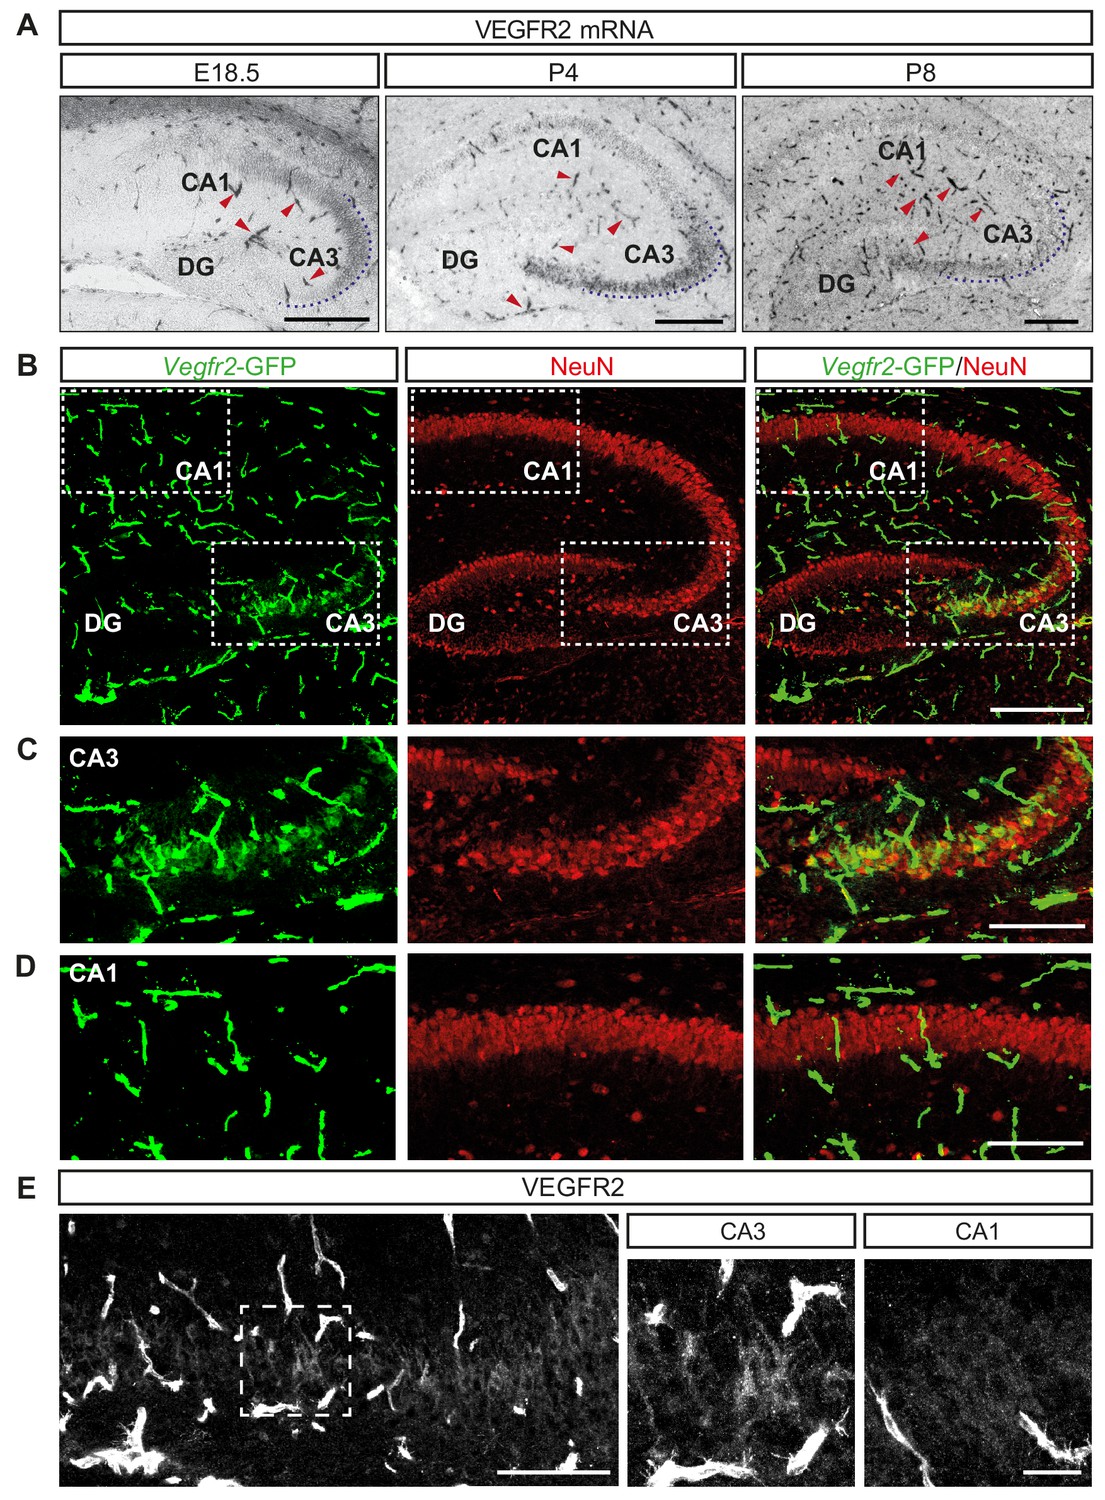
VEGFR2 is expressed by CA3 pyramidal neurons during hippocampal development.
(A) VEGFR2 mRNA ISH in the hippocampus at E18.5, P4 and P8. Blood vessels are indicated by red arrowheads. Scale bars 250 µm. (B) GFP and NeuN immunostaining of Vegfr2-GFP hippocampus at P8. Scale bar 250 µm. (C,D) High magnification images of the CA3 region (C) and the CA1 region (D) from insets in (B). Scale bar 50 µm. (E) VEGFR2 immunostaining in the CA3 region of P8 hippocampus. High magnification images of the CA3 region (inset in left panel) and CA1 region are shown on the right. Scale bars 100 µm and 25 µm, respectively.
Figure 1—figure supplement 1
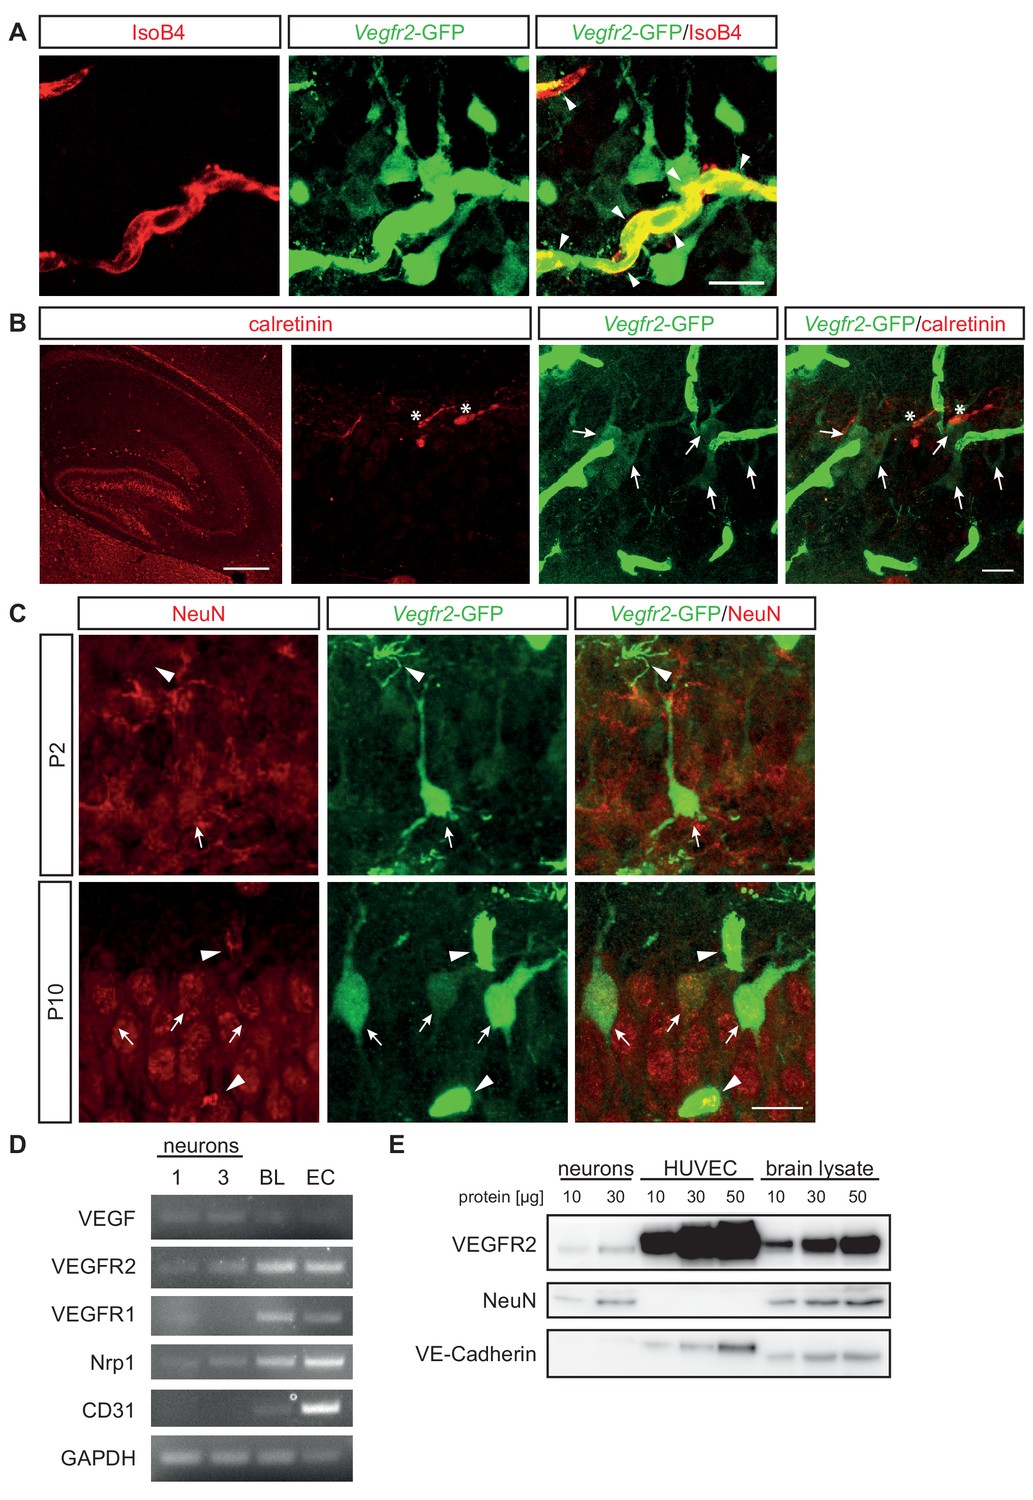
VEGFR2 expression in hippocampal neurons in vivo.
(A) High magnification images of GFP and IsoB4 immunostaining in Vegfr2-GFP hippocampus at P8. Shown is the CA3 region of the hippocampus. Scale bar 20 µm. (B) GFP and Calretinin immunostaining in Vegfr2-GFP hippocampus at P8. Scale bar 250 µm. High magnification images of CA3 region are shown in the left panel. Scale bar 20 µm. (C) High magnification images of GFP and NeuN immunostaining in Vegfr2-GFP hippocampus at P2 and P10. Shown is the CA3 region of the hippocampus. Scale bar 20 µm. (D) RNA was isolated from two independent preparations of hippocampal neurons was well as brain lysate (BL) and an endothelial cell line (EC). PCR was performed for VEGF, VEGFR2, VEGFR1 Nrp1, CD31 and GAPDH mRNAs. (E) Protein was isolated from hippocampal neurons, HUVECs or brain lysate and Western blotting was performed. VEGFR2, NeuN and VE-Cadherin were detected.
Figure 2 with 1 supplement

VEGF mRNA is expressed in different cell types during hippocampal development.
(A) ISH for VEGF mRNA in the hippocampus at E18.5, P4 and P8. Scale bars 250 µm. (B) ISH for VEGF mRNA combined with NeuN immunostaining at P8. High magnification images of the CA1 and CA3 region are shown. VEGF-positive pyramidal cell layer (PC) is delineated by dotted lines. Scale bar 50 µm. (C) VEGF mRNA ISH combined with GFAP immunostaining at P8. Insets show high magnification images of the CA3 region (Scale bar 10 µm). The pyramidal cell layer (PC) is delineated by a dotted line. Arrowheads indicate VEGF mRNA positive glial cells. Scale bar 50 µm.
Figure 2—figure supplement 1
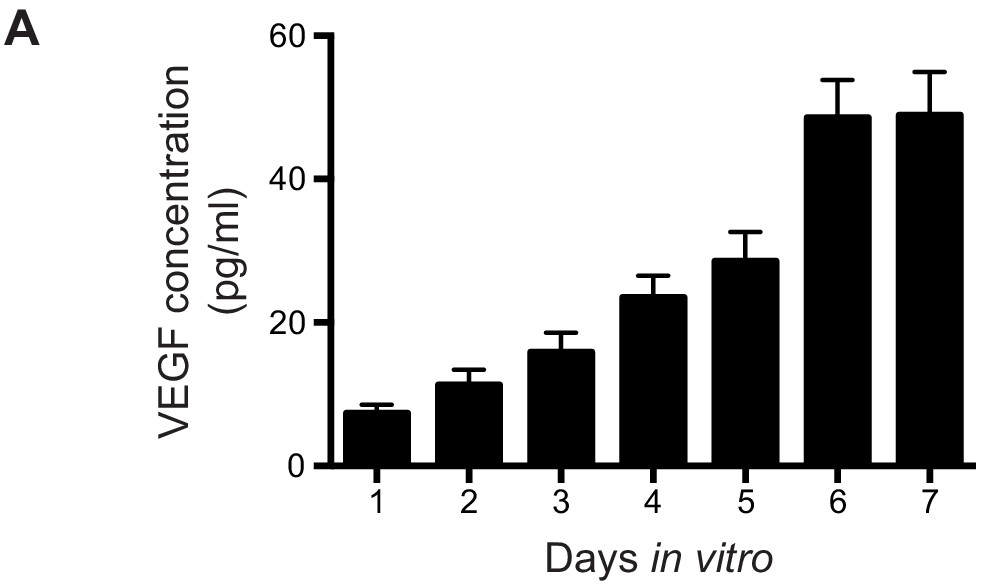
VEGF expression in hippocampal neurons in vitro.
(A) Hippocampal neurons were isolated and cultured in vitro. Conditioned medium was collected each day for one week and VEGF concentration was measured via ELISA (see Materials and methods section for more details).
Figure 3 with 5 supplements
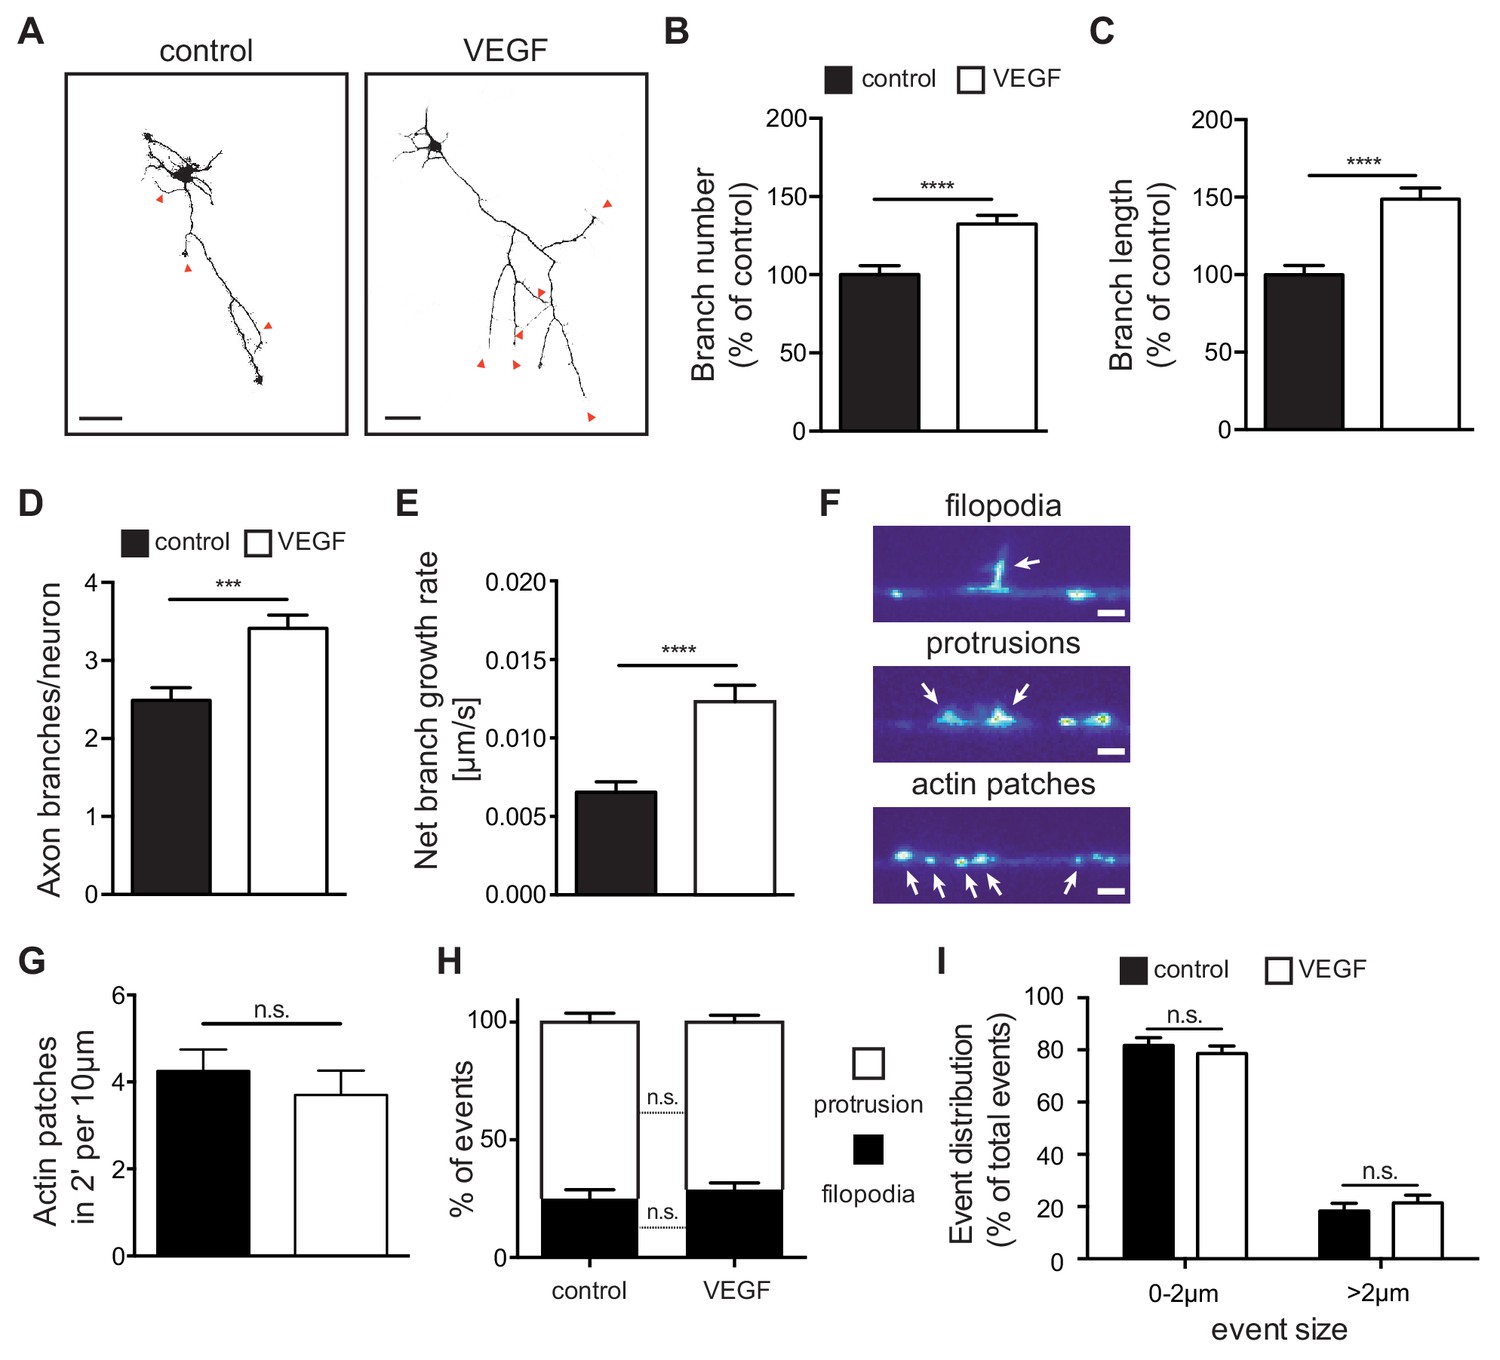
VEGF stimulation promotes the growth of axon branches in hippocampal neurons.
(A) Representative images of 3 DIV hippocampal neurons stimulated with or without 100 ng/ml VEGF for 48 hr and stained with beta-III-tubulin. Scale bars 50 µm. (B,C) Quantification of axonal branch number (B) and branch length (C). Data are represented as % of non-stimulated control. Mean ± SEM,>60 neurons from n = 4. ****p<0.0001; unpaired Student’s ttest. (D,E) 1 DIV hippocampal neurons were stimulated with 50 ng/ml VEGF or vehicle control and time-lapse movies were recorded over the course of 4 hr. The number of extending axon branches (D) was quantified over the course of the movies and the net growth rate of axon branch was calculated (E). Data represents mean ± SEM from 39 neurons, n = 3 independent experiments. ***p<0.001; ****p<0.0001; unpaired Student’s ttest. (F) Hippocampal neurons were transfected with mCherry-UtrCH and imaged in TIRF-mode at 3 DIV. Using this approach, actin patches, membrane bending protrusions and filopodia could be identified and differentiated. Time-lapse movies were recorded over the course of 2 min (actin patches) or 10 min (protrusions and filopodia) to study the dynamic formation of such events. Scale bar 2 µm. (G) The number of newly forming actin patches during 2 min per 10 µm axon segment were counted before and after VEGF stimulation (100 ng/ml). Data represents mean ± SEM from at least 11 neurons of 2 independent experiments. n.s. not significant; paired Student’s ttest. (H,I) The number and the size of newly forming protrusions and filopodia were analyzed during the course of 10 min before and after VEGF stimulation (100 ng/ml). Data represents mean ± SEM from at least 12 neurons of at least three independent experiments. n.s. not significant; paired Student’s ttest.
-
Figure 3—source data 1
Raw data and statistical analysis of graphs of Figure 3.
- https://cdn.elifesciences.org/articles/49818/elife-49818-fig3-data1-v1.xlsx
Figure 3—figure supplement 1
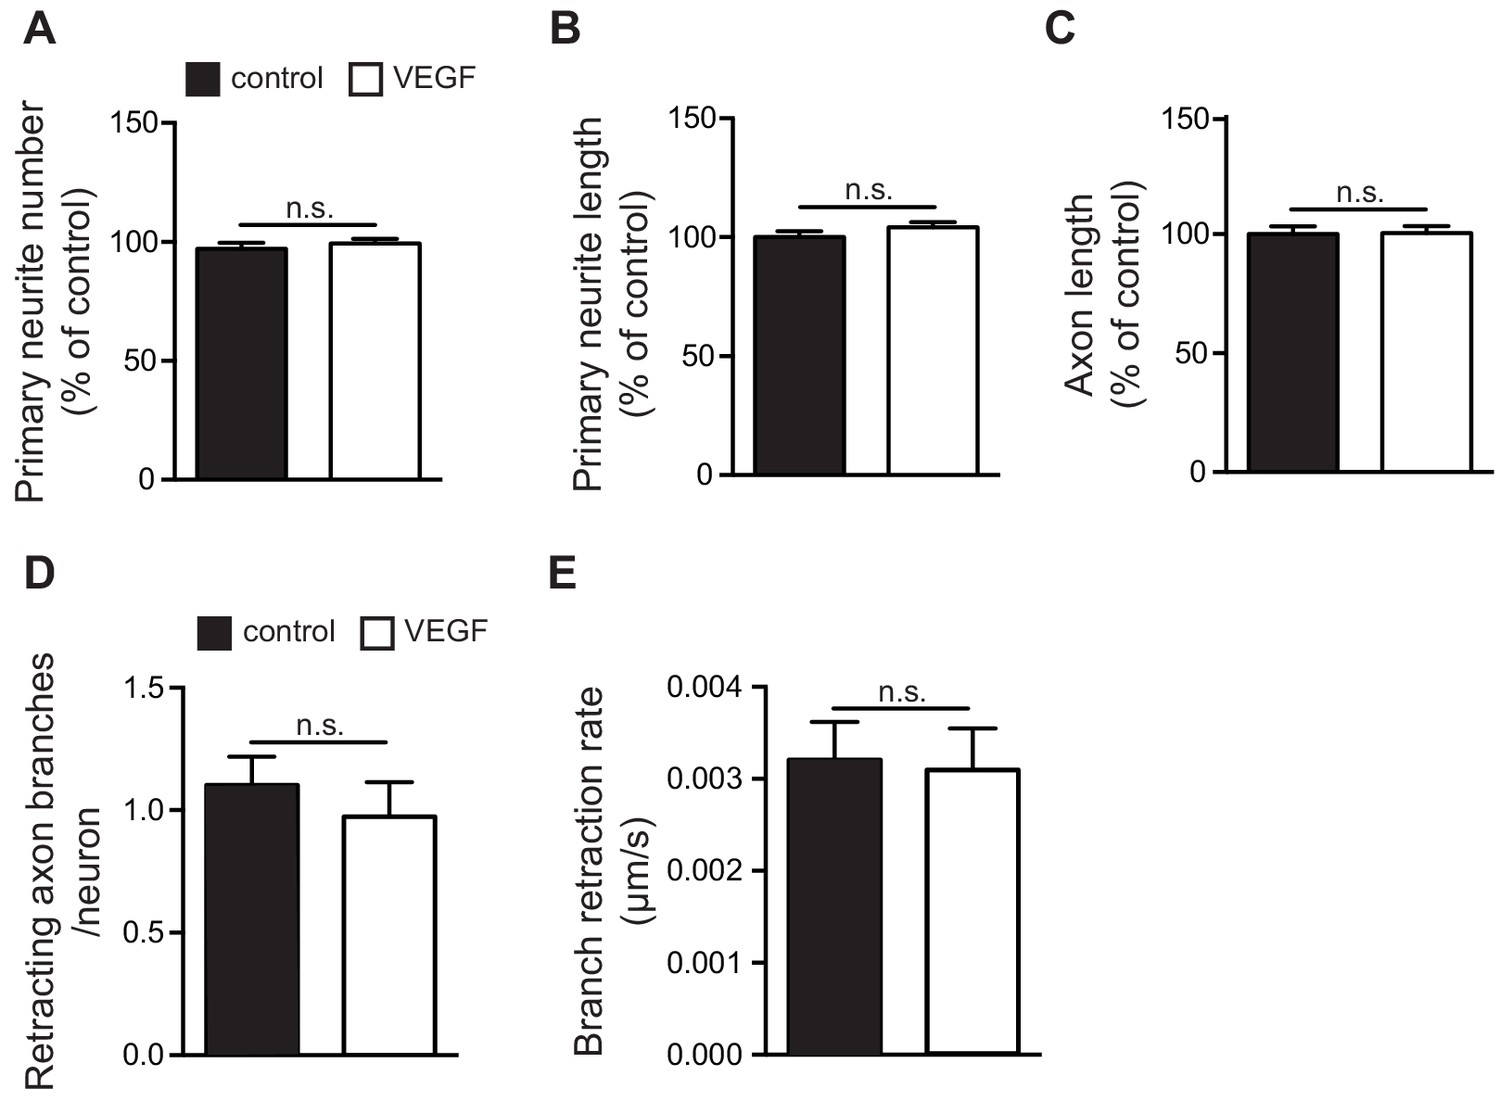
VEGF stimulation does not affect neurite growth and axon branch retraction.
(A–C) 1 DIV hippocampal neurons were stimulated with or without 100 ng/ml VEGF for 48 hr. Neuron cultures were stained with beta-III-tubulin at 3 DIV and axons were analyzed. Quantification showing the number of primary neurites (A), the average length of primary neurites (B) as well as the length of the axon. Data are represented as % of non-stimulated control. Mean ± SEM,>60 neurons from n = 4. n.s. not significant; unpaired Student’s ttest. (D,E) 1 DIV hippocampal neurons were stimulated with 50 ng/ml VEGF or vehicle control and time-lapse movies recorded over the course of 4 hr. The number of retracting axon branches was quantified over the course of the movies (D) and the retraction rate of axon branch was also calculated (E). Data represents mean ± SEM from 39 neurons, n = 3 independent experiments. n.s. not significant; unpaired Student’s ttest.
-
Figure 3—figure supplement 1—source data 1
Raw data and statistical analysis of graphs of Figure 3—figure supplement 1.
- https://cdn.elifesciences.org/articles/49818/elife-49818-fig3-figsupp1-data1-v1.xlsx
Figure 3—video 1
Hippocampal axon branching - unstimulated.
Related to Figure 3. Live cell time-lapse movies were recorded from 1 DIV hippocampal neurons over the course of 4 hr to study axon branch dynamics. Images were recorded every 4 min. Blue arrows indicate extending and retracting axonal branches.
Figure 3—video 2
Hippocampal axon branching – VEGF stimulated.
Related to Figure 3. Live cell time-lapse movies were recorded from 1 DIV hippocampal neurons over the course of 4 hr to study axon branch dynamics. Cells were stimulated with 50 ng/ml VEGF. Images were recorded every 4 min. Blue arrows indicate extending and retracting axonal branches.
Figure 3—video 3
Actin-dynamics in axons of hippocampal neurons.
Related to Figure 3. Hippocampal neurons were transfected with mCherry-UtrCH plasmid at 1 DIV and TIRF time-lapse movies of actin dynamics were recorded at 3 DIV. Images were acquired every 5 s. Actin patches as well as membrane actin protrusions are indicated.
Figure 3—video 4
Actin patch-to-filopodia transition in axons of hippocampal neurons.
Related to Figure 3. Hippocampal neurons were transfected with mCherry-UtrCH plasmid at 1 DIV and TIRF time-lapse movies of actin dynamics were recorded at 3 DIV. Images were acquired every 5 s. Red arrow indicates the formation of actin protrusions and its transition to filopodia.
Figure 4 with 5 supplements
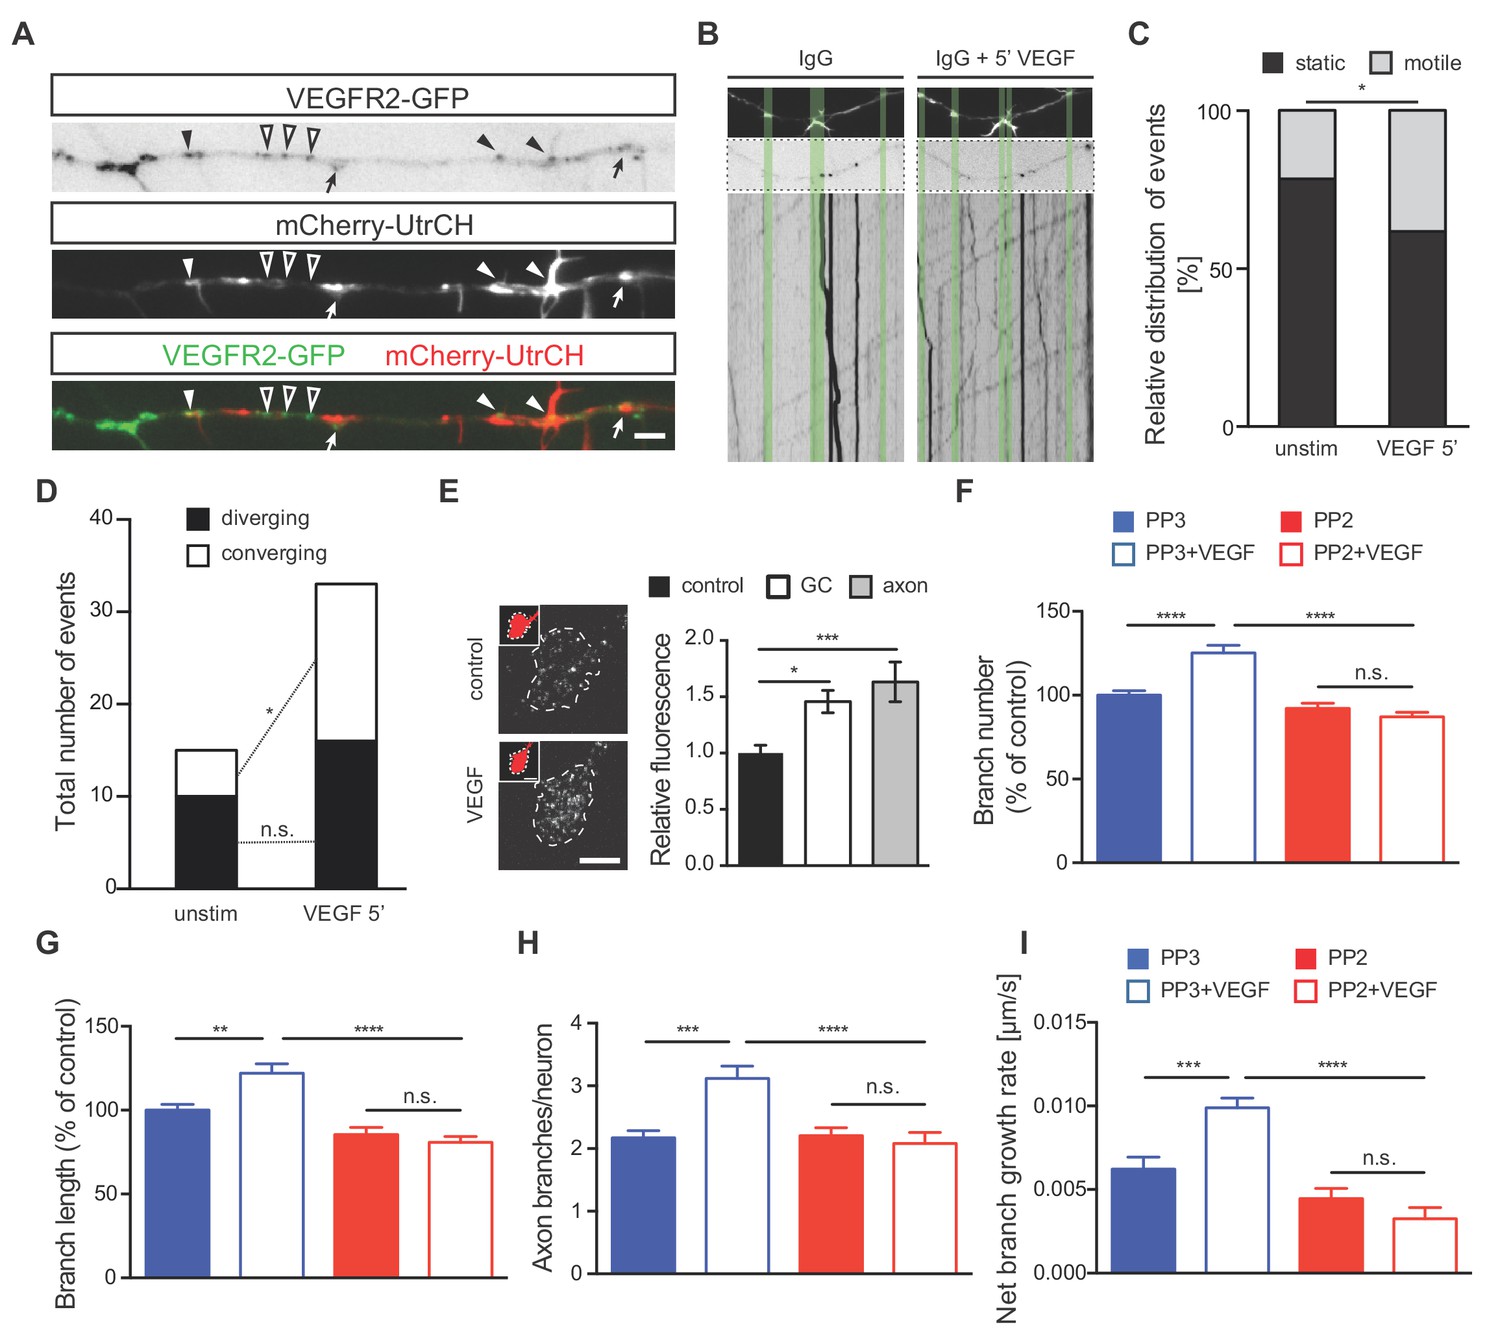
VEGF stimulation induces VEGFR2 motility towards actin-rich protrusions and filopodia and promotes axonal branching in a Src-dependent manner.
(A) Hippocampal neurons were double transfected with mCherry-UtrCH and VEGFR2-GFP plasmids. TIRF microscopy reveals the localization of VEGFR2-GFP punctae at actin nucleation sites (arrows), the base of membrane protrusions and filopodia (black arrowheads) and along axon segments with neither actin nucleation nor protrusion sites (open arrowheads). Scale bar 5 µm. (B–D) To analyze relative VEGFR2-GFP motility and directionality, kymographs of VEGFR2-GFP mobility were generated from time-lapse movies of VEGFR2-GFP and mCherry-UtrCH co-transfected hippocampal neurons (note that IgG treatment is present in these neurons as the movies and kymographs were performed at the same time as the movies and resultant kymographs shown in Figure 4—figure supplement 1 F-H, and thus they serve as the corresponding controls) Upper images shows mCherry-UtrCH status at t = 0 s, middle images shows VEGFR2-GFP at t = 0 s, lower panels shows the kymograph of VEGFR2-GFP over the course of 1 min (B). Relative VEGFR2-GFP motility at protrusions and filopodia (C) as well as the direction of VEGFR2-GFP movement (D) were analyzed over the course of 1 min before and 5 min after VEGF stimulation (100 ng/ml). Per condition,>13 neurons were analyzed of at least three independent experiments. n.s. not significant, *p<0.05; Chi-squared test. (E) Hippocampal neurons were stimulated with or without VEGF and fixed after 5 min. Immunostaining for p-Src was performed and the relative fluorescence was analyzed in the axonal growth cone (GC) or along the axon. Data are represented as mean ± SEM, from at least three independent experiments. *p<0.05; ***p<0.001; One-way ANOVA. (F,G) 1 DIV hippocampal neurons were treated with 1 µM PP2 (a widely used SFK inhibitor) or PP3 (control) for 1 hr prior stimulation with or without 100 ng/ml VEGF for 48 hr. Quantifications of axonal branch number (F) and branch length (G) are shown. Data are represented as % of non-stimulated control. Mean ± SEM of at least three independent experiments. n.s. not significant; **p<0.01; ****p<0.0001; Two-way ANOVA. (H,I) 1 DIV hippocampal neurons were pretreated with 1 µM PP2 or PP3 for 1 hr. After stimulation with 50 ng/ml VEGF or vehicle control time-lapse movies were recorded over the course of 4 hr. The number of extending axon branches is quantified over the course of the movies (H) and the net growth rate of axon branch was calculated (I). Mean ± SEM of at least three independent experiments. n.s. not significant; ***p<0.001; ****p<0.0001; Two-way ANOVA.
-
Figure 4—source data 1
Raw data and statistical analysis of graphs of Figure 4.
- https://cdn.elifesciences.org/articles/49818/elife-49818-fig4-data1-v1.xlsx
Figure 4—figure supplement 1
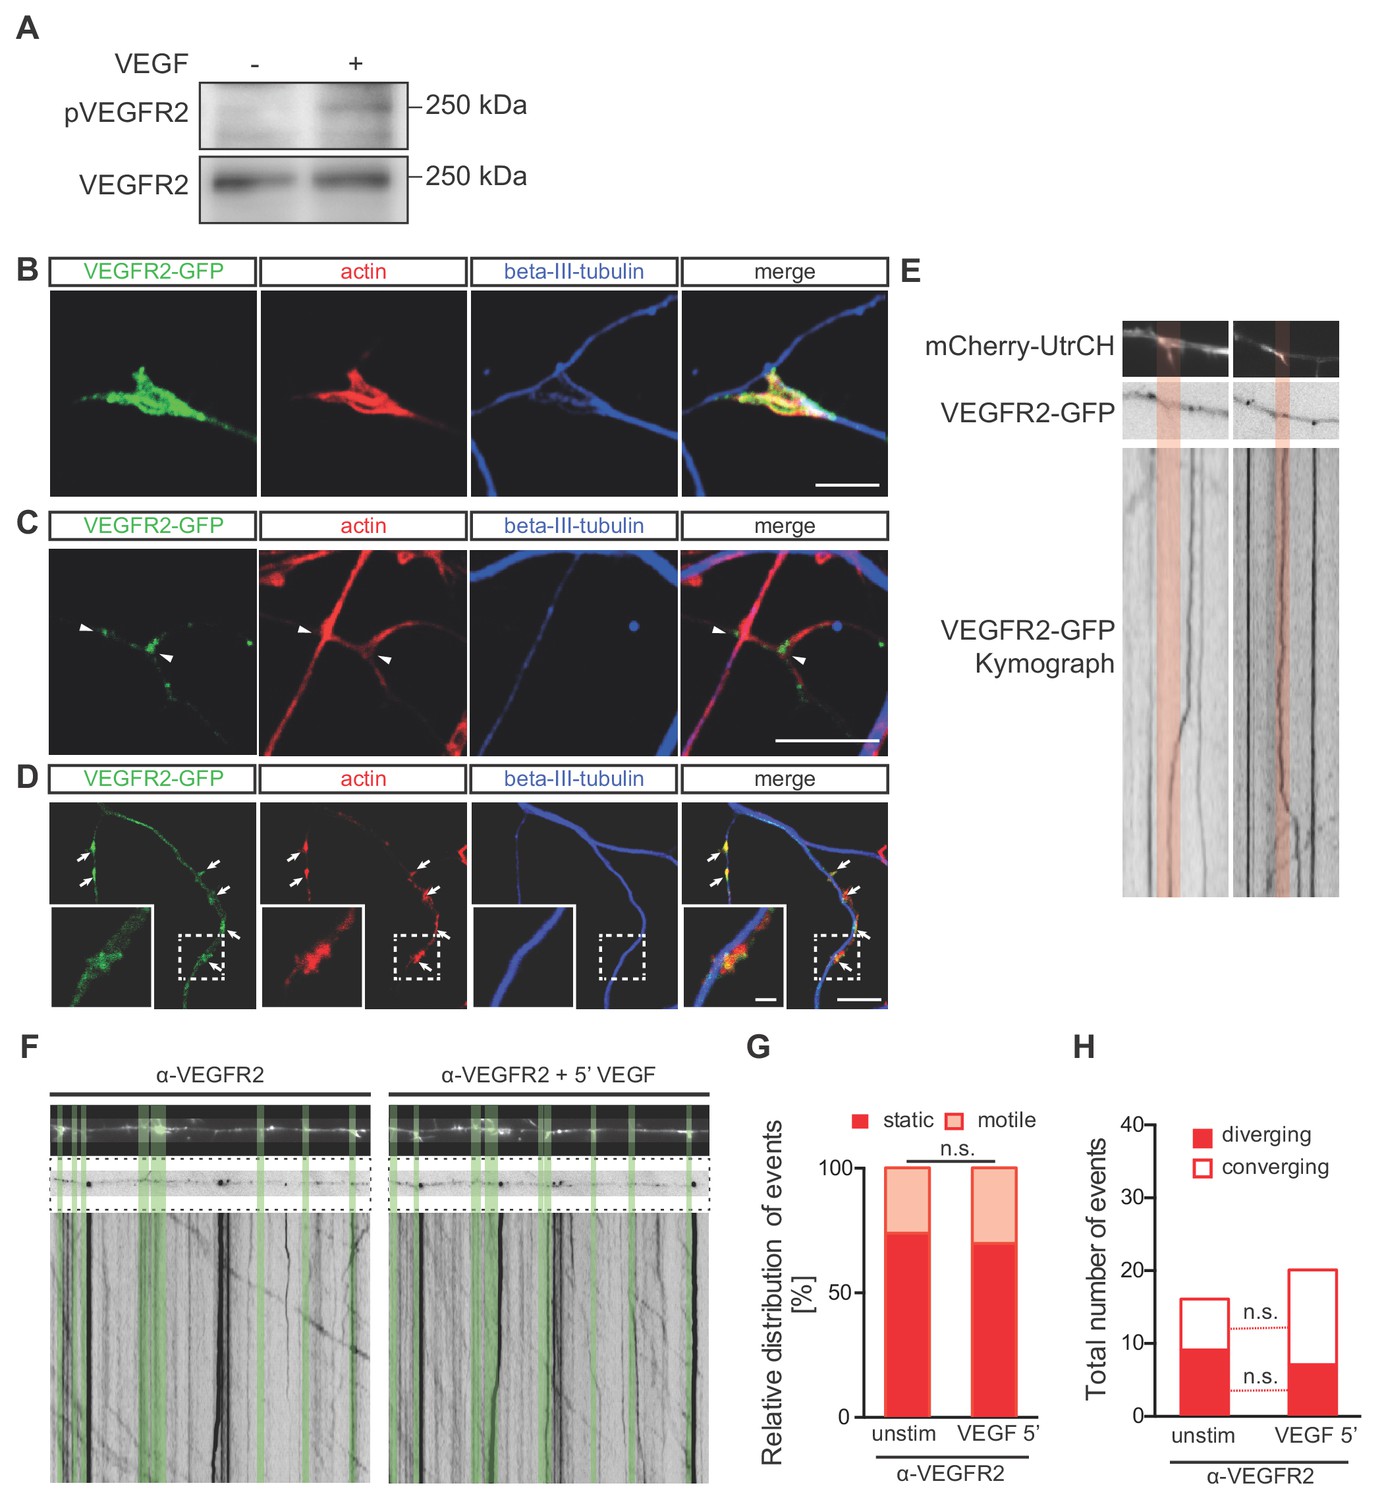
VEGFR2 localizes at growth cones, axon branch points and actin nucleation sites of hippocampal neurons and is activated upon VEGF stimulation.
(A) Hippocampal neurons were stimulated with 100 ng/ml VEGF for 5 min. Protein was extracted, Western blotted and probed for pVEGFR2 (Y1175) and total VEGFR2. (B–D) Hippocampal neurons were transfected with VEGFR2-GFP, fixed and stained for actin (using phalloidin-TRIC) and beta-III-tubulin. Confocal microscopy reveals the localization of VEGFR2-GFP punctae at the axonal growth cone (B), at axonal branching points (C) as well as along actin nucleation sites on the axon (D). Higher magnification picture of actin nucleation site (arrows) is shown in (D). Scale bar 5 µm (B–D) and 1 µm (insets of D), respectively. (E,F) Kymographs of VEGFR2-GFP mobility to analyze relative VEGFR2-GFP motility and directionality, were generated from time-lapse movies of VEGFR2-GFP transfected hippocampal neurons. These neurons were recorded over the course of 1 min before and 5 min after VEGF stimulation (100 ng/ml). (G,H). Hippocampal neurons were treated for 2 hr with α-VEGFR2 blocking antibody prior to VEGF stimulation. VEGFR2-GFP signal was recorded and motility as well as directionality was analyzed. >13 neurons per condition from at least three independent experiments. n.s. not significant, Chi-squared test.
-
Figure 4—figure supplement 1—source data 1
Raw data and statistical analysis of graphs of Figure 4—figure supplement 1.
- https://cdn.elifesciences.org/articles/49818/elife-49818-fig4-figsupp1-data1-v1.xlsx
Figure 4—video 1
VEGF-GFP motility in hippocampal axons – IgG unstimulated.
Related to Figure 4. Hippocampal neurons were transfected with mCherry-UtrCH and VEGFR2-GFP plasmids at 1 DIV and TIRF time-lapse movies of actin dynamics were recorded at 3 DIV. Cells were pre-treated with IgG 2 hr before. A picture of mCherry-UtrCH was taken just before the acquisition of a 1 min time-lapse of VEGFR2-GFP (shown inverted as black dots; frame rate of 1.6 fps). The directionality (to actin protrusions and filopodia) of VEGFR2-GFP was analyzed relative to mCherry-UtrCH picture (t = 0). Red asterisks indicates the position of actin protrusions and filopodia.
Figure 4—video 2
VEGF-GFP motility in hippocampal axons – IgG + 5’ VEGF.
Related to Figure 4. Hippocampal neurons were transfected with mCherry-UtrCH and VEGFR2-GFP plasmids at 1 DIV and TIRF time-lapse movies of actin dynamics were recorded at 3 DIV. Cells were pre-treated with IgG for 2 hr and stimulated with 100 ng/ml VEGF. A picture of mCherry-UtrCH was taken 5 min post-stimulation and just before the acquisition of a 1 min time-lapse of VEGFR2-GFP (shown inverted as black dots; frame rate of 1.6 fps). The directionality (to actin protrusions and filopodia) of VEGFR2-GFP was analyzed relative to mCherry-UtrCH picture (t = 0). Red asterisks indicates the position of actin protrusions and filopodia.
Figure 4—video 3
VEGF-GFP motility in hippocampal axons – αVEGFR2 unstimulated.
Related to Figure 4. Hippocampal neurons were transfected with mCherry-UtrCH and VEGFR2-GFP plasmids at 1 DIV and TIRF time-lapse movies of actin dynamics were recorded at 3 DIV. Cells were pre-treated with αVEGFR2 for 2 hr. A picture of mCherry-UtrCH was taken just before the acquisition of a 1 min time-lapse of VEGFR2-GFP (shown inverted as black dots; frame rate of 1.6 fps). The directionality (to actin protrusions and filopodia) of VEGFR2-GFP was analyzed relative to mCherry-UtrCH picture (t = 0). Red asterisks indicates the position of actin protrusions and filopodia.
Figure 4—video 4
VEGF-GFP motility in hippocampal axons – αVEGFR2 + 5’ VEGF.
Related to Figure 4. Hippocampal neurons were transfected with mCherry-UtrCH and VEGFR2-GFP plasmids at 1 DIV and TIRF time-lapse movies of actin dynamics were recorded at 3 DIV. Cells were pre-treated with αVEGFR2 for 2 hr and then stimulated with 100 ng/ml VEGF. A picture of mCherry-UtrCH was taken 5 min post-stimulation and just before the acquisition of a 1 min time-lapse of VEGFR2-GFP (shown inverted as black dots; frame rate of 1.6 fps). The directionality (to actin protrusions and filopodia) of VEGFR2-GFP was analyzed relative to mCherry-UtrCH picture (t = 0). Red asterisks indicates the position of actin protrusions and filopodia.
Figure 5 with 4 supplements
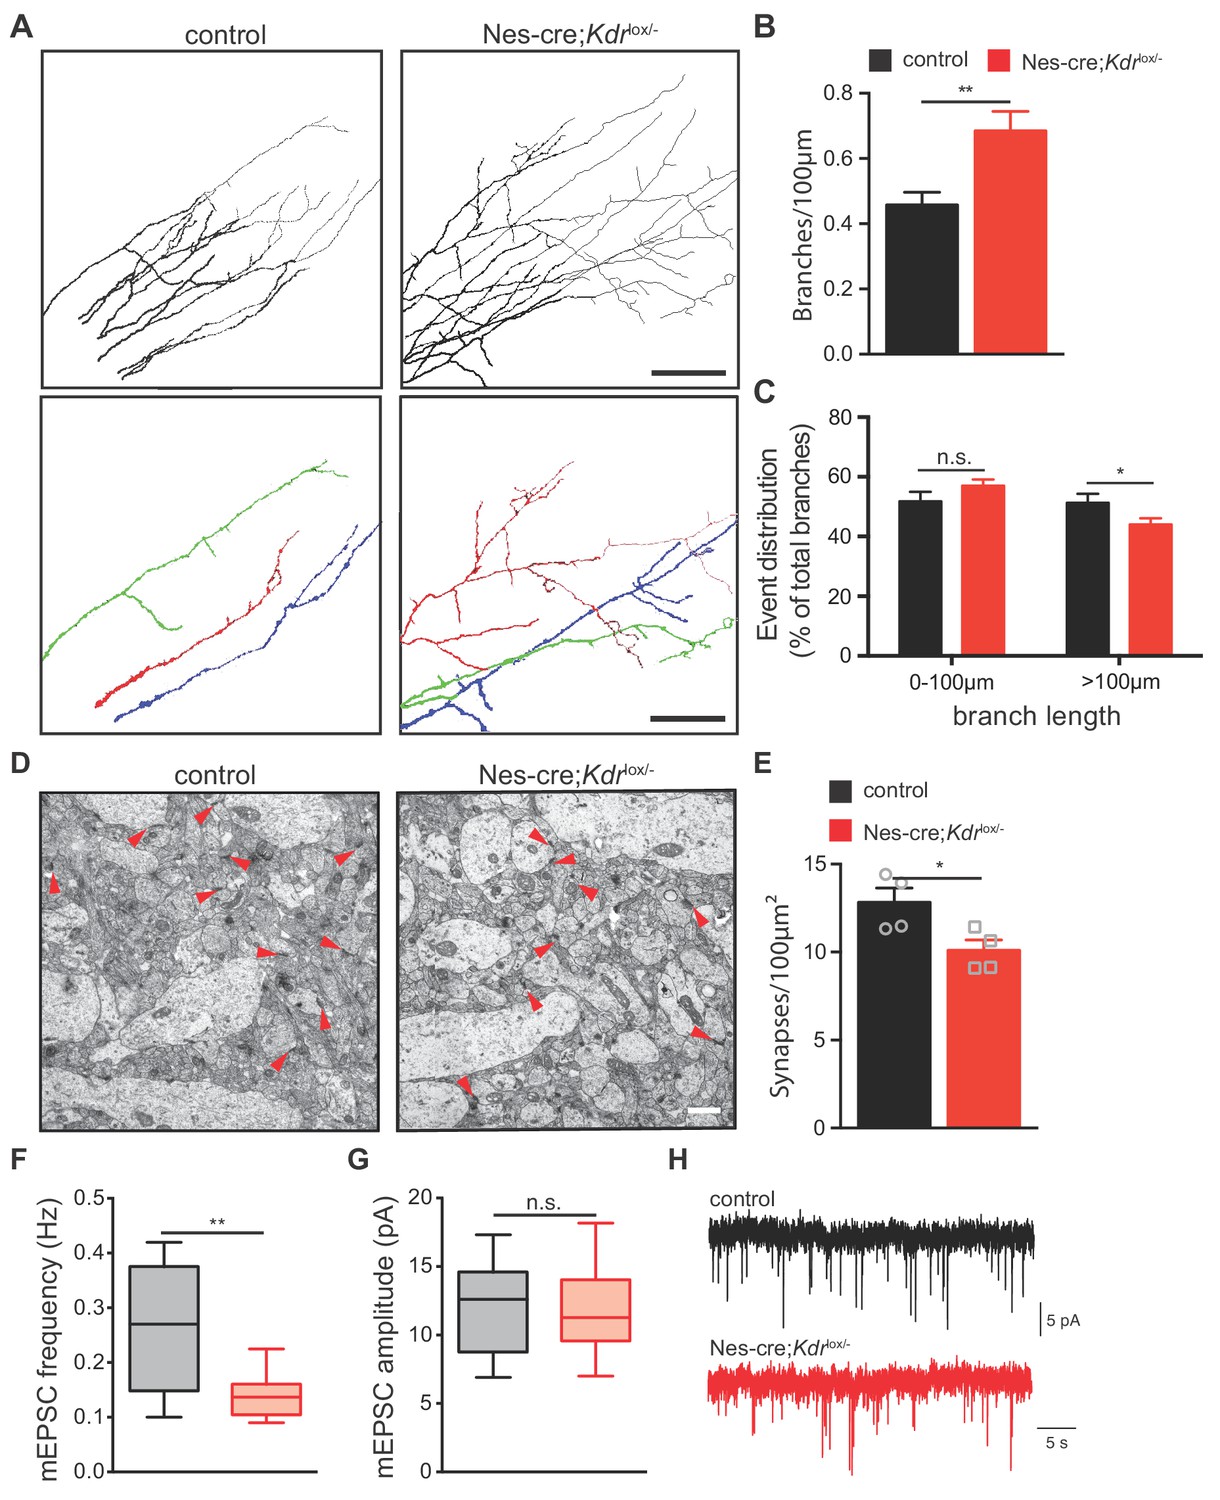
Nes-cre;Kdrlox/-mice show defects in axon branching and synapse density in vivo.
(A) Representative tracings in the CA1 stratum radiatum of CA3 DiI labeled axons from P10 control and Nes-cre;Kdrlox/- mice. Selected individual axon traces are shown highlighted in different colors in the panels below. Scale bar 100 µm. (B,C) Quantification of the axon branch number per 100 µm axon length (B) as well as their length distribution (C). Data are represented as mean ± SEM from n = 15 control and n = 18 Nes-cre;Kdrlox/- pups of 6 independent litters (B,C). n.s. not significant; *p<0.05; **p<0.01; unpaired Student’s ttest. (D) Representative electron micrographs of the hippocampal CA1 stratum radiatum from P10 control and Nes-cre;Kdrlox/- mice. Red arrowheads indicate synapses. Scale bar 1 µm. (E) Quantification of synapse density in control and Nes-cre;Kdrlox/- mice. Synapse numbers from 8 fields of view of n = 4 mice from each genotype were analyzed. *p<0.05; unpaired Student’s ttest. (F,G) Average mEPSC frequency (F) and amplitude (G) in control and Nes-cre;Kdrlox/- mice. n.s. not significant; **p<0.01; unpaired Student’s ttest. (H) Representative mEPSC recordings in control and Nes-cre;Kdrlox/- mice.
-
Figure 5—source data 1
Raw data and statistical analysis of graphs of Figure 5.
- https://cdn.elifesciences.org/articles/49818/elife-49818-fig5-data1-v1.xlsx
Figure 5—figure supplement 1
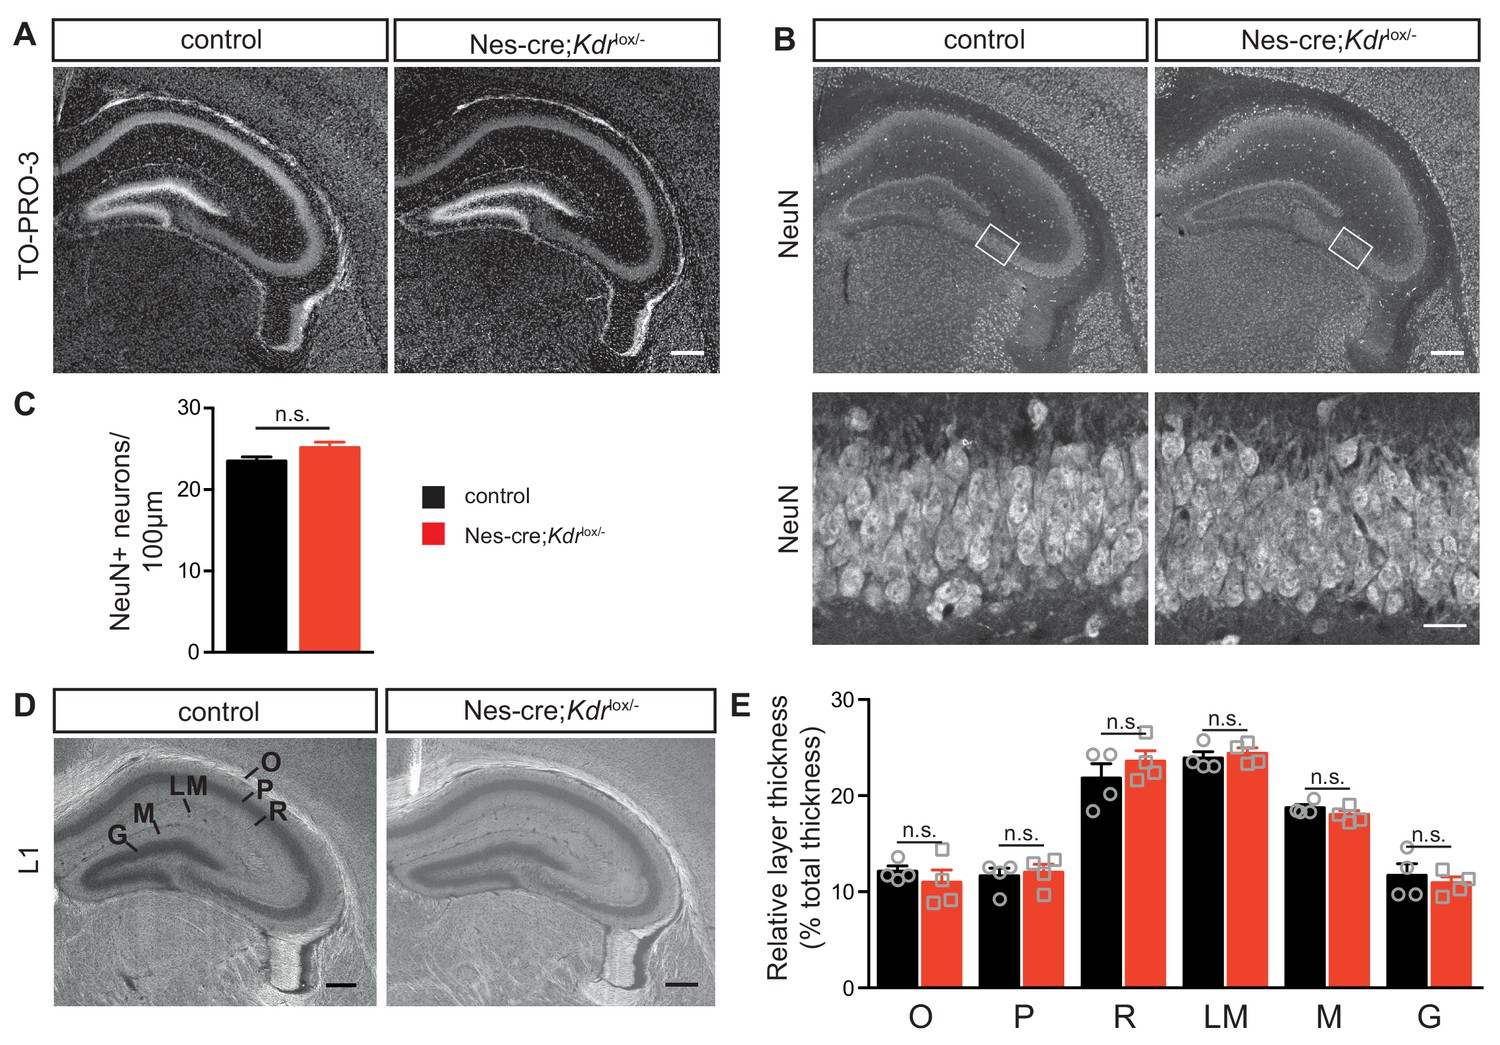
Nes-cre;Kdrlox/- mice do not show defects in the overall hippocampal morphology and cytoarchitecture.
(A–C) Hippocampal section of P10 control and Nes-cre;Kdrlox/-mice were stained with TO-PRO-3 and NeuN and the number of NeuN neurons was counted per 100 µm in the CA3 region of the hippocampus (C). Insets with higher magnifications of CA3 area (insets in B) are shown in the lower panel. Scale bar 100 µm or 20 µm, respectively. n.s. not significant, unpaired Student’s ttest. (D,E) Hippocampal section of P10 control and Nes-cre;Kdrlox/- mice were stained with L1 and relative layer thickness of stratum oriens (O), stratum pyramidale (P), stratum radiatum (R), stratum lacunosum-moleculare (LM), stratum moleculare (M) and stratum granulosum (G) were measured. Data are shown as % of total thickness, mean ± SEM from at least three mice. Scale bar 100 µm. n.s. not significant, unpaired Student’s ttest.
-
Figure 5—figure supplement 1—source data 1
Raw data and statistical analysis of graphs of Figure 5—figure supplement 1.
- https://cdn.elifesciences.org/articles/49818/elife-49818-fig5-figsupp1-data1-v1.xlsx
Figure 5—figure supplement 2
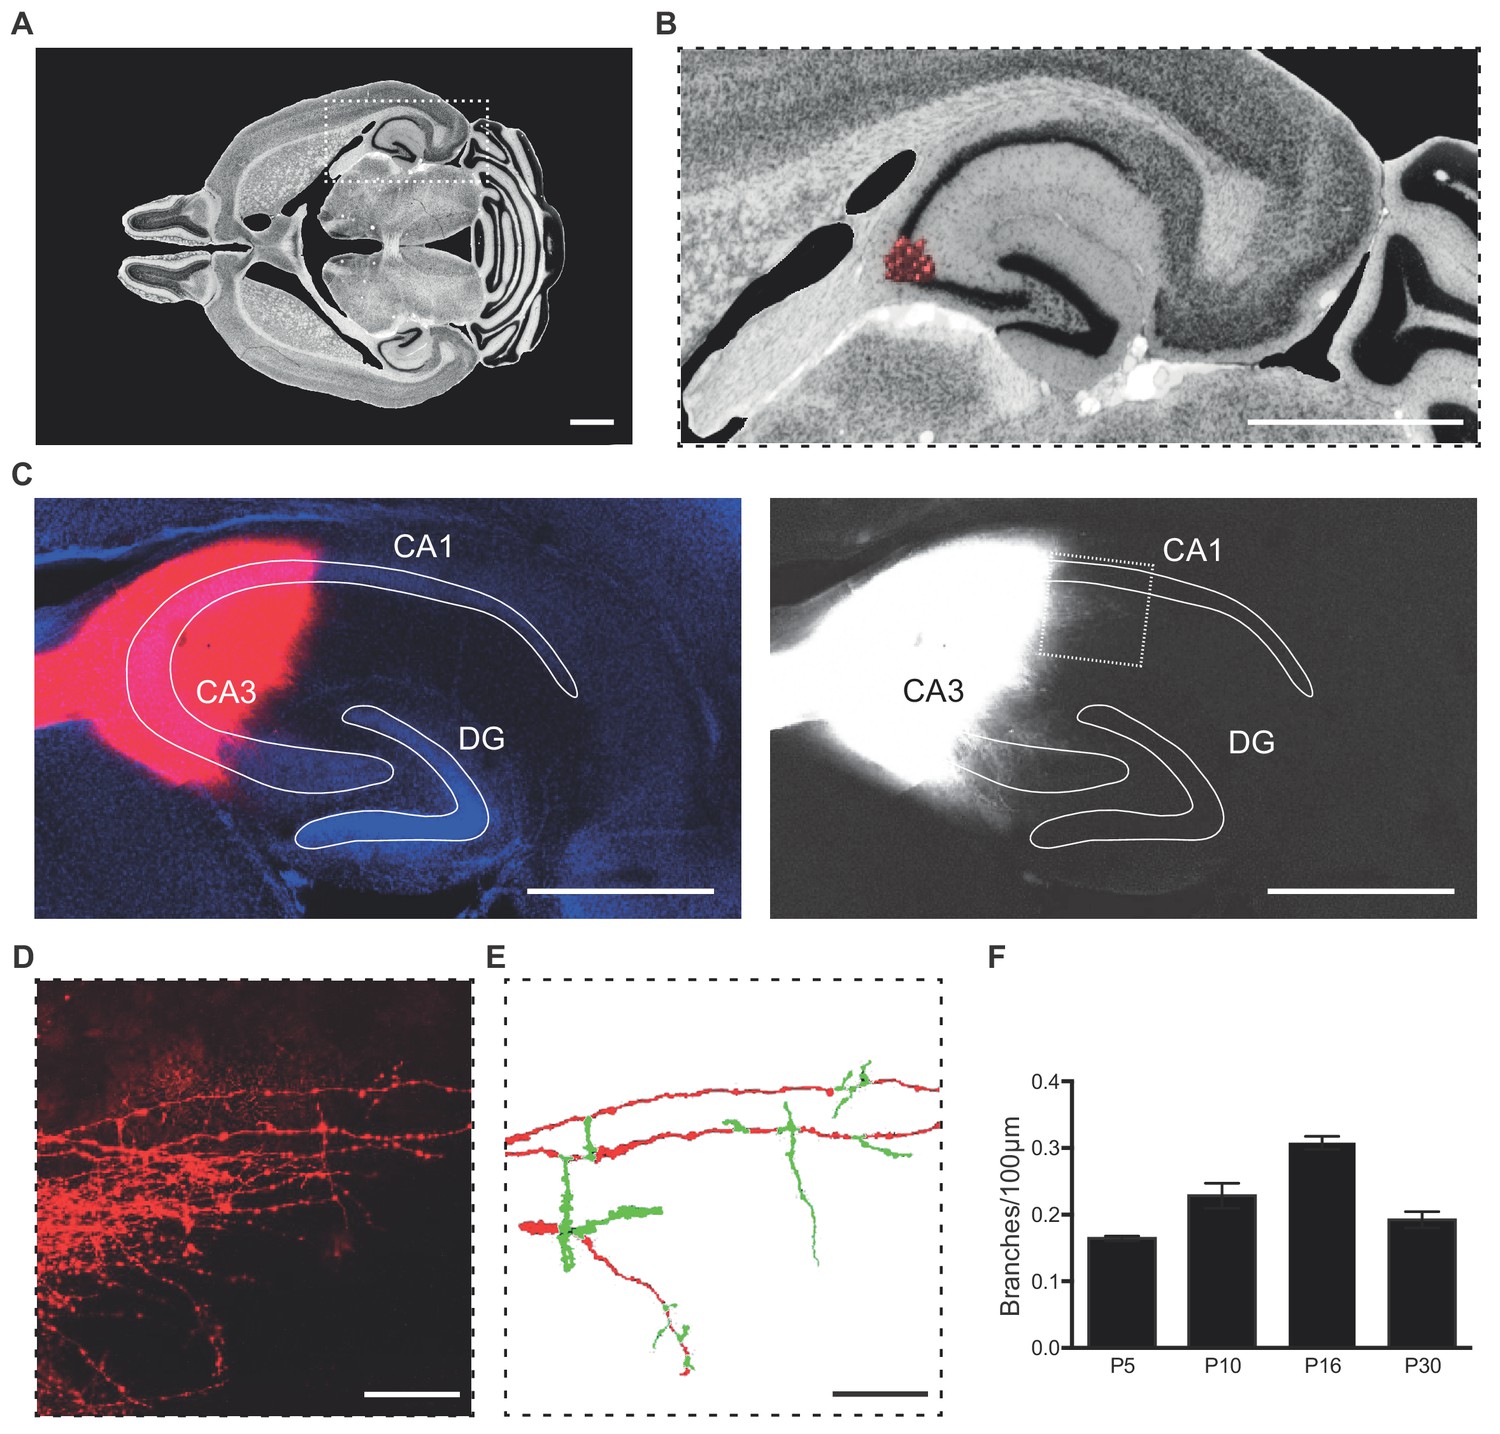
Experimental setup for DiI labeling of CA3 axons in ex vivo slices.
(A–E) Thick horizontal vibratome sections of postnatal brains were prepared (A). A small DiI crystal was placed in the stratum pyramidale of the CA3 region (B). Short incubation with the DiI crystals allowed the labeling of a small number of CA3 axons and the identification of single axon segments and their branches. Labeled CA3 axons were imaged and traced in the stratum radiatum of the CA1 region where they project to (C–E). Pictures were taken from MBL Mouse Brain Atlas (http://www.mbl.org/mbl_main/atlas.html, A,B). Scale bar 1 mm (A,B), 500 µm (C) and 100 µm (D,E). (F) Axon branching of CA3 neurons was analyzed in different postnatal developmental stages of wildtype mice. Data are shown as mean ± SEM from at least three mice.
Figure 5—figure supplement 3
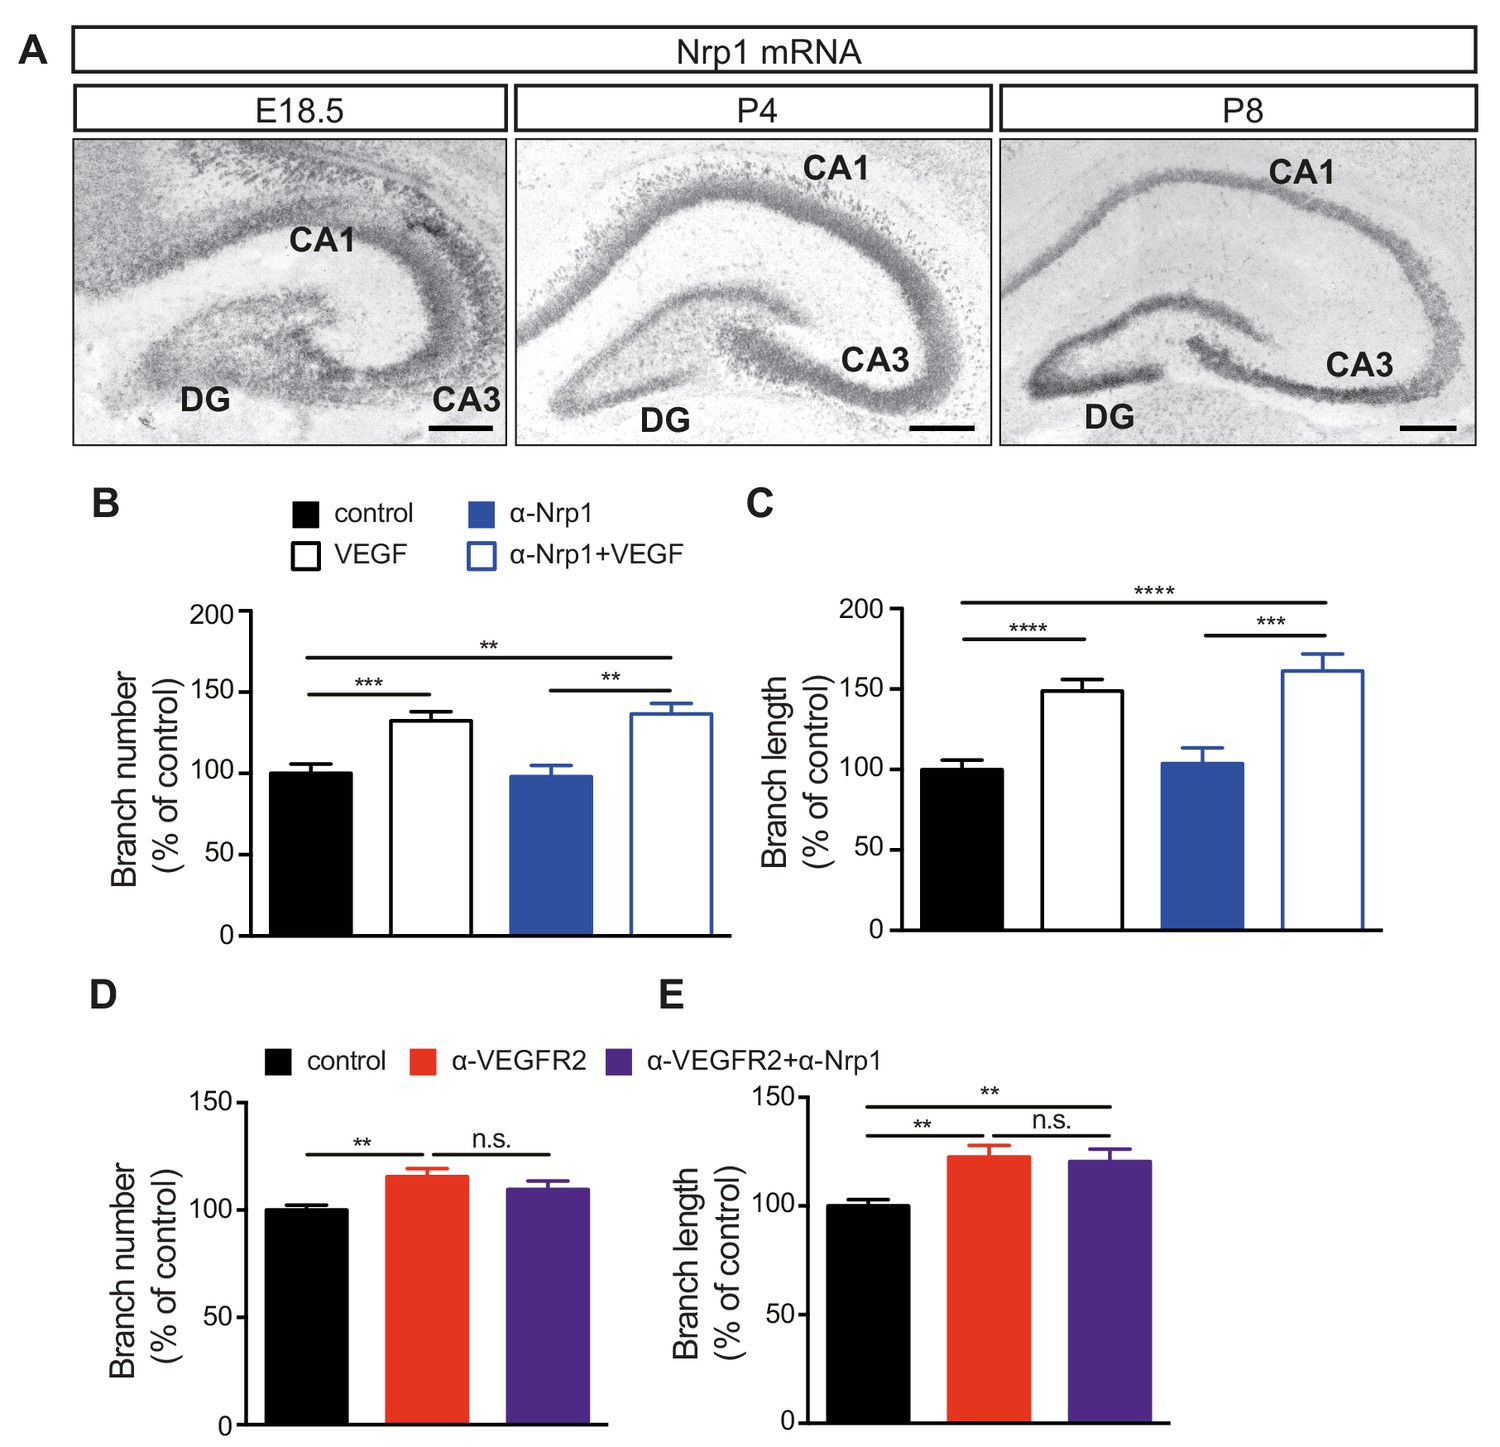
VEGF/VEGFR2-mediated regulation of axon branching does not require Nrp1.
(A) ISH of Nrp1 mRNA in the hippocampus at E18.5, P4 and P8. Scale bars 250 µm. (B,C) Quantification of the branch number (B) and branch length (C) of control and α-Nrp1 treated neurons at 3 DIV. Data are represented as % of control, mean ± SEM, from at least three independent experiments. **p<0.01; ***p<0.001; ****p<0.0001; two-way ANOVA. (D,E) Quantification of the branch number (D) and branch length (E) of control, α-VEGFR2 and α-VEGFR2+α- treated neurons at 3 DIV. Data are represented as % of control, mean ± SEM, from at least seven independent experiments. n.s. not significant; **p<0.01; one-way ANOVA.
-
Figure 5—figure supplement 3—source data 1
Raw data and statistical analysis of graphs of Figure 5—figure supplement 3.
- https://cdn.elifesciences.org/articles/49818/elife-49818-fig5-figsupp3-data1-v1.xlsx
Figure 5—figure supplement 4
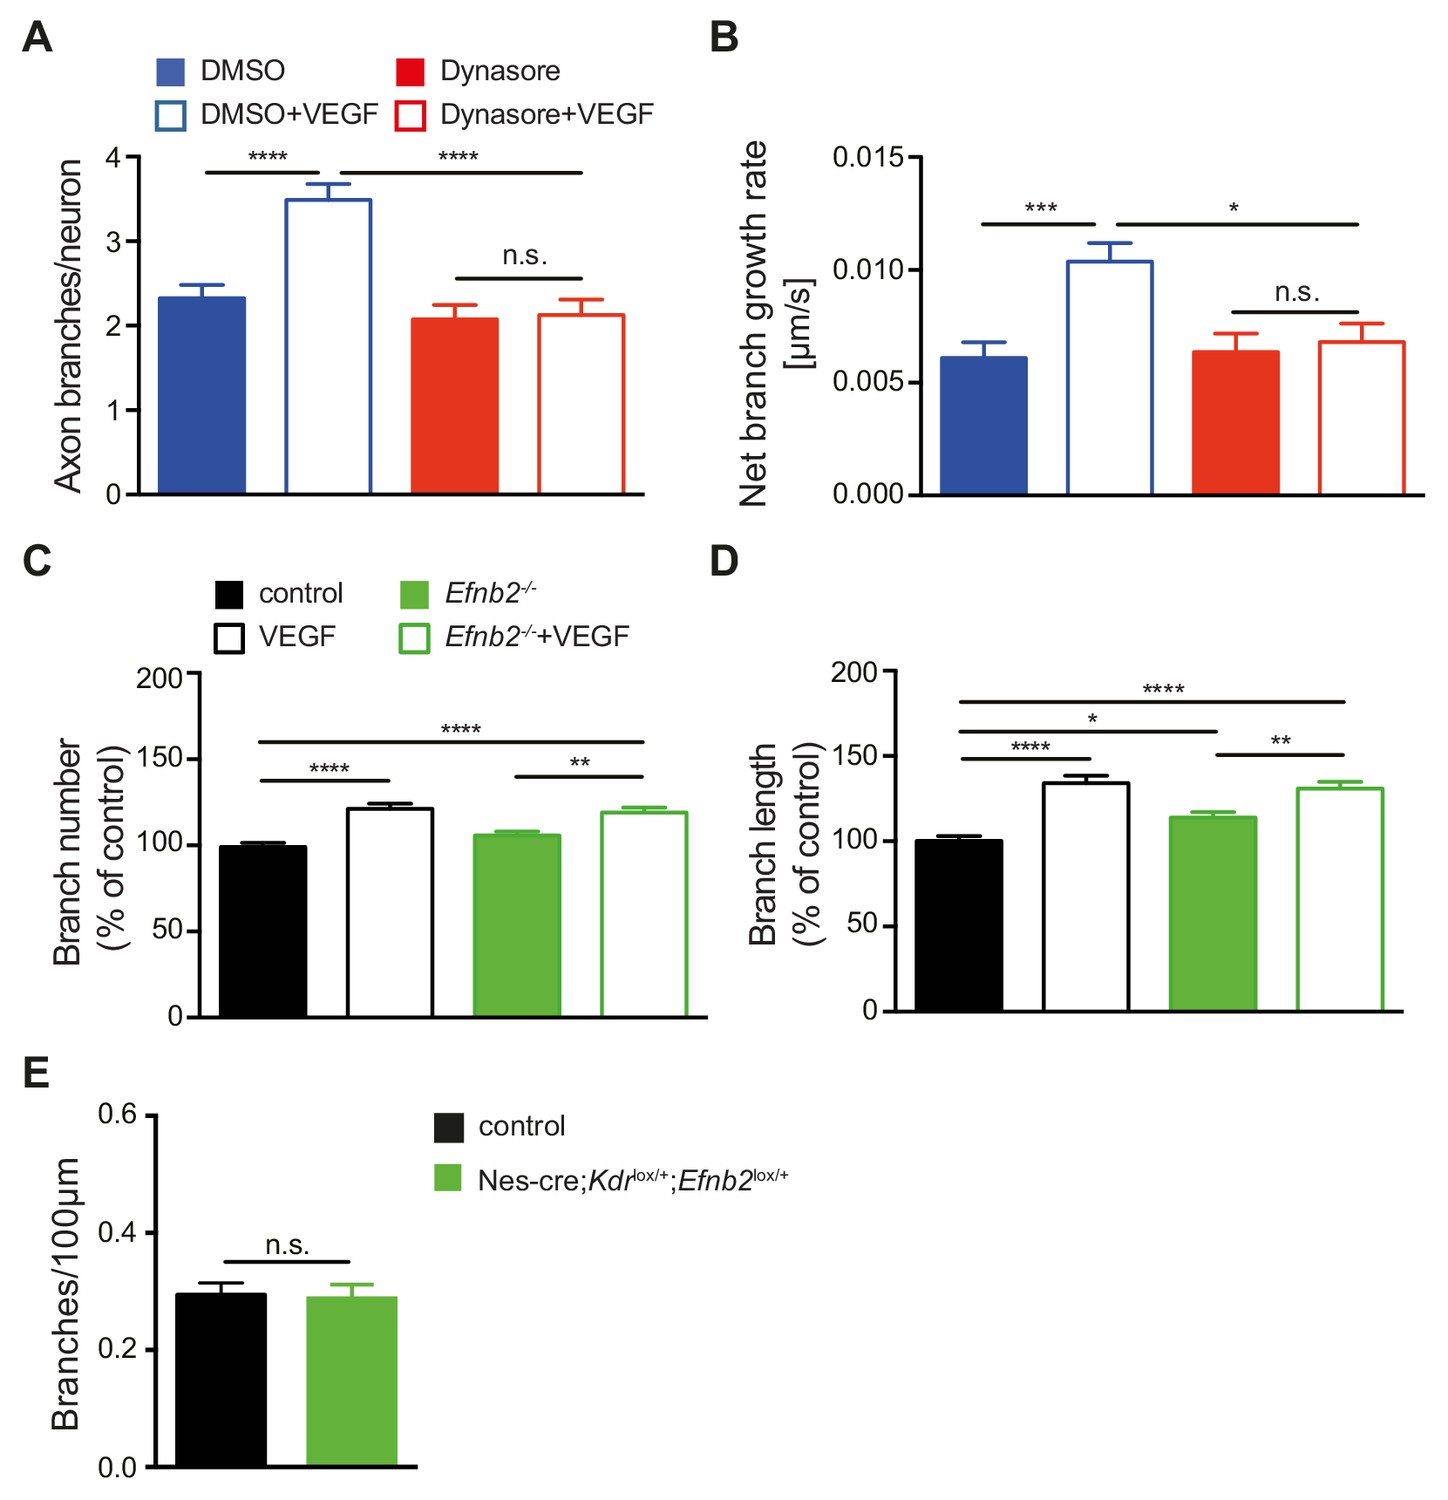
VEGF/VEGFR2-mediated regulation of axon branching requires active endocytosis but not EphrinB2.
(A,B) 1 DIV hippocampal neurons were pre-treated with 80 µM dynasore or equal volume DMSO vehicle control for 30 min and subsequently stimulated with 50 ng/ml VEGF or vehicle control. Time-lapse movies were recorded over the course of 4 hr. The number of extending axon branches was quantified over the course of the movies (A) and the net growth rate of axon branch was calculated (B). Data represents mean ± SEM from 32 neurons, n = 3 independent experiments. n.s. not significant; *p<0.05; ***p<0.001; ****p<0.0001; two-way ANOVA. (C,D) Quantification of the branch number (C) and branch length (D) of control and Efnb2-/- neurons at 3 DIV. Data are represented as % of control, mean ± SEM, from at least five independent experiments. *p<0.05; **p<0.01; ****p<0.0001; two-way ANOVA. (E) CA3 axons from P10 control and Nes-cre;Kdrlox/+;Efnb2lox+- mice were labels using DiI and axon branches were analyzed in CA1 stratum radiatum. Quantification of the axon branch number per 100 µm axon length (E). Data are represented as mean ± SEM from n = 16 control and n = 20 Nes-cre;Kdrlox/+-;Efnb2lox/+- pups of 6 independent litters. n.s. not significant; unpaired Student’s ttest.
-
Figure 5—figure supplement 4—source data 1
Raw data and statistical analysis of graphs of Figure 5—figure supplement 4.
- https://cdn.elifesciences.org/articles/49818/elife-49818-fig5-figsupp4-data1-v1.xlsx
Figure 6 with 1 supplement
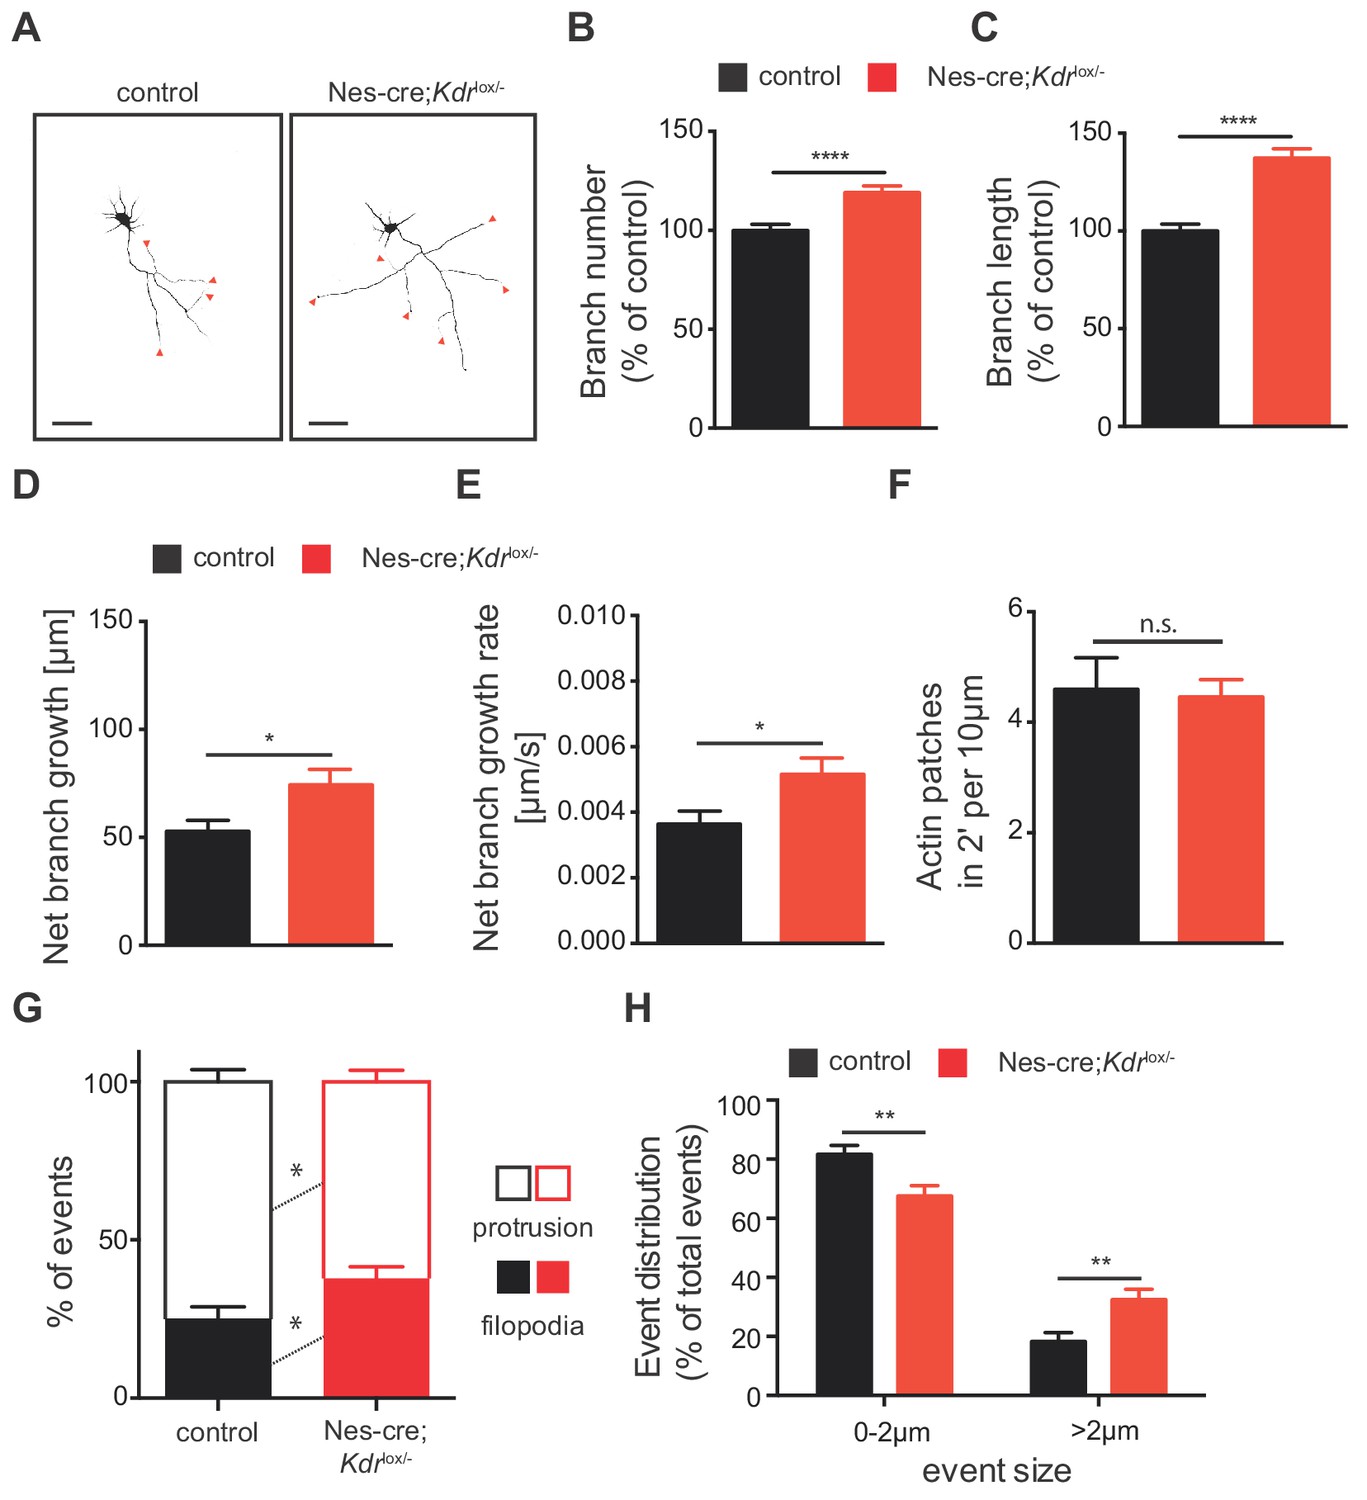
VEGFR2 deficiency in hippocampal neurons promotes axonal branching by increasing filopodia formation.
(A) Representative images of 3 DIV hippocampal neurons isolated from control and Nes-cre;Kdrlox/- embryos and stained beta-III tubulin. Axon branches are indicated by red arrowheads. Scale bars 50 µm. (B,C) Quantification of the axon branch number (B) and branch length (C) of control and Nes-cre;Kdrlox/- neurons at 3 DIV. Data are represented as % of control. Mean ± SEM,>120 neurons from n = 6. ****p<0.0001; unpaired Student’s ttest. (D,E) Time-lapse movies over the course of 4 hr were recorded from 1 DIV hippocampal neurons of control and Nes-cre;Kdrlox/- mice. The net axon branch growth was quantified over the course of the movies (D) and the growth rate of axon branch was calculated (E). Data represents mean ± SEM of at least three independent experiments. *p<0.05; unpaired Student’s ttest. (F) The number of newly forming actin patches during 2 min per 10 µm axon segment was counted in neurons of control and Nes-cre;Kdrlox/- mice. Data represents mean ± SEM of at least three independent experiments. n.s. not significant; unpaired Student’s ttest. (G,H) The number (G) and the size (H) of newly formed protrusions and filopodia was analyzed during the course of 10 min in neurons of control and Nes-cre;Kdrlox/- mice. Data represents mean ± SEM of at least three independent experiments. *p<0.05; **p<0.01; unpaired Student’s ttest.
-
Figure 6—source data 1
Raw data and statistical analysis of graphs of Figure 6.
- https://cdn.elifesciences.org/articles/49818/elife-49818-fig6-data1-v1.xlsx
Figure 6—figure supplement 1
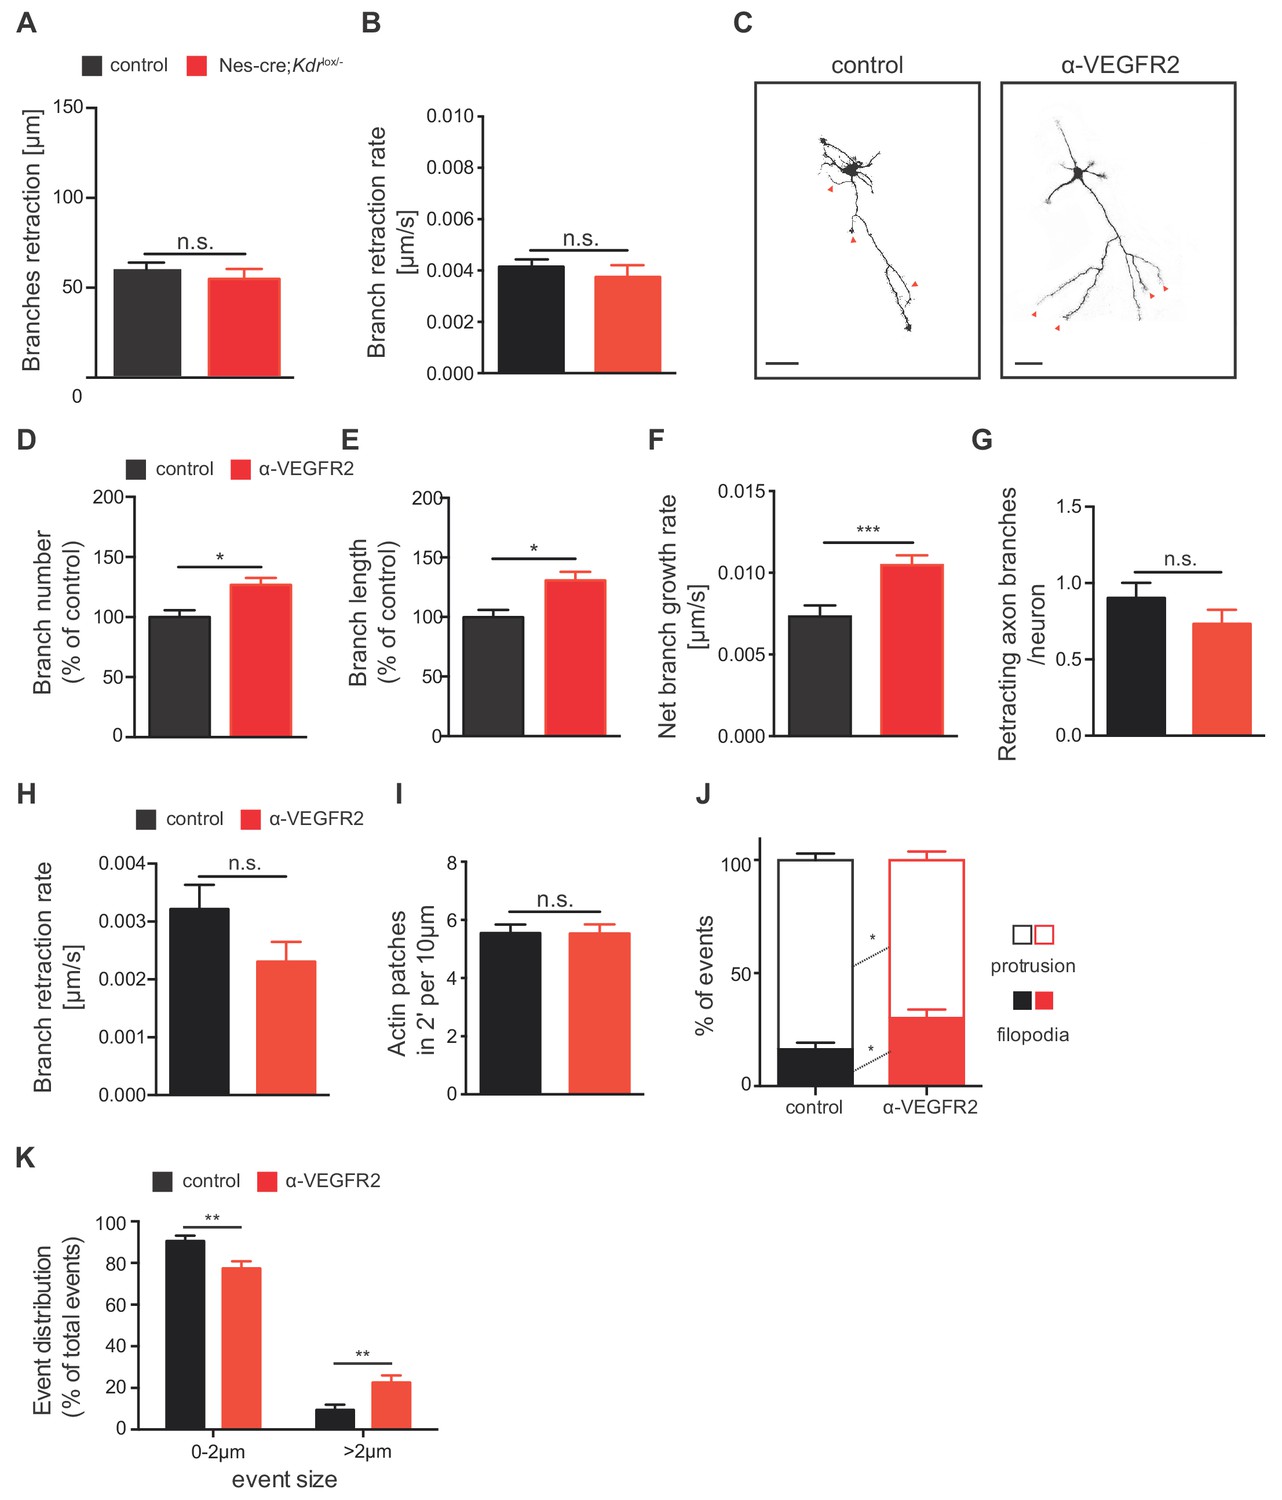
α-VEGFR2 antibody treatment recapitulates the phenotype observed in Nes-cre;Kdrlox/- mice.
(A,B) Data showing the number of retracting axon branches (A) as well as the retraction rate of axon branches (B) from control and Nes-cre;Kdrlox/- mice shown in Figure 6. Data represents mean ± SEM of at least three independent experiments. n.s. not significant; unpaired Student’s ttest. (C) Representative images of beta-III tubulin stained 3 DIV hippocampal neurons treated with control or α-VEGFR2 AB. Axon branches are indicated by red arrowheads. Scale bars 50 µm. (D,E) Quantification of the branch number (D) and branch length (E) of control and α-VEGFR2 AB treated neurons at 3 DIV. Data are represented as % of control, mean ± SEM, from at least three independent experiments. *p<0.05; unpaired Student’s ttest. (F–H) Time-lapse movies over the course of 4 hr were recorded from 1 DIV hippocampal neurons of control and α-VEGFR2 AB treated neurons. The number of retracting axon branches was quantified over the course of the movies (G) and the net growth as well as the retraction rate of axon branch was calculated (F,H). Data represents mean ± SEM of at least three independent experiments. n.s. not significant; ***p<0.01; unpaired Student’s ttest. (I) The number of newly forming actin patches during 2 min per 10 µm axon segment was counted in neurons treated with control and α-VEGFR2 AB. Data represents mean ± SEM of at least three independent experiments. n.s. not significant; unpaired Student’s ttest. (J,K) The number and the size of newly forming protrusions and filopodia was analyzed during the course of 10 min in neurons treated with control and α-VEGFR2 AB. Data represents mean ± SEM of at least three independent experiments. *p<0.05; **p<0.01; unpaired Student’s ttest.
-
Figure 6—figure supplement 1—source data 1
Raw data and statistical analysis of graphs of Figure 6—figure supplement 1.
- https://cdn.elifesciences.org/articles/49818/elife-49818-fig6-figsupp1-data1-v1.xlsx
Figure 7
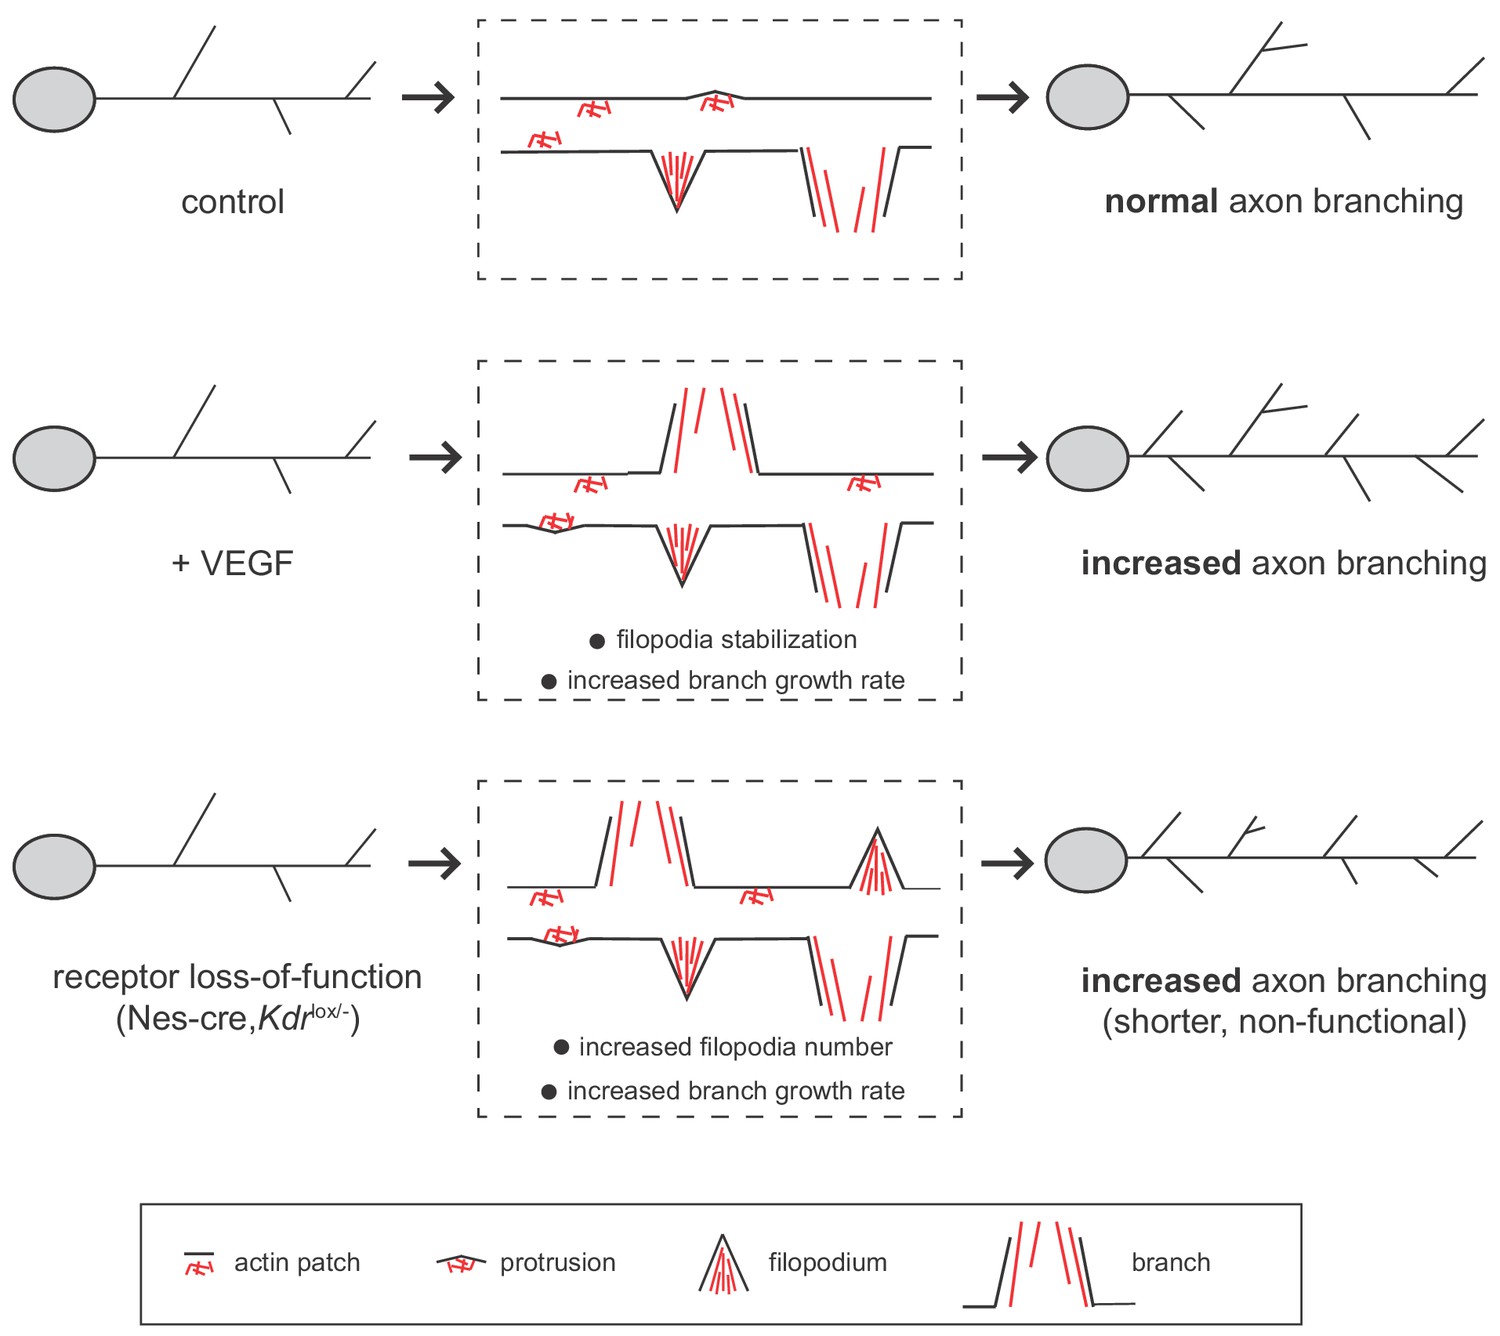
Working model for VEGF/VEGFR2 function in hippocampal axon branching.
VEGF stimulation induces axon branching by promoting the growth of newly formed branches without affecting filopodia formation. Loss-of-functional VEGFR2 also results in increased axon branching, but in this case from an increased number of filopodia and enhanced growth rate. However, in the loss of function situation, the generated branches are shorter and non-functional.
Author response image 1
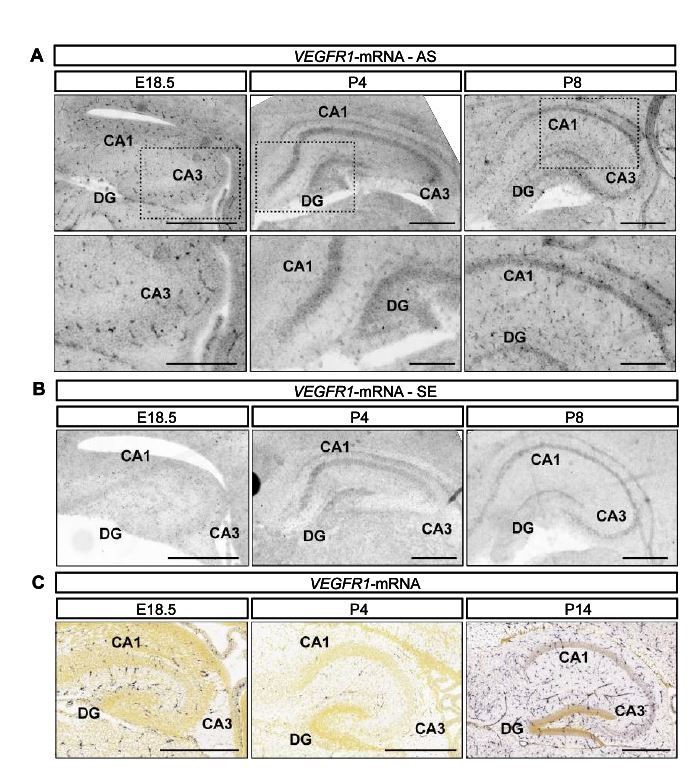
Flt1 is expressed by blood vessels during hippocampal development.
(A, B) Flt1-ISH was performed in the mouse hippocampus at E18.5, P4 and P8 developmental stages. Antisense (AS, in A) and sense (SE, in B) signals are shown. CA1 and CA3 hippocampal areas, as well as the DG are indicated. Lower panel in A) shows higher magnification inserts. Scale bars 500 µm (A – higher panel and B) and 250 µm (A – lower panel). C) Flt1-ISH from the Allen Brain Atlas, showing AS signal in the hippocampus at E18.5, P4 and P14. Scale bars 500 µm.
Author response image 2
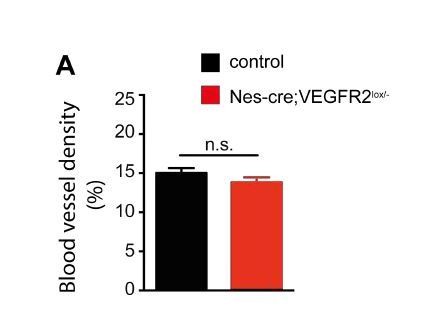
Neuronal loss of VEGFR2 does not affect blood vessel density in the hippocampus.
(A) Blood vessels were stained using Isolectin-B4 at P10 in control and Nes-cre;Kdrlox/-animals. The area of Isolectin-B4-positive signal was quantified using ImageJ and normalized to the hippocampal area. Data are represented as mean ± SEM, >15 neurons from n=4 animals. n.s. not significant; unpaired Student’s t-test.
Author response image 3
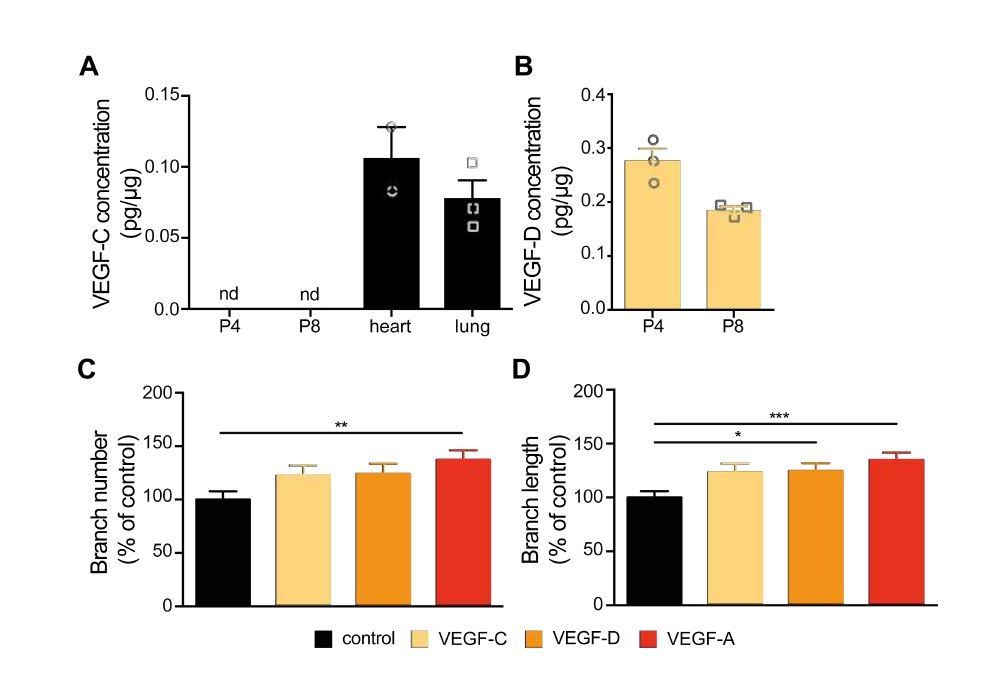
VEGF-C and VEGF-D do not show the same growth promoting effect on hippocampal axon branches as VEGF-A.
(A, B) Hippocampal tissue was collected from mice at P4 and P8 stages. Heart and lung tissue was collected from adult mice. The concentration of VEGF-C (A) and VEGF-D (B) was measured in whole tissue lysates using ELISA. Data are represented as mean ± SEM, n>2 independent animals. nd not detectable. (C, D) 1 DIV hippocampal neurons were stimulated with 100 ng/ml VEGF-C, VEGF-D, VEGF-A or vehicle control for 48h. The number of axonal branches (C) and the average branch length (D) were analyzed. Data are represented as% of non-stimulated control. Mean ± SEM, >79 neurons from n=3 independent experiments. *p<0.05; **p<0.001; ***p<0.0001; one-way ANOVA.
Tables
Key resources table
| Reagent type (species) or resource | Designation | Source or reference | Identifier | Additional information |
|---|---|---|---|---|
| Genetic reagent (Mus musculus) | Kdrlox/lox | Haigh et al., 2003 | ||
| Genetic reagent (Mus musculus) | Nestin-cre | Tronche et al., 1999 | ||
| Genetic reagent (Mus musculus) | Vegfr2-GFP | Ema et al., 2006 | ||
| Genetic reagent (Mus musculus) | Efnb2lox/lox | Grunwald et al., 2004 | ||
| Antibody | rabbit anti-GFP polyclonal antibody | Invitrogen | Cat# A11122 RRID:AB_221569 | 1:200 IF |
| Antibody | chicken anti-GFP polyclonal antibody | Aves | Cat# GFP-1020 RRID:AB_10000240 | 1:200 IF |
| Antibody | rabbit anti-GFAP polyclonal antibody | Dako | Cat# Z0334 RRID:AB_10013382 | 1:100 IF |
| Antibody | mouse anti-NeuN monoclonal antibody | Millipore | Cat# MAB377 RRID:AB_2298772 | 1:50 IF |
| Antibody | rat anti-L1 monoclonal antibody | Millipore | Cat# MAB5272 RRID:AB_2133200 | 1:100 IF |
| Antibody | rabbit anti-Calretinin polyclonal antibody | Millipore | Cat# MAB5054 | 1:500 IF |
| Antibody | goat anti-Nrp1 polyclonal antibody | R and D | Cat# AF566 RRID:AB_355445 | 2 µg/ml for functional blocking |
| Antibody | goat anti-VEGFR2 polyclonal antibody | R and D | Cat# AF644 RRID:AB_355500 | 1:15 IF |
| Antibody | rabbit anti-VEGFR2 monoclonal antibody | Cell Signaling | Cat# 2479 RRID:AB_2212507 | 1:1000 WB |
| Antibody | rabbit anti-(phospho)VEGFR2 (Y1175) | Cell Signaling | Cat# 2478 RRID:AB_331377 | 1:500 WB |
| Antibody | rabbit anti-(phospho)SFK (Y416) monoclonal antibody | Invitrogen | Cat# 44660G RRID:AB_2533714 | 1:200 IF |
| Antibody | mouse anti-beta-III-tubulin monoclonal antibody | Sigma | Cat# T5076 RRID:AB_532291 | 1:150 IF |
| Antibody | goat anti-VE-Cadherin polyclonal antibody | R and D | Cat# AF1002 RRID:AB_2077789 | 1:1000 WB |
| Antibody | donkey anti-rabbit Alexa488 polyclonal antibody | Jackson Immunoresearch | Cat# 711-545-152 RRID:AB_2313584 | 1:1000 IF |
| Antibody | donkey anti-rabbit Alexa568 polyclonal antibody | Life Technologies | Cat# A10042 RRID:AB_2534017 | 1:1000 IF |
| Antibody | donkey anti-goat Alexa568 polyclonal antibody | Molecular Probes | Cat# A11057 RRID:AB_142581 | 1:1000 IF |
| Antibody | goat anti-mouse Alexa568 polyclonal antibody | Invitrogen | Cat# A11031 RRID:AB_144696 | 1:1000 IF |
| Antibody | goat anti-rat Alexa568 polyclonal antibody | Invitrogen | Cat# A11077 RRID:AB_2534121 | 1:1000 IF |
| Antibody | goat anti-chicken Alexa488 polyclonal antibody | Molecular Probes | Cat# A11039 RRID:AB_142924 | 1:1000 IF |
| Antibody | donkey anti-goat HRP polyclonal antibody | Jackson Immunoresearch | Cat# 705-035-147 RRID:AB_2313587 | 1:1000 IF |
| Antibody | donkey anti-rabbit HRP polyclonal antibody | Jackson Immunoresearch | Cat# 711-035-152 RRID:AB_10015282 | 1:1000 IF |
| Antibody | donkey anti-mouse HRP polyclonal antibody | Jackson Immunoresearch | Cat# 715-035-150 RRID:AB_2340770 | 1:1000 IF |
| Chemical compound, drug | Phalloidin-TRITC | Sigma | Cat# P1951 RRID:AB_2315148 | 1:400 IF |
| Chemical compound, drug | dynasore | Selleckchem | Cat# S8047 | 80 µM for functional blocking |
| Chemical compound, drug | DiI lipophilic tracer dye | Molecular Probes | Cat# D-3911 | |
| Chemical compound, drug | PP2 | Calbiochem | Cat# 529573 | 1 µM for functional blocking |
| Chemical compound, drug | PP3 | Calbiochem | Cat# 529574 | 1 µM for functional blocking |
| Recombinant DNA reagent | UtrCH-mCherry plasmid | Burkel et al., 2007 | ||
| Recombinant DNA reagent | hVEGFR2-GFP fusion plasmid | |||
| Commercial assay or kit | VEGF ELISA kit | R and D | Cat# MMV00 |
Additional files
Download links
A two-part list of links to download the article, or parts of the article, in various formats.
Downloads (link to download the article as PDF)
Open citations (links to open the citations from this article in various online reference manager services)
Cite this article (links to download the citations from this article in formats compatible with various reference manager tools)
VEGF/VEGFR2 signaling regulates hippocampal axon branching during development
eLife 8:e49818.
https://doi.org/10.7554/eLife.49818


