Discovery proteomics in aging human skeletal muscle finds change in spliceosome, immunity, proteostasis and mitochondria
- National Institute on Aging, National Institutes of Health, United States
- Johns Hopkins Medical Institute, United States
Figures
Figure 1 with 5 supplements
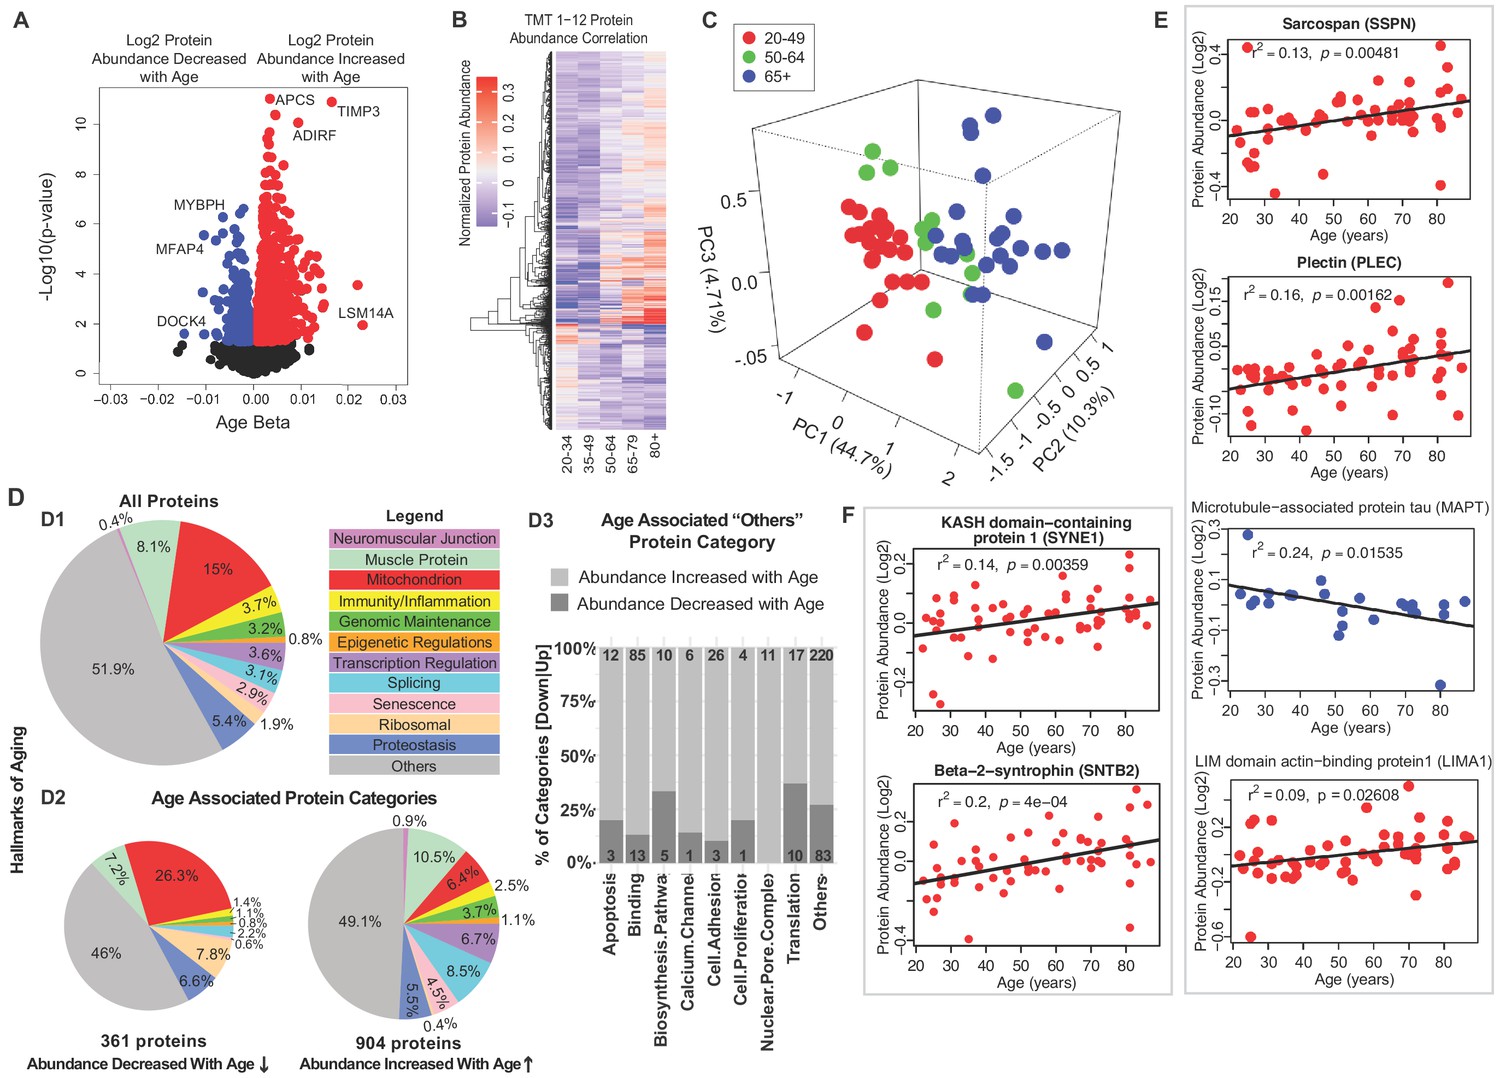
Classification of age-associated proteins.
(A) Effect of age on protein expression levels. The x-axis represents the size and sign of the beta coefficient of the specific protein regressed to age (adjusted for covariates) and the y-axis represents the relative -log10 p-value. Each dot is a protein and all significant proteins are indicated in blue and red (age-associated 1265 proteins, p<0.05). (B) The heatmap of the 1265 significantly age-associated proteins reveals changing expression profiles across aging. (C) PLS analysis of age-associated proteins were classified into three age groups: 20–49 (young), 50–64 years (middle age), and 65+ (old) years old. (D) Percent distribution of categories of all quantified proteins, percent distribution of the same categories among proteins that were significantly downregulated and upregulated with aging. Proteins which are not considered directly related to mechanisms of aging are annotated as others and their subclassification is shown in the bar plot. (E–F) Log2 protein abundance of contractile, architectural and NMJ proteins. Simple linear regression was shown for age (x-axis) and protein (y-axis) correlation, confounders were not adjusted, and raw p-values were shown.
-
Figure 1—source data 1
Baseline characteristics of the GESTALT skeletal muscle participants.
Participants are classified into five different age groups. Gender: M is Male, F is Female; the number of participants is indicated. Age is indicated in years as mean and standard deviation (SD ±) for each age group. Race: number of participants is shown on the left and race is shown in italics; C is Caucasian, AA is African American, and A is Asian. Body Mass Index (BMI) is expressed as mean and SD (±) for each group. p-Value is calculated by one-way ANOVA with Kruskal-Wallis test. Race is analyzed by Chi-square test. *p-Value calculated from linear regression model, gender adjusted. ± Knee Extension Isokinetic Strength (KEIS) (300/sec; Nm). †Physical activity is calculated from self-report involvement in weight circuit, vigorous exercise, brisk walking and casual walking and summed as high-intensity physical activity hours per week. This is further categorized into 0 (not active), 1 (moderately active), 2 (active), and 3 (highly active) and expressed as mean of categorical variables (0,1,2,3) ± SD.
- https://doi.org/10.7554/eLife.49874.009
-
Figure 1—source data 2
Characteristics of participants.
- https://doi.org/10.7554/eLife.49874.010
-
Figure 1—source data 3
Complete protein dataset of skeletal muscle proteome quantified by TMT6plex.
Sheet1: Description of the column headers and information for the sheets. Sheet2: Sample details (age, gender, race) and TMT labeling information. Sheet3: Raw data of all the proteins quantified and analyzed in this manuscript. Sheet4-Sheet15: Lists of proteins quantified for each TMT experiment from Scaffold Q+ analysis.
- https://doi.org/10.7554/eLife.49874.011
-
Figure 1—source data 4
Complete peptide dataset of skeletal muscle proteome quantified by TMT6-plex.
Sheet 1: Description of the column headers and information for the sheets. Sheet 2: Sample details (age, gender, race) and TMT labeling information. Sheet 3: Raw data of all the proteins quantified and analyzed in this manuscript. Sheet 4-Sheet 15: Lists of peptides quantified for each TMT experiment from Scaffold Q+ analysis.
- https://doi.org/10.7554/eLife.49874.012
-
Figure 1—source data 5
Dysregulated proteins with age.
Sheet 1. Age-associated proteins. Proteins which were significantly (p<0.05) dysregulated with age. Sheet 2. Description of the column headers for the sheet1.
- https://doi.org/10.7554/eLife.49874.013
Figure 1—figure supplement 1
Quantitative analysis of the skeletal muscle proteome with healthy aging.
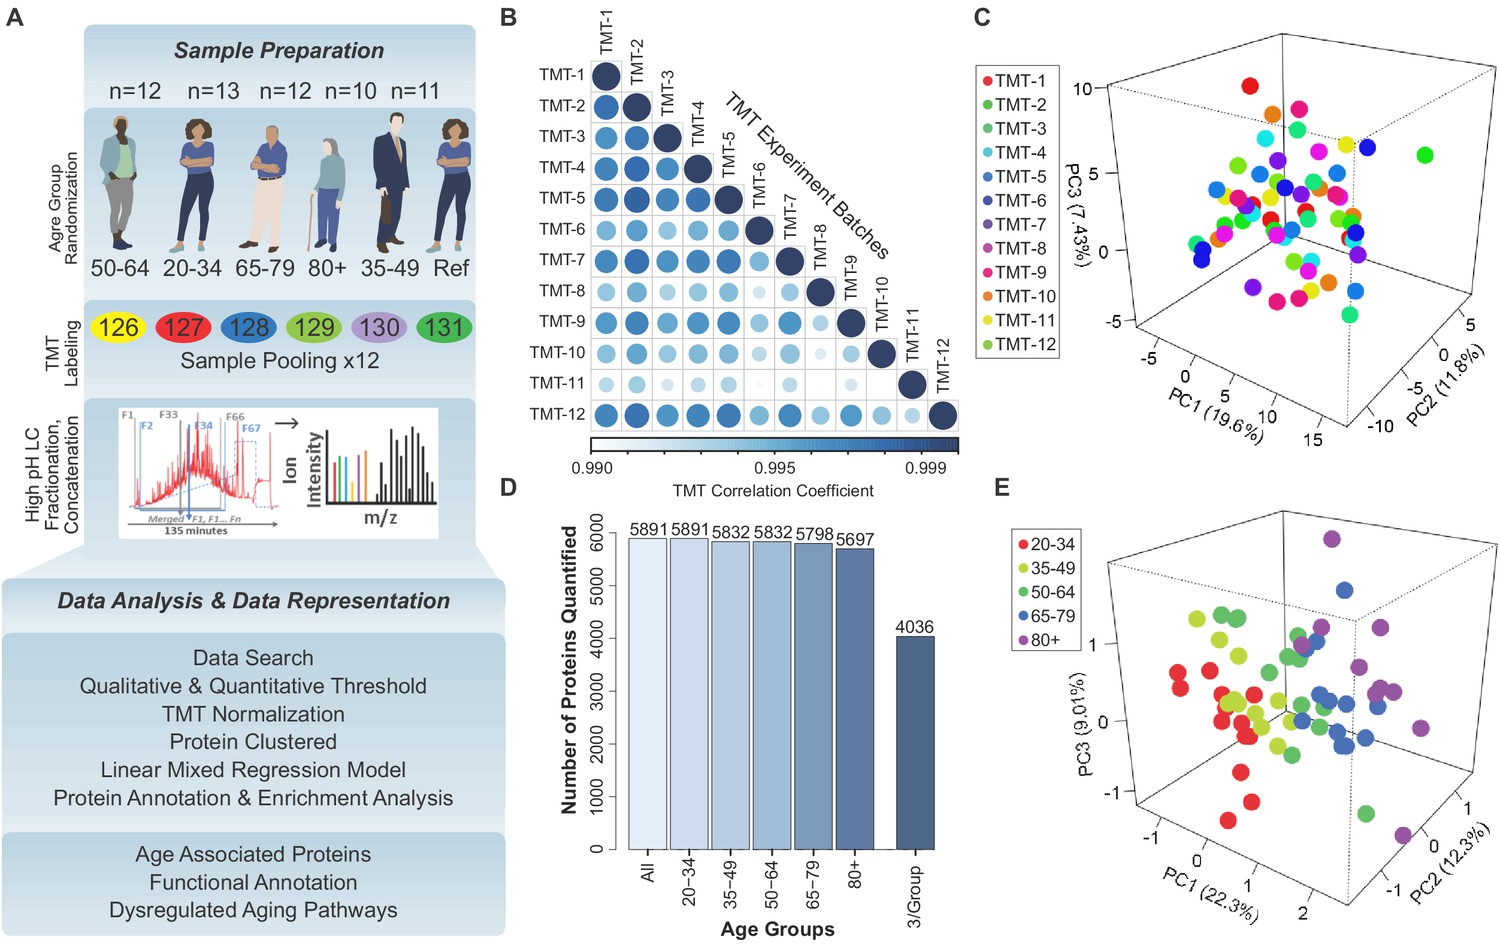
(A) Study design, TMT assessment, and bioinformatics platform for protein quantification and age-associated protein analysis. (B) Correlation among all TMTs after using COMBAT experimental bias correction. Note that the R-values are all >0.99. (C) Principal Component Analysis (PCA) of 12 TMT batches, each circle indicating a sample from a TMT batch, five samples in each batch, overall 58 samples represented, and no substantial batch effect detectable. (D) Total number of proteins quantified from 12 TMT experiments from 58 donors, according to age group. 4036 proteins were detected in at least three samples in all age groups and were used for further statistical analysis. (E) Partial Least Square (PLS) analysis revealed variance in the component1, 2, and three for all donors. All 4036 proteins were used for PLS analysis, where each circle is a donor and the age groups are color-coded.
Figure 1—figure supplement 2
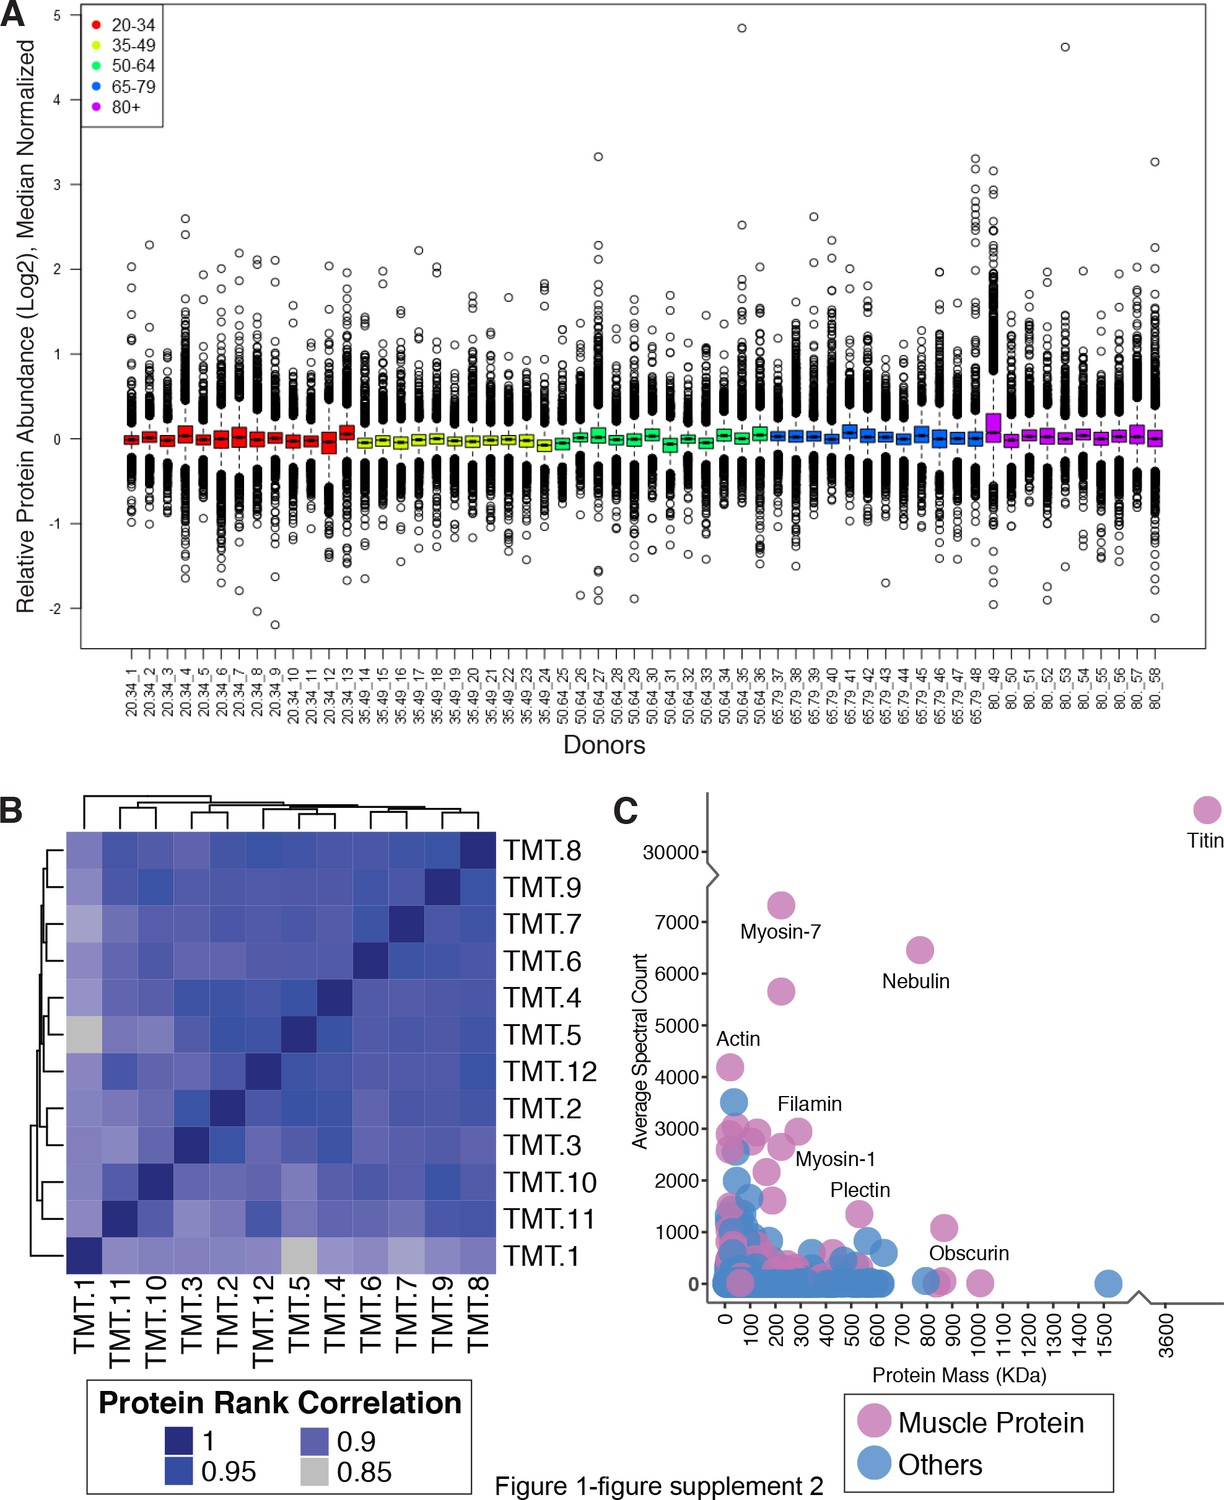
Quantitative analysis of muscle proteome.
(A) Normalized relative protein expression from all participants. Bar plot of log2 normalized protein relative expression abundance from all 58 participants. Each circle is a protein. Median levels for all proteins (5891) from all samples are plotted, 25th and 75th percentiles are represented with first and third quartiles. Age groups are color-coded. This analysis was followed by a median polish and median sweep normalization by subtracting the spectrum median log2 intensity from the observed log2 spectrum intensities. (B) Spectral Count Correlation Across 12 TMT Experiments. The heatmap figure shows the protein correlation across all 12 TMT experiments. Since we have 12 TMT batches across all samples, we looked at the data robustness across all 12 TMTs. The proteins identified in each TMT are ranked based on spectral abundance, and the ranks between TMTs are correlated. Correlation coefficients between 12 TMT experiments are from 0.99 to 0.85, demonstrating that the relative abundance of proteins is robustly replicated across TMT sets. (C) Skeletal Muscle Proteins Detected According to Abundance and Mass. The abundance of proteins quantified, the x-axis is the mass distribution of the protein and the y— axis is the average spectral abundance of the proteins. Proteins are color-coded to visualize enrichments of muscle protein.
Figure 1—figure supplement 3
Muscle proteins and robustness of age association.
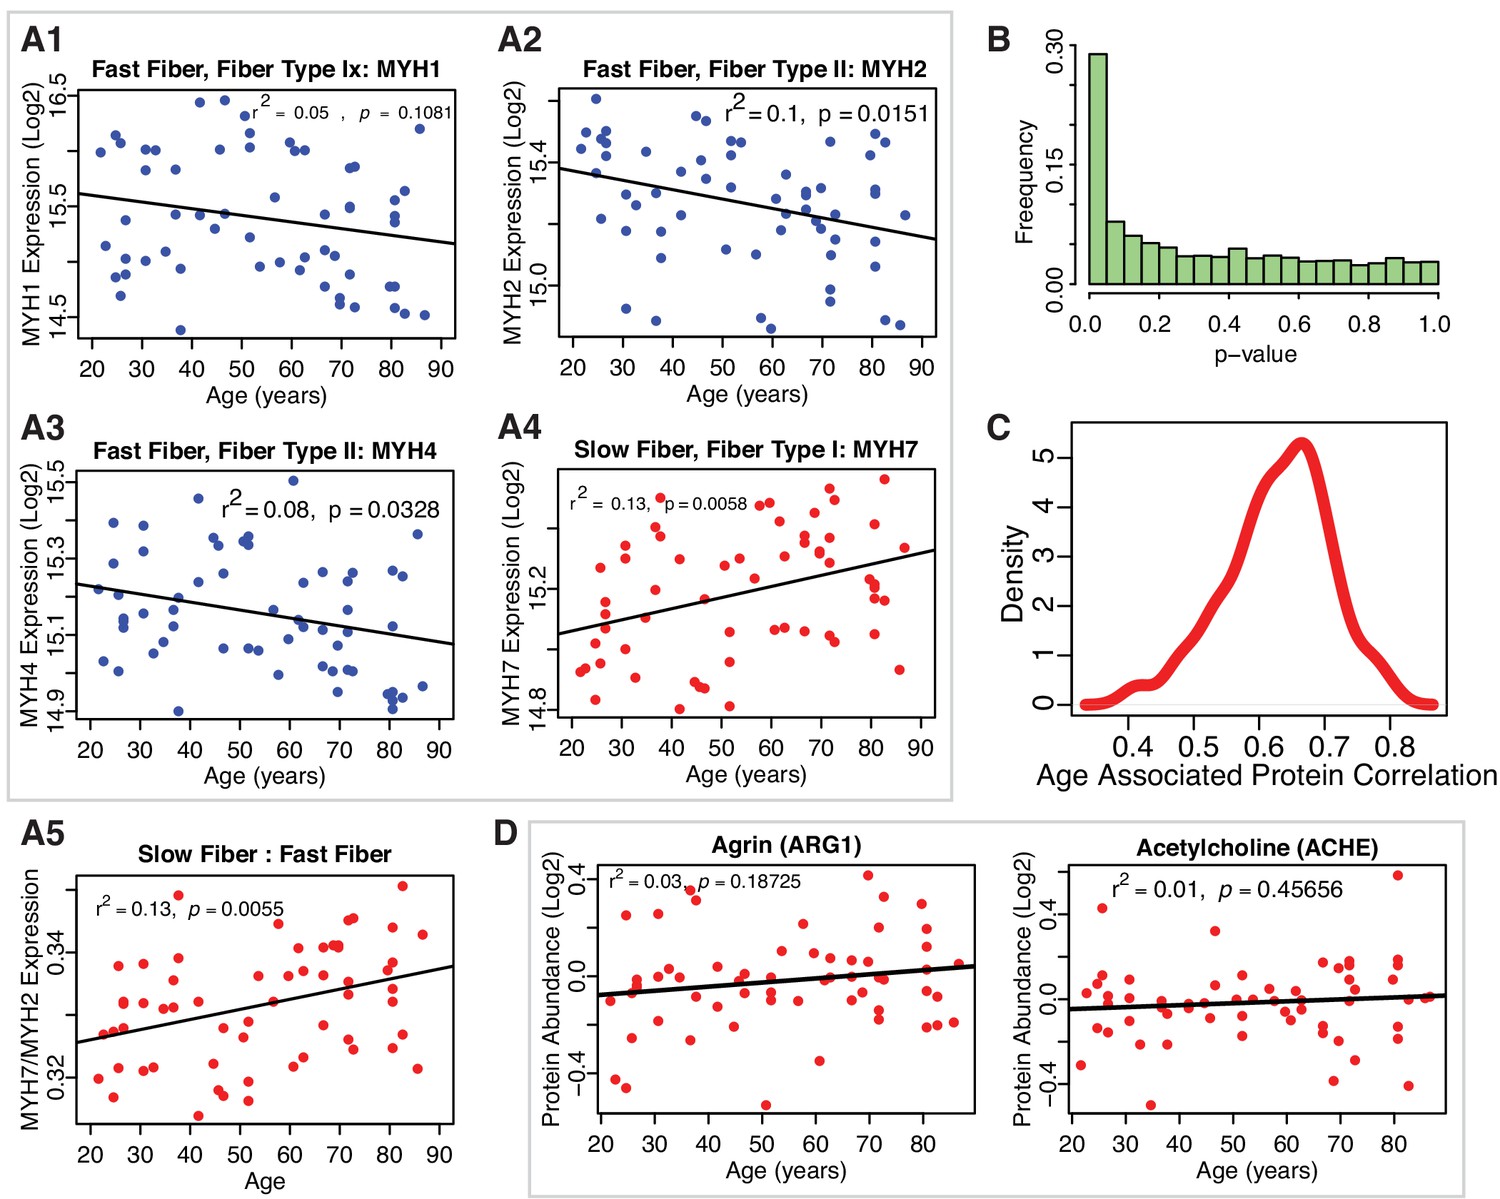
(A1-A5) Protein biomarkers of slow-twitch and fast-twitch fiber types and estimated muscle fiber ratios. Log2-normalized fiber expression intensity from all the 58 donors are shown for fast fiber-twitch type proteins MYH4, MYH1, MYH2 and slow-twitch fiber type protein MYH7 (A1–A4). The estimated ratios of slow-twitch fiber to fast-twitch fiber (A5) suggest that slow-twitch fiber type expression increases with age. (B) Statistical ignificance of the proteins and robustness of age-association. p-Value distribution for quantified proteins and their association with age. The p-values are calculated from t-tests use Satterthwaite's approximations of the F-statistics using lmerTest. To account for multiple comparisons, we performed a Benjamini-Hochberg (BH) correction, and we still found 917 proteins that have a BH corrected p-value<0.1 . (C) Robustness of the estimated beta coefficients for age for quantified proteins across all 12 TMT experiments. To assess the robustness in the identification of the 1265 age-associated proteins across all 12 TMT experiments, we estimated the effect of age (beta coefficient) on single proteins in regression analyses run in two separate sets of 6 TMT sets selected at random from the 12 available and estimated the average correlation coefficient between proteins quantified in the two sets. Then, we repeated this analysis 100 times and plotted the distribution of correlation coefficients. The results of the linear mixed models appear to be robust against TMT variability. (D) Clusters of proteins dysregulated with aging- NMJ related Proteins. Neuromuscular protein abundance with age. Agrin and Acetylcholineesterase proteins are not significantly associated with age.
Figure 1—figure supplement 4
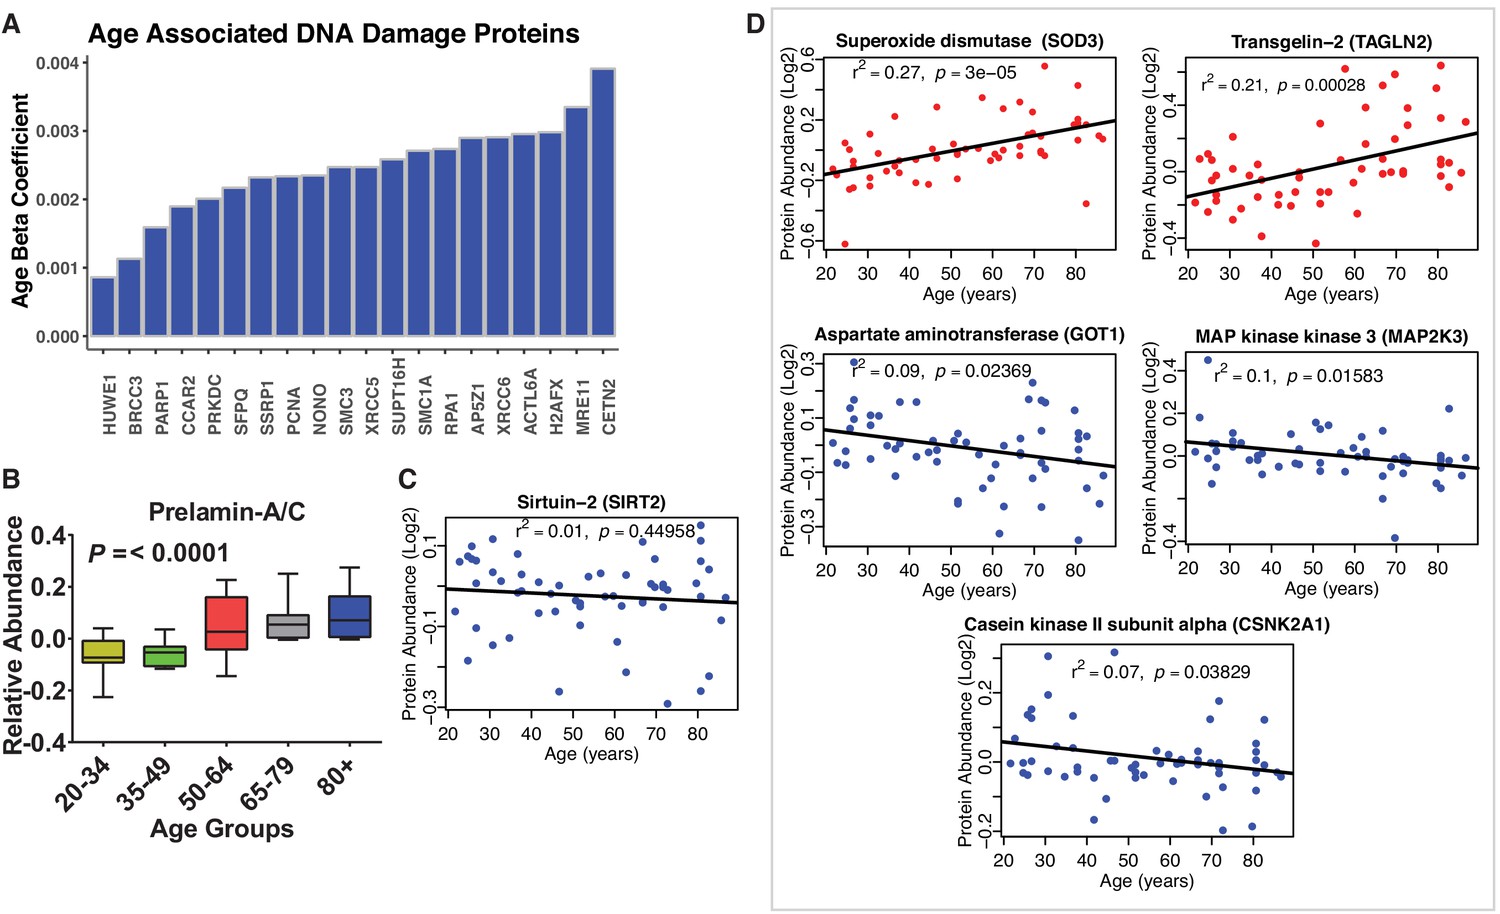
Disregulation of proteins involved in genomic maintenance and cellular senesncence.
(A) Dysregulation of proteins involved in genomic maintenance. A large number of proteins involved in genetic maintenance are overrepresented at older ages. (B) Prelamin. Protein levels increase significantly with age. (C) Sirtuin 2. Raw protein abundance of SIRT2 is plotted according to age and shows no age association. However, adjusting for confounders the negative association with age becomes statistically significant (p=0.032). (D) Dysregulation of proteins involved in cellular senescence. Age-associated proteins of cellular senescence. Log2 raw protein abundance and age correlation is shown from simple linear regression method. Unadjusted p-values are represented with r2.
Figure 1—figure supplement 5
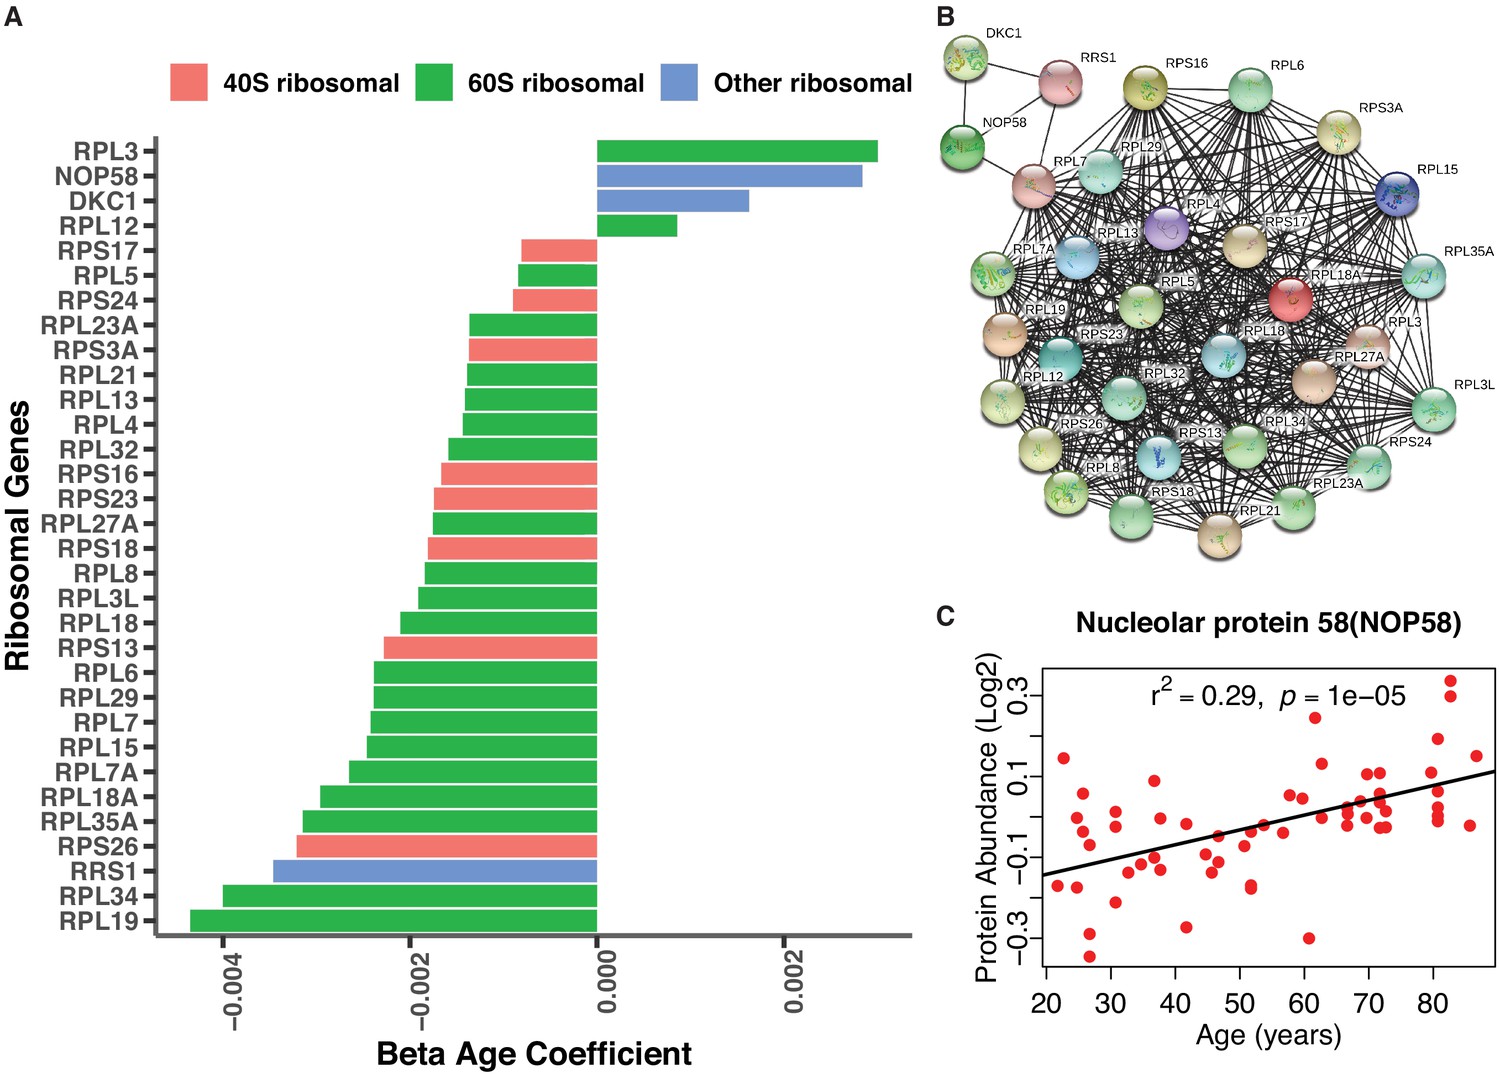
Age-associated ribosomal biogenesis proteins.
(A) Depletion of ribosomal proteins with age. Age-associated ribosome proteins and interacting partners. Different categories of ribosome proteins are color-coded. (B) Protein-protein interaction of age-associated ribosome proteins from co-expression. The protein-protein interaction enrichment score p-value<1.0e-16. Color node shows query proteins and black edge represent co-expressed protein association. The top left cluster NOP58 is required for the biogenesis of the 60S ribosomal subunit and the biogenesis of box C/D snoRNAs such as U3, U8 and U14 snoRNA. (C) Log2 raw protein abundance of NOP58, a nucleolar protein important for ribosomal biogenesis, according to age. Unadjusted p-value is shown with r2.
Figure 2 with 1 supplement
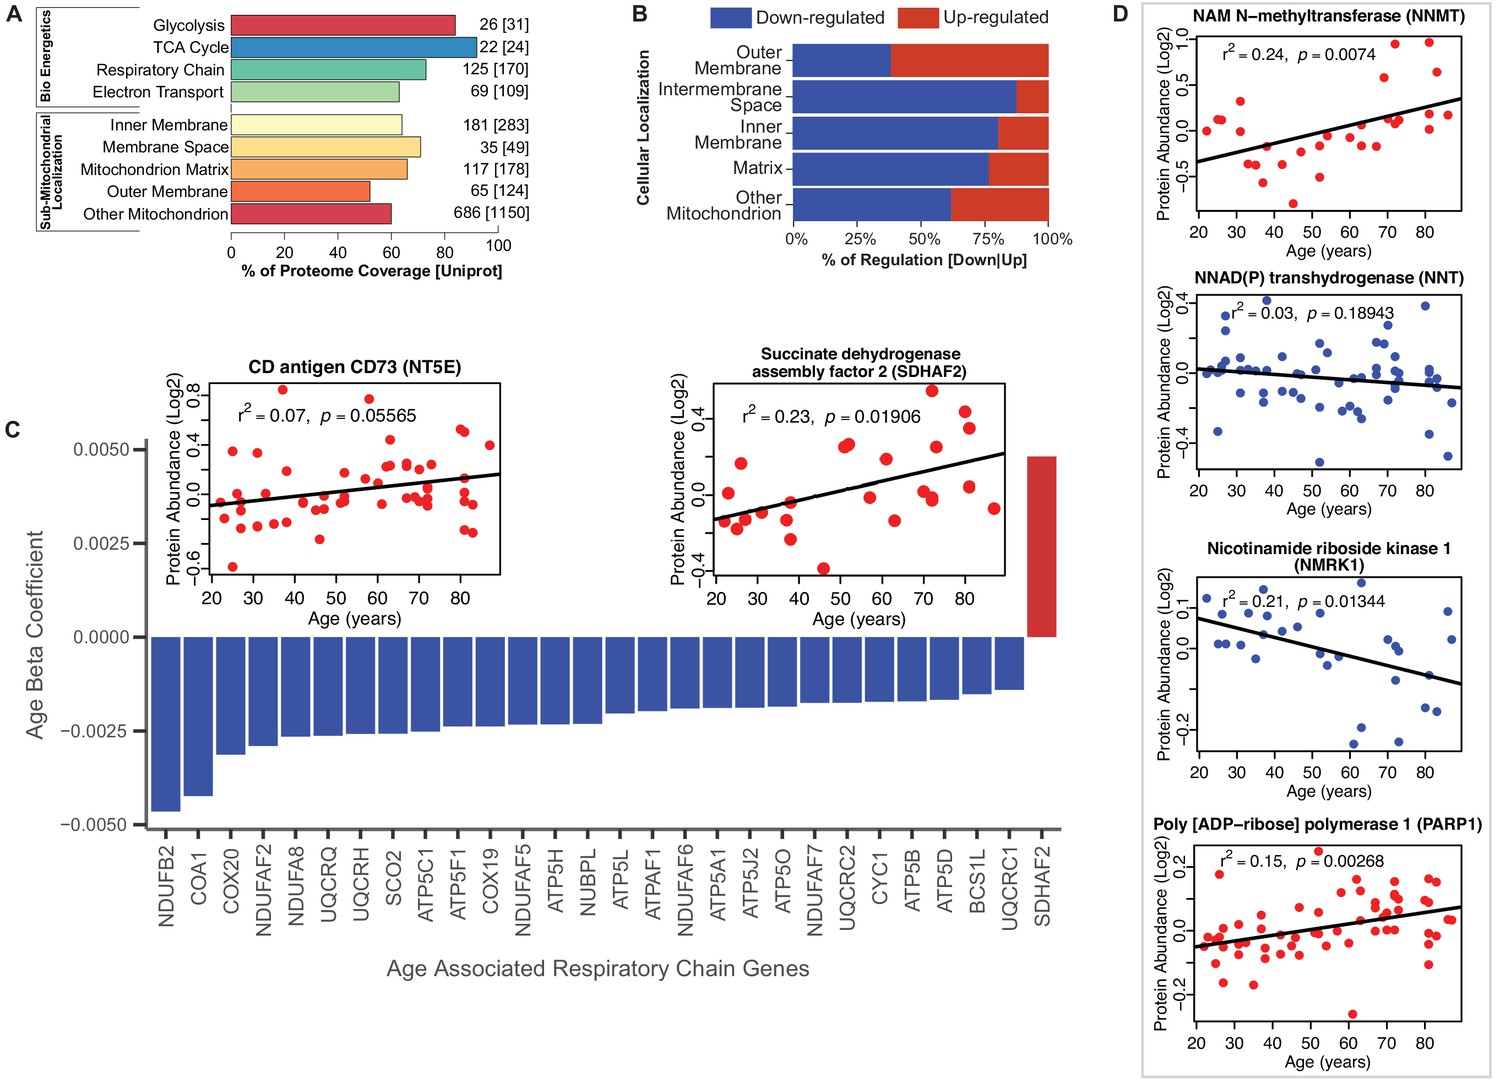
Functional decline of mitochondrial proteins with age.
(A) Percent coverage within categories of skeletal muscle proteins compared to the Uniprot database. The top section shows various energetics categories, while the z axis indicates the number of proteins identified for each protein category and in parenthesis the number of proteins reported in Uniprot for the same category. (B) Subcellular location of age-associated mitochondrial proteins based on up- or downregulation. Of note, most of the mitochondrial proteins are downregulated. (C) Age-dependent decline of respiratory and electron transport chain proteins. All mitochondrial proteins in the respiratory and electron transport chain that are significantly associated with age are downregulated (p<0.05) except SDHAF2. The inset panel reports data on the proteins that are significantly upregulated with aging, SDHAF2 (mitochondrial) and the membrane protein CD73.
Figure 2—figure supplement 1
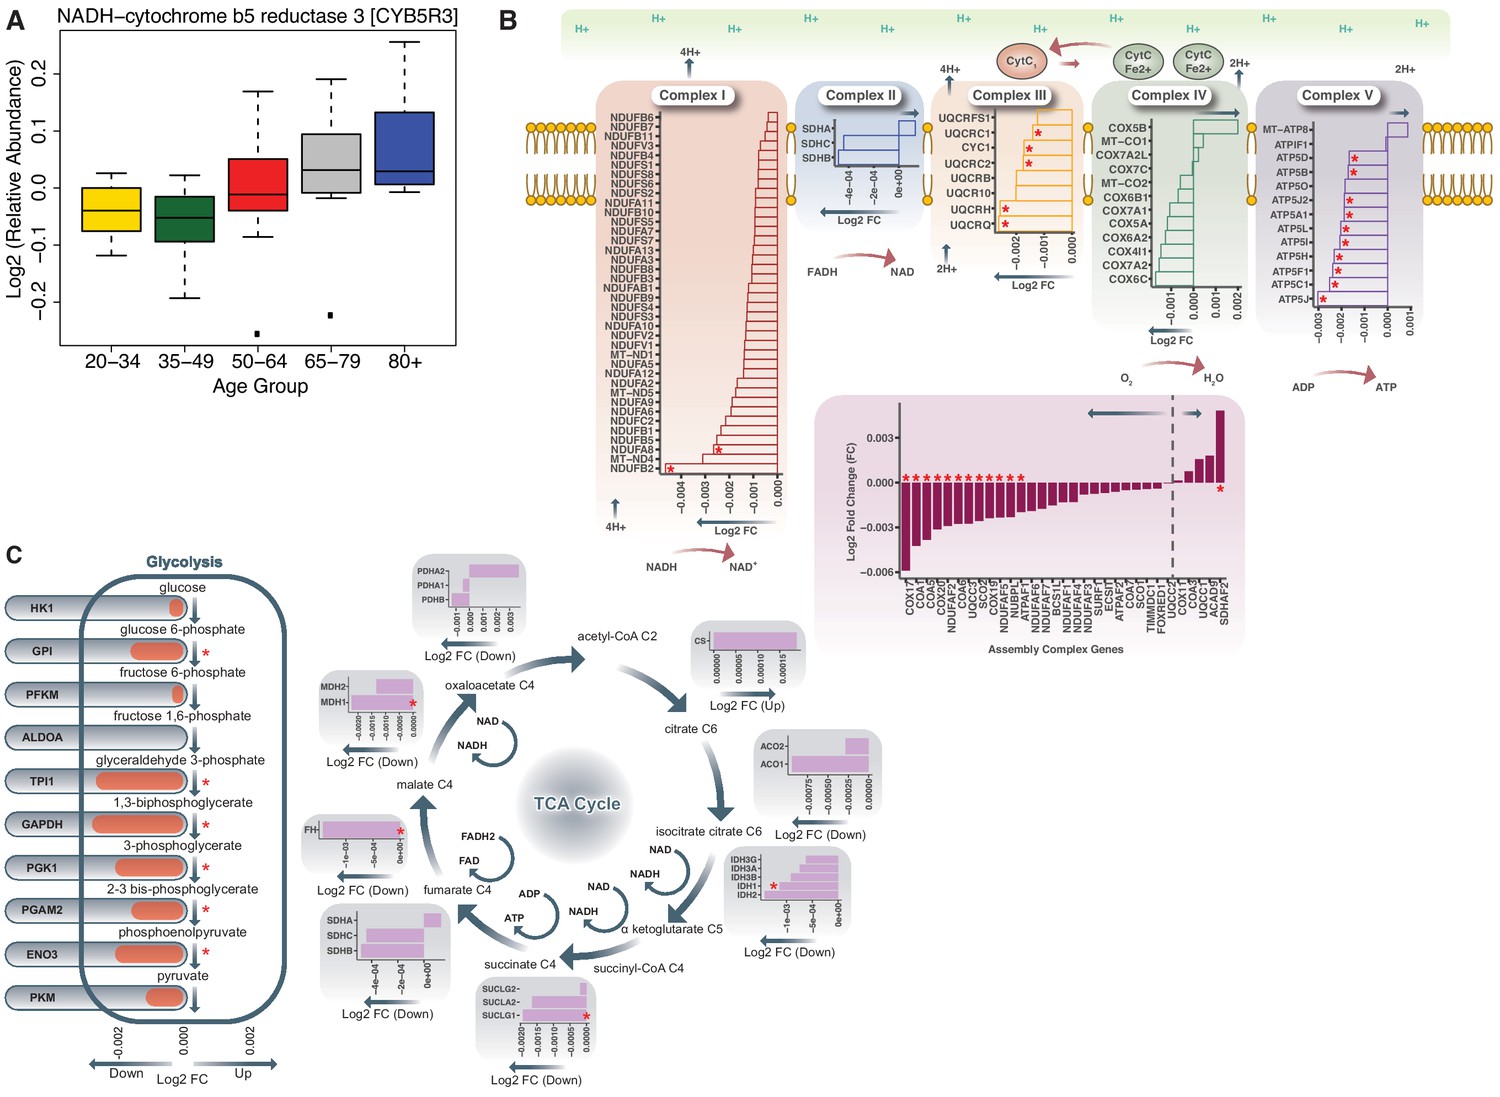
Age-associated bioenergetics pathways.
(A) Age-associated protein abundance of CYB5R3 protein. The abundance of this protein is significantly higher at older age; age groups are color-coded. (B) Respiratory Chain Complex I-V and Aging. Electron Transport Chain Protein Quantification. Proteins quantified from Complex I, Complex II, Complex III, Complex IV, Complex V and Assembly complex proteins are represented. Age-associated proteins are marked by a red asterisk (*). Log2 fold ratios of the gene are on x axis; arrows pointing to left shows underrepresented proteins and arrows pointing to the right are overrepresented proteins. (C) Dysregulation of Bioenergetic Pathway. Proteins quantified from glycolysis and TCA cycle are shown. (Left) Of the 26 glycolysis proteins quantified, six are significantly underrepresented with age. (Right) Of the TCA cycle gene products shown, four are significantly decreased with aging. A red asterisk indicates genes significantly changed with age (p<0.05).
Figure 3 with 1 supplement
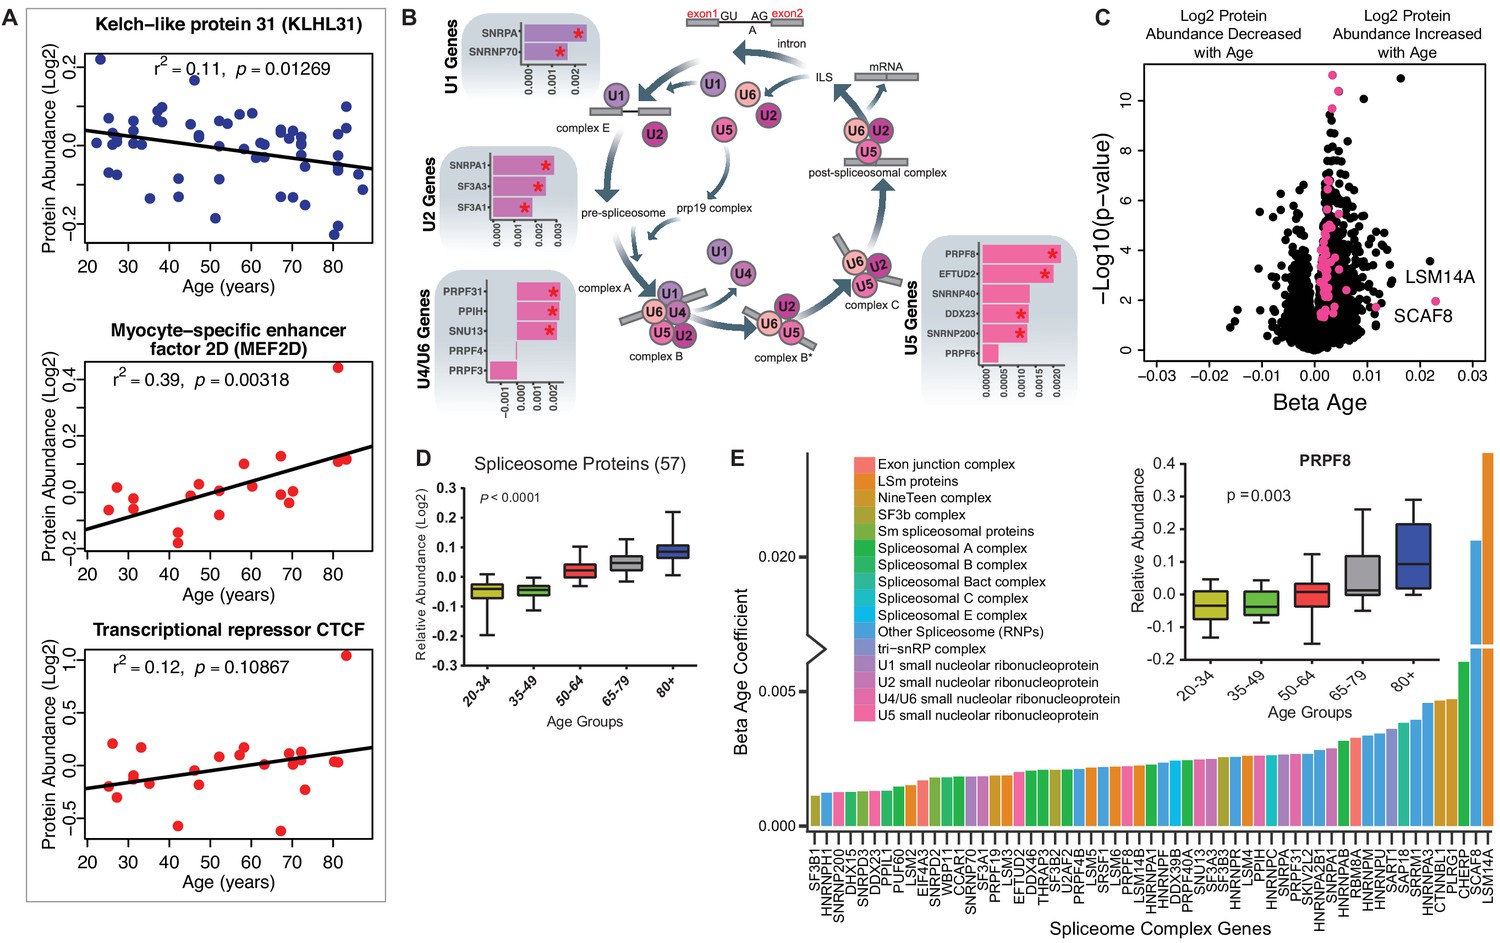
Implications of proteins that modulate transcription and splicing.
(A) Log2 protein abundance of age-associated transcriptional regulation proteins. Simple linear regression was shown for age (x axis) and protein (y axis) correlation, unadjusted p-values were shown. (B) Spliceosome major complex pathway protein expression abundance and dsysregulation. KEGG major spliceosome complex pathway representation and spliceosome complex proteins quantified (associated with splicing RNAs U1, U2, U4/U6, and U5) as plotted in the side square boxes. (C) The log2 abundance expression of 57 spliceosome complex proteins associated with age (p<0.05) are depicted as magenta circles, while all other quantified proteins are black circles. All snRNPs and spliceosome regulatory proteins are upregulated with age. (D) The average of all age-associated spliceosome proteins within each age group reveals an upregulation of spliceosome proteins with age. (E) Effect of age (one-year difference) on the 57 proteins of the spliceosome major complex and color coded based on spliceosome domains. Inset (left) is a legend for the complex domains and inset (right) shows that PRPF8 protein is robustly overrepresented with age.
Figure 3—figure supplement 1
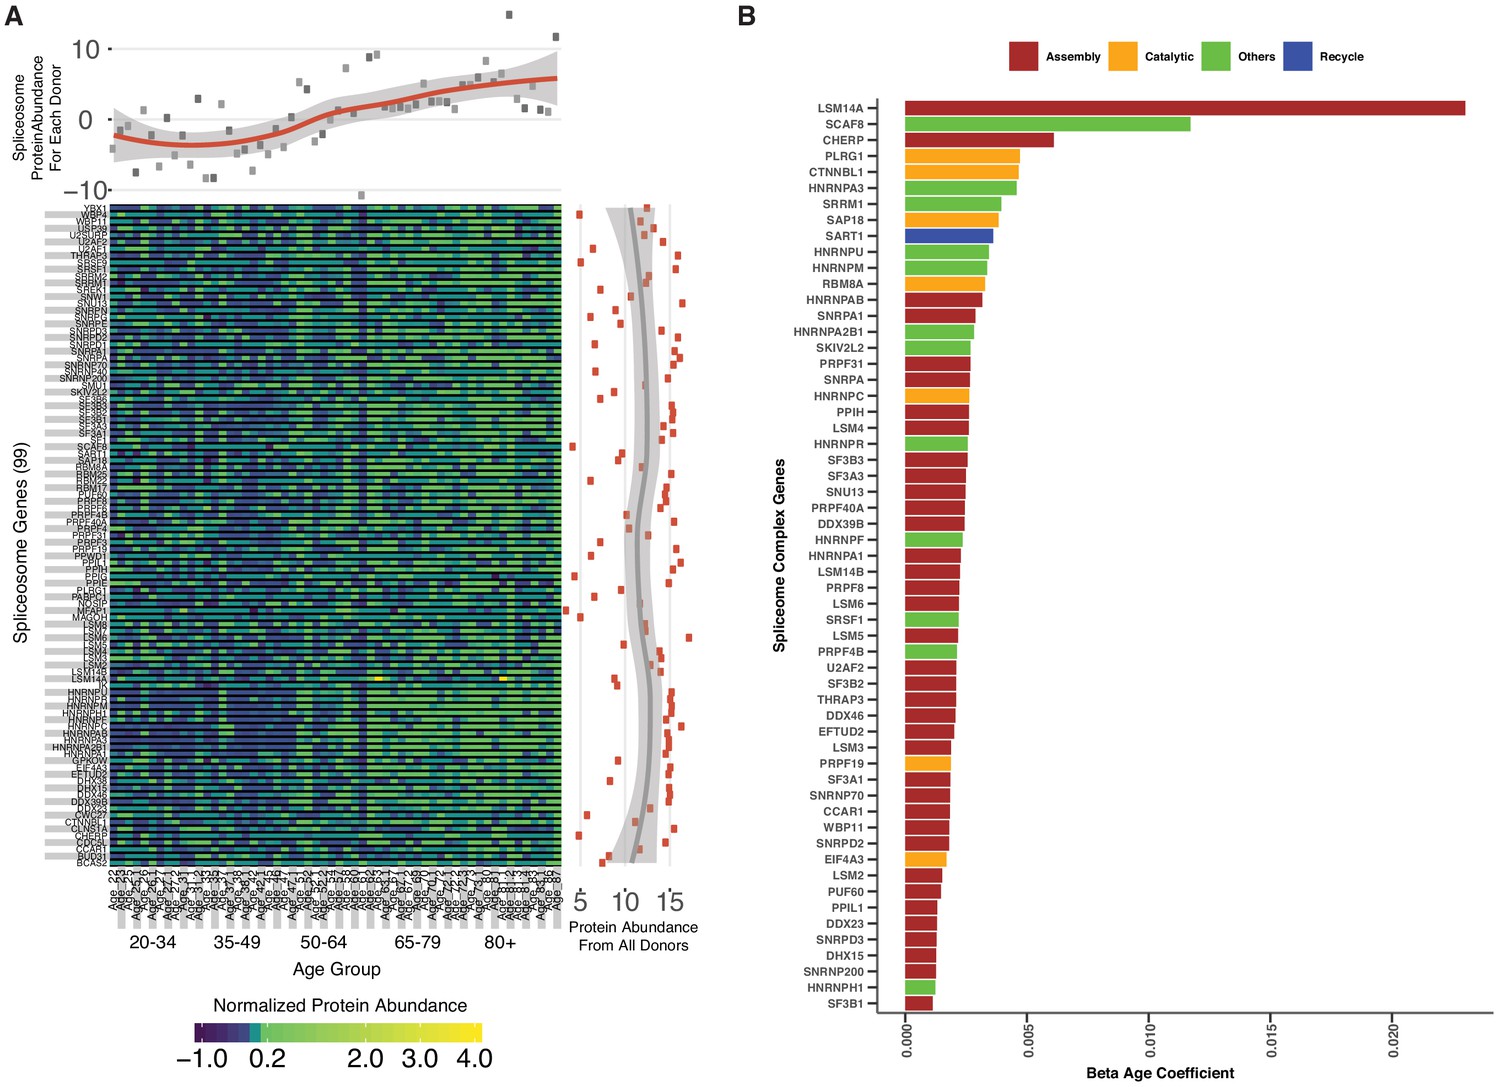
Spliceosomal proteins and age association.
(A) Spliceosome protein abundance and expression variation across ages. A total of 99 spliceosomal proteins are detected across all five age groups. The abundance of each protein is represented as a heatmap; each column represents a study participant and each row indicates a specific protein. The x-axis scatter plot across the top is the average of spliceosomal protein abundance for each donor, revealing an increase in spliceosome abundance with age. The y-axis scatterplot on the right is the average log2 protein abundance from all donors for each protein, showing that most of the spliceosome proteins are highly abundant. (B) Spliceosomal protein categories and age association.
Figure 4
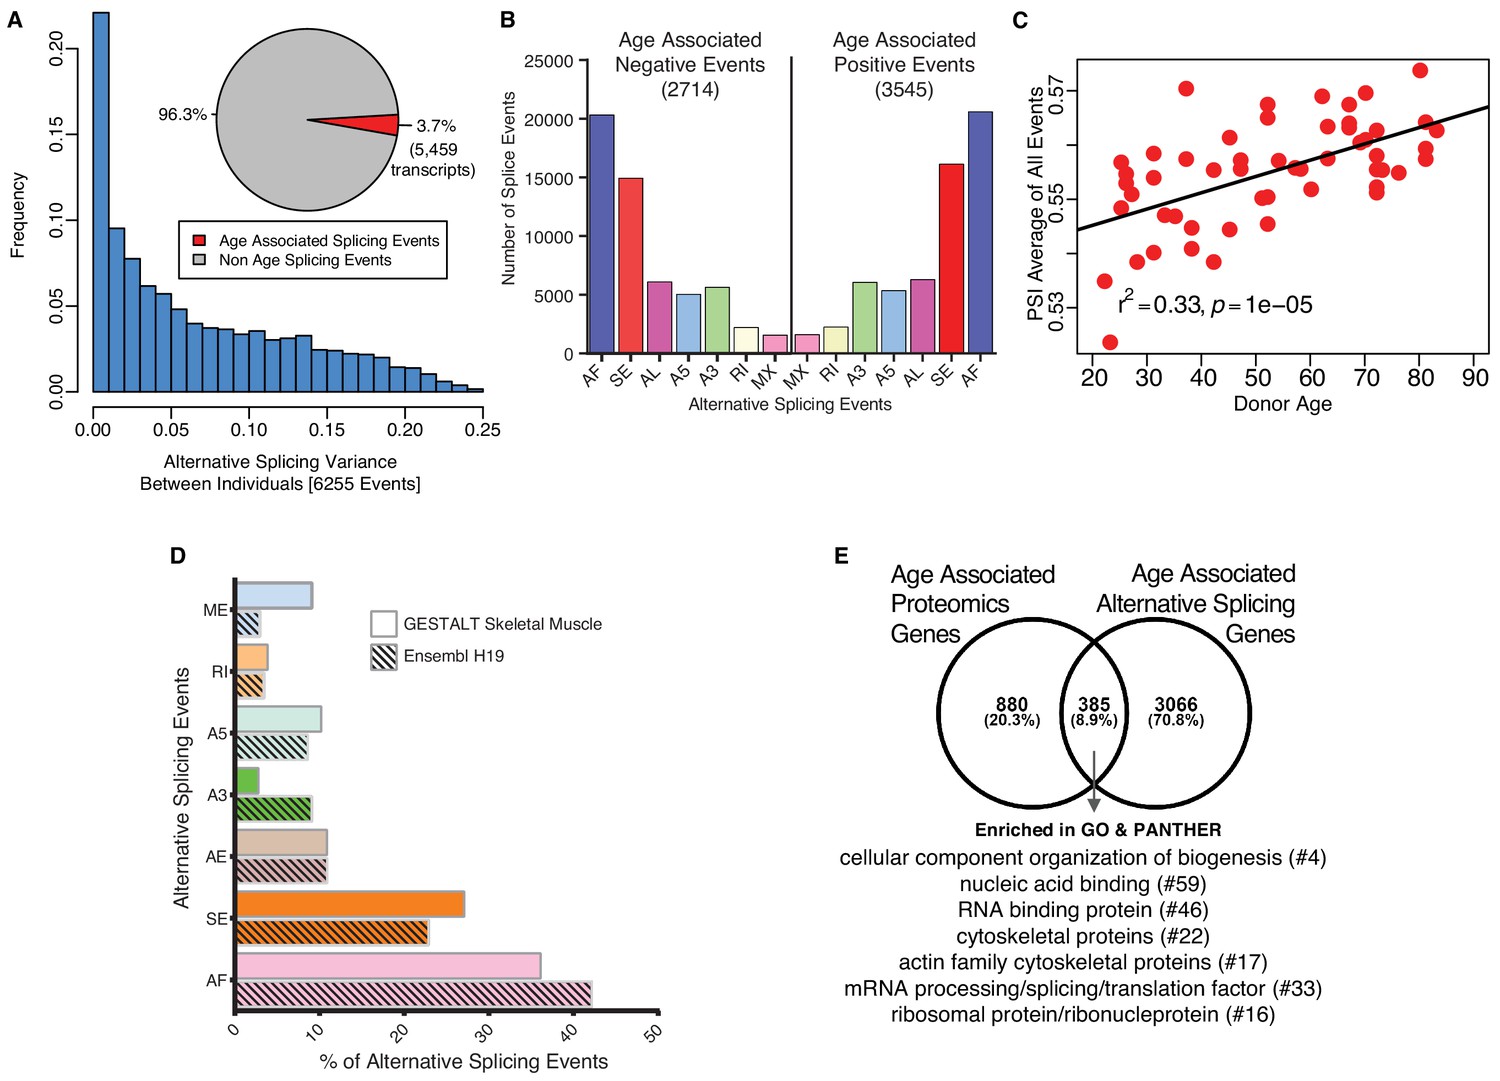
Age-associated alternative splicing.
(A) The number of participants with detected splicing variants is substantial, with >20% of the participants showing <5% splicing variants for the detected gene. Overall, 3.7% of all identified skeletal muscle transcripts (3791 genes) show evidence of differential alternative splicing with aging. (B) Comparison of skeletal muscle age-associated splicing events (positive and negative). Negative events are downregulated with age and positive events are upregulated with age. The category of event is plotted on the x-axis, and the y-axis shows the number of splicing events for each category. (C) Average Percent Spliced-in (PSI) from 6255 events for each donor is depicted as a red circle. Average PSI across 53 donors ranging in age from 20 to 84 suggests an increase in alternative splicing with aging. (D) Comparison between skeletal muscle splicing events detected in GESTALT (solid bars) and splicing events reported in the Ensemble transcript splice events (shaded bars). (E) Comparison of age-associated proteins and age-associated alternatively splicing genes suggesting 30% (385) of the age-associated proteins undergo alternative splicing. Analysis of PANTHER database shows classes of enriched genes from different protein categories, and the number of genes representing each class is shown with #.
-
Figure 4—source data 1
Age-associated splicing events.
Sheet 1. Age-associated splicing events (6255 events). Sheet 2. Description of the column headers for the sheet1.
- https://doi.org/10.7554/eLife.49874.019
-
Figure 4—source data 2
Age-associated positive and negative splicing events.
Sheet 1. Age-associated negative splicing events. Sheet 2. Age associated positive splicing events. Sheet 3. Description of the column headers for the sheet1 and sheet2.
- https://doi.org/10.7554/eLife.49874.020
Figure 5 with 1 supplement
Age-associated proteostasis proteins.
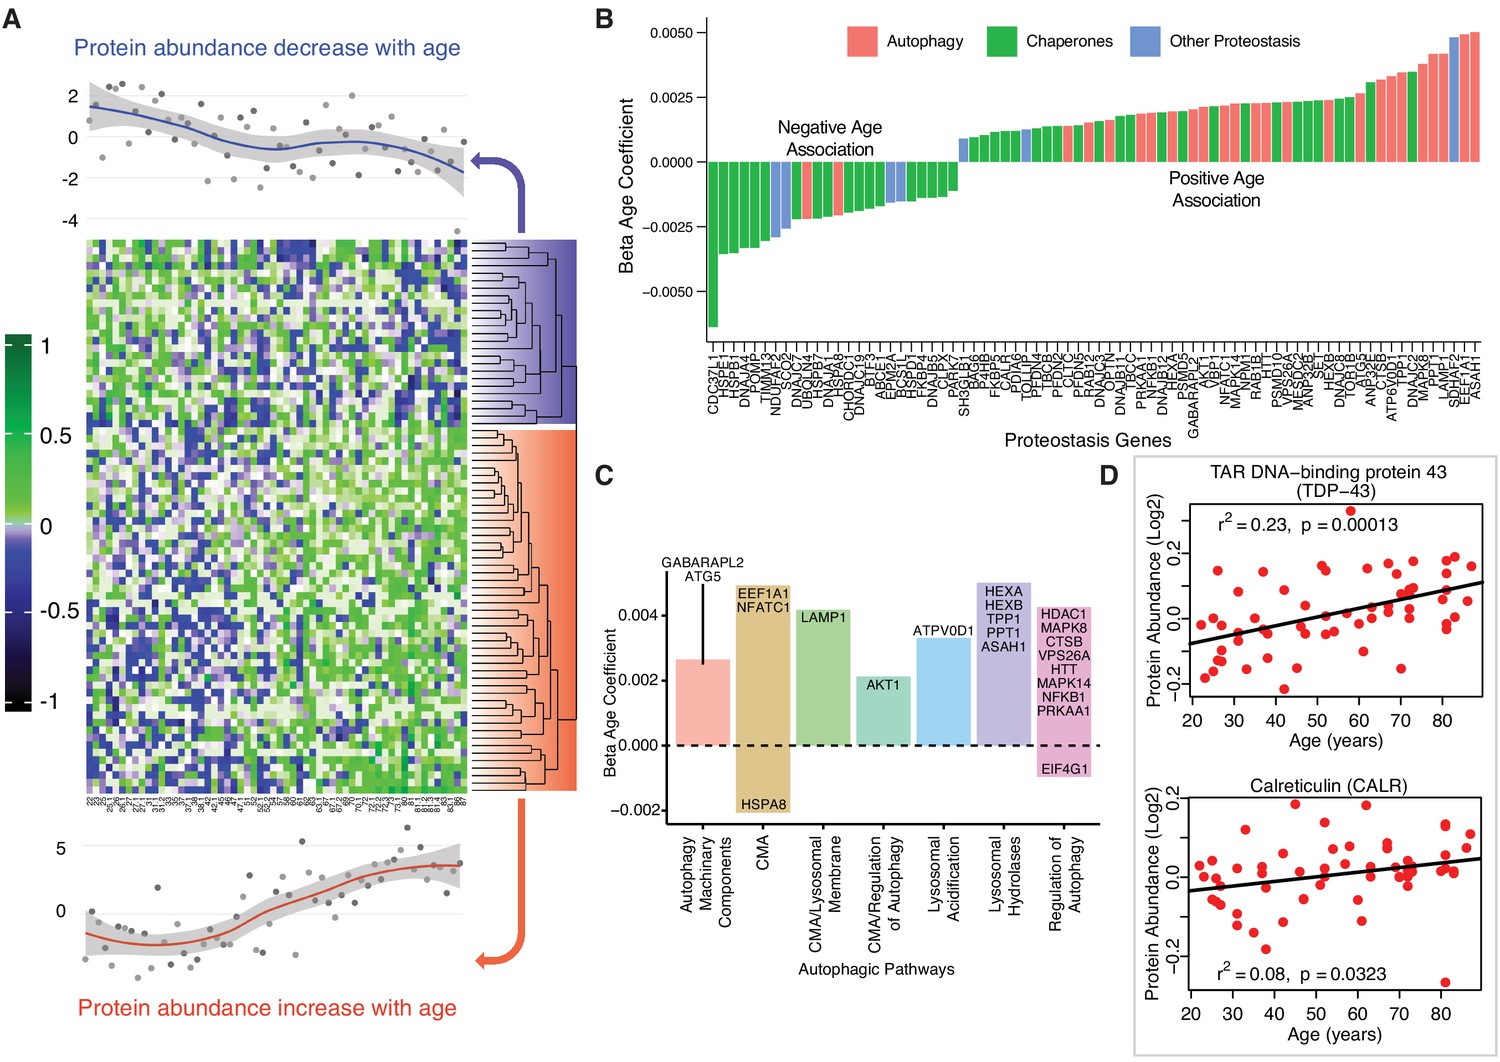
(A) Log2 protein abundance of all 74 age-associated proteostasis proteins across all 58 donors. Rows represent proteostasis proteins and columns represents donors. The average expression of all age-associated proteostasis proteins from each donor is plotted at the top and bottom (gray circles) with loess curves. The top section shows downregulated clusters of proteins (average of 24 proteins) and the bottom shows upregulated clusters of proteins (average of 54 proteins). The protein rows are ordered based on hierarchical clustering and displayed by dendrograms. (B) Confounders-adjusted β age coefficient of age-associated proteins, showing age-differentially regulated proteostasis proteins, over representation of proteostasis category proteins and the log2 magnitude of protein change with each year of age. (C) The increase of autophagy protein sub category with age is shown. Except HSPA8 and EIF4G1 all other autophagy proteins are positively correlated with age. Each bar plot shows each autophagy protein sub category and the average change over a year of age. The gene/proteins names are organized from lowest to highest log2 expression change per year of age. (D) Raw log2 abundance of autophagy proteins TDP and CALR were shown, simple linear regression method was used for age (x axis) and protein (y axis) correlation, of note unadjusted p-values were shown.
Figure 5—figure supplement 1
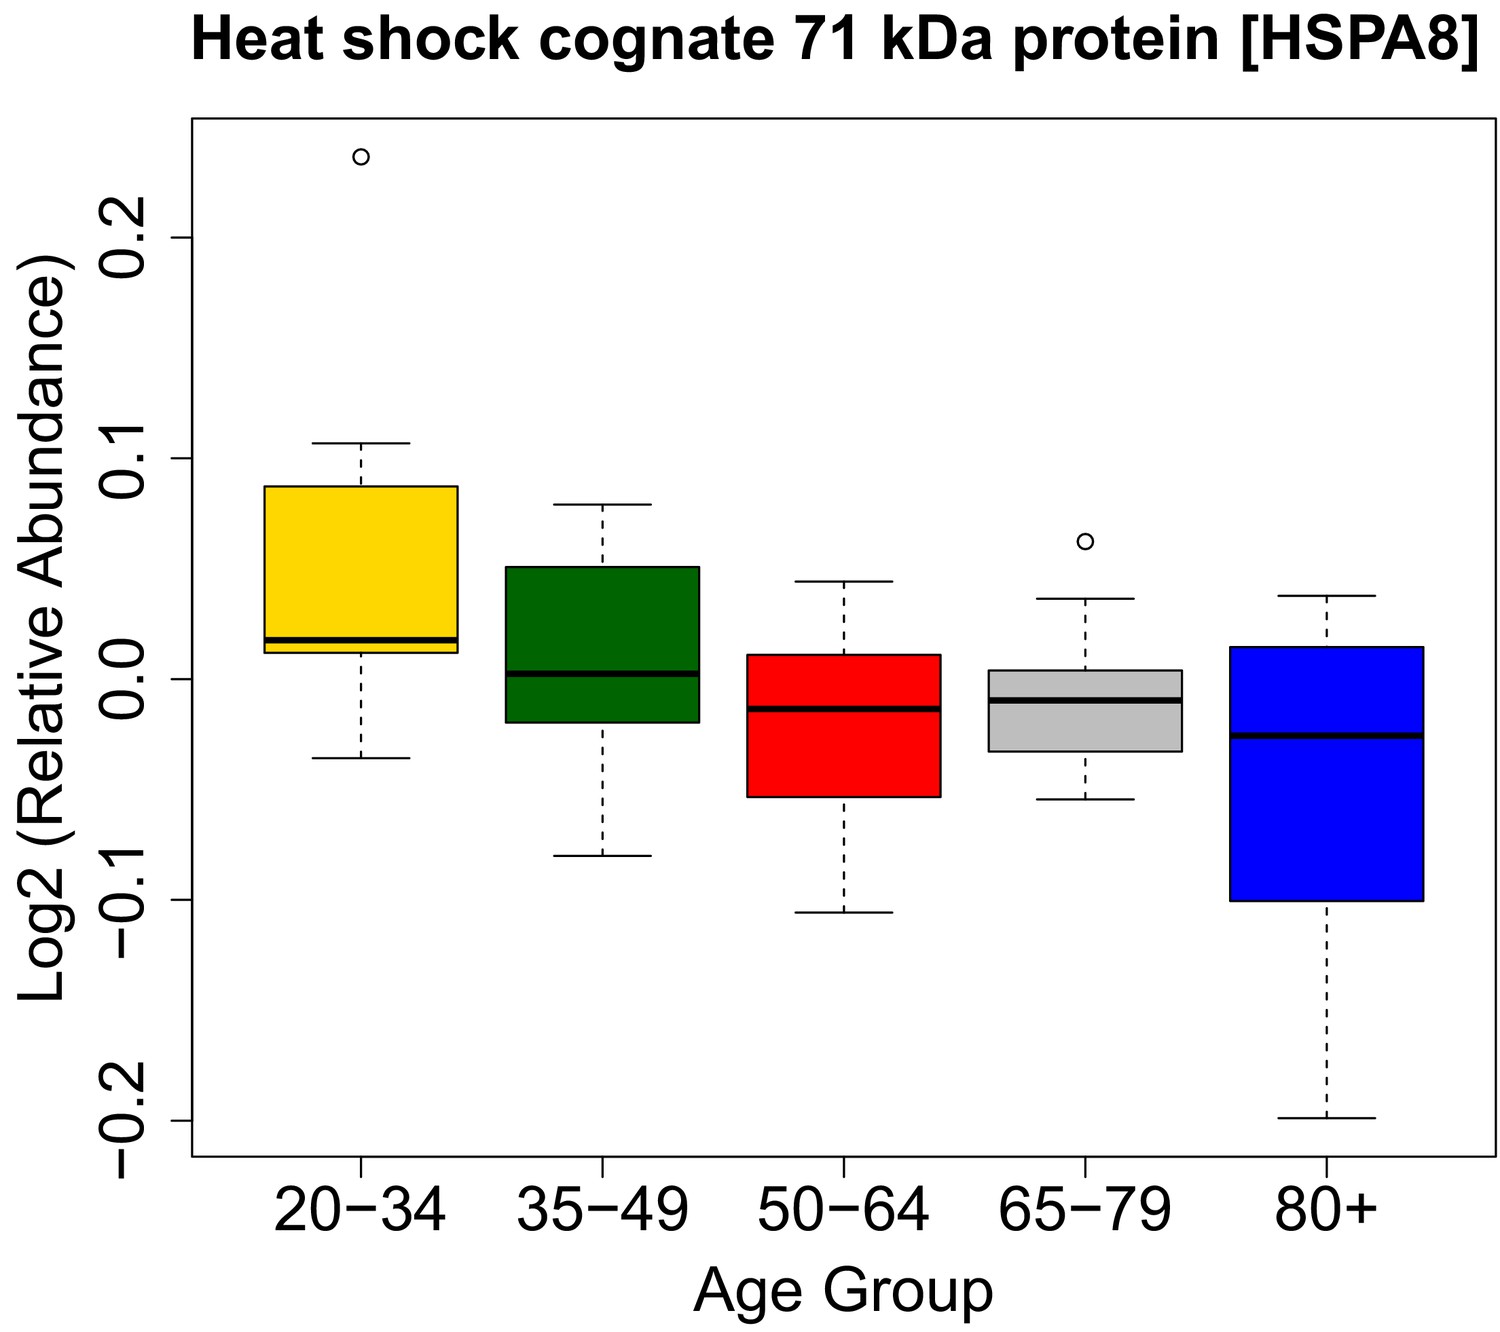
HSPA8 protein and its association with age.
https://doi.org/10.7554/eLife.49874.022
Figure 6
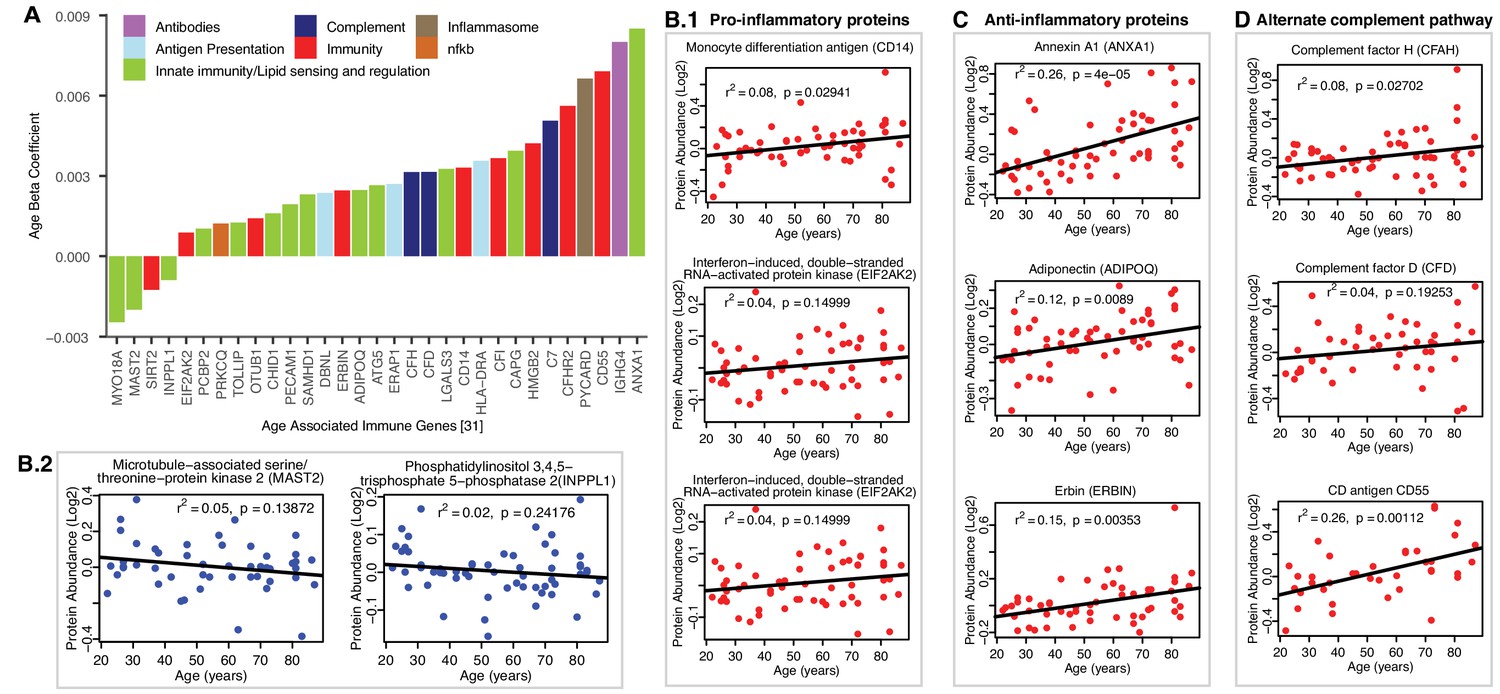
Age-associated immune proteins.
(A) Immune-related proteins are depicted; the x axis shows the genes that code for age-differentially regulated proteins, while the y axis shows the log2 fold expression difference associated with age. The increase in innate immune signaling and lipid responses may indicate a reaction to adipocytes muscle infiltration, which in turn causes activation of innate immune signaling. (B–D) Examples of dysregulated proteins are shown from (B.1-B.4) pro-inflammatory. (C) Anti-Inflammatory. (D) Complement pathway proteins. Inflammasome adaptor protein PYCARD is positively associated with age, and the abundance of this protein is a key mechanism by which IL-1β pathway activation is regulated. In B-D raw log2 protein abundance and unadjusted p-values are shown.
Download links
A two-part list of links to download the article, or parts of the article, in various formats.
Downloads (link to download the article as PDF)
Open citations (links to open the citations from this article in various online reference manager services)
Cite this article (links to download the citations from this article in formats compatible with various reference manager tools)
Discovery proteomics in aging human skeletal muscle finds change in spliceosome, immunity, proteostasis and mitochondria
eLife 8:e49874.
https://doi.org/10.7554/eLife.49874


