In vivo assessment of the neural substrate linked with vocal imitation accuracy
- Bio-Imaging Lab, Department of Biomedical Sciences, University of Antwerp, Belgium
- Centre of Biosciences, Institute of Animal Biochemistry and Genetics, Slovak Academy of Sciences, Slovakia
Figures
Figure 1
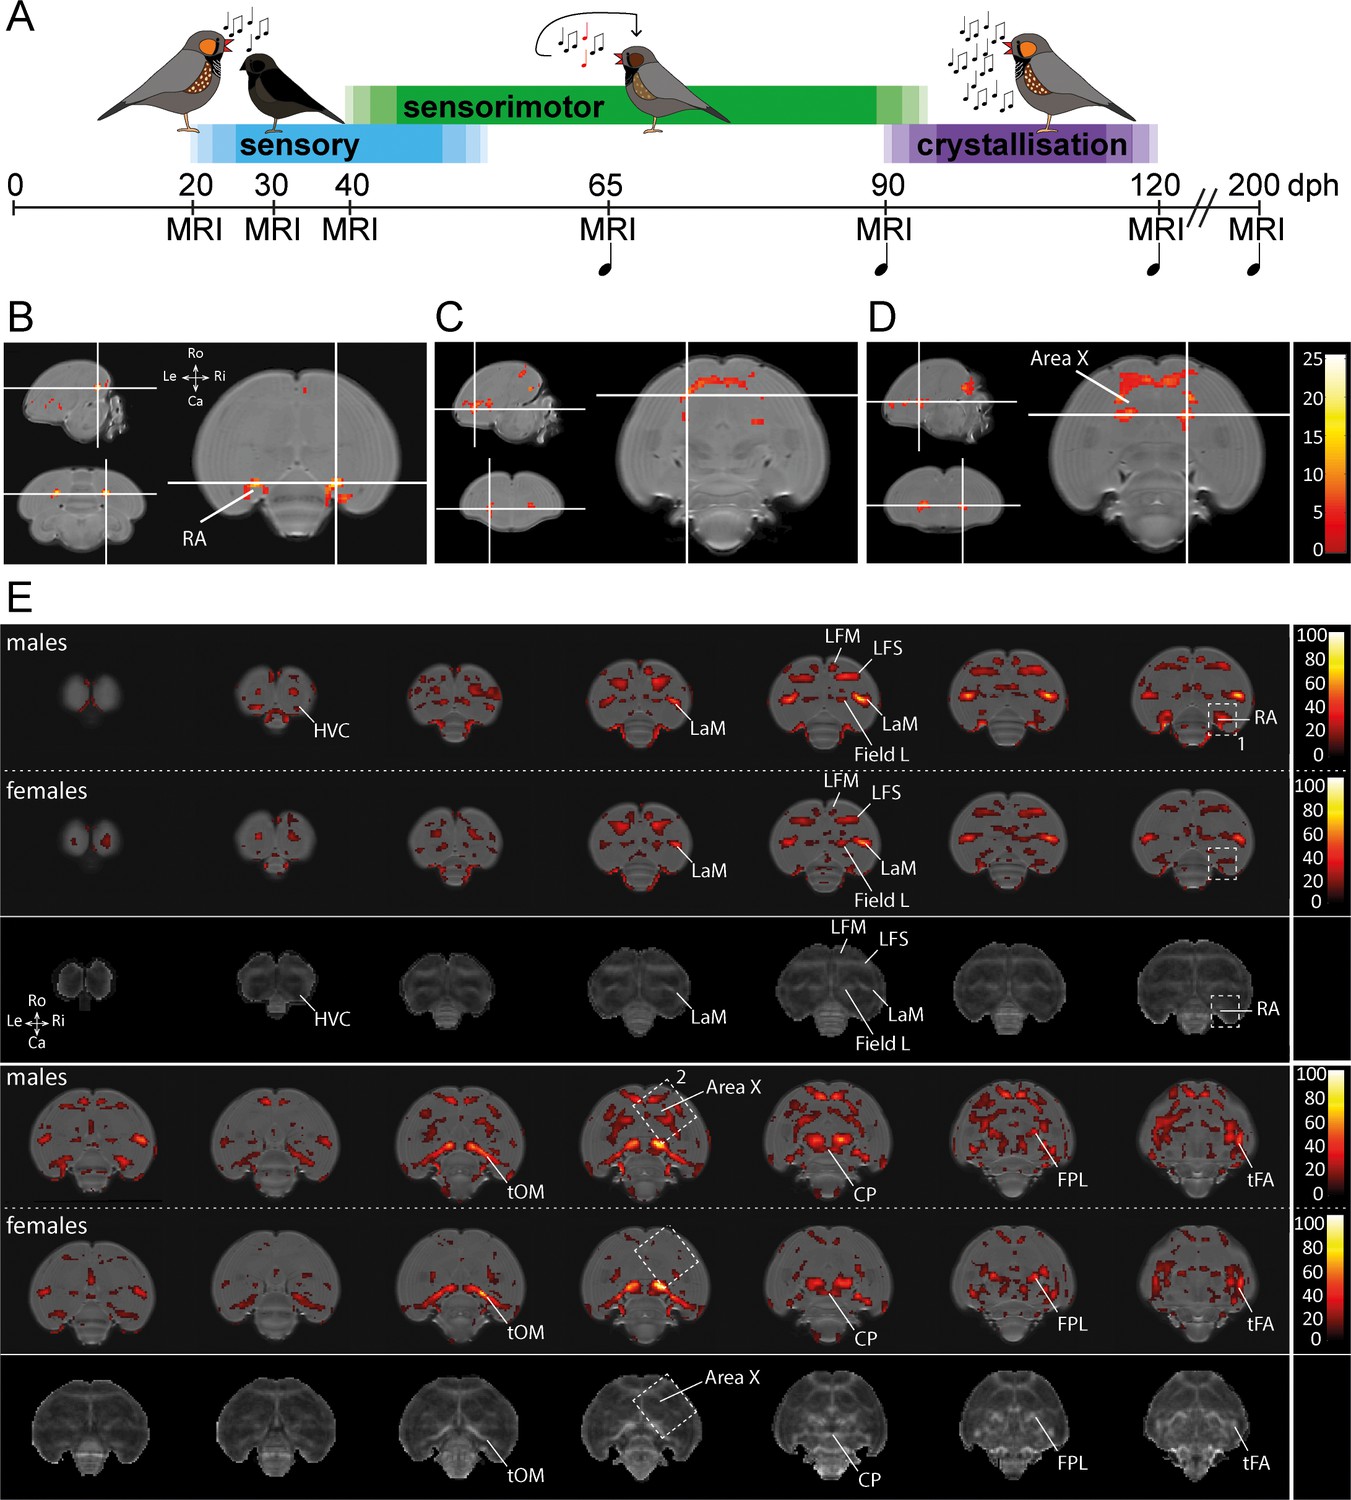
Monitoring the maturing zebra finch brain in male and female finches.
(A) Study design. Structural MRI data were acquired during the sensory phase (20, 30 dph), sensorimotor phase (40, 65 dph), crystallisation phase (90, 120 dph) and well after song is mastered (200 dph) in male zebra finches. Structural MRI data were obtained at the same time points in female zebra finches. During each imaging session, we collected a DTI and 3D anatomical scan. The first days after each imaging session, we recorded the song sung by the juvenile male birds ( ), starting from 65 dph (only male zebra finches sing). (B-D) Statistical parametric maps highlighting voxels that display an interaction between age*sex for Fractional Anisotropy (FA), one of the parameters of DTI, during ontogeny (B-D). The crosshairs converge at the arcopallium (B), rostro-lateral Area X surroundings (C), and caudal Area X surroundings (D). The maps are thresholded at puncorrected <0.001; kE ≥30 voxels (B-D), and overlaid on the population-based template. The statistical maps are colour-coded according to the scales on the right. (E) Statistical brain maps illustrating the main effect of age of FA for male and female zebra finches. The results are displayed in accordance with pFWE <0.001 kE ≥5 voxels, and overlaid on the population-based template. The statistical maps are colour-coded according to the scales on the right. FA values range from 0 (black) to 1 (white). The areas demarcated by white-dotted lines refer to clusters identified in the interaction between age and sex with 1 (RA) and 2 (Area X) (B-D). The third and sixth rows present an average FA map calculated from FA maps of male birds obtained at 200 dph and serves to identify the anatomical (mostly white matter) structures covered by a significant cluster. See Supplementary file 1 for statistics. Abbreviations: LaM: mesopallial lamina; LFM: supreme frontal lamina; LFS: superior frontal lamina; tOM: occipitomesencephalic tract; CP: posterior commissure; FPL: lateral prosencephalic fascicle; tFA: fronto-arcopallial tract; Do: dorsal; Ve: ventral; Ro: rostral; Ca: caudal.
Figure 2 with 1 supplement
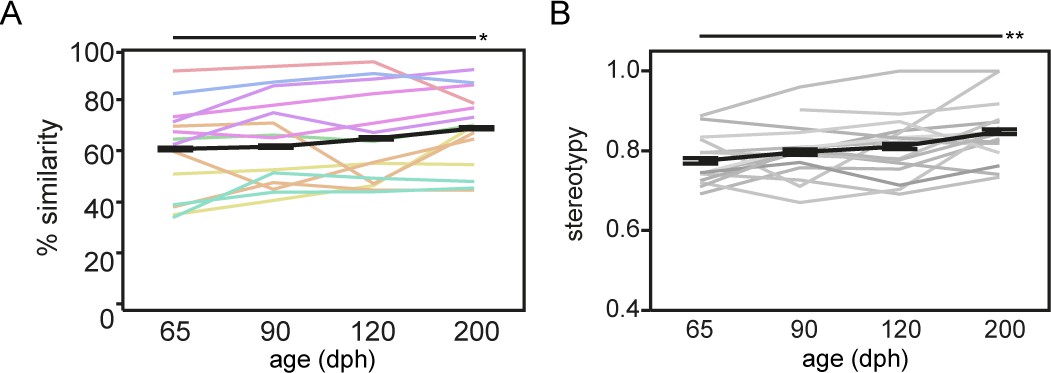
Song similarity improves beyond crystallisation.
Graph A and B refer to respectively song similarity to tutor song and song stereotypy in function of age. Both increase from 65 to 200 dph (mixed-effect model main effect of age: song similarity: p=0.0251 F(3, 37.0)=3.4890; sequence stereotypy: p=0.0052 F(3, 38.4)=4.7904). Each thin coloured or grey line refers to the average performance of an individual bird over the different ages. The bold black line presents the average group performance (mean ± SEM; n = 14; 20 data points per time point per bird). The colour-code of the lines in A encodes tutor identity, that is birds raised by the same tutor share the same colour (see Supplementary file 12). The colour-code illustrates that song similarity is dependent on tutor identity (mixed-effect model main effect for tutor: p=0.0159 F(7, 6.1)=6.7597). Asterisks indicate significant differences over time identified by a mixed model analysis with post hoc Tukey’s HSD test. *: p<0.05; **p<0.01. Abbreviations: dph: days post-hatching.
Figure 2—figure supplement 1
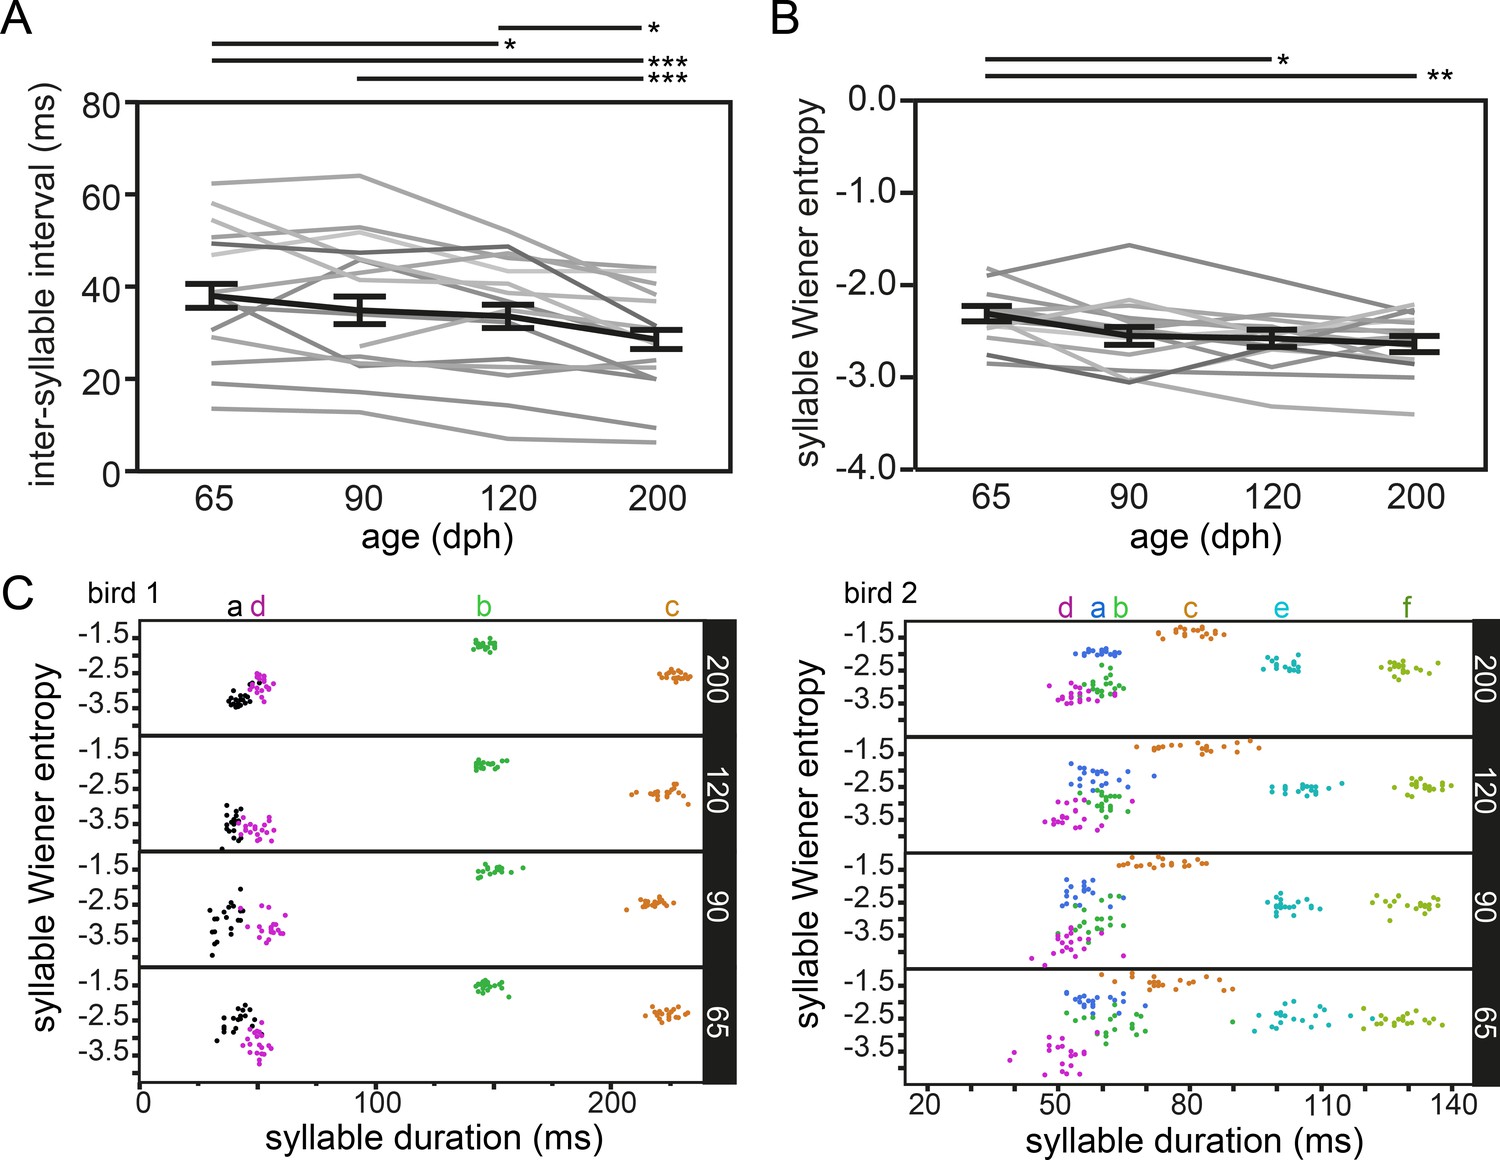
Song syllable scores.
Each thin grey line (all graphs except for C) refers to the average performance of an individual bird at different ages. The bold line presents the average group performance (mean ± s.e.m.; n = 14; 20 data points per time point per bird). Graph A and B contain the syllable feature scores, respectively. inter-syllable duration and syllable entropy. Both decrease significantly over the course of the study (mixed-effect model main effect of age: inter-syllable interval duration: p<0.0001 F(3, 38.2)=13.8789; Syllable Wiener entropy: p=0.0032 F(3, 37.8)=5.4803). C aims to visualise the change in standard deviation of specific syllables (each colour presents the data of one syllable (indicated by letters) of two representative birds. Each horizontal part of the graph presents data obtained at one time point (top to bottom: 200, 120, 90 and 65 dph). The size of the cluster of syllables a and d in bird 1 and syllables a-b-c-d-e of bird 2 decreases markedly between 65 and 200 dph, indicative of smaller variation between different syllable renditions towards older ages. Asterisks indicate significant differences over time indicated by a mixed model analysis with post hoc Tukey’s HSD test. *: p<0.05; **p<0.01; ***p<0.001. See supplementary file 2 for statistics.
Figure 3 with 1 supplement
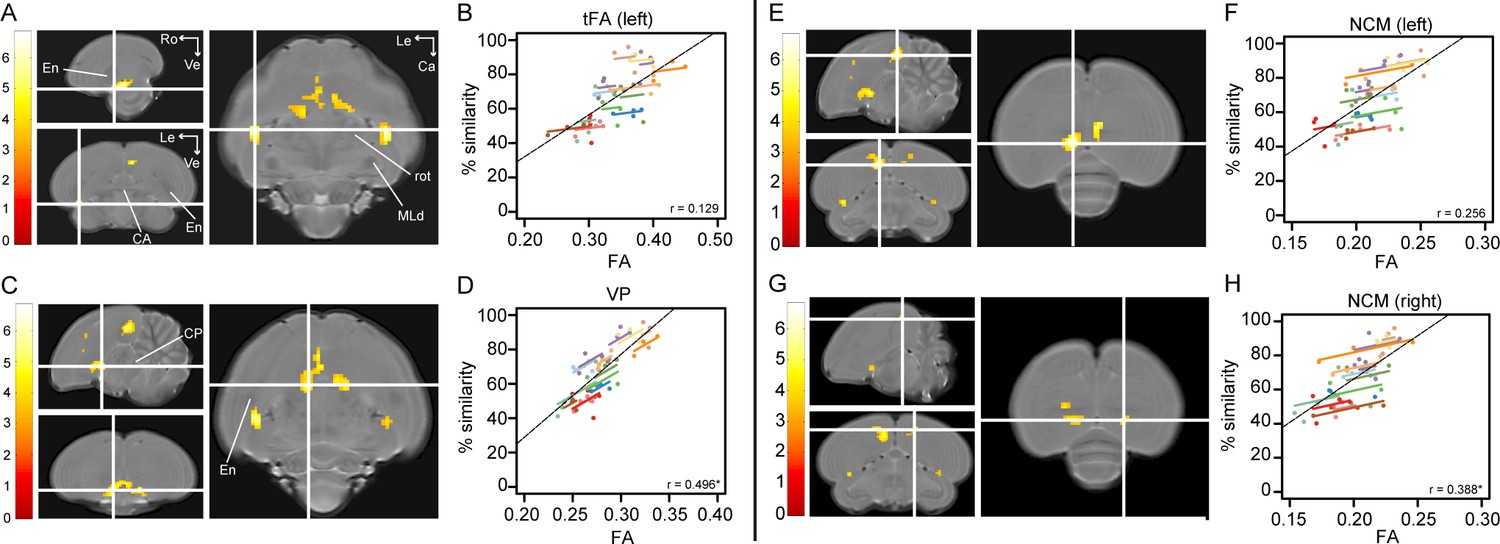
Song imitation accuracy correlates positively with Fractional Anisotropy (FA) in the tFA (A–B), VP (C–D) and NCM (E–H).
The statistical maps (A, C, E, G) present the outcome of the voxel-based multiple regression testing for a correlation between song similarity and FA (n = 14). The crosshairs point to the tFA in the left hemisphere (A), the VP (C), and NCM in the left (E) and right (G) hemisphere. Results are overlaid on the population-based MRI template and scaled according to the colour-code (T values) on the left of each statistical map. Only voxels that reached puncorrected <0.001 and take part of a cluster of at least 40 contiguous voxels are displayed. Graphs B, D, F and H visualise the nature of the correlation between song similarity and FA where individual data points are colour-coded according to bird-identity (i.e. one colour = one bird). The average within-bird correlation is presented by the coloured lines, while the black dashed line indicates the overall association between song similarity and FA, disregarding bird-identity or age. ‘r’ is the repeated-measures correlation (rmcorr) coefficient. The * indicates a significant rmcorr correlation between FA and % similarity in the VP (p=0.001) and right NCM (p=0.0121). Abbreviations: CA: anterior commissure; CP: posterior commissure; En: entopallium; MLd: dorsal part of the lateral mesencephalic nucleus; rot: nucleus rotundus; tFA: fronto-arcopallial tract; VP: ventral pallidum; Le: left; Ca: caudal; Ro: rostral; Ve ventral. See Supplementary file 4 for statistics.
Figure 3—figure supplement 1
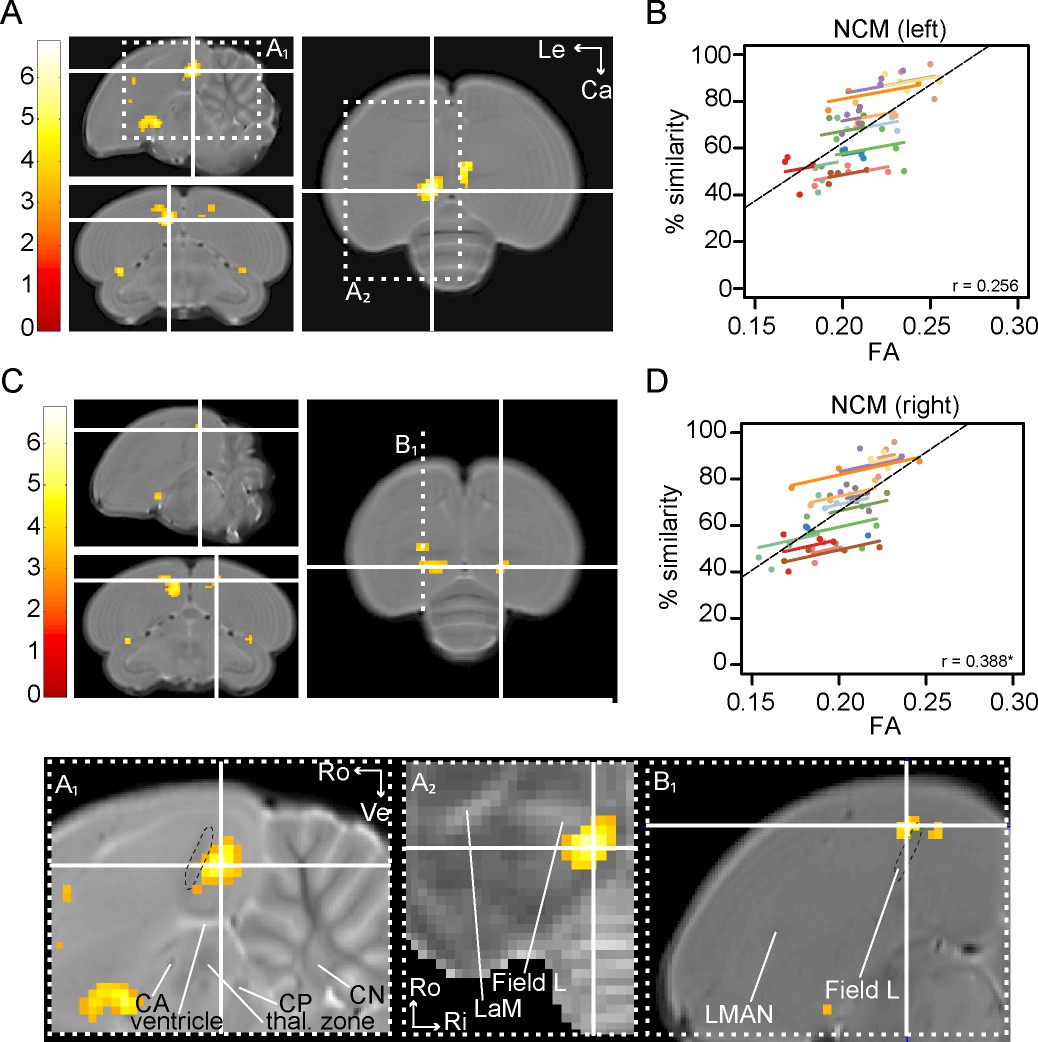
Song imitation accuracy correlates positively with fractional anisotropy (FA) in NCM.
The statistical maps present the outcome of the voxel-based multiple regression (n = 14) testing for a correlation between song similarity and FA. The crosshairs converge in the NCM of the left (A) and right (C) hemisphere. Results are overlaid on the population-based template or population-averaged FA maps of datasets obtained at 200 dph (A2), and are scaled according to the colour-code on the left (T values). Only voxels that reached puncorrected <0.001 and take part of a cluster of at least 40 contiguous voxels are displayed. Insets A1-2 visualise the spatial extent of the cluster in left NCM with reference to Field L. L2a is visible by a hypo-intense line-shaped area on A1 (black dashed circle). The peak of the cluster (crosshairs) is situated in (rostral) NCM. Inset A2 further corroborates that the NCM-cluster does not overlap with the highly myelinated, fibre-rich (hyper-intense FA) structure that can be identified as Field L. Inset B1 illustrates the cluster in left NCM that extends to the left CM (rostral to Field L (black dashed circle). Graphs B and D visualise the nature of the correlation between song similarity and FA, in NCM of the left and right hemisphere, respectively, where individual data points are colour-coded according to bird-identity (i.e. one colour = one bird). The average within-bird correlation is presented by the coloured lines, while the black dashed line indicates the overall association between song similarity and FA, disregarding bird-identity or age. ‘r’ is the repeated-measures correlation (rmcorr) coefficient. See Supplementary file 4 for statistics. Abbreviations: CA: anterior commissure; CP: posterior commissure; LaM: lamina mesopallialis; LMAN: lateral magnocellular nucleus of the anterior nidopallium; thal. zone: thalamic zone; Ro: rostral; Ve: ventral; Ri: right; Ca: caudal; Le: left.
Figure 4
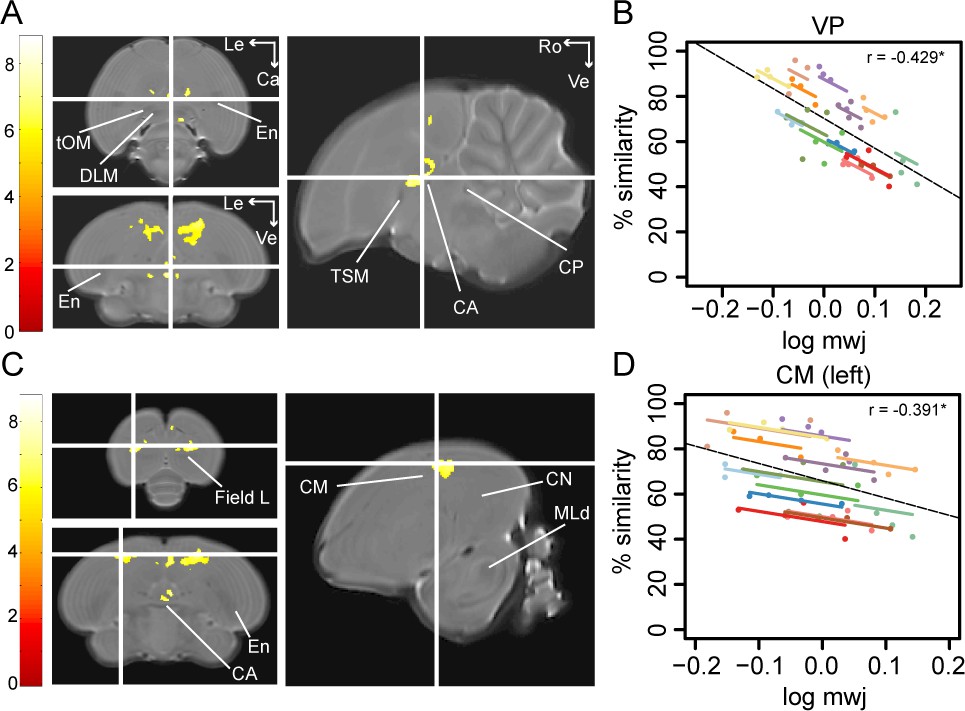
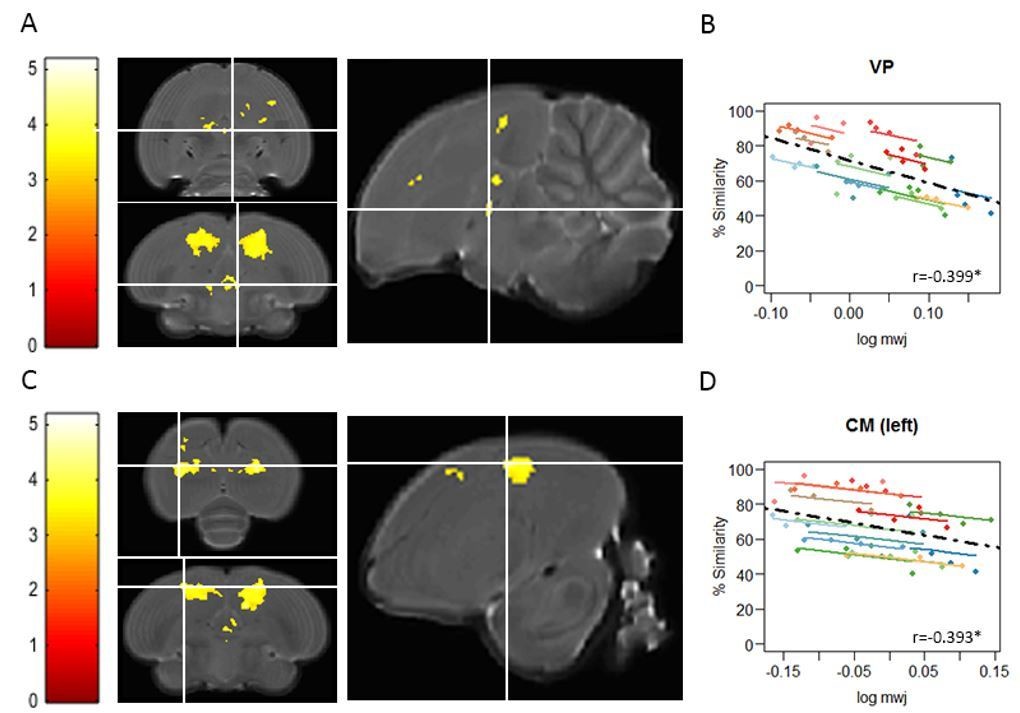
Song imitation accuracy correlates negatively with the local volume of the VP (A–B) and the CM (C–D).
The statistical parametric maps present the outcome of the voxel-based multiple regression testing for a correlation between song similarity and local tissue volume (n = 14) and are visualised at pFWE <0.05 and kE ≥ 80 voxels, and overlaid on the population-based template. The crosshairs point to the VP (A) or the CM in the left hemisphere (C). T-values are colour-coded according to the scale immediately left to the SPMs. Graphs B and D inform on the nature of the association between song similarity (%) and log-transformed modulated jacobian determinant (log mwj; a metric reflecting local tissue volume). More specifically, the individual data points of the graphs are colour-coded according to bird-identity (i.e. one colour = one bird). The average within-bird correlation is presented by the coloured lines, while the dashed black line indicates the overall association between song similarity and log mwj, disregarding bird-identity or age. ‘r’ is the repeated-measures correlation (rmcorr) coefficient. The * indicates a significant rmcorr correlation between logmwj and % similarity in the VP (p=0.0057) and left CM (p=0.0126). Abbreviations: CA: anterior commissure; CM: caudal mesopallium; CN: caudal nidopallium; CP: posterior commissure; DLM: medial part of the dorsolateral nucleus of the anterior thalamus; En: entopallium; MLd: dorsal part of the lateral mesencephalic nucleus; tOM: occipitomesencephalic tract; TSM: septo-mesencephalic tract; VP: ventral pallidum; Le: left; Ca: caudal; Ve: ventral; Ro: rostral. See Supplementary file 5 for statistics.
Figure 5

Repeated measures correlation showing no correlation between % song similarity and Fractional Anisotropy (FA) of song control system regions.
HVC (A), Area X (B), LMAN (D) and RA (E) and the surroundings of song control system nuclei Area X (C) and RA (F) as defined by the clusters derived from interaction age*sex shown in Figure 1B,D. The individual data points of the graphs are colour-coded according to bird-identity (i.e. one colour = one bird). The average within-bird correlation is presented by the coloured lines, while the dashed black line indicates the overall association between song similarity and FA, disregarding bird-identity or age. ‘r’ is the repeated-measures correlation (rmcorr) coefficient.
Figure 6 with 2 supplements

Fractional anisotropy in left NCM predicts future song learning accuracy.
Graph A presents the learning curve of the good (green; n = 7) and bad (red; n = 7) learning birds from 65 to 200 dph. Details on the distinction between good and bad learners can be found in the Results section and in Supplementary file 2. Graphs B and C present the difference of FA in NCM between good (green) and bad (red) vocal learners during the sensory (20–30 dph) and early sensorimotor (40 dph) phase in, respectively, the left (B) and right (C) hemisphere. Each line represents repeated measures obtained from one bird. The * indicates a significant main effect of future learning accuracy (good versus bad learners) for FA in left NCM (mixed model: p<0.0001 F(1,12.3)=39.2690).
Figure 6—figure supplement 1
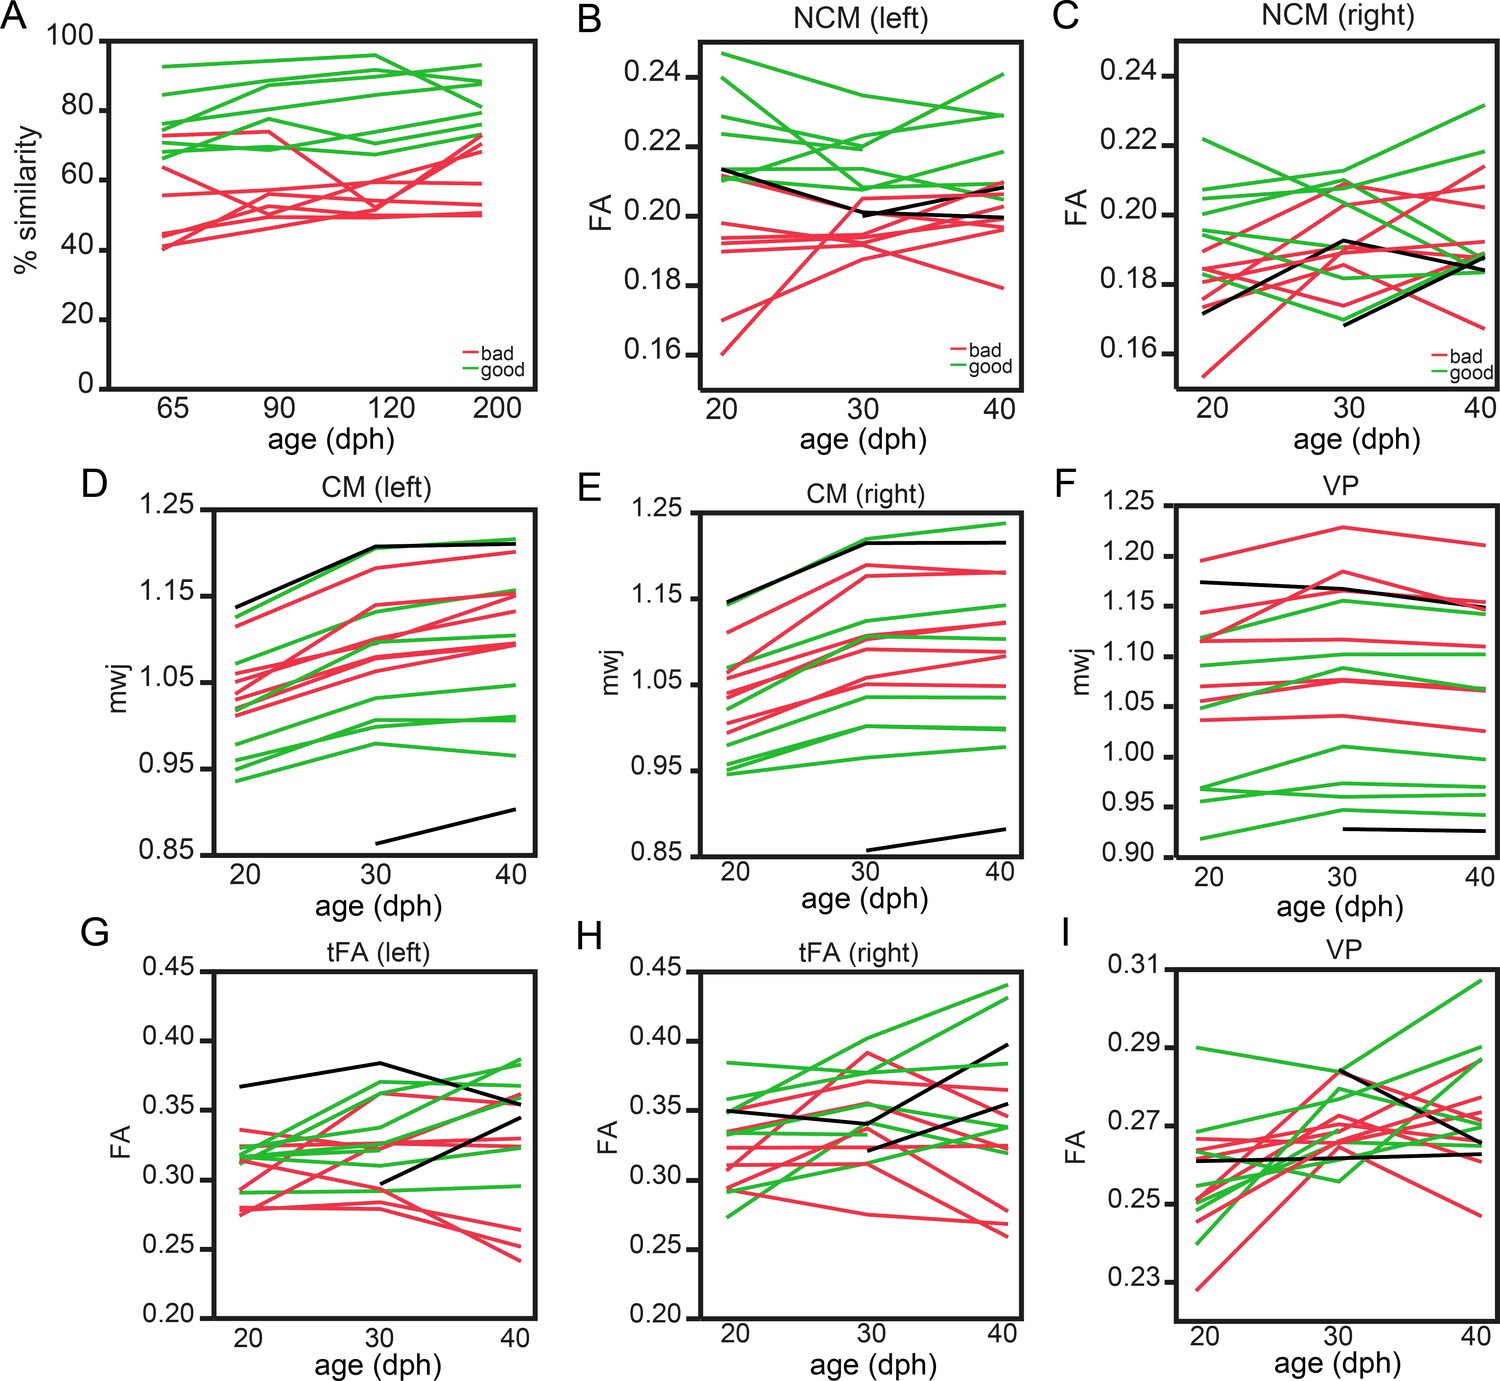
The structural properties of the VP, CM and tFA cannot predict future song learning accuracy.
Graph A presents the learning curve of the good (green; n = 7) and bad (red; n = 7) learning birds from 65 to 200 dph. The two birds that traversed the 65–68% song similarity score were assigned to the ‘bad learning’ group. Details on the distinction between good and bad learners can be found in the Results section and in Supplementary file 12. Graphs (B-I) present the difference in Fractional Anisotropy (FA) or mwj (local tissue volume) during the sensory (20–30 dph) or early sensorimotor phase (40 dph) of the cluster detected by the voxel-based multiple regression between good (green) and bad (red) vocal learners. The black lines refer to the two birds of which we lost the tutor song recordings and as such have not been able to quantify song % similarity. The outcome of the statistical tests is summarised in Supplementary files 8, 9 and 10.
Figure 6—figure supplement 2
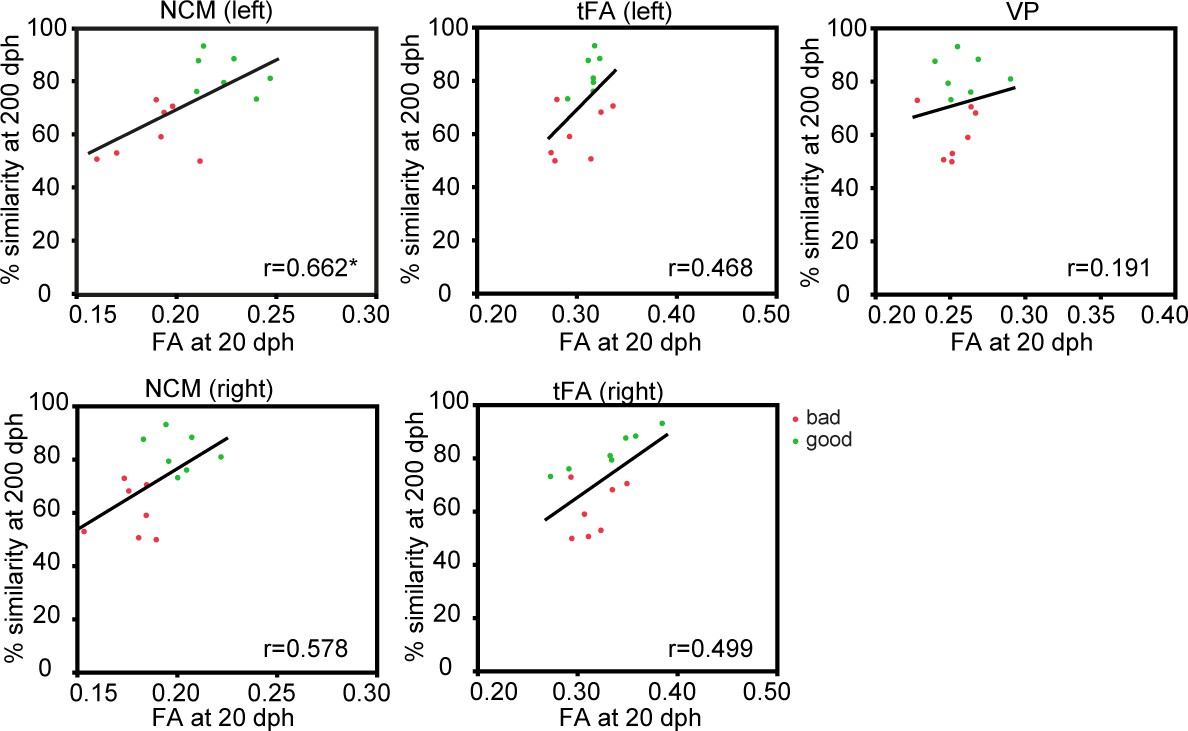
Fractional anisotropy in left NCM predicts future song learning accuracy.
Spearmans’ ρ correlation analysis between % song similarity at 200 dph and FA at 20 dph of NCM, tFA and VP to assess whether FA values at the start of the experiment (20 dph) have a predictive value for the song similarity seen in the end (200 dph). Only at the level of the left NCM, a significant positive correlation was found between FA values at 20 dph and % song similarity at 200 dph. See supplementary file 11 for statistics.
Author response image 1

Voxel-based multiple regressions using SwE showing the positive correlation between% similarity and FA.
The statistical parametric maps present the outcome of the voxel-based multiple regression testing for a correlation between song similarity and FA and are visualised at puncorr<0.001 and kE≥4 voxels, and overlaid on the population-based template and scaled according to the colour-code (T values) on the left of each statistical map. The crosshairs point to the tFA (A), the VP (C), NCM (E) all in the left hemisphere and CMM (G) in the right hemisphere. The extent and significance of these clusters is summarized in Author response table 1. Graphs B, D, F and H visualise the nature of the correlation between song similarity and FA where individual data points are colour-coded according to bird-identity (i.e. one colour = one bird). The average within-bird correlation is presented by the coloured lines, while the black dashed line indicates the overall association between song similarity and FA, disregarding bird-identity or age. ‘r’ is the repeated-measures correlation (rmcorr) coefficient. The * indicates a significant rmcorr correlation between FA and% similarity in the CMM (p=0.00287). Full summary of the overall and rmcorr correlation for all clusters is given in Author response table 2.
Author response image 2
Voxel-based multiple regressions using SwE showing the negative correlation between% similarity and log mwj.
The statistical parametric maps present the outcome of the voxel-based multiple regression testing for a correlation between song similarity and local tissue volume and are visualised at puncorr<0.001 and kE≥20 voxels, and overlaid on the population-based template and overlaid on the population-based template and scaled according to the colour-code (T values) on the left of each statistical map. The crosshairs point to the VP (A) or the CM in the left hemisphere (C). The extent and significance of these clusters is summarized in Author response table 1. Graphs B and D inform on the nature of the association between song similarity (%) and log-transformed modulated jacobian determinant (log mwj; a metric reflecting local tissue volume). More specifically, the individual data points of the graphs are colour-coded according to bird-identity (i.e. one colour = one bird). The average within-bird correlation is presented by the coloured lines, while the dashed black line indicates the overall association between song similarity and log mwj, disregarding bird-identity or age. ‘r’ is the repeated-measures correlation (rmcorr) coefficient. The * indicates a significant rmcorr correlation between logmwj and% similarity in the VP (p=0.0245) and in CM (left: p=0.0175). Full summary of the overall and rmcorr correlation for all clusters is given in Author response table 2.
Author response image 3

Relative volume differences between consecutive sub-phases of vocal learning in male and female zebra finches.
The statistical maps highlight voxels where the modulated jacobian determinants are larger (blue: volume decrease from first to later phase) or smaller (red; expansion from first to later phase) at the sensory phase compared to the sensorimotor phase, sensorimotor compared to the crystallization phase, or around crystallization compared to 200 dph. The sensory phase includes data obtained at 20–30 dph, the sensorimotor phase 40–65 dph, and the crystallization phase 90–120 dph. The statistical maps are color-coded according to the scale on the right (T-values; T = 5.09 corresponds to pFWE<0.05, no cluster extent threshold). Author response image 4 presents anatomical labels on the slices underlying the statistical maps. The white arrow in the horizontal slices points to LMAN. Abbreviations: dph: days post hatching; Do: dorsal; Ve: ventral; Ro: rostral; Ca: caudal. (Hamaide et al., 2018).
Author response image 4
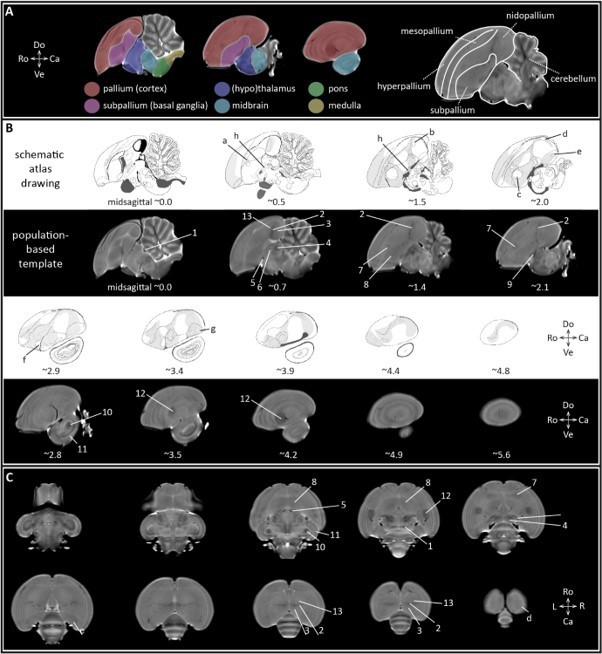
Bird brain anatomy.
A informs on the different subdivisions of the zebra finch brain projected on the population-based template. The colors refer to pallium, subpallium, thalamus and hypothalamus, midbrain, pons and medulla. The drawing on the right subdivides the telencephalon in its different sub-regions delineated by laminae, and cerebellum. B illustrates sagittal slices of the bird brain including schematic atlas drawings obtained from the zebra finch histological atlas browser (Oregon Health and Science University, Portland, OR 97239; http://www.zebrafinchatlas.org (Karten et al., 2013), and MR-images extracted from the population-based template. The numbers below the sagittal slices appoint the approximate (~) distance (mm) from the midline. Anatomical areas visible on the T2-weighted MRI slices are appointed by numbers, while the letters indicate regions that are only visible on the schematic atlas drawings. C provides an overview of (the approximate position of) anatomical regions defined in (A) on horizontal slices derived from the population-based template. The numbers below the sagittal slices correspond to the approximate position (in ‘mm’ from the midline). Legend: a: MMAN; b: Field L2b; c: Area X; d: HVC; e: RA; f: basorostral nucleus; g: lateral arcopallium; h: basal nucleus of Meynert and ventral pallidum; 1: posterior commissure; 2: Field L; 3: NCM; 4: thalamic zone; 5: TSM; 6: anterior commissure; 7: LMAN; 8: striatum including Area X; 9: FPL (lateral prosencephalic fascicle); 10: MLd; 11: TeO or ventral part of the optical lobe; 12: entopallium; 13: medial and lateral portion of the caudal mesopallium (respectively CMM and CML). Abbreviations: Do: dorsal; Ve: ventral; Ro; rostral: Ca: caudal; L: left; R: right.
Author response image 5
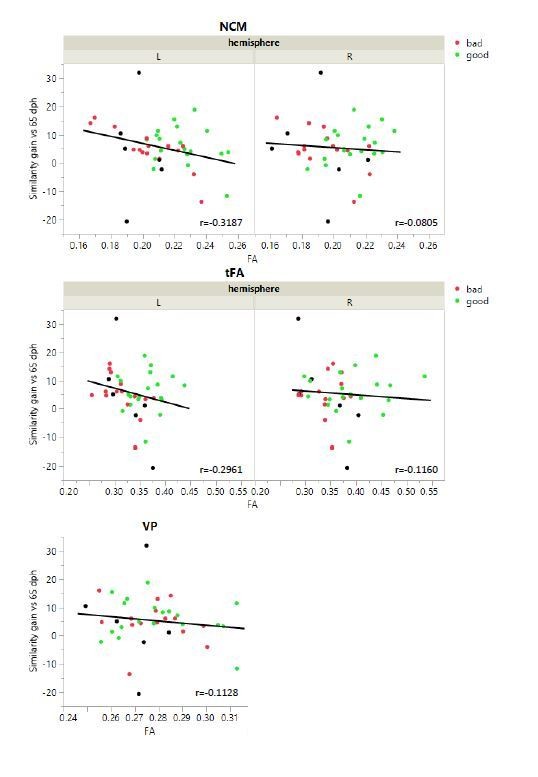
Absence of significant Spearmans’ ρ correlation between similarity gain and FA of NCM, tFA and VP.
Author response image 6
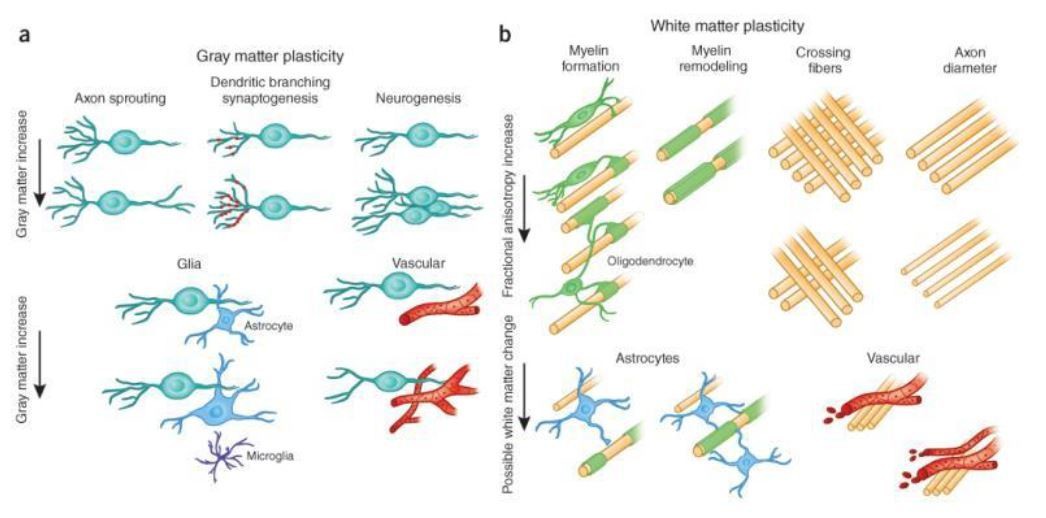
Candidate cellular and molecular mechanisms of FA changes.
(a) Cellular events underlying changes detected by MRI during learning include axon sprouting, dendritic branching and synaptogenesis, neurogenesis, changes in glial number and morphology, and angiogenesis in gray matter regions. (b) Changes in white matter include axon branching, packing density, axon diameter, fiber crossing, and the number of axons, myelination of unmyelinated axons, myelin thickness and morphology, changes in astrocyte morphology or number, and angiogenesis (from Zatorre RJ et al., Nat Neurosci. 2012).
Author response image 7

Result of voxel based multiple regression in tFA (A) used as a seed for exploratory tractography (B).
The statistical map (A) presents the outcome of the voxel-based multiple regression testing for a correlation between song similarity and FA (n=14). The crosshairs point to the tFA in the left hemisphere (A). Tractography clarifies the tracts running through tFA (B) cluster found with the voxel-based multiple regression. Seed-based fiber tractography itself was performed on ex vivo super-resolution reconstruction DTI acquired in male zebra finch brain created for Hamaide et al., 2017. The seeds were positioned at the level of tFA to filter out the relevant tracts from the whole brain probabilistic track density imaging using MRtrix3. More details on the methods used to acquire and process the tractography data can be found in (Hamaide et al., 2017).
Tables
Table 1
Summary of within- and between-subject correlations of the cluster-based ROIs.
| Correlation between | Cluster-based ROI | Hemisphere | Rmcorr | 65 dph | 200 dph | |||
|---|---|---|---|---|---|---|---|---|
| R | P | Spearmans’ ρ | P | Spearmans’ ρ | P | |||
| % similarity and FA | tFA | Left | 0.1290 | 0.4200 | 0.7846 | 0.0009 | 0.7714 | 0.0012 |
| Right | 0.0215 | 0.8940 | 0.7099 | 0.0045 | 0.7143 | 0.0041 | ||
| NCM | Left | 0.2560 | 0.1060 | 0.6747 | 0.0081 | 0.6835 | 0.0070 | |
| Right | 0.3880 | 0.0121 | 0.6396 | 0.0138 | 0.5692 | 0.0336 | ||
| VP | 0.4960 | 0.0010 | 0.8154 | 0.0004 | 0.7890 | 0.0008 | ||
| % similarity and log mwj | VP | −0.4290 | 0.0057 | −0.7978 | 0.0006 | −0.4418 | 0.1138 | |
| CM | Left | −0.3910 | 0.0126 | −0.5297 | 0.0514 | −0.3055 | 0.2882 | |
| Right | −0.4160 | 0.0075 | −0.4769 | 0.0846 | −0.1912 | 0.5126 | ||
-
‘log mwj’ refers to the log-transformed, modulated and warped jacobian determinants; FA stands for Fractional Anisotropy, one of the DTI metrics. ‘r’ is the repeated-measures correlation coefficient of the within-subject correlation analyses. Spearmans’ ρ informs on potential correlations between the MRI parameters and song similarity at a specific time point between birds. Tests that survive Benjamini-Hochberg FDR correction for multiple comparisons are highlighted in bold (Supplementary file 6, 7) Abbreviations: dph: days post hatching.
Key resources table
| Reagent type (species) or resource | Designation | Source or reference | Identifiers | Additional information |
|---|---|---|---|---|
| Strain, strain background (Taeniopygia guttata, Male) | Other | Local breeding program | ||
| Chemical compound, drug | isoflurane | Abbott, Illinois, USA | ||
| Software, algorithm | Statistical Parametric Mapping | SPM | RRID:SCR_007037 | |
| AMIRA | Amira | RRID:SCR_007353 | ||
| Matlab | Matlab | RRID:SCR_001622 | ||
| Sound Analysis Pro | SAP | RRID:SCR_016003 |
Author response table 1
Summary of the voxel-based multiple regressions using SwE (% similarity and FA).
| Correlation between | Cluster | Hemisphere | Cluster | Peak | ||
|---|---|---|---|---|---|---|
| kE | pFWE | T | puncorr | |||
| % similarity and FA | tFA | Left | 22 | 0.675 | 3.63 | <0.001 |
| Right | 7 | 0.559 | 3.79 | <0.001 | ||
| NCM | Left | 11 | 0.635 | 3.74 | <0.001 | |
| CMM | Right | 8 | 0.587 | 4.10 | <0.001 | |
| VP | 4 | 0.933 | 3.16 | 0.001 | ||
| % similarity and log mwj | VP | 852 | 0.201 | 4.09 | 0.000 | |
| CM | Left | 6265 | 0.925 | 2.49 | 0.000 | |
| Right | 9372 | 0.024* | 5.17 | 0.000 | ||
Author response table 2
Summary of the voxel-based multiple regressions using SwE (% similarity and FA or log mwj).
| Correlation between | Cluster | Hemisphere | Between- subject correlation | Within-subject correlation | ||
|---|---|---|---|---|---|---|
| Spearman’s ρ | p value | rmcorr r | rmcorr p | |||
| % similarity and FA | tFA | Left | 0.728 | <0.0001 | 0.175 | 0.274 |
| Right | 0.656 | <0.0001 | 0.326 | 0.0378 | ||
| NCM | Left | 0.635 | <0.0001 | 0.184 | 0.248 | |
| CMM | Right | 0.618 | <0.0001 | 0.454 | 0.0029* | |
| VP | 0.592 | <0.0001 | -0.041 | 0.799 | ||
| % similarity and log mwj | VP | -0.583 | <0.0001 | -0.399 | 0.0094* | |
| CM | Left | -0.346 | 0.0103 | -0.393 | 0.0111* | |
| Right | -0.327 | 0.0158 | -0.397 | 0.0101* | ||
Author response table 3
Benjamini-Hochberg FDR correction for multiple comparisons of rmcorr analyses.
| MRI parameter | Cluster-based ROI | Hemisphere | p value | rank | (i/m)Q |
|---|---|---|---|---|---|
| FA | CMM | R | 0.0029* | 1 | 0.0063 |
| Log mwj | CM | R | 0.0094* | 2 | 0.0125 |
| Log mwj | CM | L | 0.0101* | 3 | 0.0188 |
| Log mwj | VP | 0.0111* | 4 | 0.0250 | |
| FA | tFA | R | 0.0378 | 5 | 0.0313 |
| FA | NCM | L | 0.248 | 6 | 0.0375 |
| FA | tFA | L | 0.274 | 7 | 0.0438 |
| FA | VP | 0.799 | 8 | 0.0500 |
Author response table 4
Summary of the ROI-based between- and within-subject correlation analysis (% similarity and FA).
| ROI | Hemisphere | Between- subject correlation | Within-subject correlation | |||
|---|---|---|---|---|---|---|
| Spearman’s ρ | p value | rmcorr r | rmcorr p | |||
| Song control system | Area X | Left | 0.0286 | 0.9228 | 0.267 | 0.0911 |
| Right | -0.1824 | 0.5325 | 0.162 | 0.313 | ||
| HVC | Left | -0.4989 | 0.0694 | -0.271 | 0.0871 | |
| Right | -0.0725 | 0.8054 | 0.0806 | 0.616 | ||
| LMAN | Left | 0.0989 | 0.7366 | -0.135 | 0.4 | |
| Right | -0.0242 | 0.9346 | -0.0114 | 0.944 | ||
| RA | Left | -0.3231 | 0.2599 | 0.029 | 0.857 | |
| Right | 0.0462 | 0.8755 | 0.138 | 0.391 | ||
| Auditory system | Field L | Left | -0.0593 | 0.8403 | 0.108 | 0.501 |
| Right | -0.2923 | 0.3105 | 0.0996 | 0.536 | ||
| NCM | Left | 0.6967 | 0.0056 | 0.109 | 0.499 | |
| Right | 0.5473 | 0.0428 | 0.185 | 0.247 | ||
| CM | Left | 0.4813 | 0.0814 | -0.123 | 0.443 | |
| Right | 0.622 | 0.0176 | 0.283 | 0.0732 | ||
| Other | VP | Left | 0.5956 | 0.0246 | 0.136 | 0.397 |
| Right | 0.6088 | 0.0209 | 0.236 | 0.138 | ||
| tFA | Left | 0.6396 | 0.0138 | 0.259 | 0.102 | |
| Right | 0.3451 | 0.2269 | 0.343 | 0.0283 | ||
| Area X surr. | Left | -0.1341 | 0.6477 | 0.193 | 0.225 | |
| Right | -0.0637 | 0.8286 | 0.293 | 0.0633 | ||
| RA surr. | Left | -0.156 | 0.5942 | -0.191 | 0.232 | |
| Right | 0.0198 | 0.9465 | 0.242 | 0.128 | ||
Additional files
-
Supplementary file 1
Clusters displaying a time effect for FA in male and female zebra finch brains.
FA stands for Fractional Anisotropy, one of the DTI metrics. The statistical maps were assessed at pFWE <0.05 and kE ≥5 voxels. ‘Interaction age*sex’ was assessed in a flexible factorial design and serves to unveil brain regions that display a sex-dependent trajectory during ontogeny ‘Time effect’ was assessed for each sex separately in a flexible factorial design and serves to unveil brain regions that change microstructurally over time. The ‘Cluster level’ and ‘Peak level’ columns refer to respectively the p-value (after ‘Family Wise Error’ correction for multiple comparisons) of the clusters and cluster extent (kE), and p- and F-values of the peak voxel of the clusters respectively, provided by SPM (see material and methods section).
- https://cdn.elifesciences.org/articles/49941/elife-49941-supp1-v1.docx
-
Supplementary file 2
Summary of the mixed-effect model analyses on the song scores.
To test for a main effect of age, a mixed-effect model (n = 14–16; details in Methods section) was set up for each song score separately with age as fixed effect, subject as random effect, subject*age as random slope and –only for statistical analyses on the syllable feature level– syllable identity as random effect nested within subject. To test for a main effect of tutor, a mixed-effect model was executed for song similarity or sequence stereotypy separately with tutor as fixed effect and subject as random effect. The restricted Maximum Likelihood method was used to fit the data and significance was assessed using F-tests with the Kenward-Roger approximation.
- https://cdn.elifesciences.org/articles/49941/elife-49941-supp2-v1.docx
-
Supplementary file 3
Number of syllables in the songs of good and bad learners.
‘>65–68%’ indicates that the birds always sung song copies with a song similarity to tutor song score of at least 68%, while ‘<65–68%’ indicates that birds always sung songs with song similarity score lower than 65–68% similarity to tutor song. The 65–68% threshold was chosen arbitrarily based on the overall performance of the birds within the study.
- https://cdn.elifesciences.org/articles/49941/elife-49941-supp3-v1.docx
-
Supplementary file 4
Summary of the voxel-based multiple regressions (% similarity and FA).
FA stands for Fractional Anisotropy, one of the DTI metrics. This table summarises the outcome of the voxel-based multiple regression based on 54 data points (12 birds with 4 time points and 2 birds with 3 time points). The ‘Cluster’ and ‘Peak’ columns refer to two different levels of assessing significance, respectively cluster-based inference and peak- or single voxel-based inference where the T- and p-value of the voxel with highest significance of the cluster is reported. Only clusters surviving pFWE <0.05 and kE > 5 voxels were considered significant. Grey font refers to clusters that were only visible when exploring the data at an exploratory statistical threshold, that is p uncorrected <0.001 and kE > 40 voxels. At this lower statistical threshold for visual assessment of the statistical maps, only clusters that still appeared significant with FWE correction at the cluster and peak level were considered relevant. The cluster extent for the clusters in the right tFA and right NCM are not reported as they could only be observed with an exploratory threshold (which influences cluster extent).
- https://cdn.elifesciences.org/articles/49941/elife-49941-supp4-v1.docx
-
Supplementary file 5
Summary of the voxel-based multiple regressions (% similarity and log mwj).
‘log mwj’ refers to the log-transformed, modulated and warped jacobian determinants. This table summarises the outcome of the voxel-based multiple regression based on 54 data points (12 birds with 4 time points and 2 birds with 3 time points). The ‘Cluster’ and ‘Peak’ columns refer to two different levels of assessing significance, respectively cluster-based inference and peak- or single voxel-based inference where the T- and p-value of the voxel with highest significance of the cluster is reported. Only clusters surviving pFWE <0.05 and kE > 5 voxels were considered significant.
- https://cdn.elifesciences.org/articles/49941/elife-49941-supp5-v1.docx
-
Supplementary file 6
Benjamini-Hochberg FDR correction for multiple comparisons of rmcorr analyses.
'log mwj’ refers to the log-transformed, modulated and warped jacobian determinants; FA stands for Fractional Anisotropy, one of the DTI metrics. rmcorr’ is the repeated-measures correlation analysis. FDR rate = 0.05; number of tests = 8; i is the rank, m is the total number of tests and Q is the false discovery rate set at 0.05. Only those tests that survive FDR correction for multiple comparisons are highlighted in bold. ‘
- https://cdn.elifesciences.org/articles/49941/elife-49941-supp6-v1.docx
-
Supplementary file 7
Benjamini-Hochberg FDR correction for multiple comparisons of Spearmans’ ρ analyses.
'log mwj’ refers to the log-transformed, modulated and warped jacobian determinants; FA stands for Fractional Anisotropy, one of the DTI metrics. rmcorr’ is the repeated-measures correlation analysis. FDR rate = 0.05; number of tests = 16; i is the rank, m is the total number of tests and Q is the false discovery rate set at 0.05. Only those tests that survive FDR correction for multiple comparisons are highlighted in bold.
- https://cdn.elifesciences.org/articles/49941/elife-49941-supp7-v1.docx
-
Supplementary file 8
Summary of mixed-effect model.
This table summarises the results of the mixed-effect model analyses testing for an interaction between age (20-30-40 dph) and future good-bad learning outcome (n = 14 birds). The mixed-effect model includes a fixed effect for age and for learning outcome (good-bad), and a random factor for bird identity. The restricted Maximum Likelihood method was used to fit the data and significance was assessed using F-tests with the Kenward-Roger approximation.
- https://cdn.elifesciences.org/articles/49941/elife-49941-supp8-v1.docx
-
Supplementary file 9
Benjamini-Hochberg FDR correction for multiple comparisons of the interaction good-bad*age.
FDR rate = 0.05; number of tests = 8; i is the rank, m is the total number of tests and Q is the false discovery rate set at 0.05; None of the tests survives FDR correction.
- https://cdn.elifesciences.org/articles/49941/elife-49941-supp9-v1.docx
-
Supplementary file 10
Benjamini-Hochberg FDR correction for multiple comparisons of the main effect good-bad.
FDR rate = 0.05; number of tests = 8; i is the rank, m is the total number of tests and Q is the false discovery rate set at 0.05. Only those tests that survive FDR correction for multiple comparisons are highlighted bold.
- https://cdn.elifesciences.org/articles/49941/elife-49941-supp10-v1.docx
-
Supplementary file 11
Benjamini-Hochberg FDR correction for multiple comparisons of the spearman’s correlation between % song similarity at 200 dph and FA at 20 dph.
FDR rate = 0.05; number of tests = 5; i is the rank, m is the total number of tests and Q is the false discovery rate set at 0.05. Only those tests that survive FDR correction for multiple comparisons are highlighted bold.
- https://cdn.elifesciences.org/articles/49941/elife-49941-supp11-v1.docx
-
Supplementary file 12
Detailed information on bio-parents, foster-parents and tutors of the male zebra finches.
- https://cdn.elifesciences.org/articles/49941/elife-49941-supp12-v1.docx
-
Transparent reporting form
- https://cdn.elifesciences.org/articles/49941/elife-49941-transrepform-v1.pdf
Download links
A two-part list of links to download the article, or parts of the article, in various formats.
Downloads (link to download the article as PDF)
Open citations (links to open the citations from this article in various online reference manager services)
Cite this article (links to download the citations from this article in formats compatible with various reference manager tools)
In vivo assessment of the neural substrate linked with vocal imitation accuracy
eLife 9:e49941.
https://doi.org/10.7554/eLife.49941


