The hazards of smoking and the benefits of cessation: a critical summation of the epidemiological evidence in high-income countries
- Centre for Global Health Research, Dalla Lana School of Public Health and Unity Health, Toronto, University of Toronto, Canada
Figures
Figure 1
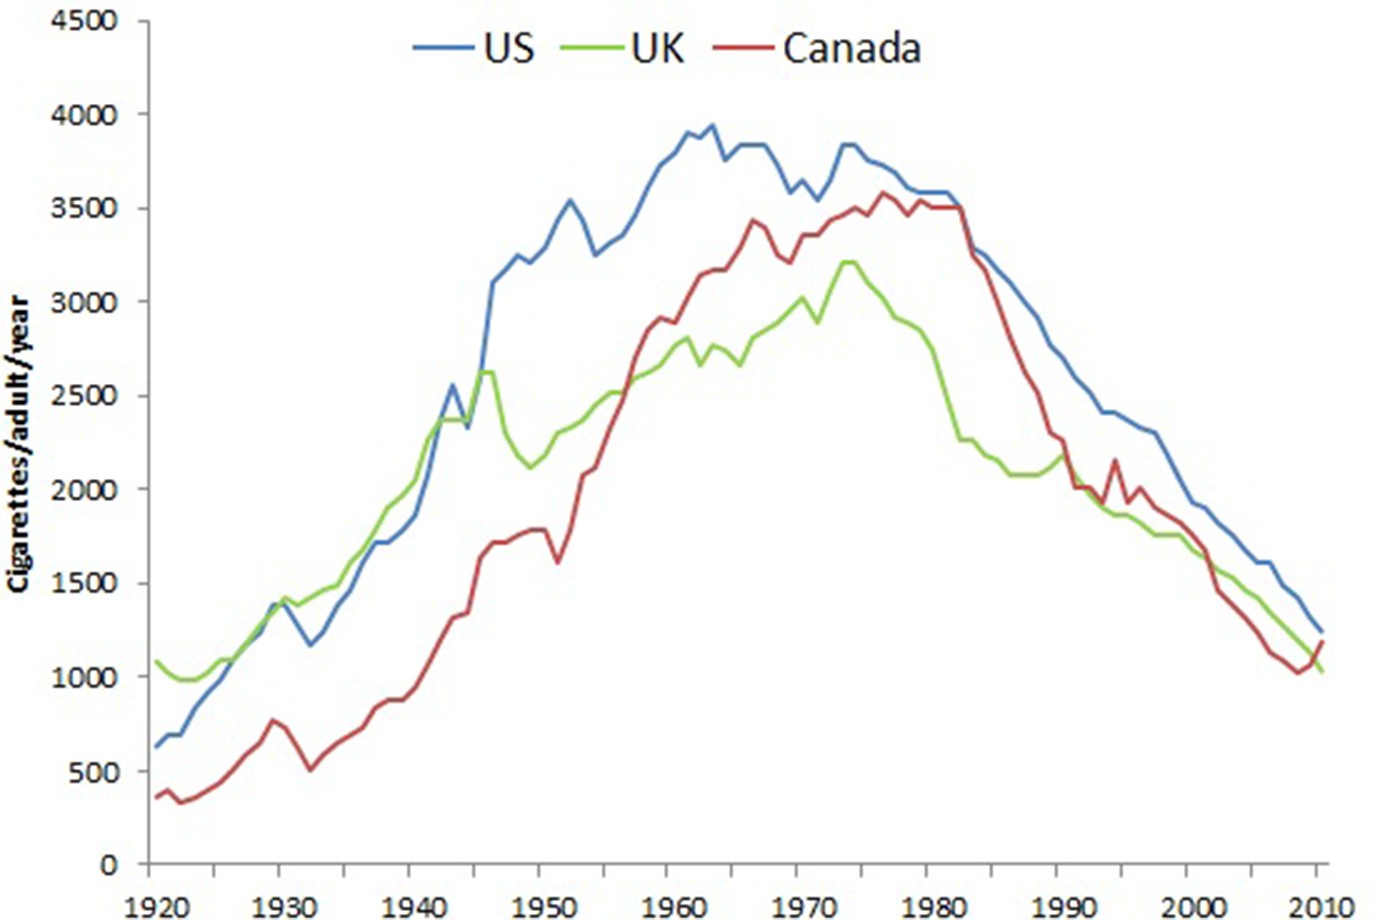
Trends in per capita consumption in Canada, US, UK in cigarettes per adult per year.
Note. Data from Forey et al. (2016), International smoking statistics.
Figure 2

Prevalence (%) of adult males (right panel), and females (left panel), usually 15 to 18 years or older that smoke by sex in US, UK and Canada.
Note. Data from National Center for Health Statistics, 2008, 1965–2012 National Health Interview Survey (NHIS); Office for National Statistics, 2018, Adult Smoking habits in Great Britain; and Reid et al., 2017, Tobacco Use in Canada: Patterns and Trends, 2017 Edition.
Figure 3
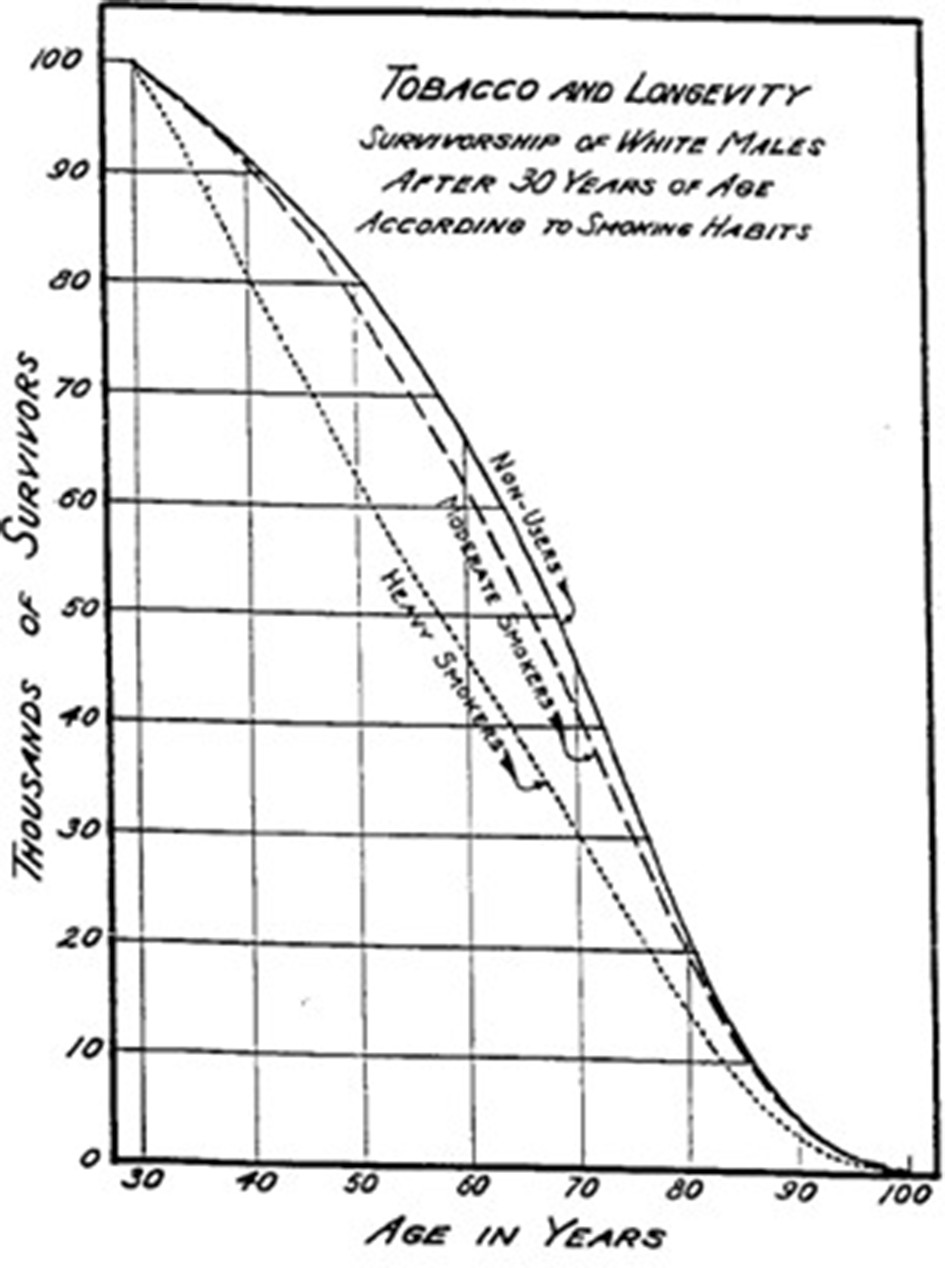
Survival by smoking among US insured adults.
© 1938, The American Association for the Advancement of Science, All Rights Reserved. Figure 3 is reproduced from Pearl (1938) with permission. It is not covered by the CC-BY 4.0 licence and further reproduction of this panel would need permission from the copyright holder.
Figure 4

Trends in per capita cigarette consumption and age-standardized lung cancer death rates in the US.
Adapted from American Cancer Society (2013).
Figure 5
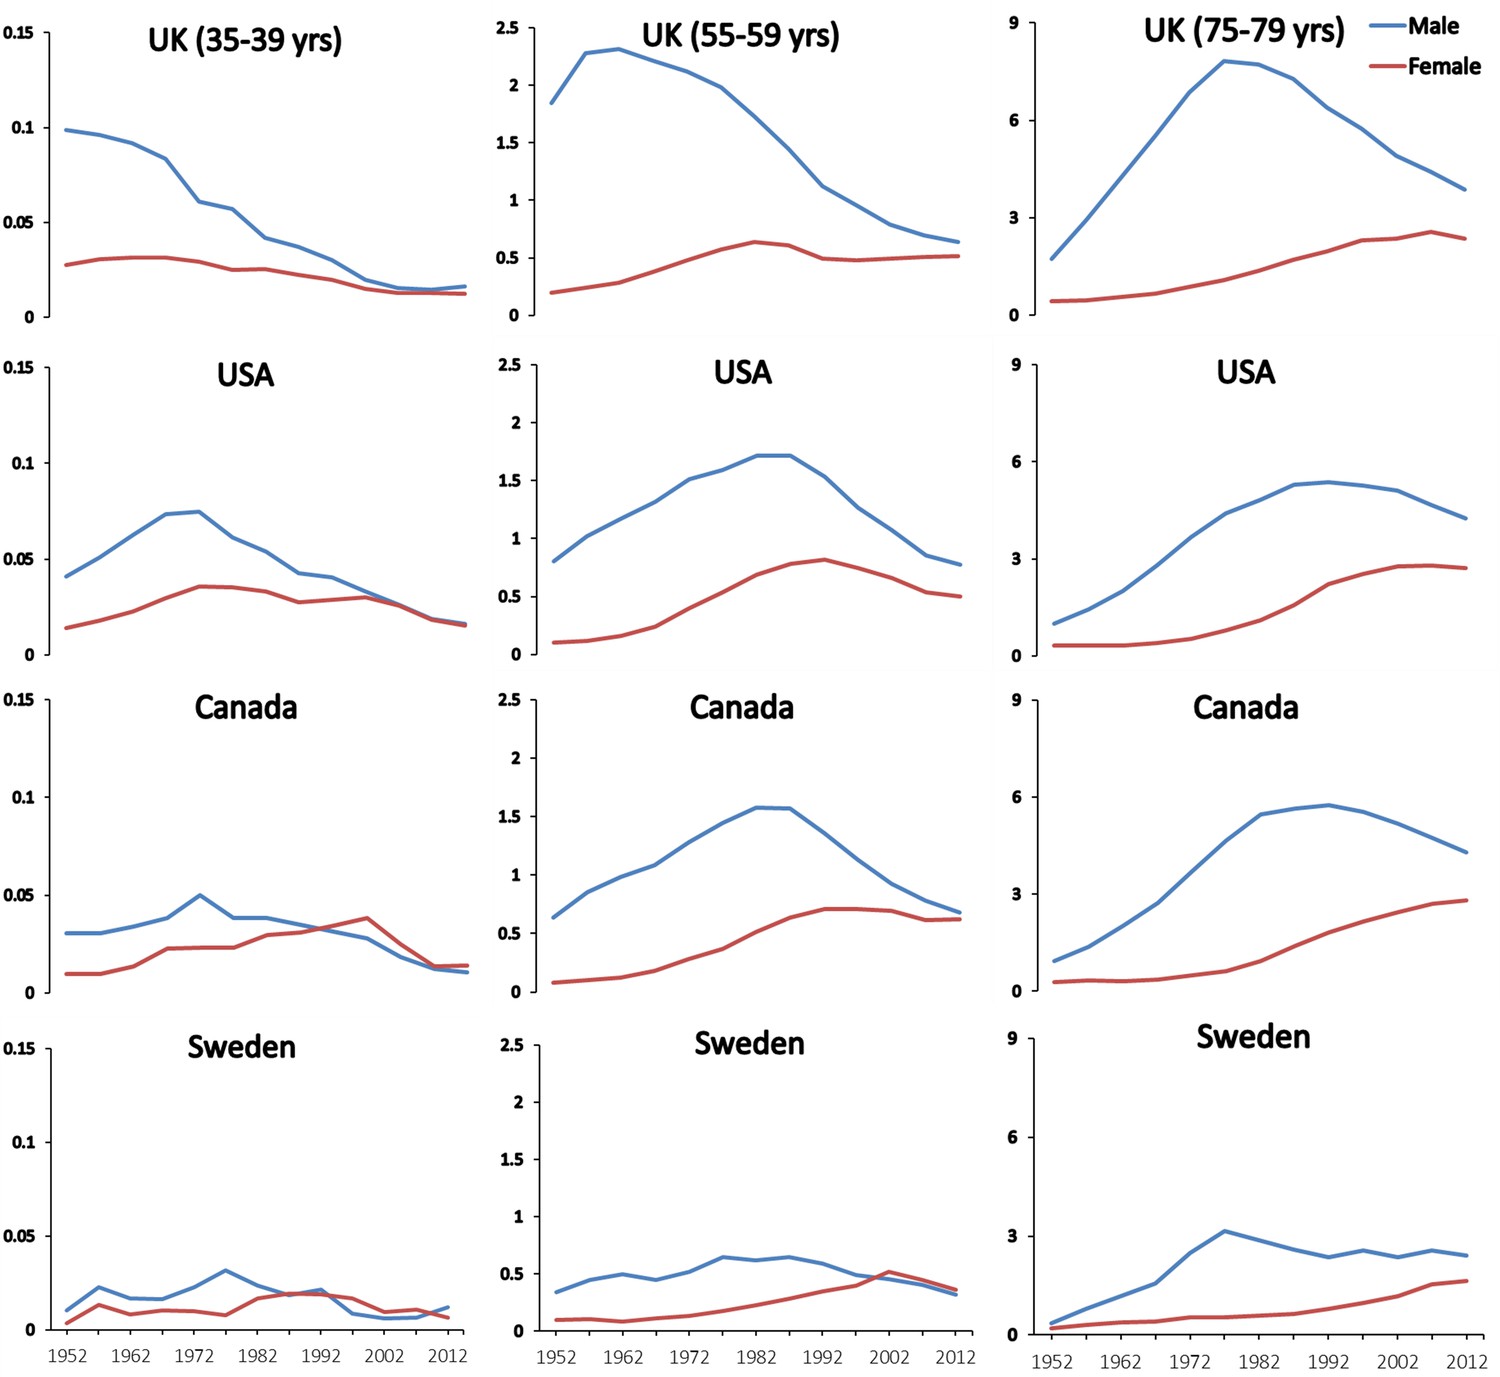
Trends in age-specific lung cancer death rates among men and women at ages 35–39, 55–59 and 75–79 in selected countries.
Figures provided by Hangchao Pan and Richard Peto, University of Oxford, 2018.
Figure 6
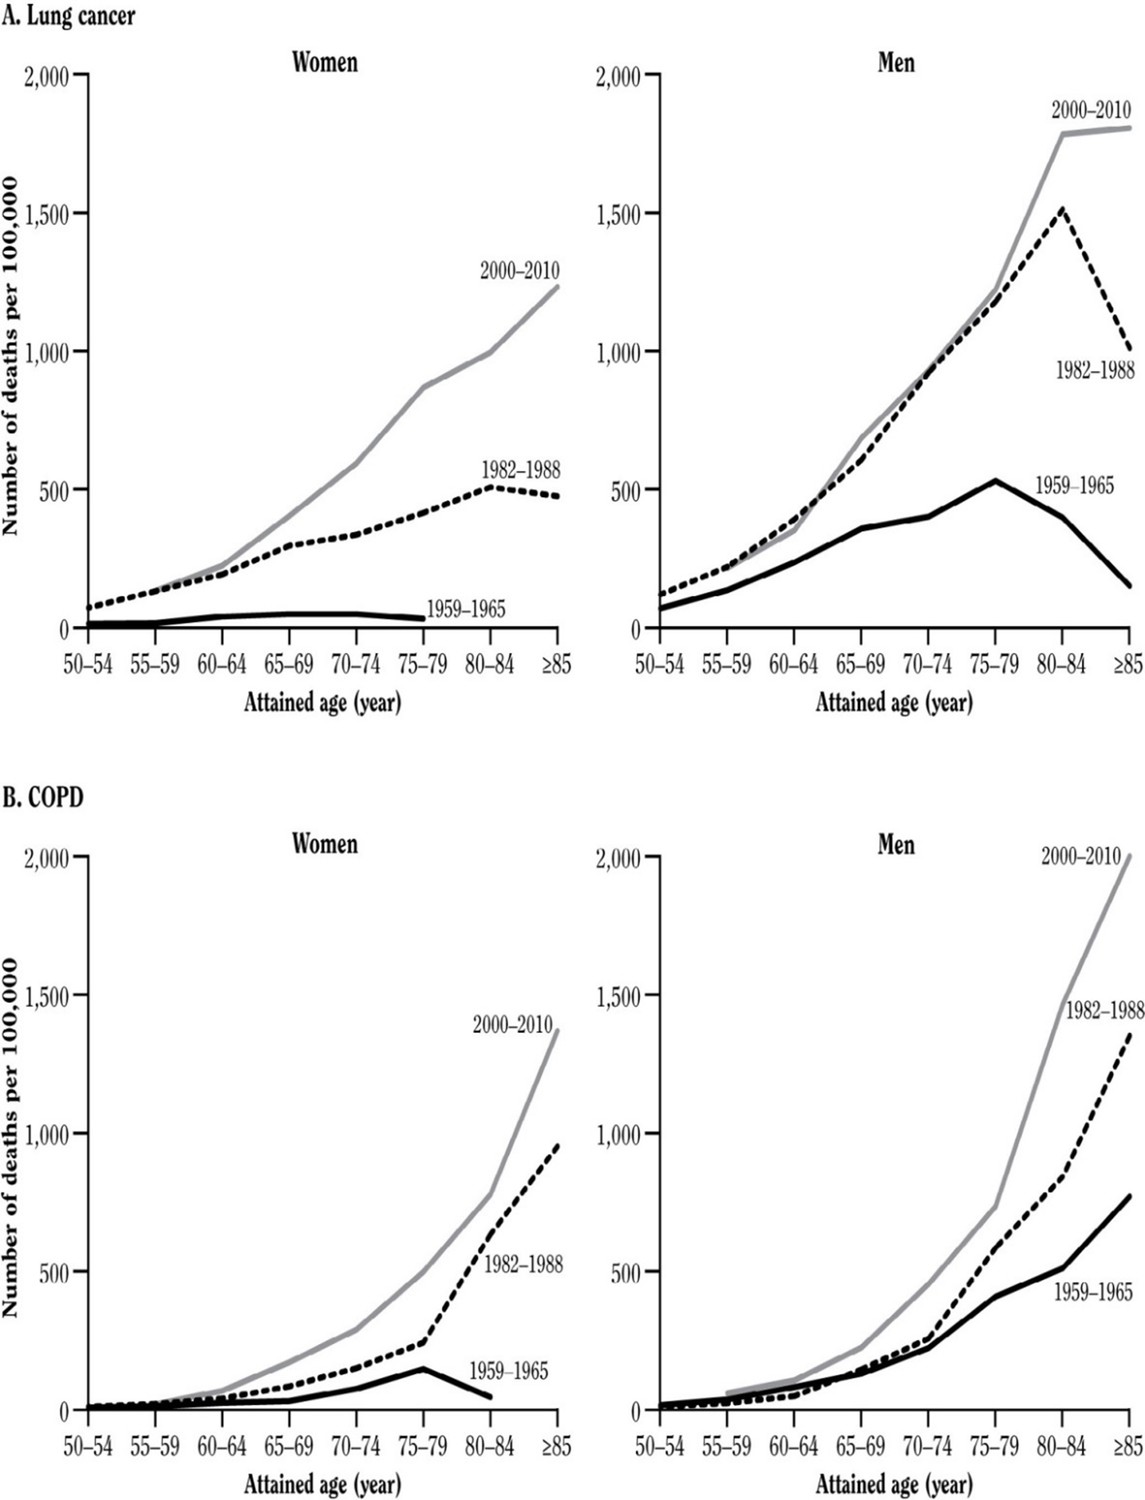
Lung cancer death rates by sex by study period.
Adapted from U.S. Department of Health and Human Services (2014).
Figure 7
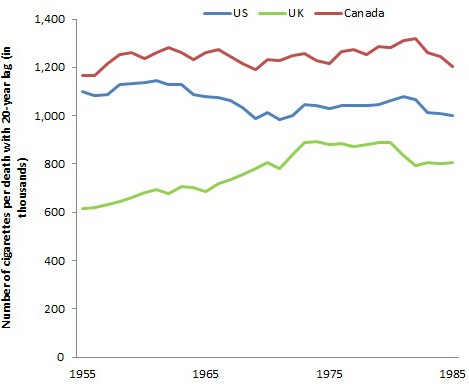
Number of cigarettes (from 1955 to 1985) per death with a 20 year lag in US, UK, and Canada (from 1975 to 2005).
Note. Author’s calculations.
Figure 8
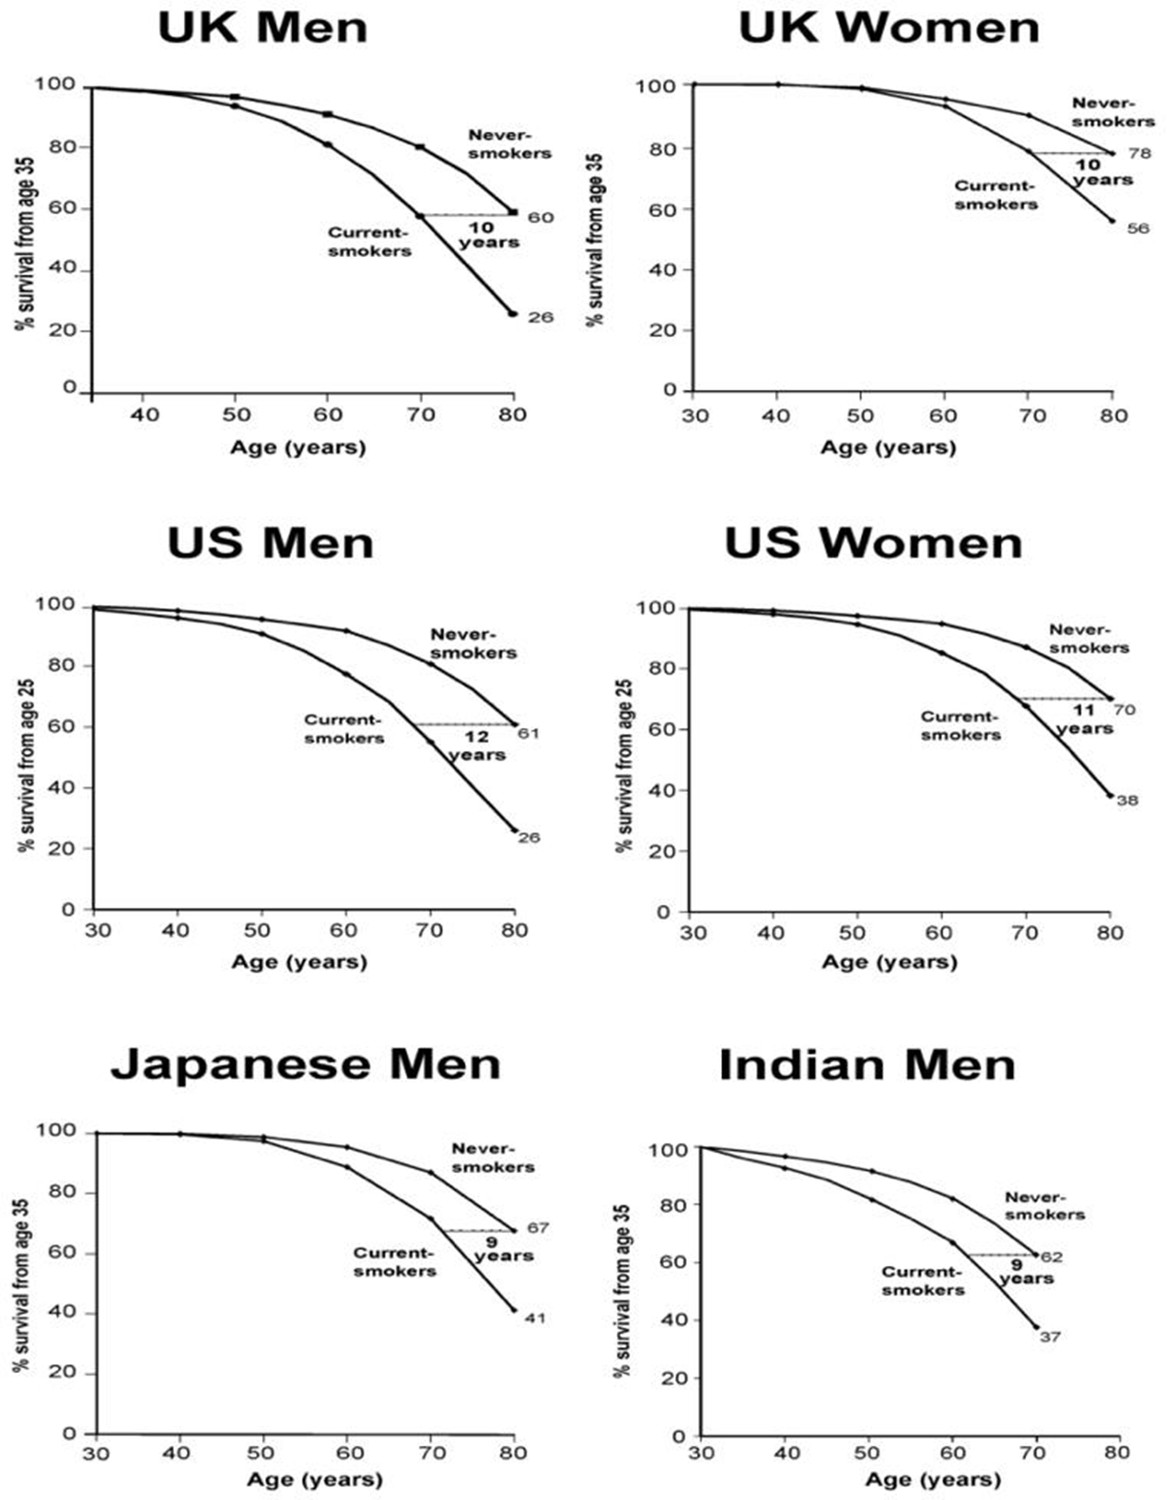
Survival differences between smokers and non-smokers, adjusting for various factors.
Adapted from Jha and Peto (2014), p. 62.
Figure 9
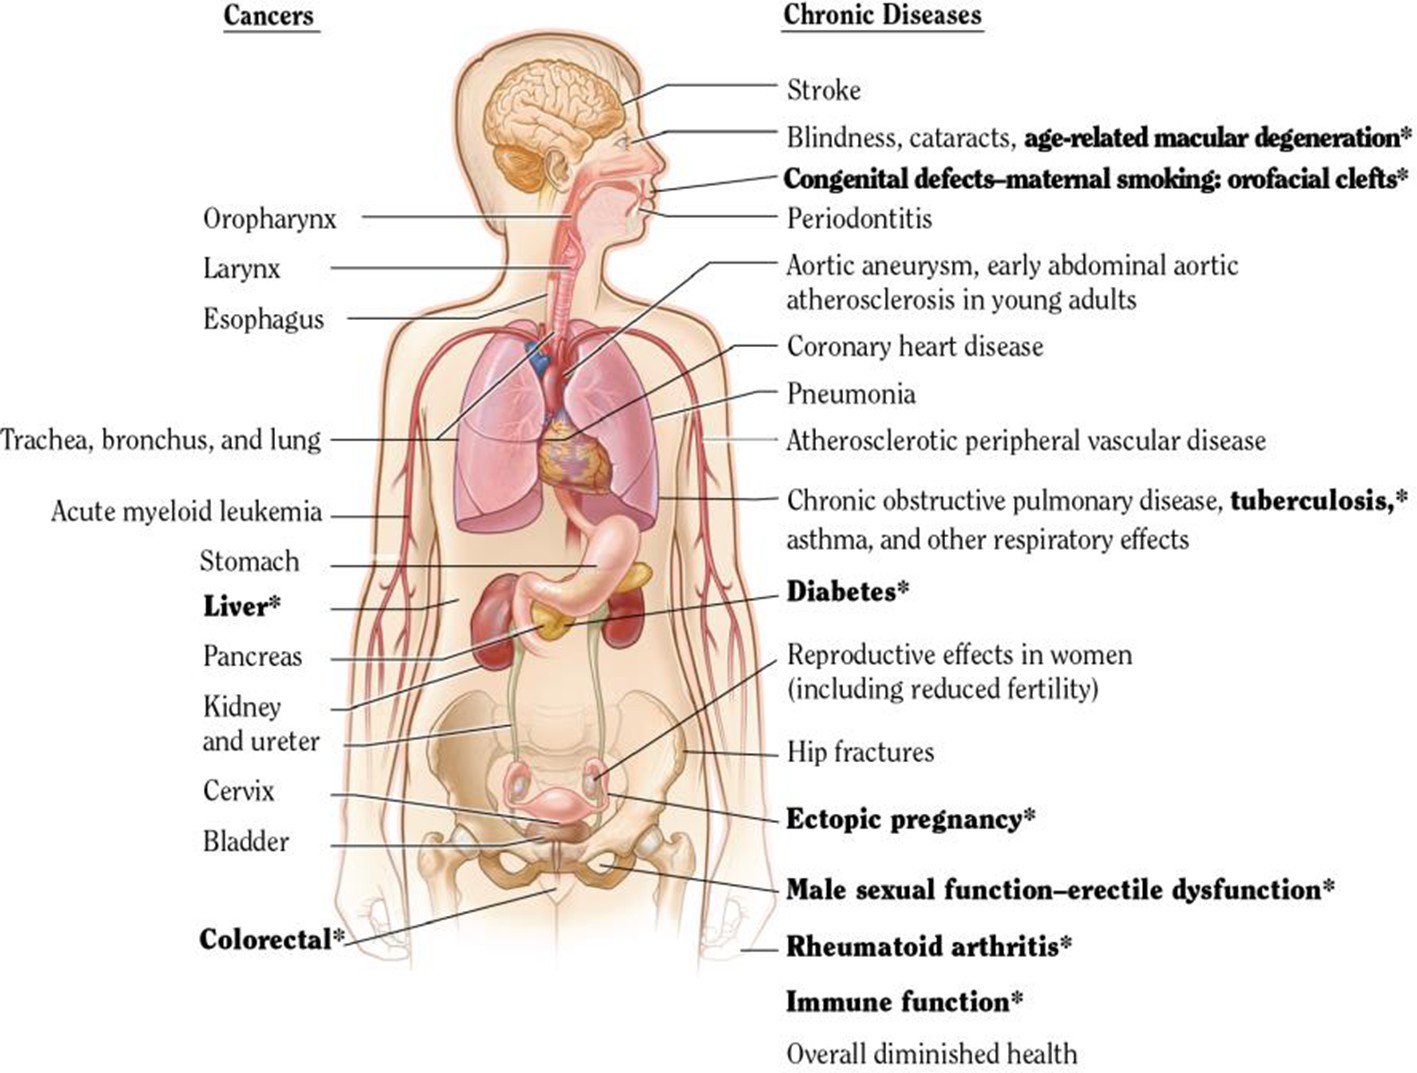
USSGR 2014 estimation of anatomic sites and cancers linked to smoking.
Adapted from U.S. Department of Health and Human Services (2014).
Figure 10
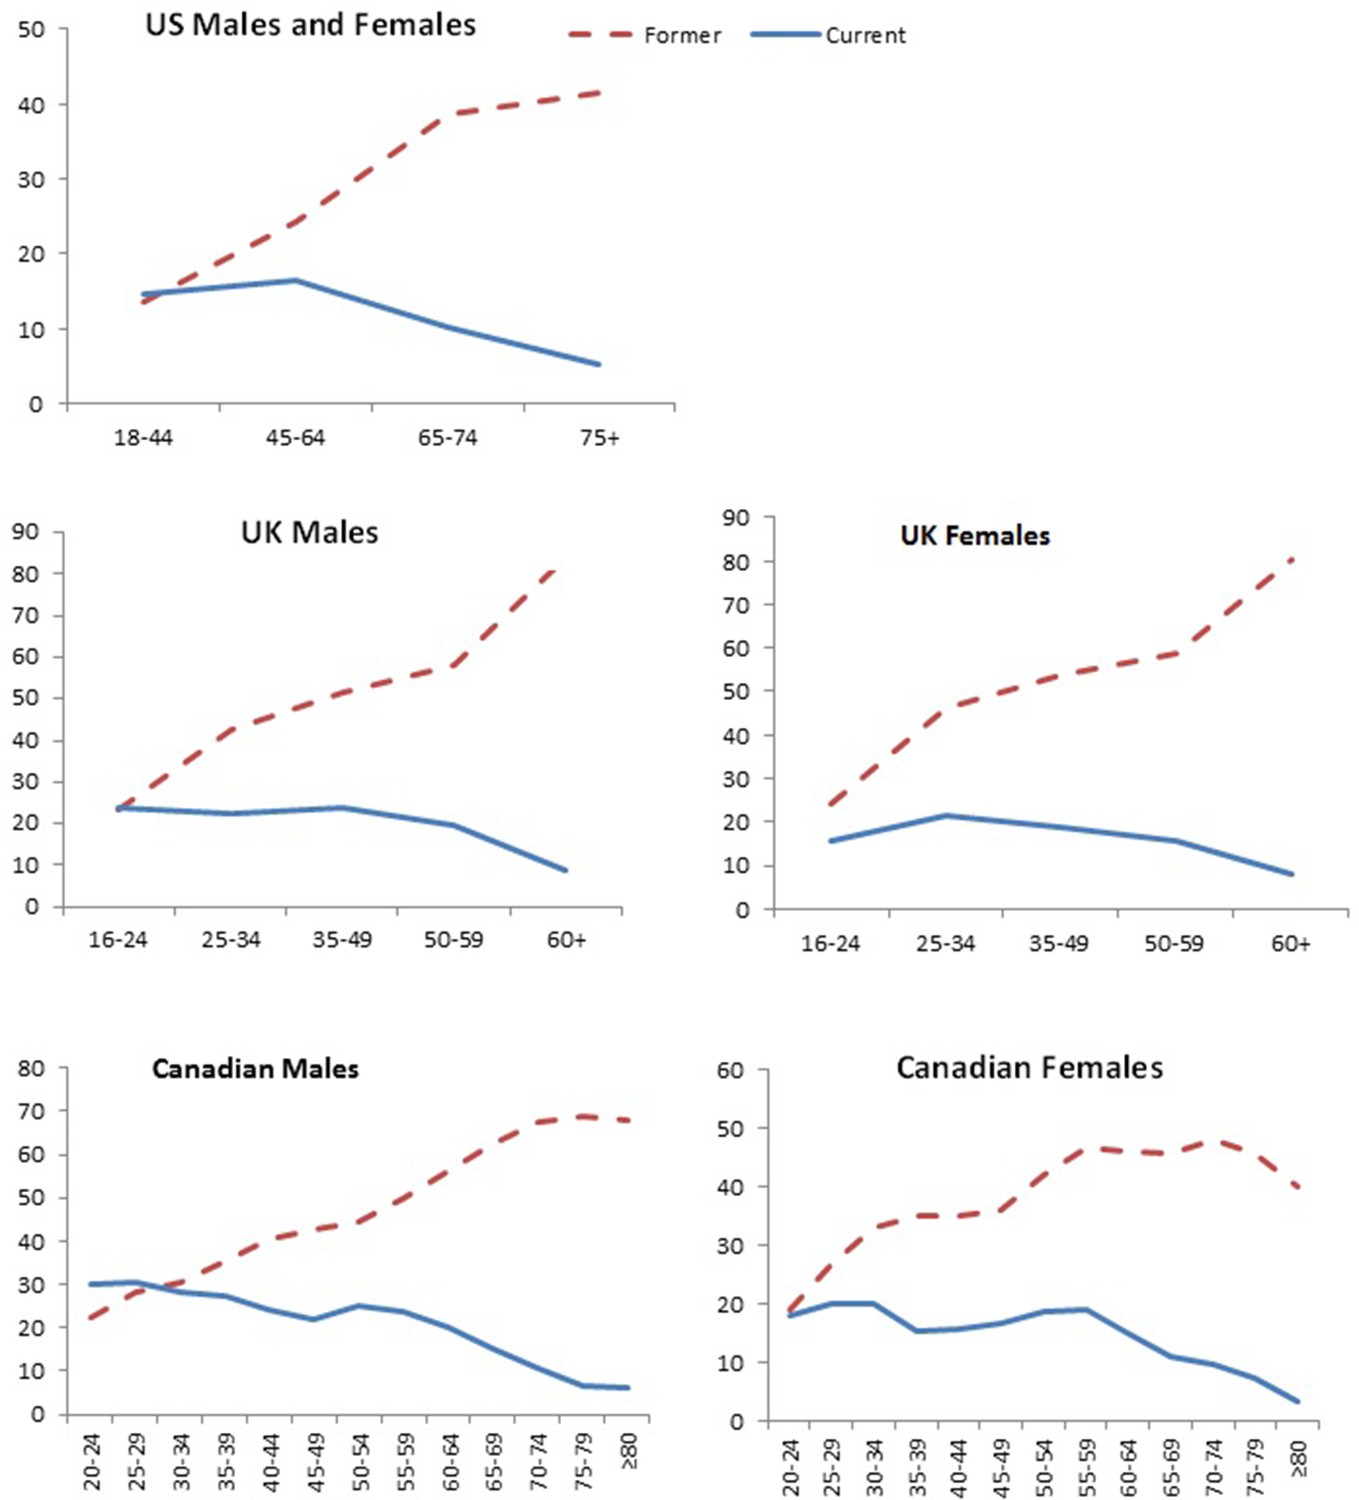
Former and current smoking prevalence, US (2017), UK (2017), and Canada (2014) by sex and age group.
Note. Data from National Center for Health Statistics, 2017, NHIS, Office for National Statistics, 2017, Adult Smoking habits in Great Britain; Statistics Canada, 2016, Canadian Community Health Survey.
Figure 11
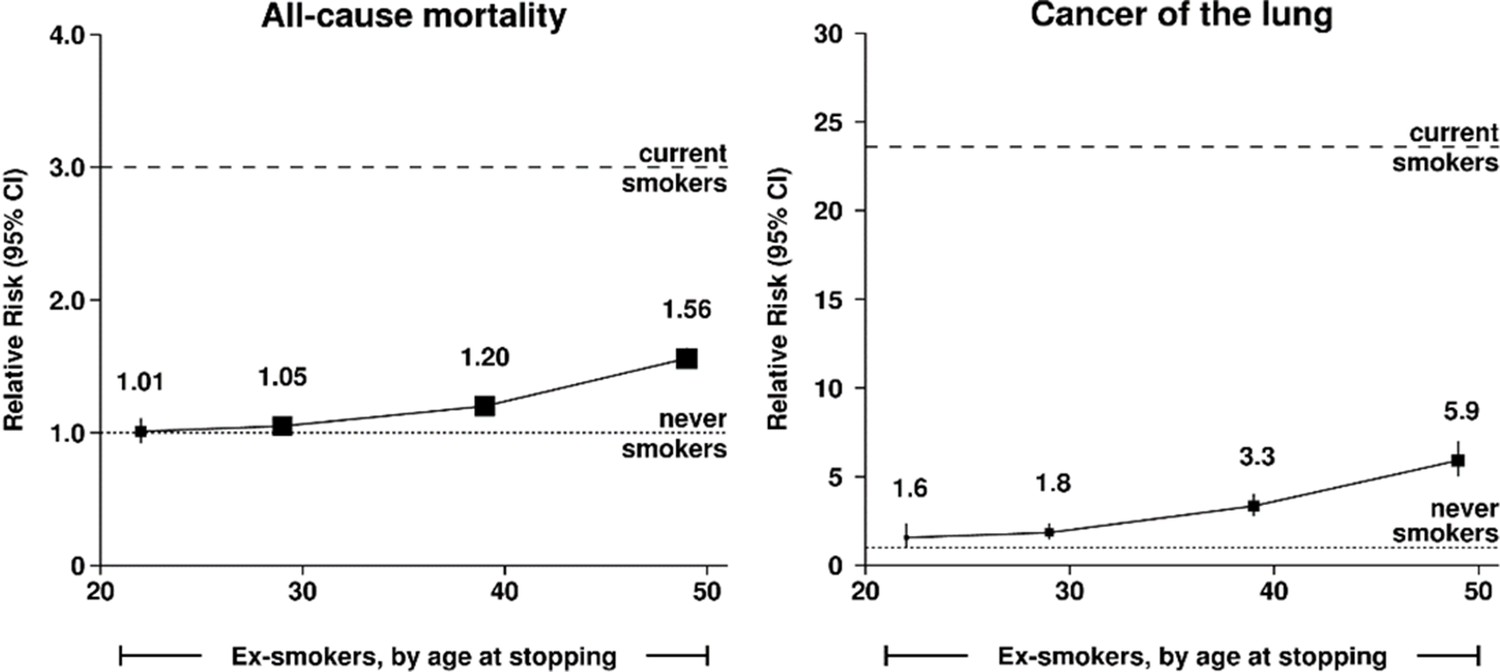
Relative risks for all-cause mortality and cancer of the lung, by age of quitting, among UK women.
Adapted from Pirie et al. (2013), p. 138.
Figure 12
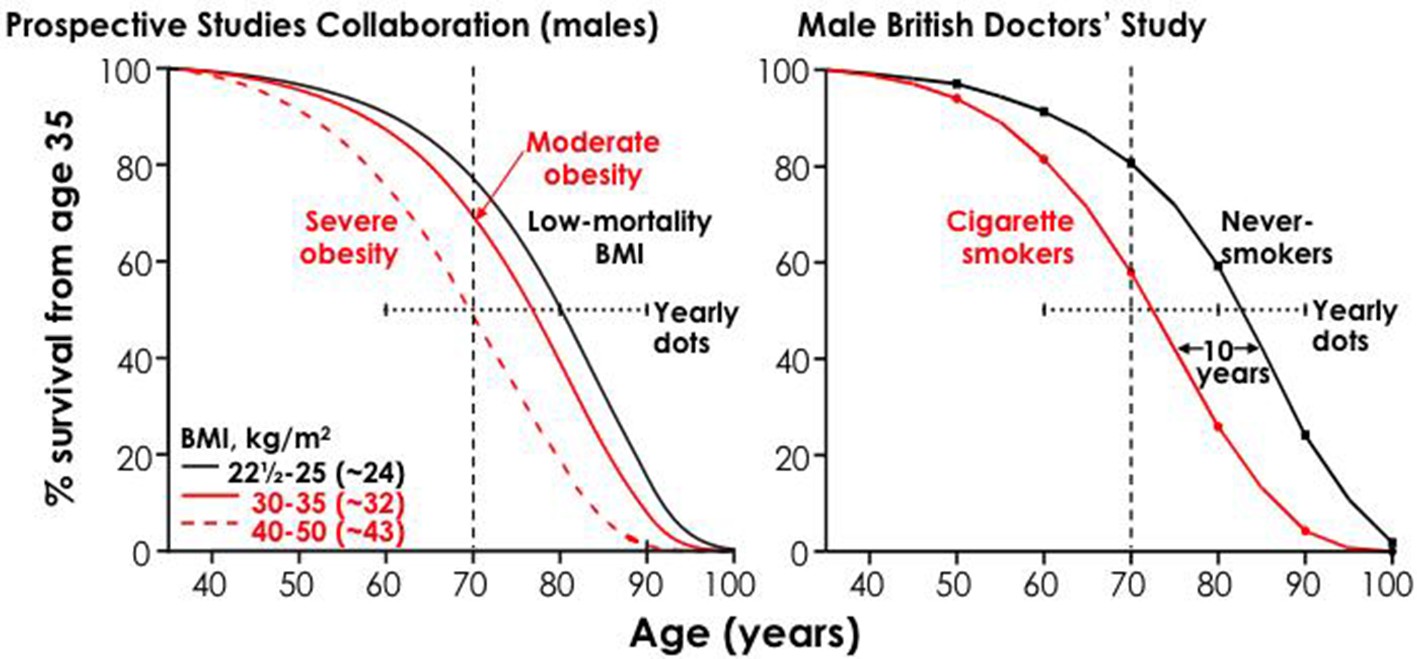
Life expectancy: loss of 3 years with moderate obesity and 10 years with smoking.
Note: 2 kg/m2 extra BMI (if overweight) or 10% smoking prevalence shortens life by ~1 year. Adapted from Peto et al. (2010), p. 856.
Tables
Table 1
Adult smoking prevalence (daily and non-daily) and daily cigarettes for US, UK, and Canada in 2000 and 2015.
| Year | 2000 | 2015 | Change in % |
|---|---|---|---|
| Prevalence* | |||
| US | 23.1 | 15.2 | −34.2% |
| UK | 27.0 | 17.8 | −34.1% |
| Canada | 24.4 | 13.0 | −46.7% |
| Amount per day (among daily smokers) | |||
| US | 18.1 | 14.2 | −21.5% |
| UK* | 13.8 | 11.3 | −18.1% |
| Canada | 16.8 | 13.8 | −17.9% |
-
*Daily and non-daily smokers.
Note. Data from National Centre for Health Statistics, NHIS; Office of National Statistics, Adult Smoking habits in Great Britain; Statistics Canada and Reid et al., 2017, Tobacco Use in Canada: Patterns and Trends, 2017 Edition –Defined as having smoked in the past 30 days and having smoked 100 cigarettes in a lifetime. Adult ages are 15+ in Canada and the UK and 18+ in the US.
Table 2
Trends in smoking-attributable deaths from 1955 to 2015, (with projections to 2020) by sex in US, UK, and Canada (in thousands).
| Year | US | UK | Canada | ||||
|---|---|---|---|---|---|---|---|
| Smoking-attributable | Total | Smoking-attributable | Total | Smoking-attributable | Total | ||
| Males | |||||||
| 1955 | 139 | 882 | 90 | 303 | 8.8 | 75 | |
| 1965 | 235 | 1 036 | 126 | 324 | 17 | 87 | |
| 1975 | 305 | 1 063 | 142 | 337 | 26 | 96 | |
| 1985 | 335 | 1 092 | 125 | 325 | 31 | 100 | |
| 1995 | 341 | 1 163 | 95 | 308 | 33 | 111 | |
| 2005 | 302 | 1 199 | 67 | 279 | 29 | 116 | |
| 2015 | 286 | 1 325 | 55 | 264 | 28 | 129 | |
| 1960–2020* | 18 040 | 68 760 | 6 100 | 18 370 | 1 640 | 6 390 | |
| Females | |||||||
| 1955 | 1.4 | 663 | 12 | 285 | 0 | 54 | |
| 1965 | 19 | 795 | 24 | 307 | 0.7 | 61 | |
| 1975 | 79 | 858 | 43 | 331 | 4.2 | 70 | |
| 1985 | 169 | 983 | 59 | 331 | 11 | 80 | |
| 1995 | 272 | 1 135 | 69 | 332 | 20 | 99 | |
| 2005 | 302 | 1 229 | 66 | 306 | 26 | 113 | |
| 2013 | 302 | 1 288 | 60 | 277 | 30 | 126 | |
| 1960–2020* | 11 430 | 62 880 | 3 210 | 18 840 | 919 | 5 490 | |
| Both sexes 1960–2020* | 29 470 | 131 640 | 9 310 | 37 210 | 2 559 | 11 880 | |
-
* 1960-2020* 1960–2020 totals by taking totals for 1965, 1975, 1986, 1995, 2005 and 2015 totals multiplied by 10. Note. Author’s calculations based on Peto et al. (2018).
Cumulatively, from 1960 to 2020, smoking killed about 29.5 million Americans, 9.3 million UK residents, and 2.6 million Canadians, or a total of 41.3 million adults (Table 2).
Table 3
Proportion of deaths by cause among current smokers that would be avoided at non-smoking death rates, by sex and age
| Among smokers, % avoided at non-smoking death rates | |||||||||
|---|---|---|---|---|---|---|---|---|---|
| Disease/sex | Males | Females | |||||||
| Age groups | 35–54 | 55–64 | 65–74 | ≥75 | 35–54 | 55–64 | 65–74 | ≥75 | |
| Lung cancer | 93% | 95% | 96% | 96% | 92% | 95% | 96% | 96% | |
| Other cancers | 43% | 46% | 57% | 54% | 22% | 52% | 51% | 48% | |
| Coronary heart disease | 74% | 67% | 64% | 49% | 80% | 69% | 70% | 56% | |
| Cerebrovascular disease | 54% | 32% | 56% | 41% | |||||
| Aortic aneurysm, other arterial and atherosclerosis | 86% | 80% | 85% | 83% | |||||
| Diabetes mellitus | 33% | 9% | 35% | 9% | |||||
| All vascular at ages 35–64 | 58% | 60% | 59% | 49% | |||||
| Influenza, pneumonia, tuberculosis | 61% | 38% | 43% | 51% | |||||
| Chronic obstructive pulmonary disease | 97% | 96% | 97% | 95% | |||||
| All respiratory at ages 35–64 | 78% | 93% | 84% | 89% | |||||
| All causes | 61% | 66% | 67% | 58% | 44% | 62% | 65% | 60% | |
-
Notes: Author calculations. The avoidable proportion for each condition and sex is calculated as (RRc-1)/RRc, where RRc refers to the smoker: non-smoker relative risks (RR) for current smoking in the U.S. Department of Health and Human Services (2014) (Appendix 1).
Table 4
Relative risks for fatal and non-fatal ischemic heart disease by age for men.
| STUDY | AGE (years) | Relative risk |
|---|---|---|
| Fatal ischemic heart disease | ||
| US | 35–69 | 2.5 |
| CHINA | 35–69 | 1.2 |
| INDIA | 30–69 | 1.6 |
| Non-fatal ischemic heart disease | ||
| UK | 30–39 40–49 50–59 60–69 70–79 | 6.3 4.7 3.1 2.5 1.9 |
| INDIA | Current Ever Former | 4.7 3.9 2.6 |
| SEVERAL COUNTRIES | Current Former | 3.0 1.9 |
-
Note. Author’s calculations based on an earlier review (Jha et al., 2010).
Table 5
Relative reduction in excess risk among former smokers as compared to excess risk among current smokers, by sex and age
| Reduction in excess risk | |||||||||
|---|---|---|---|---|---|---|---|---|---|
| Disease/sex | Males | Females | |||||||
| Age groups | 35–54 | 55–64 | 65–74 | ≥75 | 35–54 | 55–64 | 65–74 | ≥75 | |
| Lung cancer | 74% | 80% | 75% | 75% | 87% | 78% | 74% | 76% | |
| Other cancers | 51% | 64% | 64% | 61% | 14% | 74% | 75% | 71% | |
| Coronary heart disease | 71% | 74% | 67% | 67% | 69% | 91% | 76% | 66% | |
| Cerebrovascular disease | 80% | 75% | 81% | 86% | |||||
| Aortic aneurysm, other arterial and atherosclerosis | 81% | 82% | 78% | 79% | |||||
| Diabetes mellitus | 40% | 46% | 40% | ||||||
| All vascular at ages 35–64 | 95% | 66% | 100% | 90% | |||||
| Influenza, pneumonia, tuberculosis | 61% | 32% | 63% | 80% | |||||
| Chronic obstructive pulmonary disease | 75% | 75% | 61% | 70% | |||||
| All respiratory at ages 35–64 | 65% | 79% | 84% | 52% | |||||
| All causes | 79% | 76% | 72% | 71% | 72% | 79% | 72% | 71% | |
-
Notes: Author calculations. The reduction in excess risk for each condition and sex is calculated as (1- [RRf-1)/ [RRc-1]), where RRf and RRc refer to the smoker: non-smoker relative risks (RR) for former and current smoking, respectively in the U.S. Department of Health and Human Services, 2014 (Appendix 1).
Table 6
Estimated probability of death (%) from any cause between ages 35 and 69 in the US population, by combination of alcohol drinking and smoking, in 1990.
| Sex and alcohol drinking status | Smokers | Non-smokers |
|---|---|---|
| MEN | ||
| Drinkers | 43 | 22 |
| Non-drinkers | 46 | 26 |
| WOMEN | ||
| Drinkers | 28 | 14 |
| Non-drinkers | 30 | 17 |
-
Adapted from Alcohol consumption and mortality among middle-aged and elderly US adults, by Thun et al. (1997), New England Journal of Medicine, 337(24), p. 1712.
Table 7
Proportions of cancer deaths in the United States in the 1970s attributed to various different factors, as defined by Doll and Peto (1981).
| Factor or class of factors | Percent of all cancer deaths | |
|---|---|---|
| Best estimate | Range of acceptable estimates | |
| Tobacco | 30 | 25–40 |
| Alcohol | 3 | 2–4 |
| Food additives | <1 | −5–2 |
| Reproductive and sexual behaviour | 7 | 1–13 |
| Occupation | 4 | 2–8 |
| Pollution | 2 | <1–5 |
| Industrial products | <1 | <1–2 |
| Medicines and medical procedures | 1 | 0.5–3 |
| Geophysical factors (mostly Ultraviolet light) | 3 | 2–4 |
| Infection | 10? | 1-? |
| Diet | 35 | 10–70 |
| Unknown | ? | ? |
-
Adapted from The causes of cancer: Quantitative estimates of avoidable risks of cancer in the United States today, Doll and Peto (1981), Journal of the National Cancer Institute, 66(6), p. 1192–1308.
Appendix 1—table 1
Relative risks for various diseases by smoking status, adults 35 or older in the United States.
| Current smokers (years of age) | Former smokers (years of age) | |||||||
|---|---|---|---|---|---|---|---|---|
| 35-54 | 55-64 | 65-74 | ≥75 | 35-54 | 55-64 | 65-74 | ≥75 | |
| MALES | ||||||||
| Lung Cancer | 14.33 | 19.03 | 28.29 | 22.51 | 4.4 | 4.57 | 7.79 | 6.46 |
| Other Cancers | 1.74 | 1.86 | 2.35 | 2.18 | 1.36 | 1.31 | 1.49 | 1.46 |
| Coronary heart disease | 3.88 | 2.99 | 2.76 | 1.98 | 1.83 | 1.52 | 1.58 | 1.32 |
| Other heart disease | 2.22 | 1.66 | 1.32 | 1.15 | ||||
| Cerebrovascular disease | 2.17 | 1.48 | 1.23 | 1.12 | ||||
| Other vascular diseases | 7.25 | 4.93 | 2.2 | 1.72 | ||||
| Diabetes mellitus | 1.5 | 1 | 1.53 | 1.06 | ||||
| Other cardiovascular diseases | 2.4 | 2.51 | 1.07 | 1.51 | ||||
| Influenza, pneumonia, tuberculosis | 2.58 | 1.62 | 1.62 | 1.42 | ||||
| Chronic obstructive pulmonary disease | 29.69 | 23.01 | 8.13 | 6.55 | ||||
| Influenza, pneumonia, tuberculosis, chronic obstructive pulmonary disease | 4.47 | 15.17 | 2.22 | 3.98 | ||||
| All Causes | 2.55 | 2.97 | 3.02 | 2.4 | 1.33 | 1.47 | 1.57 | 1.41 |
| FEMALES | ||||||||
| Lung Cancer | 13.3 | 18.95 | 23.65 | 23.08 | 2.64 | 5 | 6.8 | 6.38 |
| Other Cancers | 1.28 | 2.08 | 2.06 | 1.93 | 1.24 | 1.28 | 1.26 | 1.27 |
| Coronary heart disease | 4.98 | 3.25 | 3.29 | 2.25 | 2.23 | 1.21 | 1.56 | 1.42 |
| Other heart disease | 1.85 | 1.75 | 1.29 | 1.32 | ||||
| Cerebrovascular disease | 2.27 | 1.7 | 1.24 | 1.1 | ||||
| Other vascular diseases | 6.81 | 5.77 | 2.26 | 2.02 | ||||
| Diabetes mellitus | 1.54 | 1.1 | 1.29 | 1.06 | ||||
| Other cardiovascular diseases | 2.44 | 1.98 | 1 | 1.1 | ||||
| Influenza, pneumonia, tuberculosis | 1.75 | 2.06 | 1.28 | 1.21 | ||||
| Chronic obstructive pulmonary disease | 38.89 | 20.96 | 15.72 | 7.06 | ||||
| Influenza, pneumonia, tuberculosis, chronic obstructive pulmonary disease | 6.43 | 9 | 1.85 | 4.84 | ||||
| All Causes | 1.79 | 2.63 | 2.87 | 2.47 | 1.22 | 1.34 | 1.53 | 1.43 |
-
Source: USSGR Report, 2014. Analyses of Cancer Prevention Study II (CPS-II) and updated analyses of the pooled contemporary cohort population described in Thun et al. (2013) provided to the Centers for Disease Control and Prevention, National Center for Chronic Disease Prevention and Health Promotion, Office on Smoking and Health. See Table 12.3 of the USSGR Report for important details on each condition.
Appendix 1—table 2
Estimates of smoking-attributable deaths in US, UK, and Canada from 1950 to 2015.
| US | UK | Canada | ||||||||||
|---|---|---|---|---|---|---|---|---|---|---|---|---|
| Year | No of cigarettes sold nationally | Deaths from smoking at all ages | Cigs/death no lag | Cigs/death 20 year lag | No of cigarettes sold nationally | Deaths from smoking at all ages | Cigs/death no lag | Cigs/death 20 year lag | No of cigarettes sold nationally | Deaths from smoking at all ages | Cigs/death no lag | Cigs/death 20 year lag |
| 1950 | 3,60,19,90,00,000 | 82,350 | 43,74,001 | 85,14,50,00,000 | 78,000 | 10,91,603 | 17,17,20,00,000 | 4,350 | 39,47,586 | |||
| 1951 | 3,79,72,50,00,000 | 93,660 | 40,54,292 | 89,33,50,00,000 | 82,800 | 10,78,925 | 15,67,20,00,000 | 5,240 | 29,90,840 | |||
| 1952 | 3,94,10,90,00,000 | 1,04,970 | 37,54,492 | 90,40,00,00,000 | 87,600 | 10,31,963 | 17,84,40,00,000 | 6,130 | 29,10,930 | |||
| 1953 | 3,86,82,60,00,000 | 1,16,280 | 33,26,677 | 92,69,50,00,000 | 92,400 | 10,03,193 | 21,00,00,00,000 | 7,020 | 29,91,453 | |||
| 1954 | 3,68,72,50,00,000 | 1,27,590 | 28,89,921 | 95,23,00,00,000 | 97,200 | 9,79,733 | 22,11,60,00,000 | 7,910 | 27,95,954 | |||
| 1955 | 3,82,06,10,00,000 | 1,38,900 | 27,50,619 | 98,67,00,00,000 | 1,02,000 | 9,67,353 | 24,57,60,00,000 | 8,800 | 27,92,727 | |||
| 1956 | 3,93,15,40,00,000 | 1,50,210 | 26,17,362 | 99,56,00,00,000 | 1,06,800 | 9,32,210 | 27,00,00,00,000 | 9,690 | 27,86,378 | |||
| 1957 | 4,09,43,60,00,000 | 1,61,520 | 25,34,894 | 1,02,25,00,00,000 | 1,11,600 | 9,16,219 | 30,14,40,00,000 | 10,580 | 28,49,149 | |||
| 1958 | 4,36,35,40,00,000 | 1,72,830 | 25,24,758 | 1,04,02,00,00,000 | 1,16,400 | 8,93,643 | 32,40,40,00,000 | 11,470 | 28,25,109 | |||
| 1959 | 4,53,68,10,00,000 | 1,84,140 | 24,63,783 | 1,06,60,00,00,000 | 1,21,200 | 8,79,538 | 33,82,20,00,000 | 12,360 | 27,36,408 | |||
| 1960 | 4,70,13,60,00,000 | 1,95,450 | 24,05,403 | 1,10,90,00,00,000 | 1,26,000 | 8,80,159 | 34,28,90,00,000 | 13,250 | 25,87,849 | |||
| 1961 | 4,88,11,90,00,000 | 2,06,760 | 23,60,800 | 1,13,40,00,00,000 | 1,30,800 | 8,66,972 | 36,69,90,00,000 | 14,140 | 25,95,403 | |||
| 1962 | 4,94,46,30,00,000 | 2,18,070 | 22,67,451 | 1,09,90,00,00,000 | 1,35,600 | 8,10,472 | 38,68,30,00,000 | 15,030 | 25,73,719 | |||
| 1963 | 5,09,58,80,00,000 | 2,29,380 | 22,21,589 | 1,15,20,00,00,000 | 1,40,400 | 8,20,513 | 39,87,70,00,000 | 15,920 | 25,04,837 | |||
| 1964 | 4,97,44,70,00,000 | 2,40,690 | 20,66,754 | 1,14,40,00,00,000 | 1,45,200 | 7,87,879 | 40,63,90,00,000 | 16,810 | 24,17,549 | |||
| 1965 | 5,11,46,40,00,000 | 2,52,000 | 20,29,619 | 1,12,00,00,00,000 | 1,50,000 | 7,46,667 | 43,01,30,00,000 | 17,700 | 24,30,113 | |||
| 1966 | 5,22,53,30,00,000 | 2,64,800 | 19,73,312 | 1,17,60,00,00,000 | 1,53,500 | 7,66,124 | 46,27,60,00,000 | 18,950 | 24,42,005 | |||
| 1967 | 5,27,80,00,00,000 | 2,77,600 | 19,01,297 | 1,19,10,00,00,000 | 1,57,000 | 7,58,599 | 46,86,40,00,000 | 20,200 | 23,20,000 | |||
| 1968 | 5,23,00,80,00,000 | 2,90,400 | 18,00,992 | 1,21,80,00,00,000 | 1,60,500 | 7,58,879 | 46,26,90,00,000 | 21,450 | 21,57,063 | |||
| 1969 | 5,10,53,10,00,000 | 3,03,200 | 16,83,809 | 1,24,90,00,00,000 | 1,64,000 | 7,61,585 | 46,58,20,00,000 | 22,700 | 20,52,070 | |||
| 1970 | 5,32,76,90,00,000 | 3,16,000 | 16,85,978 | 1,27,90,00,00,000 | 1,67,500 | 7,63,582 | 49,82,30,00,000 | 23,950 | 20,80,292 | |||
| 1971 | 5,28,85,80,00,000 | 3,28,800 | 16,08,449 | 1,22,40,00,00,000 | 1,71,000 | 7,15,789 | 50,86,40,00,000 | 25,200 | 20,18,413 | |||
| 1972 | 5,51,01,70,00,000 | 3,41,600 | 16,13,047 | 1,30,50,00,00,000 | 1,74,500 | 7,47,851 | 53,29,10,00,000 | 26,450 | 20,14,783 | |||
| 1973 | 5,90,30,00,00,000 | 3,54,400 | 16,65,632 | 1,37,40,00,00,000 | 1,78,000 | 7,71,910 | 54,86,30,00,000 | 27,700 | 19,80,614 | |||
| 1974 | 5,99,00,00,00,000 | 3,67,200 | 16,31,264 | 1,37,00,00,00,000 | 1,81,500 | 7,54,821 | 57,12,28,01,000 | 28,950 | 19,73,154 | |||
| 1975 | 6,07,20,00,00,000 | 3,80,000 | 15,97,895 | 10,05,424 | 1,32,60,00,00,000 | 1,85,000 | 7,16,757 | 5,33,351 | 57,75,57,95,000 | 30,200 | 19,12,444 | 8,13,775 |
| 1976 | 6,13,50,00,00,000 | 3,92,400 | 15,63,456 | 10,01,922 | 1,30,60,00,00,000 | 1,84,900 | 7,06,328 | 5,38,453 | 60,74,48,85,000 | 31,380 | 19,35,783 | 8,60,421 |
| 1977 | 6,17,00,00,00,000 | 4,04,800 | 15,24,209 | 10,11,453 | 1,25,90,00,00,000 | 1,84,800 | 6,81,277 | 5,53,301 | 61,78,65,71,000 | 32,560 | 18,97,622 | 9,25,799 |
| 1978 | 6,16,00,00,00,000 | 4,17,200 | 14,76,510 | 10,45,911 | 1,25,20,00,00,000 | 1,84,700 | 6,77,856 | 5,63,184 | 61,61,00,13,000 | 33,740 | 18,26,023 | 9,60,403 |
| 1979 | 6,21,50,00,00,000 | 4,29,600 | 14,46,695 | 10,56,054 | 1,24,30,00,00,000 | 1,84,600 | 6,73,348 | 5,77,465 | 63,86,56,38,000 | 34,920 | 18,28,913 | 9,68,557 |
| 1980 | 6,31,50,00,00,000 | 4,42,000 | 14,28,733 | 10,63,656 | 1,21,50,00,00,000 | 1,84,500 | 6,58,537 | 6,01,084 | 64,34,33,00,000 | 36,100 | 17,82,363 | 9,49,834 |
| 1981 | 6,40,00,00,00,000 | 4,54,400 | 14,08,451 | 10,74,206 | 1,10,30,00,00,000 | 1,84,400 | 5,98,156 | 6,14,967 | 66,37,56,00,000 | 37,280 | 17,80,461 | 9,84,415 |
| 1982 | 6,34,00,00,00,000 | 4,66,800 | 13,58,183 | 10,59,261 | 1,02,00,00,00,000 | 1,84,300 | 5,53,445 | 5,96,310 | 66,15,74,00,000 | 38,460 | 17,20,161 | 10,05,798 |
| 1983 | 6,00,00,00,00,000 | 4,79,200 | 12,52,087 | 10,63,414 | 1,01,60,00,00,000 | 1,84,200 | 5,51,574 | 6,25,407 | 62,78,51,03,500 | 39,640 | 15,83,883 | 10,05,979 |
| 1984 | 6,00,40,00,00,000 | 4,91,600 | 12,21,318 | 10,11,894 | 99,00,00,00,000 | 1,84,100 | 5,37,751 | 6,21,401 | 62,13,39,14,500 | 40,820 | 15,22,144 | 9,95,566 |
| 1985 | 5,94,00,00,00,000 | 5,04,000 | 11,78,571 | 10,14,810 | 97,75,00,00,000 | 1,84,000 | 5,31,250 | 6,08,696 | 59,30,44,61,105 | 42,000 | 14,12,011 | 10,24,119 |
| 1986 | 5,83,80,00,00,000 | 5,14,900 | 11,33,812 | 10,14,824 | 95,00,00,00,000 | 1,82,000 | 5,21,978 | 6,46,154 | 55,76,23,21,860 | 43,100 | 12,93,789 | 10,73,689 |
| 1987 | 5,75,00,00,00,000 | 5,25,800 | 10,93,572 | 10,03,804 | 96,00,00,00,000 | 1,80,000 | 5,33,333 | 6,61,667 | 52,87,70,31,890 | 44,200 | 11,96,313 | 10,60,271 |
| 1988 | 5,62,50,00,00,000 | 5,36,700 | 10,48,072 | 9,74,489 | 97,00,00,00,000 | 1,78,000 | 5,44,944 | 6,84,270 | 51,33,89,17,800 | 45,300 | 11,33,309 | 10,21,391 |
| 1989 | 5,40,00,00,00,000 | 5,47,600 | 9,86,121 | 9,32,306 | 98,00,00,00,000 | 1,76,000 | 5,56,818 | 7,09,659 | 47,76,46,41,600 | 46,400 | 10,29,410 | 10,03,922 |
| 1990 | 5,25,00,00,00,000 | 5,58,500 | 9,40,018 | 9,53,928 | 1,02,50,00,00,000 | 1,74,000 | 5,89,080 | 7,35,057 | 46,44,08,01,080 | 47,500 | 9,77,701 | 10,48,905 |
| 1991 | 5,10,00,00,00,000 | 5,69,400 | 8,95,680 | 9,28,799 | 97,90,00,00,000 | 1,72,000 | 5,69,186 | 7,11,628 | 39,13,45,12,000 | 48,600 | 8,05,237 | 10,46,584 |
| 1992 | 5,00,00,00,00,000 | 5,80,300 | 8,61,623 | 9,49,538 | 92,80,00,00,000 | 1,70,000 | 5,45,882 | 7,67,647 | 35,20,01,50,365 | 49,700 | 7,08,253 | 10,72,254 |
| 1993 | 4,85,00,00,00,000 | 5,91,200 | 8,20,365 | 9,98,478 | 88,90,00,00,000 | 1,68,000 | 5,29,167 | 8,17,857 | 30,34,98,69,580 | 50,800 | 5,97,438 | 10,79,980 |
| 1994 | 4,86,00,00,00,000 | 6,02,100 | 8,07,175 | 9,94,851 | 88,30,00,00,000 | 1,66,000 | 5,31,928 | 8,25,301 | 45,93,47,44,885 | 51,900 | 8,85,063 | 11,00,632 |
| 1995 | 4,87,00,00,00,000 | 6,13,000 | 7,94,454 | 9,90,538 | 88,00,00,00,000 | 1,64,000 | 5,36,585 | 8,08,537 | 45,70,99,99,540 | 53,000 | 8,62,453 | 10,89,732 |
| 1996 | 4,87,00,00,00,000 | 6,12,400 | 7,95,232 | 10,01,796 | 87,20,00,00,000 | 1,60,700 | 5,42,626 | 8,12,694 | 47,33,83,59,350 | 53,200 | 8,89,819 | 11,41,821 |
| 1997 | 4,80,00,00,00,000 | 6,11,800 | 7,84,570 | 10,08,500 | 84,00,00,00,000 | 1,57,400 | 5,33,672 | 7,99,873 | 45,64,03,20,710 | 53,400 | 8,54,688 | 11,57,052 |
| 1998 | 4,65,00,00,00,000 | 6,11,200 | 7,60,798 | 10,07,853 | 84,00,00,00,000 | 1,54,100 | 5,45,101 | 8,12,459 | 45,55,66,36,420 | 53,600 | 8,49,937 | 11,49,441 |
| 1999 | 4,35,00,00,00,000 | 6,10,600 | 7,12,414 | 10,17,851 | 84,00,00,00,000 | 1,50,800 | 5,57,029 | 8,24,271 | 44,87,29,65,600 | 53,800 | 8,34,070 | 11,87,094 |
| 2000 | 4,30,00,00,00,000 | 6,10,000 | 7,04,918 | 10,35,246 | 81,50,00,00,000 | 1,47,500 | 5,52,542 | 8,23,729 | 43,36,81,94,700 | 54,000 | 8,03,115 | 11,91,543 |
| 2001 | 4,25,00,00,00,000 | 6,09,400 | 6,97,407 | 10,50,213 | 79,00,00,00,000 | 1,44,200 | 5,47,850 | 7,64,910 | 42,08,73,29,210 | 54,200 | 7,76,519 | 12,24,642 |
| 2002 | 4,15,00,00,00,000 | 6,08,800 | 6,81,669 | 10,41,393 | 76,00,00,00,000 | 1,40,900 | 5,39,390 | 7,23,918 | 37,62,74,91,460 | 54,400 | 6,91,682 | 12,16,129 |
| 2003 | 4,00,00,00,00,000 | 6,08,200 | 6,57,678 | 9,86,518 | 74,00,00,00,000 | 1,37,600 | 5,37,791 | 7,38,372 | 35,81,79,32,599 | 54,600 | 6,56,006 | 11,49,910 |
| 2004 | 3,88,00,00,00,000 | 6,07,600 | 6,38,578 | 9,88,150 | 72,00,00,00,000 | 1,34,300 | 5,36,113 | 7,37,156 | 34,57,89,18,606 | 54,800 | 6,31,002 | 11,33,831 |
| 2005 | 3,76,00,00,00,000 | 6,07,000 | 6,19,440 | 9,78,583 | 70,00,00,00,000 | 1,31,000 | 5,34,351 | 7,46,183 | 32,97,06,21,643 | 55,000 | 5,99,466 | 10,78,263 |
| 2006 | 3,80,72,63,50,521 | 6,01,800 | 6,32,646 | 9,70,090 | 67,50,00,00,000 | 1,41,700 | 4,76,359 | 6,70,430 | 30,21,71,91,194 | 55,300 | 5,46,423 | 10,08,360 |
| 2007 | 3,61,66,52,82,882 | 5,96,600 | 6,06,211 | 9,63,795 | 64,50,00,00,000 | 1,39,400 | 4,62,697 | 6,88,666 | 28,70,47,13,382 | 55,400 | 5,18,136 | 9,54,459 |
| 2008 | 3,46,41,92,70,754 | 5,91,400 | 5,85,761 | 9,51,133 | 61,50,00,00,000 | 1,37,100 | 4,48,578 | 7,07,513 | 27,55,93,82,153 | 55,500 | 4,96,565 | 9,25,026 |
| 2009 | 3,18,02,91,35,770 | 5,86,200 | 5,42,527 | 9,21,187 | 58,50,00,00,000 | 1,34,800 | 4,33,976 | 7,27,003 | 28,62,75,07,225 | 55,600 | 5,14,883 | 8,59,076 |
| 2010 | 3,00,48,93,90,443 | 5,81,000 | 5,17,193 | 9,03,614 | 52,50,00,00,000 | 1,32,500 | 3,96,226 | 7,73,585 | 31,65,36,15,884 | 55,700 | 5,68,288 | 8,33,767 |
| 2011 | 2,92,76,91,35,560 | 5,75,800 | 5,08,456 | 8,85,724 | 50,30,00,00,000 | 1,30,200 | 3,86,329 | 7,51,920 | 31,17,80,12,116 | 55,800 | 5,58,746 | 7,01,335 |
| 2012 | 2,87,48,65,11,382 | 5,70,600 | 5,03,832 | 8,76,271 | 46,00,00,00,000 | 1,27,900 | 3,59,656 | 7,25,567 | 31,34,74,37,105 | 55,900 | 5,60,777 | 6,29,699 |
| 2013 | 2,73,78,73,72,153 | 5,65,400 | 4,84,237 | 8,57,800 | 41,60,00,00,000 | 1,25,600 | 3,31,210 | 7,07,803 | 31,46,78,96,967 | 56,000 | 5,61,927 | 5,41,962 |
| 2014 | 2,62,68,12,73,103 | 5,60,200 | 4,68,906 | 8,67,547 | 39,70,00,00,000 | 1,23,300 | 3,21,979 | 7,16,139 | 29,47,82,34,315 | 56,000 | 5,26,397 | 8,20,263 |
| 2015 | 2,62,68,12,73,103 | 5,55,000 | 4,73,300 | 8,77,477 | 39,70,00,00,000 | 1,21,000 | 3,28,099 | 7,27,273 | 29,47,82,34,315 | 56,000 | 5,26,397 | 8,16,250 |
| US | UK | CANADA | ||||||||||
| TOTALS since 1950 | 3,12,38,43,79,95,671 | 2,79,01,300 | 63,06,95,50,00,000 | 98,63,000 | 27,73,85,14,67,659 | 23,67,750 | ||||||
| Average cigarettes per death with no lag | 12,95,403 | 6,23,238 | 14,72,021 | |||||||||
| Average cigarettes per death with 20 year lag | 9,83,910 | 7,01,972 | 9,95,413 | |||||||||
-
Note. Author’s calculations. Tobacco sales to deaths are shown in the column entitled ‘Deaths from smoking at all ages’. For particular years, some data were missing. In this case, I interpolated these data or did forward projections based on earlier years. These more uncertain numbers are shown in italics.
Download links
A two-part list of links to download the article, or parts of the article, in various formats.
Downloads (link to download the article as PDF)
Open citations (links to open the citations from this article in various online reference manager services)
Cite this article (links to download the citations from this article in formats compatible with various reference manager tools)
The hazards of smoking and the benefits of cessation: a critical summation of the epidemiological evidence in high-income countries
eLife 9:e49979.
https://doi.org/10.7554/eLife.49979


