An open cortico-basal ganglia loop allows limbic control over motor output via the nigrothalamic pathway
- Salk Institute for Biological Studies, United States
- Okinawa Institute of Science and Technology, Japan
- Erasmus Medical Center Rotterdam, Netherlands
- Japan Society for the Promotion of Sciences, Japan
- Centre National de la Recherche Scientifique (CNRS), Aix-Marseille Université, France
Figures
Figure 1 with 3 supplements
Trans-synaptic wild-type rabies tracing reveals both closed and open cortico-basal ganglia loops.
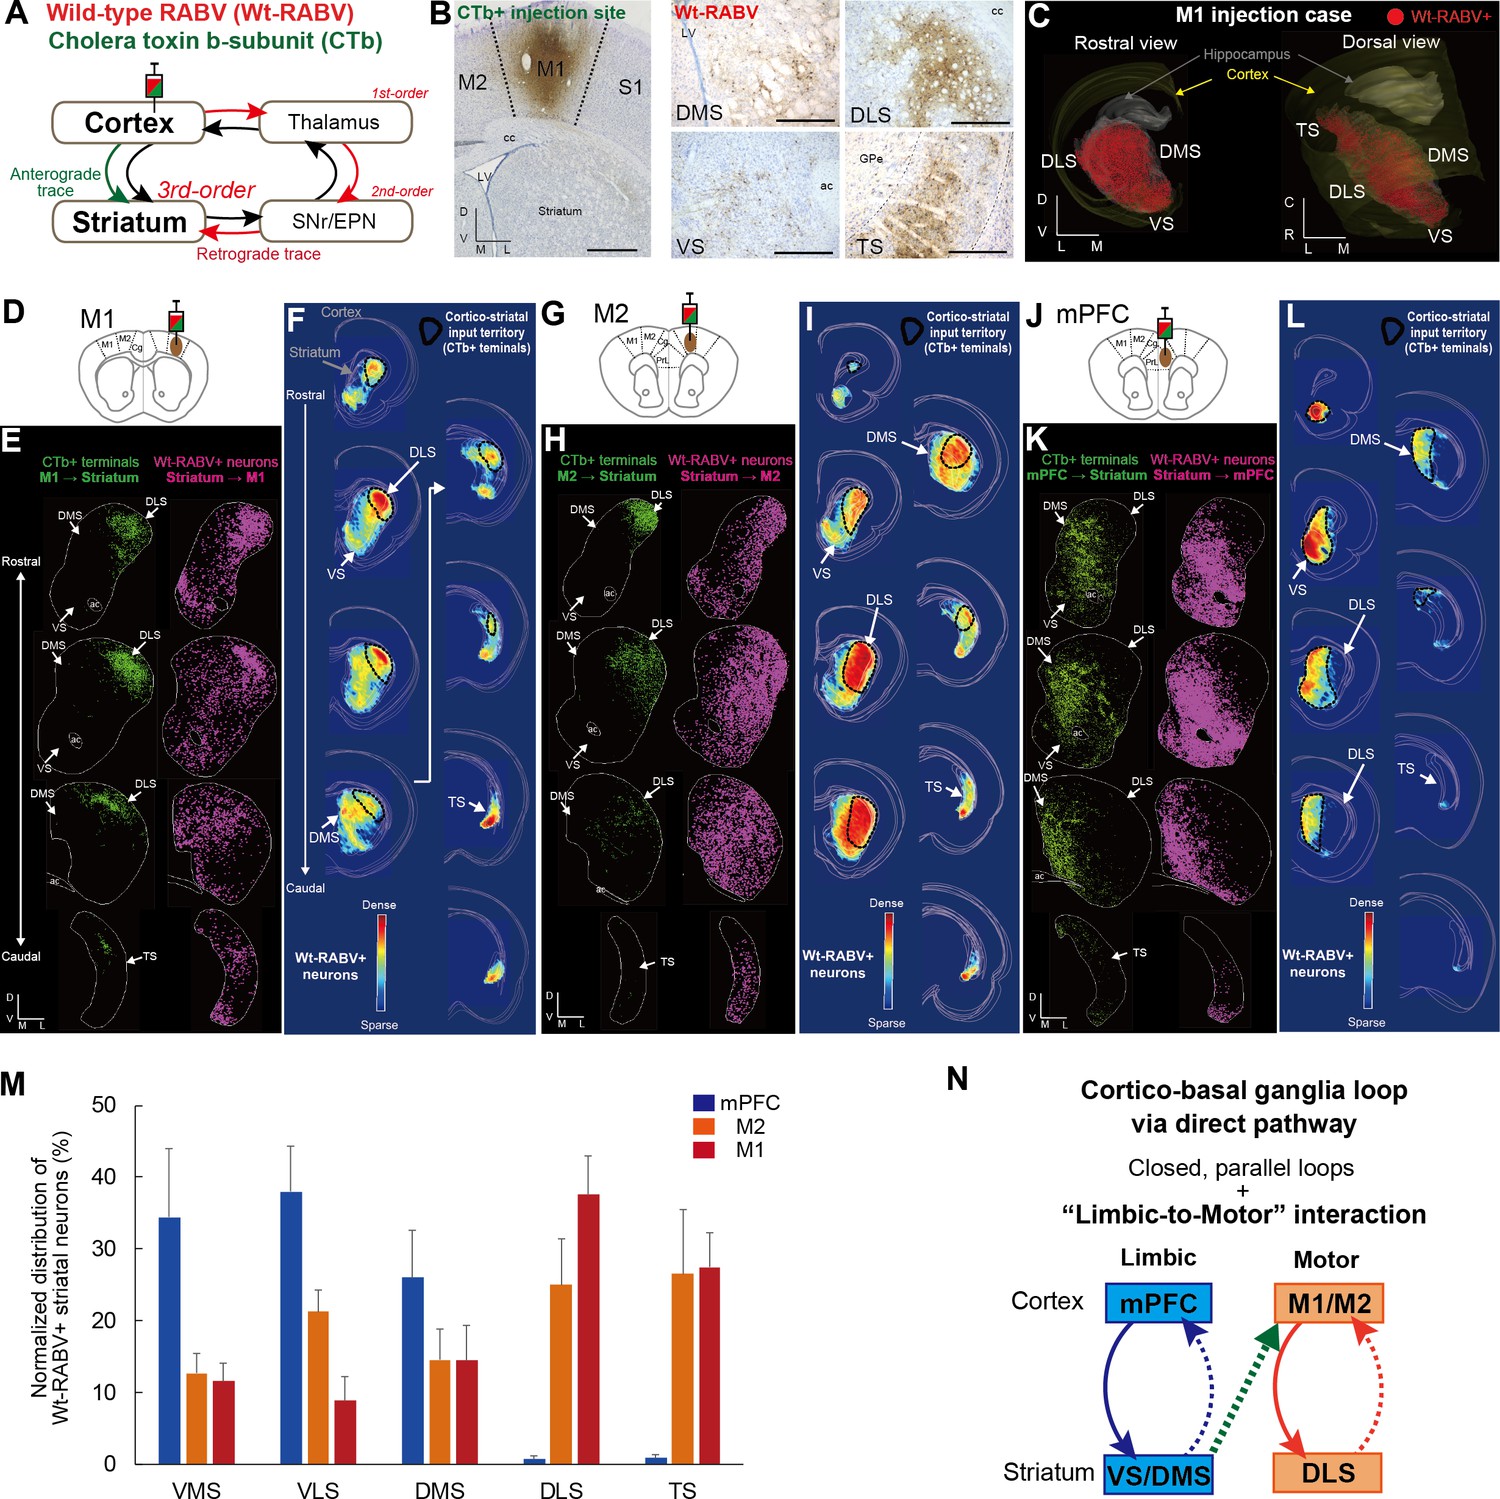
(A) The strategy to label striatal neurons connecting to the cerebral cortex by Wt-RABV trans-synaptic retrograde tracing, and CTb-based non-trans-synaptic anterograde tracing for mapping cortico-striatal terminals. (B) Example image of Wt-RABV/CTb injection into M1 (left). After 66–70 hr of survival time, Wt-RABV was transfected up to 3rd-order neurons, which were found in various striatal subregions (right). Scale bars, 1 mm (left), 500 µm (right). (C) 3D-reconstruction of Wt-RABV+ striatal neurons from the M1 injection case shown in (B). The two different angles emphasize the presence of Wt-RABV+ neurons throughout all of the striatum (VS, DMS, DLS, and TS). (D) Schema of Wt-RABV/CTb injection in M1. (E) Anterogradely labeled CTb+ cortico-striatal terminals (green) and retrogradely labeled Wt-RABV+ striatal neurons (purple) from the M1 injection case shown in (B). (F) Density map showing the distribution of Wt-RABV+ neurons throughout the striatum from M1 injection. Black contours indicate approximate areas receiving cortico-striatal inputs from M1. Color maps indicate the intensity of Wt-RABV+ labeling. (G–I) The same analyses for Wt-RABV/CTb injection in M2. (J–L) The same analyses for Wt-RABV/CTb injection in mPFC. (M) Normalized distribution of Wt-RABV+ neurons across five striatal regions (VMS, VLS, DMS, DLS, TS) showing differences depending on cortical injection sites (mPFC, n = 3; M2, n = 4; M1, n = 4). Data are expressed as mean ± SEM. Two-way ANOVA, Interaction (Injection site x Labeled striatal regions): F(8,40) = 8.208, p<0.0001. (N) Summary diagram indicates the closed limbic and motor loops, as well as the unidirectional limbic-to-motor interaction. Monosynaptic and multi-synaptic pathways are shown as solid and dashed lines, respectively. Abbreviations: cc, corpus callosum; ac, anterior commissure; LV, lateral ventricle.
Figure 1—figure supplement 1
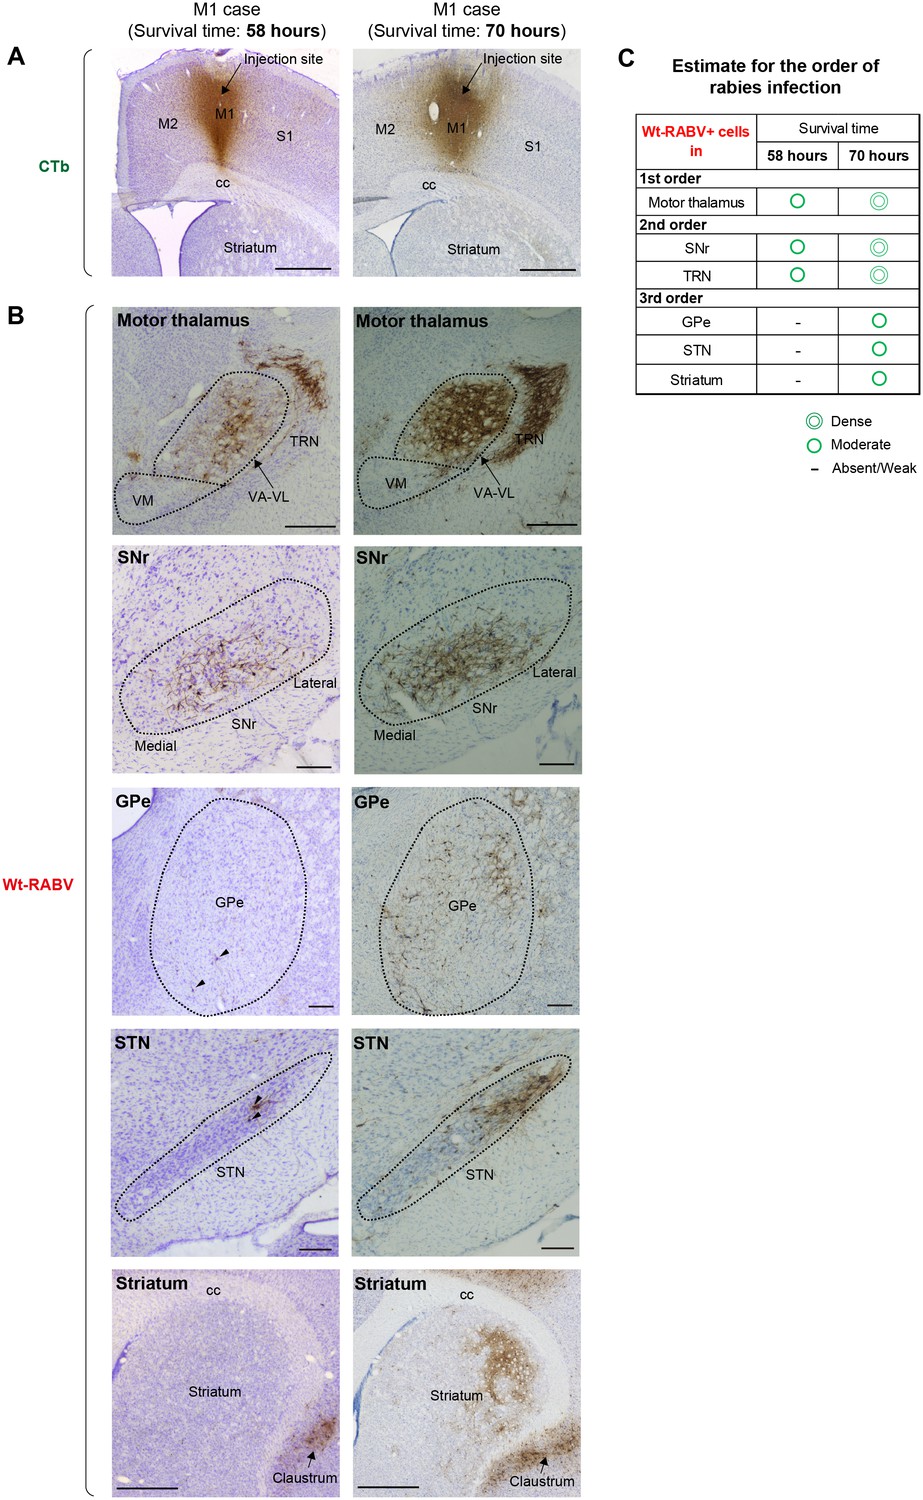
Comparison of Wt-RABV labeling patterns between cases with shorter (58 hr) and longer (70 hr) survival time.
(A) Images of CTb-labeled sections show comparable injection sites in M1 between two cases using shorter (58 hr) and longer (70 hr) survival times. Scale bars: 1 mm. (B) Images of Wt-RABV labeling in the motor thalamus (VA-VL), thalamic reticular nucleus (TRN), SNr, GPe, STN and striatum. Left: shorter survival time (58 hr). Right: longer survival time (70 hr). Scale bars: 500 µm (motor thalamus); 200 µm (SNr, GPe, STN); 1 mm (striatum). (C) Chart summarizing the estimated amount of Wt-RABV transfection, based on the labeling patterns in these nuclei.
Figure 1—figure supplement 2
Detailed procedure for the anatomical analysis of Wt-RABV/CTb tracing.
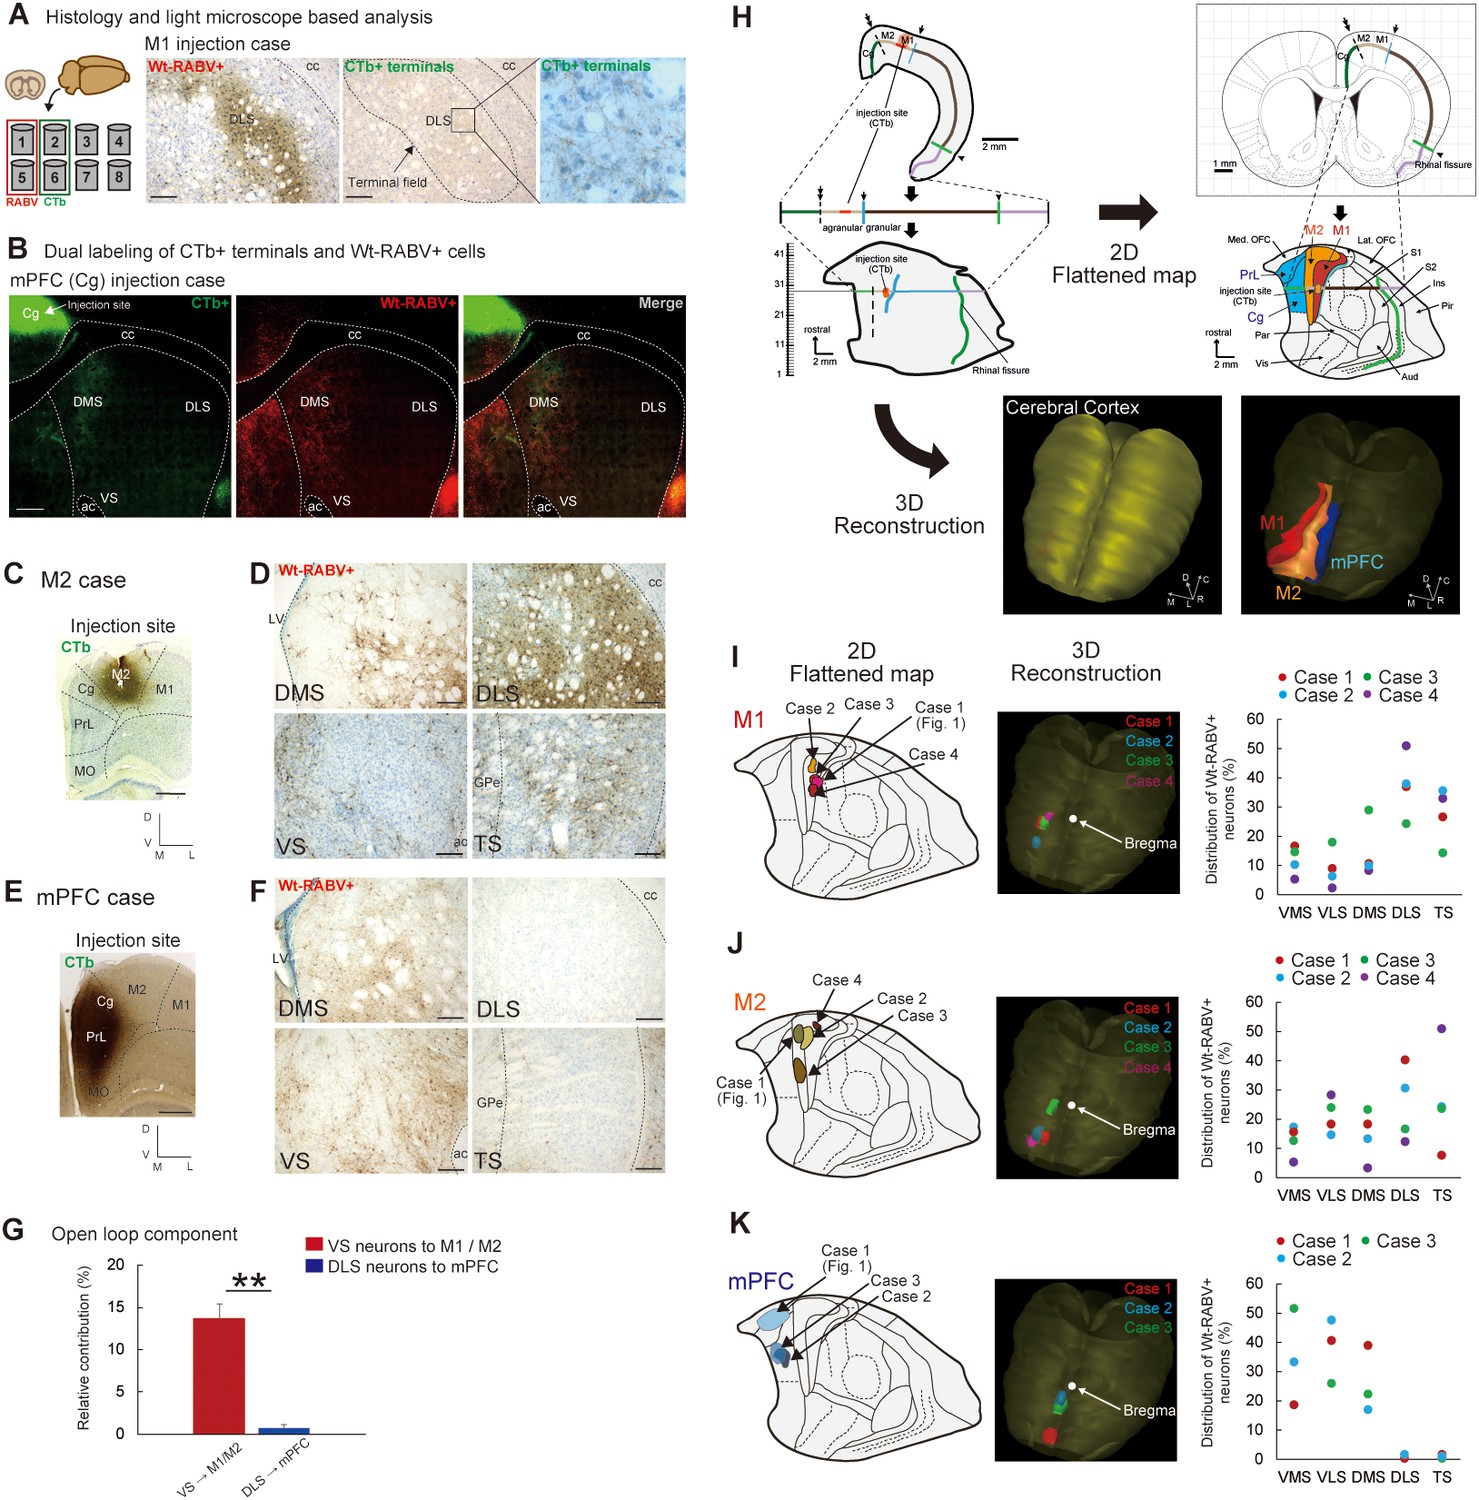
(A) Procedure for analyzing CTb+ cortico-striatal terminals and Wt-RABV+ cells using a light-microscope-based method after DAB visualization. Briefly, brain sections were collected into eight vials. The 1st and 5th vials were used for RABV staining and the 2nd and 6th for CTb, which enabled us to analyze adjacent sections for direct comparison. Scale bars, 200 µm. (B) A representative fluorescent image showing dual labeling of CTb (green) and Wt-RABV (red), demonstrating their co-localization in DMS and VS after the Wt-RABV/CTb injection into mPFC (cingulate cortex, Cg). Such co-localization indicates a closed loop. Note that CTb is suitable for indicating the injection site (left), whereas the Wt-RABV labeling involves trans-synaptic, retrograde transport of the virus and is thus not sufficient for identifying an injection site. Scale bars, 500 µm. (C, D) A mixture of Wt-RABV and CTb injected in M2. The injection site is visualized by CTb staining (C). Wt-RABV+ cells labeled throughout the striatum, including VS, DMS, DLS, and TS. Scale bars: 1 mm (C) and 200 µm (D). (E, F) Similar to (C, D), a mixture of Wt-RABV and CTb was injected in mPFC. An injection site is visualized by CTb (E). In this case, Wt-RABV+ neurons were exclusively found in VS and DMS, but not in the DLS and TS. Scale bars: 1 mm (E) and 200 µm (F). (G) There is a significantly higher contribution of VS neurons connecting to M1/M2 (n = 8) than of DLS neurons targeting mPFC (n = 3). Data are expressed as mean ± SEM. Unpaired t-test, t9 = 4.229, p=0.0022. (H) Detailed analyses of the injection sites of Wt-RABV/CTb in the cortex, as described in detail (Aoki et al., 2019). In short, cortical contours with CTb labeling are projected onto the cortical flattened map and reconstructed into a three-dimensional brain. A bottom panel shows reconstructed M1, M2 and mPFC (cingulate and prelimbic areas) in the brain. (I–K) Indication of the injection sites in 2D flattened maps and 3D reconstructed brains. The corresponding distributions of the Wt-RABV+ cells in each case are plotted to compare them in relation to the injection sites in M1 (I), M2 (J) and mPFC (K). Note that the presence of Wt-RABV+ cells in VMS and VLS after M1 or M2 injections and the absence of DLS labeling after mPFC injections are seen consistently.
Figure 1—figure supplement 3

Comparisons of the topography of cortico-striatal inputs and striatal outputs to the cortex.
(A) Normalized distribution of the cortico-striatal terminals (inputs from mPFC or M1) across VMS, VLS, DMS, DLS, and TS (N = 2 in each). (B) Normalized distribution of the striatal output neurons to the mPFC and M1 from VMS, VLS, DMS, DLS, and TS (adapted from Figure 1M, N = 3 for mPFC, N = 4 for M1). (C) Comparison of mPFC inputs to striatum and striatal outputs to the mPFC, adapted from (A) and (B). Two-way ANOVA shows a significant effect of interaction (Input-output x Labeled striatal regions): F(4,15) = 8.022, p=0.0011. (D) Comparison of M1 inputs to striatum and striatal outputs to the M1, adapted from (A) and (B). Two-way ANOVA shows a significant effect of interaction (Input-output x Labeled striatal regions): F(4,20) = 16.5, p<0.0001. Data are expressed as mean ± SEM.
Figure 2 with 2 supplements
Subcircuit-specific modified rabies tracing confirms limbic-to-motor connectivity through the direct pathway.
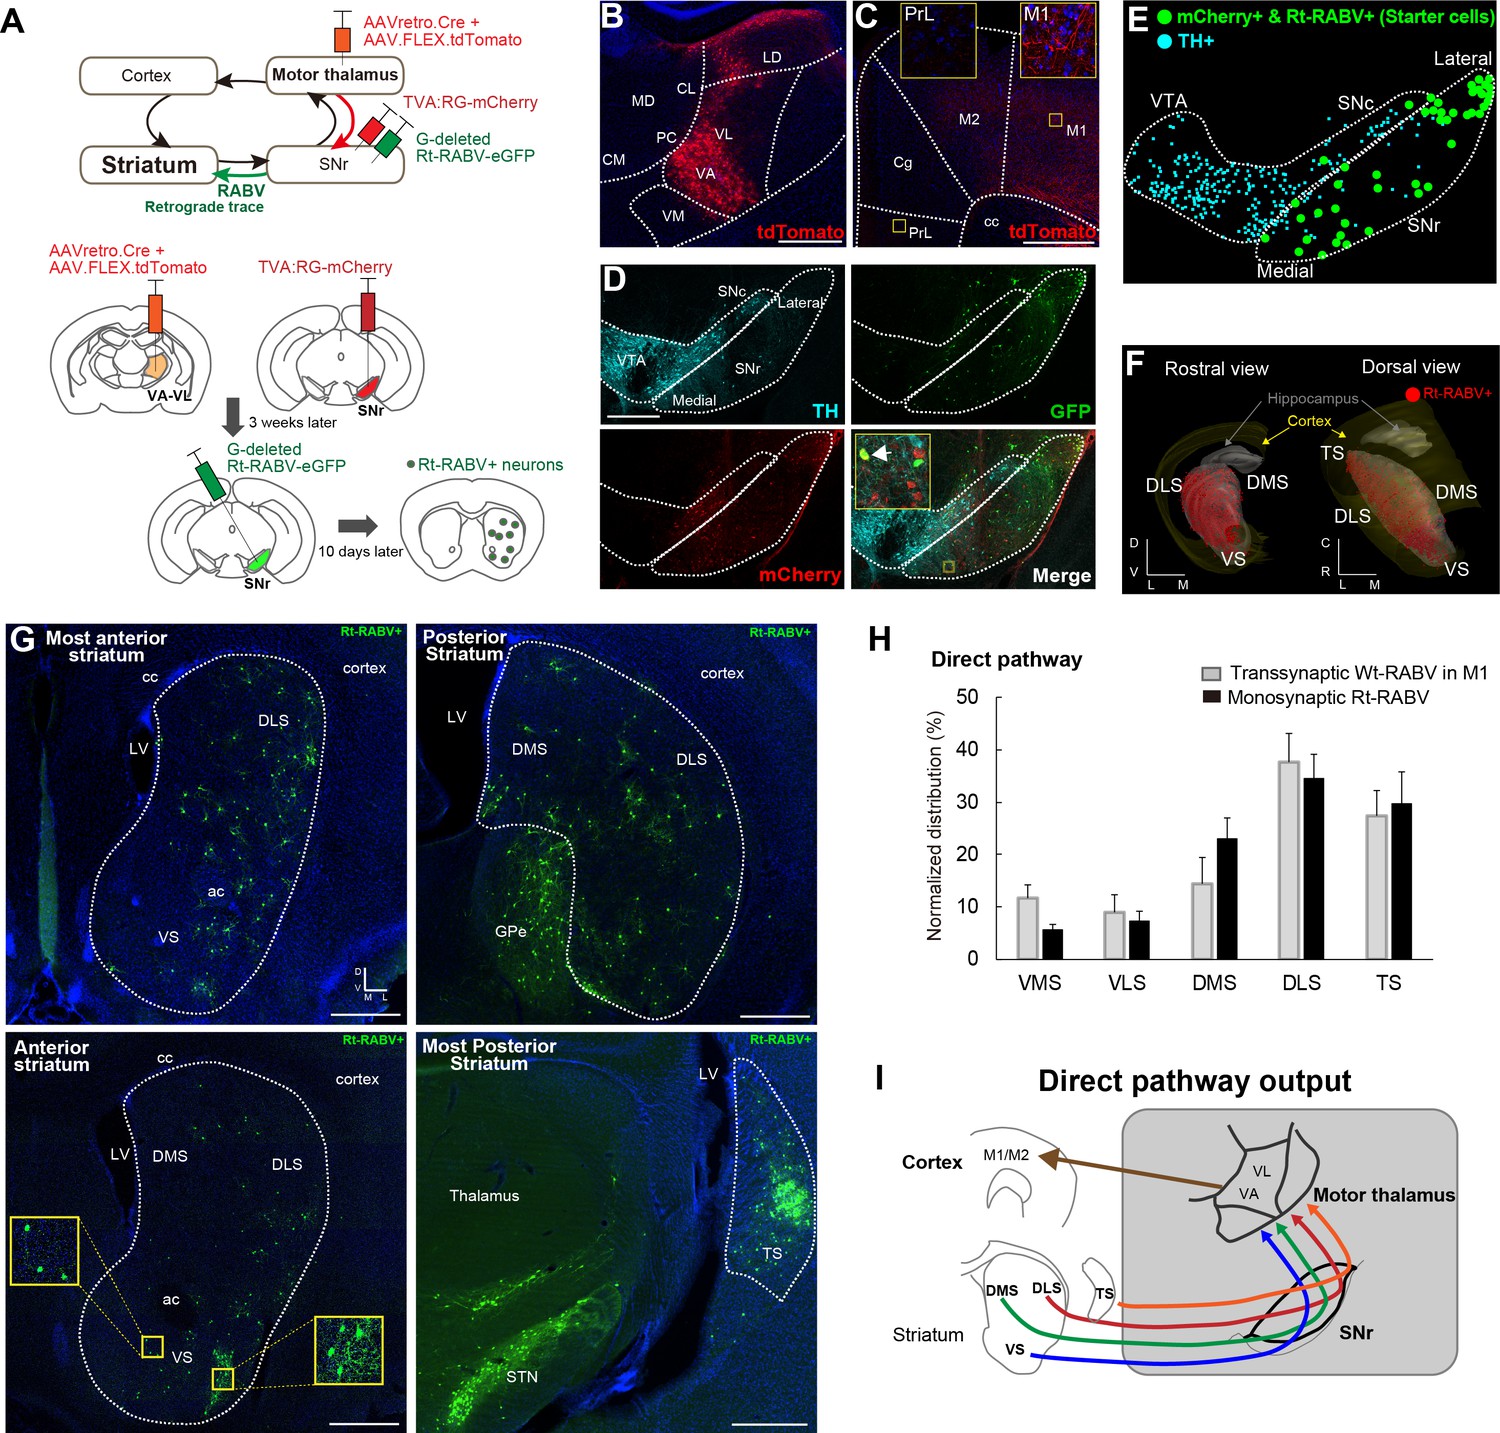
(A) Strategy to identify striatal neurons projecting to the specific SNr subpopulation that projects to VA-VL motor thalamus. (B, C) Images of the injection site in VA-VL thalamus (B) and their thalamo-cortical terminals in M1, but not in mPFC (C). Note that there are tdTomato+ cells in LD, but this part of thalamus does not receive SNr inputs (Figure 4). Scale bar, 500 µm. (D) Image of TVA-mcherry+ and Rt-RABV(GFP)+ cells in SNr. Immunohistochemistry for tyrosine hydroxylase (TH) revealed almost no co-localization of TH+ cells with mCherry+ SNr neurons projecting to VA-VL (<4%, see Figure 2—figure supplement 1). An arrow in the inset indicates a representative example of a starter cell with mCherry+ and Rt-RABV-GFP+. Scale bar, 200 µm. (E) Digital reconstruction of starter cells that are defined as mCherry+ and Rt-RABV-GFP+ neurons (green), relative to TH+ dopamine neurons (blue). (F) 3D-reconstruction of Rt-RABV+ striatal neurons. (G) Rt-RABV+ neurons at different anterior-posterior levels of striatum, which are found in VS, DMS, DLS and TS. Note that densely labeled GFP+ cells in TS are not starter cells as there are no TVA.mCherry+ cells. Scale bar, 500 µm. (H) Normalized distribution of Rt-RABV+ striatal cells (n = 6), compared to Wt-RABV tracing from M1 (n = 4) across five striatal regions. Data are expressed as mean ± SEM. Two-way ANOVA showing no significant effect of interaction (Injection site x Labeled striatal regions): F(4,40) = 0.8722, p=0.4891. (I) Summary diagram showing that through the direct pathway, VS, DMS, DLS and TS connect to motor thalamus, which in turn projects to motor cortex. Abbreviations: MD, mediodorsal; CM, centromedial; PC, paracentral; CL, centrolateral: LD, lateral dorsal thalamus; PrL, prelimbic cortex; Cg, cingulate cortex.
Figure 2—figure supplement 1

Detailed analysis for the starter cell population in recombinant rabies tracing of nigro-motor thalamic cells.
(A, B) Another example of the starter cells (mCherry+/GFP+) in SNr when rabies-tracing from nigro-motor thalamic cells (Figure 2A), which comes from a different mouse. Scale bar: 200 um. (C) Quantification of the percentage of TH+ cells over all the mCherry+ nigro-thalamic cells. (D) Quantification of the percentage of TH+ cells over all the starter cells (mCherry+/GFP+). (E) Quantification of the percentage of mCherry+ nigro-thalamic cells over all the TH+ SNr cells. (F–H) A control experiment without an injection of rabies glycoprotein provides another way to show the distribution of starter cells (F). A representative image for the GFP+ starter cells in SNr (left) and its digital reconstruction (right) (G). There is no evidence for the presence of starter cells in the other basal ganglia nuclei or for direct rabies infection (H). Scale bar: 500 µm. Data are expressed as mean ± SEM.
Figure 2—figure supplement 2
The absence of polysynaptic connections from ventral pallidum to motor thalamus and to motor cortex.
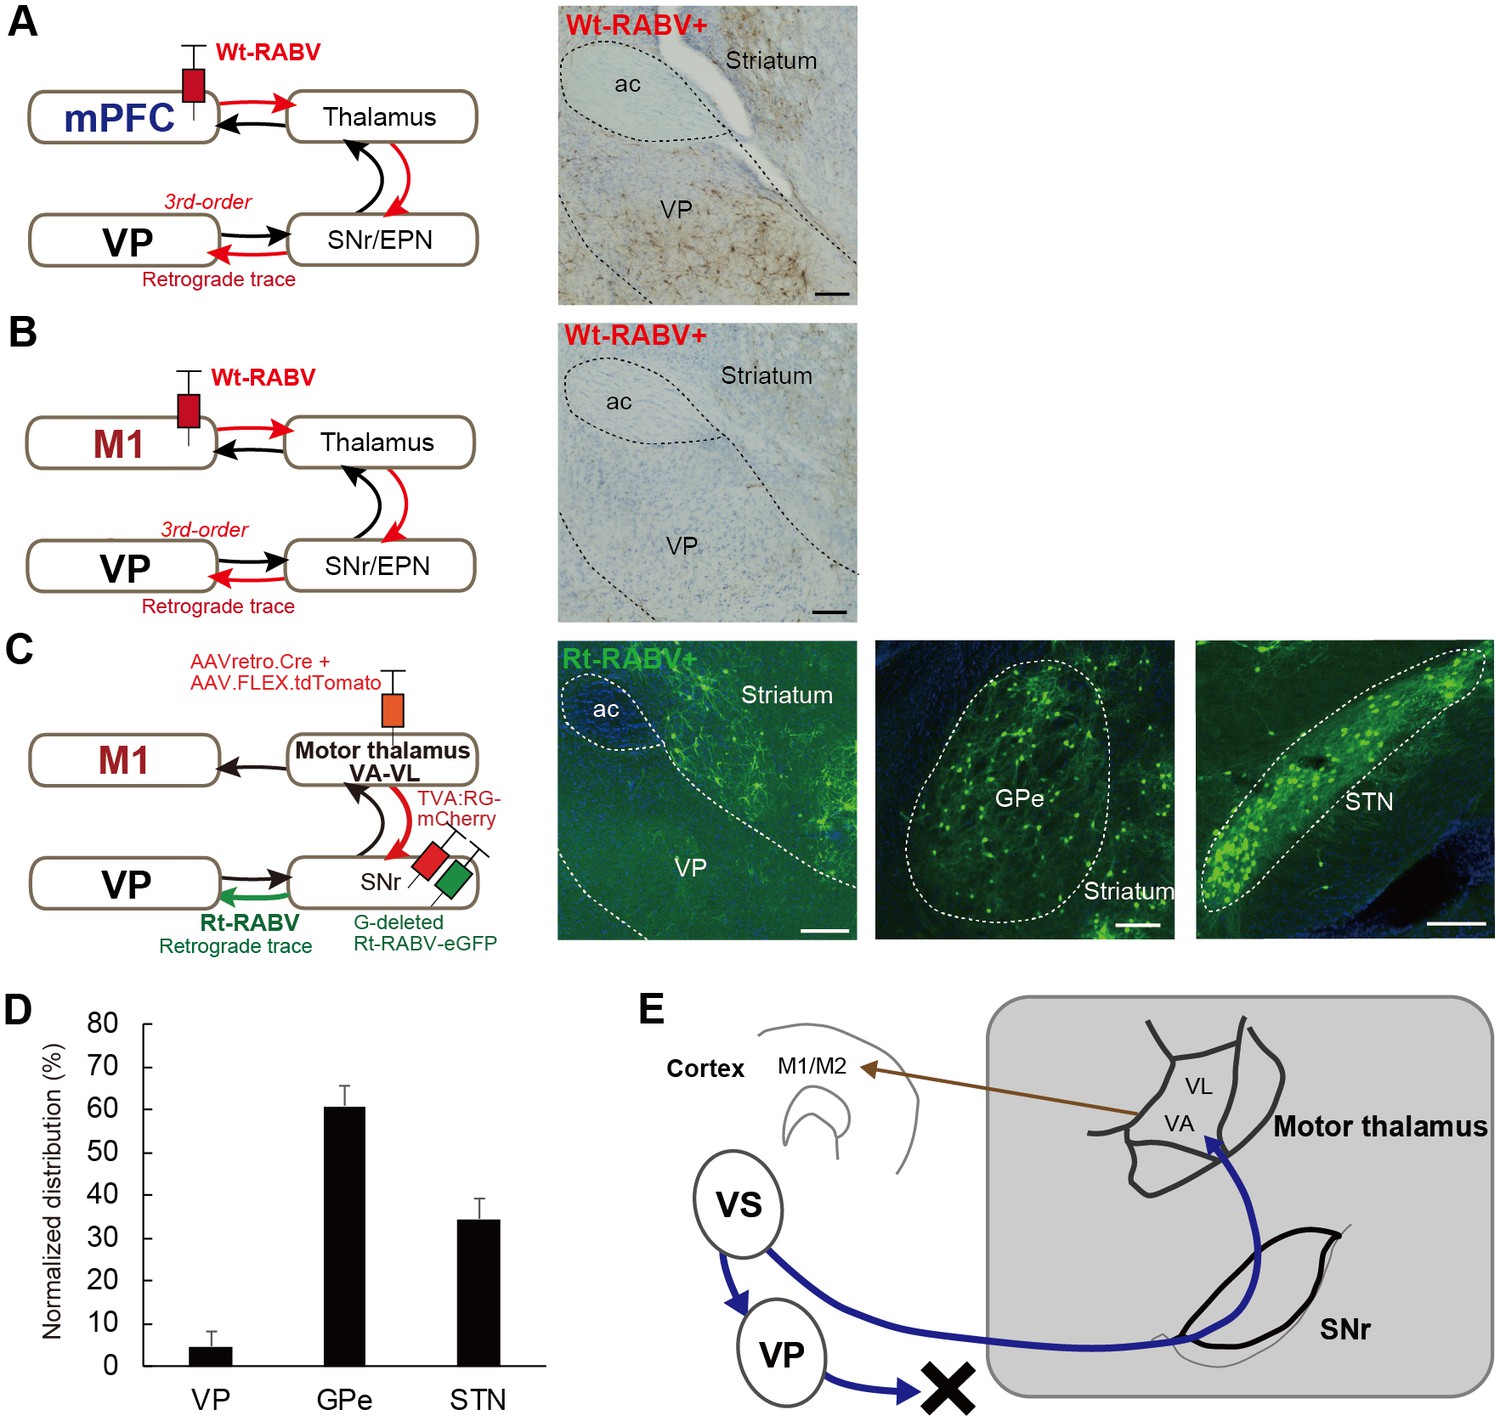
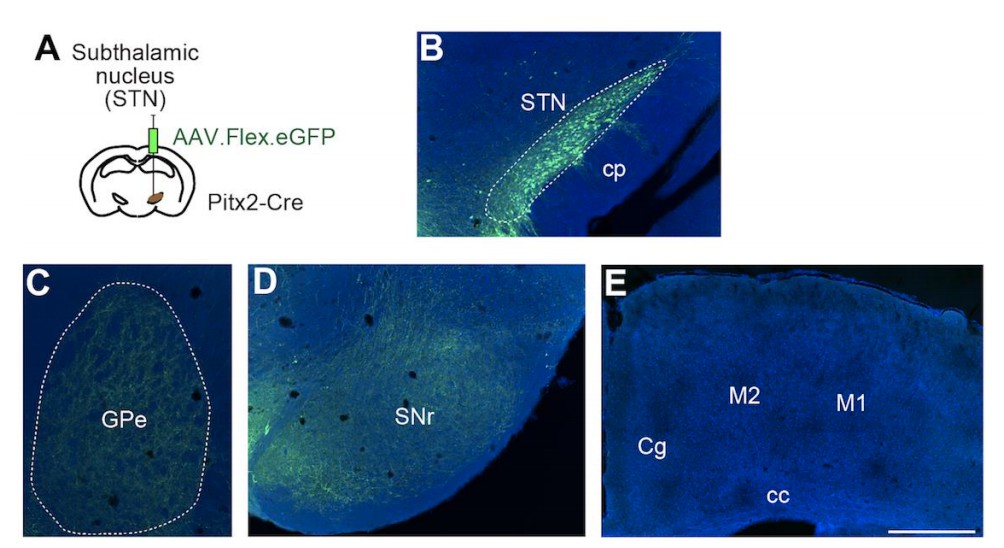
(A–C) Analyses of labeling in ventral pallidum (VP) from Wt-RABV and Rt-RABV tracing, including Wt-RABV injections in mPFC (A) and M1 (B), as well as Rt-RABV tracing from SNr neurons projecting to VA-VL (C). Notably, there is an absence of VP neurons labeled after the Wt-RABV injection in M1 or Rt-RABV tracing from VA-VL-projecting SNr neurons (B, C). For Rt-RABV tracing, representative images of GPe and STN are also provided. Scale bars, 200 µm. (D) Normalized distribution of Rt-RABV+ cells in VP, GPe and STN (n = 6). (E) Summary diagram showing VS connection to motor thalamus via SNr, but not VP (Figure 1 and Figure 2).
Figure 3 with 1 supplement
Subcircuit-specific modified rabies tracing reveals the convergence of synaptic inputs from medial and lateral SNr onto thalamo-cortical neurons targeting M1.
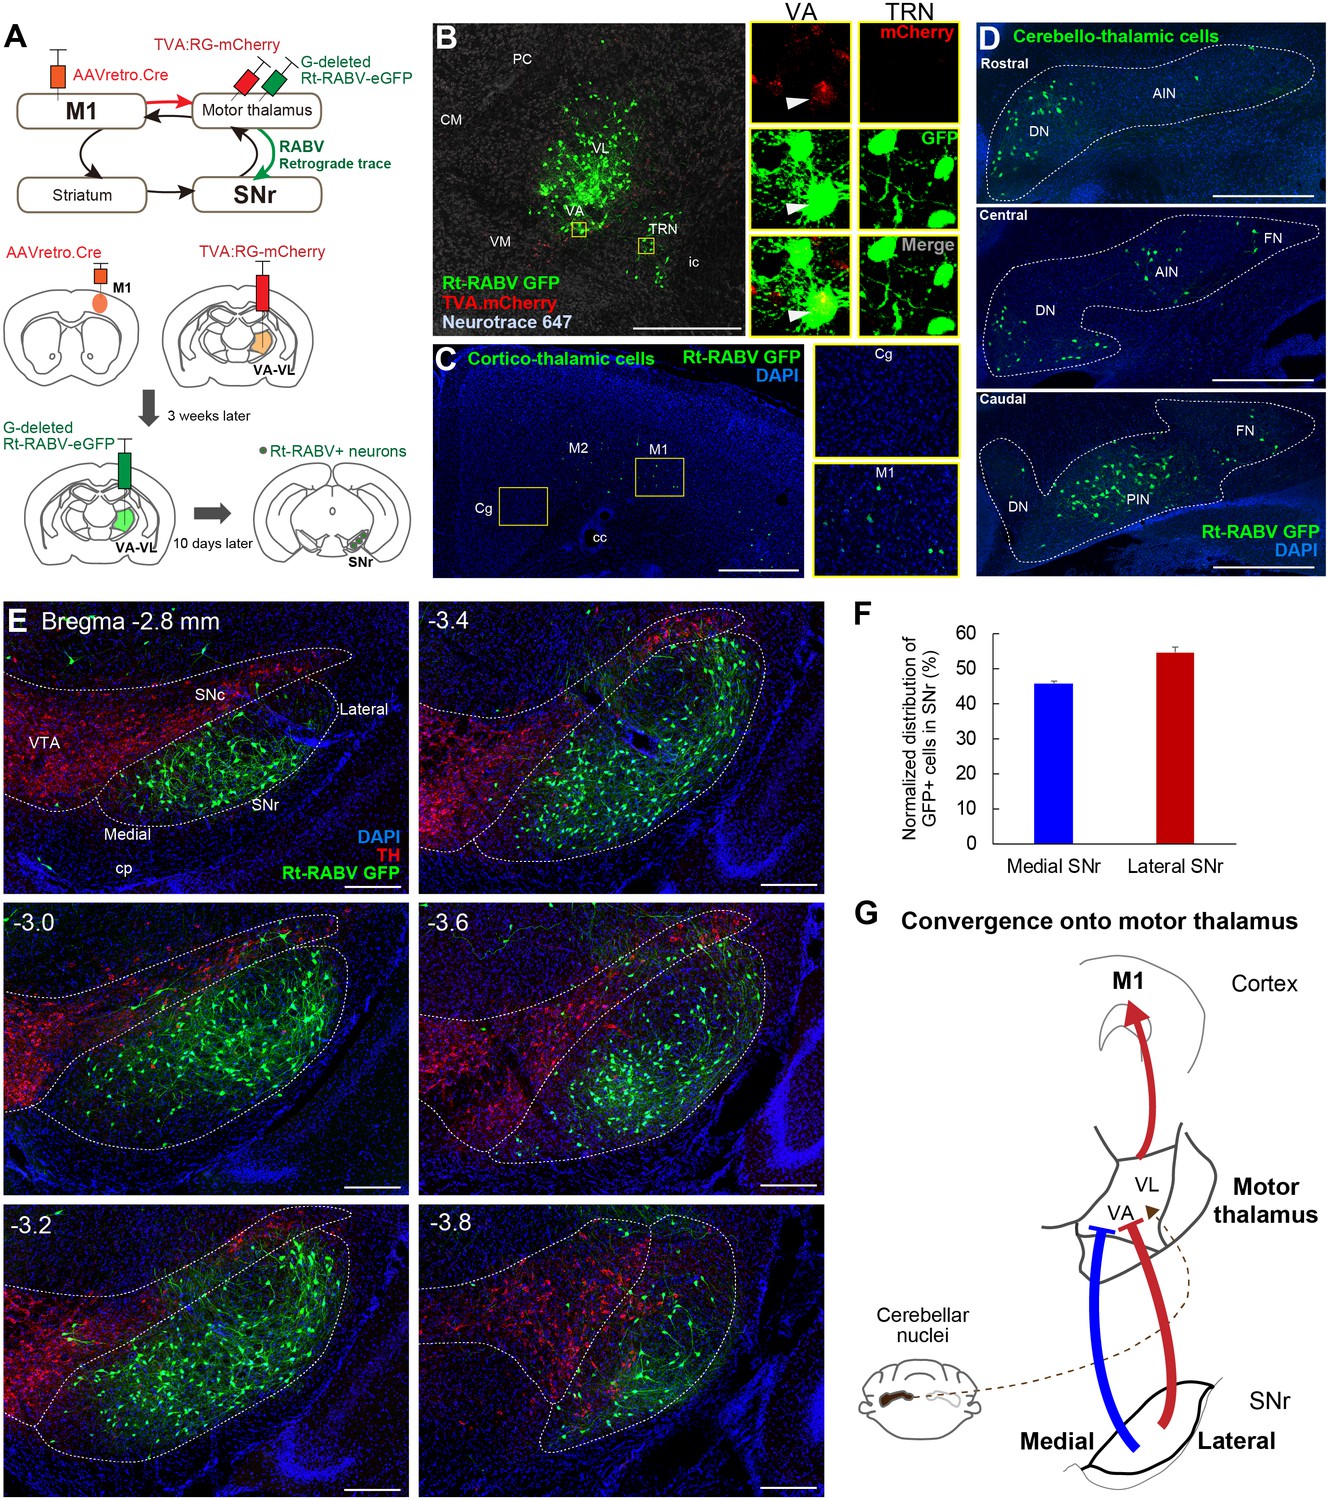
(A) Strategy for identifying SNr neurons that synapse onto thalamo-cortical cells projecting to M1. (B) Images of the starter cell population (mCherry+/GFP+) in VA-VL motor thalamus and trans-synaptically labeled GFP+ cells in TRN (mCherry-). White arrowheads in images for VA indicate a representative starter cell. Scale bar, 500 µm. (C) Images of Rt-RABV-GFP+ cortico-thalamic cells specifically located in ipsilateral motor cortex, but not in cingulate cortex (Cg). Scale bar, 500 µm. (D) Images of Rt-RABV-GFP+ cerebello-thalamic cells mainly located in the contralateral dentate and interpositus nuclei. Scale bar, 500 µm. (E) Images of Rt-RABV-GFP+ nigro-thalamic cells relative to TH+ dopamine cells. Note that both medial and lateral SNr neurons synapse onto motor thalamus. Scale bar, 200 µm. (F) Quantification of the distribution of Rt-RABV-GFP+ cells in medial and lateral SNr (N = 5). Data are expressed as mean ± SEM. (G) Summary diagram showing the convergence of synaptic inputs from medial and lateral SNr to motor thalamus. Cerebellar convergence is also shown as a dashed line. Abbreviations: CM, centromedial; PC, paracentral; CL, centrolateral; VM, ventromedial thalamus; TRN, thalamic reticular nucleus; Cg, cingulate cortex; DN, cerebellar dentate nucleus; AIN, anterior interpositus nucleus; FN, fastigial nucleus; PIN, posterior interpositus nucleus.
Figure 3—figure supplement 1

Detailed analysis of the distribution of Rt-RABV-GFP cells in SNr after motor thalamus injection.
(A) Upper panel shows division of SNr into medial and lateral portions. The lower panel shows the individual data points from motor thalamus tracing in Figure 3F. Note that a mouse (represented as an orange line in panel (B)) shows an almost identical plot to another mouse (gray), so it is not visible in this panel. (B) Similar to (A), SNr is sub-divided into four different parts and the quantification is based on these four divisions for Rt-RABV-GFP+ cells from motor thalamus.
Figure 4 with 1 supplement

Ventral striatum – medial SNr – motor thalamus circuitry provides a mechanism underlying limbic-to-motor connectivity through the direct pathway.
(A–C) Cre-dependent, AAV anterograde tracing of striato-nigral projections from VS and DS using D1-Cre mice (A) shows segregated terminal fields in SNr (B), in which VS innervates the medial SNr. DS and VS innervate EPN and LH, respectively (C). N = 3, including CTb-based tracing. Scale bars: 500 µm (A) and 200 µm (B, C). (D–F) The same strategy as in panels (A–C) for mapping DMS versus DLS efferents. N = 3, including CTb-based tracing. Scale bars: 500 µm (D) and 200 µm (E, F). (G–I) Dual Cre-dependent AAV anterograde tracing of nigro-thalamic projections using PV-Cre mice. Conjugated GFP and tdTomato are separately expressed in the lateral and medial SNr (G), which then target distinct thalamic nuclei (H, I). Insets emphasize the medial SNr projections to VA and to the caudal VM. Scale bars: 200 µm (G) and 500 µm (H,I). (J–L) Thalamo-cortical neurons projecting to mPFC, M2 and M1 were identified using three fluorophores of CTb. Insets in (K, L) indicate VA and caudal VM thalamus that contain M1- and M2-projecting thalamic neurons, which correspond to the insets in (H) and (I) where medial SNr sends axon terminals. Scale bars, 500 µm. (M, N) Schematic illustration showing that medial SNr, which receives VS and DMS inputs, projects to VA and caudal VM thalamus, which in turn project to M1 and M2, as the mechanism for limbic-to-motor connectivity through the direct pathway. (O, P) Ex vivo electrophysiology is used to determine the functional strength of inputs from DLS or VS onto SNr neurons projecting to motor thalamus. Injections of red fluorescent protein retrobeads in VA-VL and AAV.hsyn.ChR2.eYFP in the striatum resulted in striato-nigral labeled axons and retrogradely labeled retrobeads+ cells in the SNr (left). Images indicate recording pipettes attached to retrobeads+ cells (middle). Example traces recorded from lateral (O) and medial SNr neurons (P) under optical stimulation (blue bars above traces, right). Under the glutamate receptor antagonists (CNQX and DL-APV), IPSCs are visible immediately after stimulation, which were abolished by application of picrotoxin (PTX) that blocks GABAa receptors. Scale bars: 20 µm. (Q, R) Mean amplitude (medial, 0.902 ± 0.235; lateral, 0.842 ± 0.206; unpaired t-test, t11 = 0.177, p=0.862) and paired pulse ratio (medial, 0.697 ± 0.099; lateral, 0.778 ± 0.196; unpaired t-test, t11 = 0.410, p=0.690) for all recorded neurons in medial (n = 8 from seven mice) and lateral SNr (n = 5 from two mice). There is a neuron in medial SNr that did not respond to optical stimulation, and we excluded it from the analysis. Note that this neuron was located outside of a ChR2.YFP positive area. Data presented as mean ± SEM. Abbreviations: cp, cerebral peduncle; ic, internal capsule; mt, mammillothalamic tract; fr, fasciculus retroflexus; MD, mediodorsal; CM, centromedial; PC, paracentral; CL, centrolateral; LP, lateral posterior; PO, posterior; VPM, ventroposterior medial thalamus; PrL, prelimbic cortex; Cg, cingulate cortex.
-
Figure 4—source data 1
Source data for ex vivo slice electrophysiology.
Both the paired-pulse ratio (PPR) and the amplitude of each neuron recorded in medial or lateral SNr are provided.
- https://doi.org/10.7554/eLife.49995.013
Figure 4—figure supplement 1

Detailed analyses of injection sites for viral tracing for basal ganglia topography.
(A) 3D-reconstruction of entire mouse cerebral cortex, striatum and SNr. Using these templates, the actual injection sites are mapped within the 3D-space in the subsequent panels (B–E). Two different dorsal and rostral views are provided. (B–C) 3D-reconstructed injection sites and spread of eGFP+ and tdTomato+ cells into the striatum of D1-Cre mice. Note that the virus injection in VS caused a slight spillover into the bottom of DMS (B). (D) 3D-reconstruction of eGFP+ and tdTomato+ cells in SNr, based on the distribution of the infected starter cells. (E) 3D-reconstruction of cortical CTb injections. (F) (Related to Figure 4G–I.) Using a VGAT-Cre mouse, AAV.FLEX.tdTomato was injected in medial SNr. The right panel shows starter cells in medial SNr. Note that tdTomato+ cells are also identified in neighboring VTA GABAergic neurons as the result of a technical limitation of the micro-injection. Scale bar, 200 µm. (G, H) Experiment in (F) showed medial SNr axon terminals innervating, nucleus VA (G) in the rostral thalamus and the ventral half of caudal VM (H) in the caudal thalamus. This projection pattern is identical to the result of medial SNr projections verified in a PV-Cre mouse (Figure 4G–I). Both VA and caudal VM project to motor cortex (Figure 4K and L). Scale bars, 500 µm. (I, J) Injection of red retrobeads into motor thalamus targeting VA-VL (I). Owing to the ex vivo slice preparation, we could not obtain sections with thalamus. To verify that our injection sites targeted motor thalamus, retrogradely labeled cortico-thalamic cells in the cortex were analyzed. This panel indicates preferential labeling of layer 6 cortico-thalamic cells in M1, with few neurons in Cg, suggesting that the injection of retrobeads was selective to motor thalamic nuclei (J). Scale bar, 500 µm.
Figure 5 with 2 supplements
In vivo optogenetic stimulation of VS terminals in SNr modulates M1 activity, but DLS terminal stimulation in SNr does not affect mPFC activity.
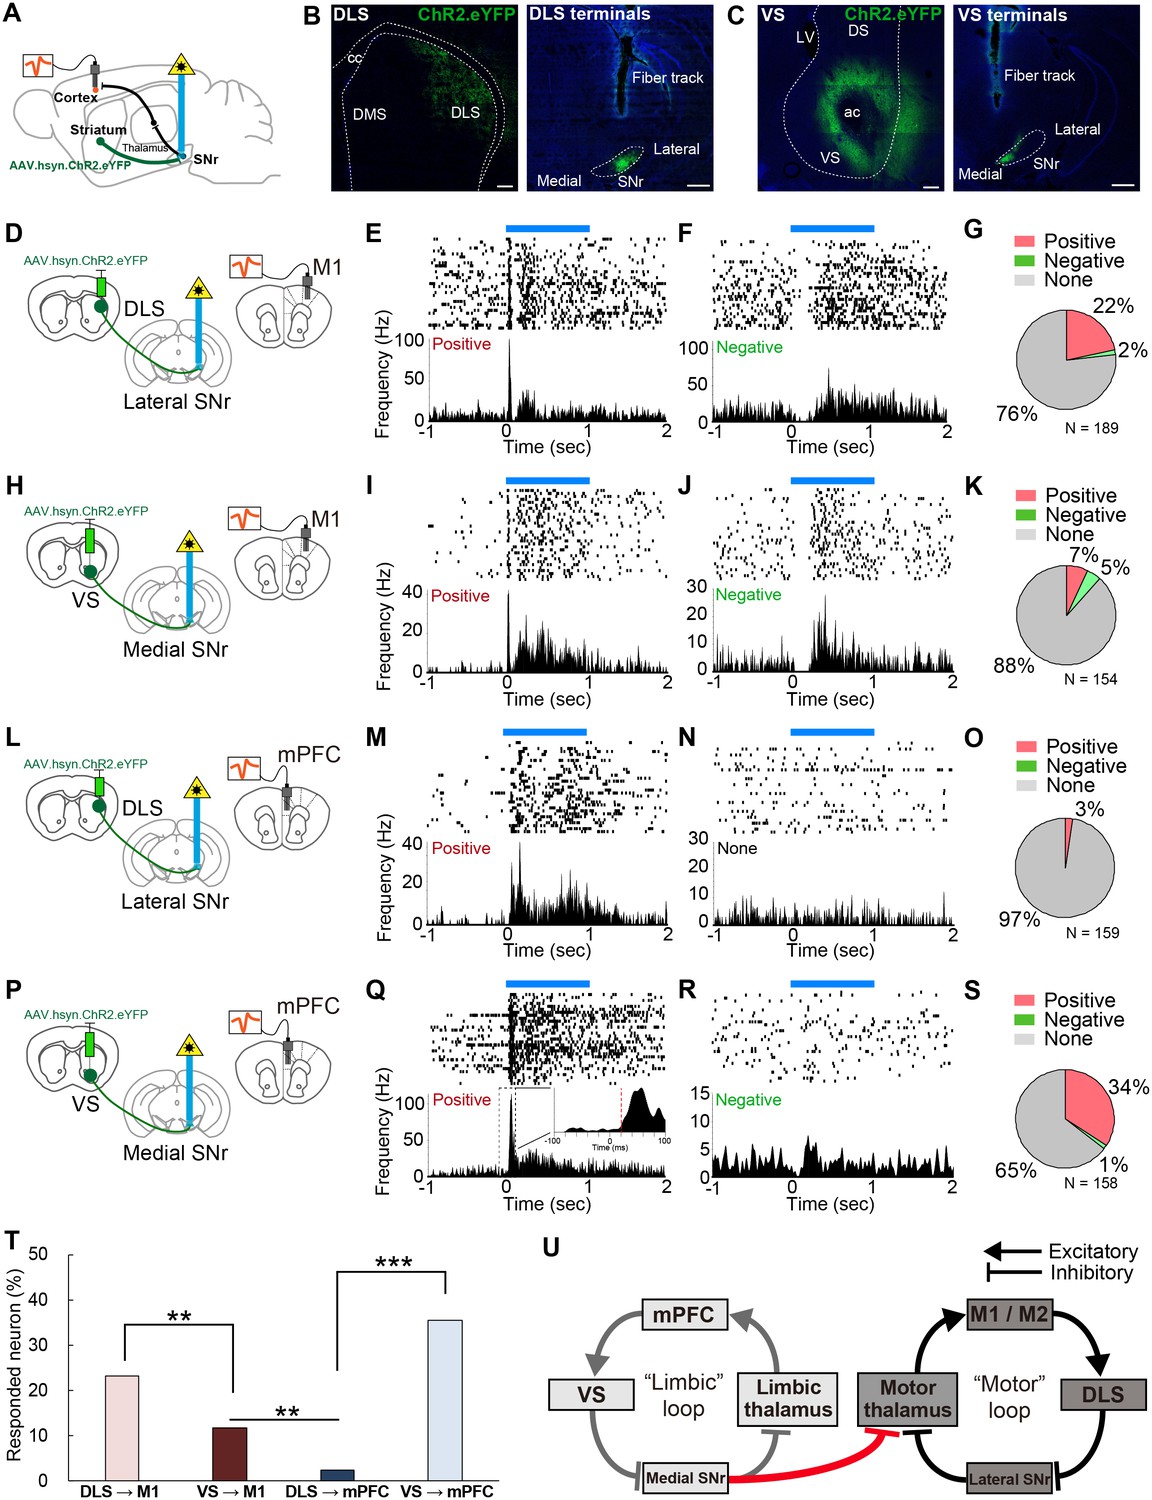
(A) A schematic diagram for in vivo multi-unit recording with optical stimulation. AAV.hsyn.ChR2.eYFP was injected in DLS or VS. During recording, an optic fiber was implanted into either medial or lateral SNr and the recording electrodes were placed in M1 and mPFC. The order of recording from M1 and mPFC was counter-balanced. (B, C) Sample images of the expression of AAV.hsyn.ChR2.eYFP in DLS (B) or VS (C), and their terminals in SNr. Location of terminal labeling was consistent with viral tracing experiments (Figure 4A–F). Scale bars: 200 µm (striatum) and 500 µm (SNr). (D–G) In vivo recording from M1 with optical activation of DLS terminals in SNr (n = 189 cells from three mice). Schematic diagram for this experiment (D). (E, F) Examples of positively (E, excited between 5–35 ms) and negatively responding neurons (F, inhibited between 5–35 ms). The upper and lower panels show raster plots, and peri-stimulus time histograms (PSTHs), respectively. Blue horizontal bars indicate 1 s optogenetic stimulation. (G) Pie charts indicating the proportion of positive, negative and unresponsive neurons within the time window (5–35 ms after the onset of optical stimulation), respectively. (H–K) Same as above with the condition of VS terminal stimulation with M1 recording (n = 154 cells from four mice). (L–O) Same as above with the condition of DLS stimulation with mPFC recording (n = 159 cells from three mice). (P–S) Same as above with the condition of VS stimulation with mPFC recording (n = 158 cells from four mice). The inset in (Q) is a zoom-in panel showing an example of the detected latency (red dashed line) based on a change in activity beyond 3SD from baseline activity (see details in Materials and methods). (T) A comparison of the percentage of responded cortical neurons to optogenetic stimulation. These results indicate that VS axonal stimulation alters the activity of M1, but that DLS stimulation rarely evokes responses in mPFC. Z-tests: DLS to M1 vs VS to M1, z = 2.775, p=0.0055; VS to M1 vs DLS to mPFC, z = 3.174, p=0.0015; and DLS to mPFC vs VS to mPFC, z = 7.483, p<0.0001. (U) Schematic diagram of the present study unveiling a unidirectional limbic-to-motor connection between limbic and motor cortico-basal ganglia-thalamocortical loops. This VS - medial SNr - motor thalamus circuitry involves classic direct pathway disinhibition, thus driving increases in activity in the downstream cortical target, as shown in our in vivo electrophysiology.
-
Figure 5—source code 1
Matlab code for in vivo recording data analysis, including the raster and PETH plot.
- https://doi.org/10.7554/eLife.49995.017
Figure 5—figure supplement 1
Additional analyses of in vivo responses of cortical neurons to optogenetic stimulation of VS- or DLS-terminals in SNr.
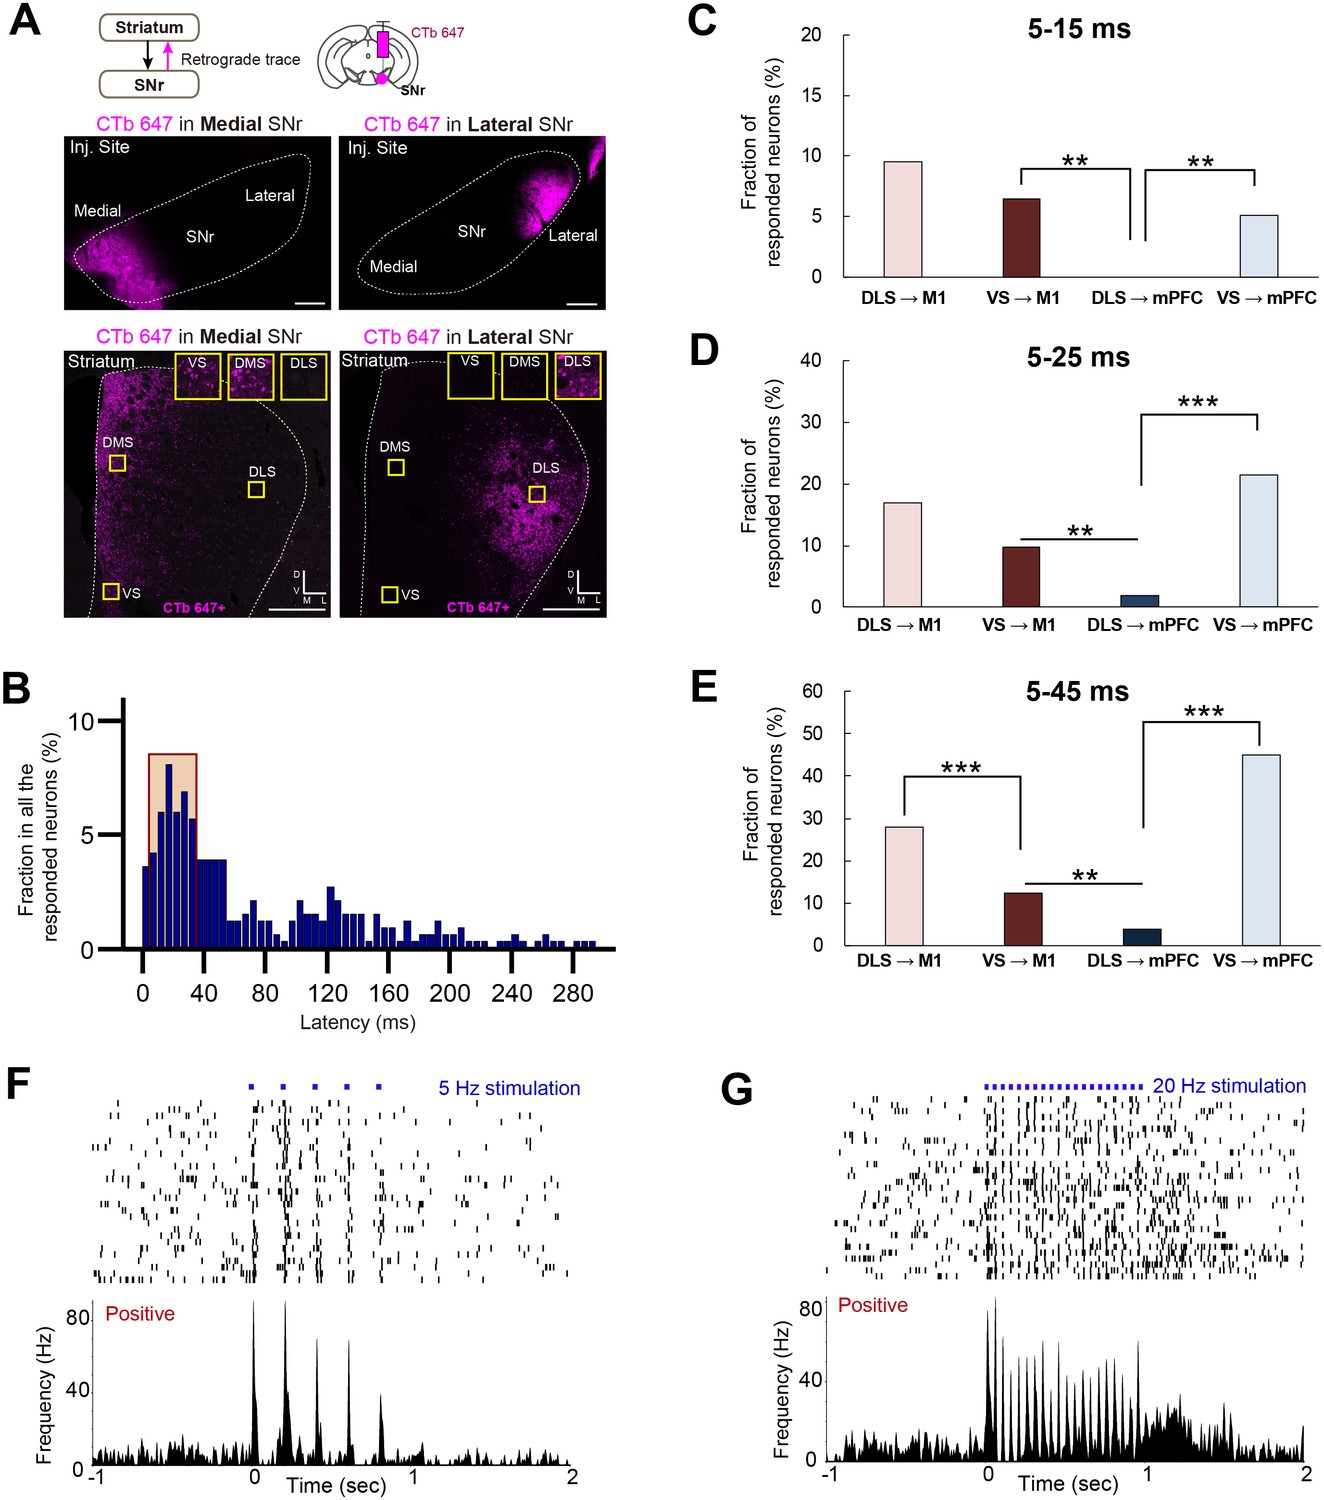
(A) Retrograde tracing from either medial or lateral SNr by CTb-647. Bottom panels show the actual injection sites in these cases, illustrating local expression of CTb-647 in medial and lateral SNr. Consistent with the defined topography of striato-nigral projections (Figure 4A–F), we found specific labeling of CTb-647+ cells in VS and DMS when CTb-647 was injected in the medial SNr (bottom), which contrasts with the selective labeling in DLS after CTb-647 injection in the lateral SNr. Scale bars: 200 µm (middle) and 500 µm (bottom). (B) Latency analysis indicates the fraction of all the responsive neurons, including M1 and mPFC cases, for their latency to the optogenetic stimulation. Responsive neurons within the time window (between 5–35 ms, indicated by a red shade) were divided into following three categories: excited (Positive) and inhibited (Negative), or no response (None) (Figure 5). (C, D, E) Percentage of responsive neurons from different criteria using time windows of: 5–15 ms (C), 5–25 ms (D) and 5–45 ms (E). Both panels resulted in similar distributions of responded neurons in each condition, which supports the findings that VS terminal activation in SNr can alter M1 activity but that it rarely occurs between DLS terminal stimulation and mPFC recording. Z-tests (5–15 ms): DLS to M1 vs VS to M1, z = 1.02, p=0.308; VS to M1 vs DLS to mPFC, z = 3.266, p=0.0011; and DLS to mPFC vs VS to mPFC, z = 2.874, p=0.0041. Z-tests (5–25 ms): DLS to M1 vs VS to M1, z = 1.926, p=0.0541; VS to M1 vs DLS to mPFC, z = 2.984, p=0.0028; and DLS to mPFC vs VS to mPFC, z = 5.443, p<0.0001. Z-tests (5–45 ms): DLS to M1 vs VS to M1, z = 3.552, p=0.0004; VS to M1 vs DLS to mPFC, z = 2.794, p=0.0052; and DLS to mPFC vs VS to mPFC, z = 8.545, p<0.0001. (F, G) Representative examples of the same M1 neuron shown in Figure 5E responding to DLS terminal stimulation using different frequencies (F, 5 Hz; G, 20 Hz). Note the consistent positive modulation of firing rate under various stimulation parameters. Upper and lower panels show raster plots, and PSTHs, respectively.
Figure 5—figure supplement 2

Electrophysiological recording from neurons in SNr, motor thalamus, and M1 while stimulating D1R direct pathway neurons in DLS and VS.
(A–E) In vivo recording from SNr with optical activation of D1R neurons in DLS (n = 358 cells). (A) Schematic diagram for this experiment. (B) An example neuron that negatively responded to the optical stimulation ( inhibited), and its profile with a different time scale. (C) Upper and lower panels show raster plots, and PSTHs, respectively. Blue horizontal bars indicate 1 s optogenetic stimulation. (D) Histogram indicates the distribution of latencies across all the responsive neurons in SNr. (E) Pie chart indicates the proportion of inhibited neurons in SNr. (F–J) Similar to (A–E). Recording from motor thalamus while activating D1R neurons in DLS (n = 104 cells). (J) Pie chart shows the proportion of positively modulated neurons in motor thalamus. (K–O) Similar to (A–E). Recording from M1 while activating D1R neurons in DLS (n = 123 cells). (O) Pie chart shows the proportion of positively modulated neurons in M1 within 5–35 ms. (P–T) Similar to (A–E). Recording from M1 while activating D1R neurons in VS (n = 92 cells). (T) Pie chart shows the proportion of positively modulated neurons in M1 within 5–35 ms.
Author response image 1
Tables
Key resources table
| Reagent type (species) or resource | Designation | Source or reference | Identifiers | Additional information |
|---|---|---|---|---|
| Strain, strain background (Rattus norvegicus) | Wistar rats | Chales River, France | Wistar IGS rats, strain code: 003 | |
| Strain, strain background (Mus musculus) | Wild-type C57BL/6 mice | Jackson Laboratory | JAX:000664 | |
| Strain, strain background (Mus musculus) | Drd1a-Cre mice | MMRRC | RRID: MMRRC_034258-UCD | |
| Strain, strain background (Mus musculus) | Pvalb-Cre mice | Jackson Laboratory | JAX:008069 | |
| Strain, strain background (Mus musculus) | Slc32a1-Cre (VGAT-Cre) mice | Jackson Laboratory | JAX:016962 | |
| Strain, strain background (Mus musculus) | Ai32 mice (B6;129S-Gt(ROSA)26Sortm32(CAG-COP4*H134R/EYFP)Hze/J) | Jackson Laboratory | JAX:012569 | |
| Strain, strain background (Adeno-associated virus) | AAV5/EF1-Flex-TVA-Cherry | UNC Viral Vector Core | RRID: SCR-002448 | |
| Strain, strain background (adeno-associated virus) | AAV8/CA-Flex-RG | UNC Viral Vector Core | RRID: SCR_002448 | |
| Strain, strain background (recombinant rabies virus) | EnvA.dGRabies.eGFP | Salk Vector Core | RRID: SCR_014847 | |
| Strain, strain background (adeno-associated virus) | AAV9.FLEX.tdTomato | University of Penn Viral Vector Core | RRID: SCR_015406 | |
| Strain, strain background (adeno-associated virus) | AAV9.FLEX.eGFP | University of Penn Viral Vector Core | RRID: SCR_015406 | |
| Strain, strain background (adeno-associated virus) | AAV9.CAG.tdTomato | UNC Viral Vector Core | RRID: SCR_002448 | |
| Strain, strain background (adeno-associated virus) | AAV9.hsyn.ChR2.eGFP | University of Penn Viral Vector Core | RRID: SCR_015406 | |
| Strain, strain background (adeno-associated virus) | AAV5-EF1a-DIO-hChR2(H134R)-mCherry | University of Penn Viral Vector Core | ||
| Antibody | anti-wild type rabies phosphoprotein mouse monoclonal antibody | commercially unavailable (Raux et al., 1997) | (1:5000) | |
| Antibody | anti-cholera toxin b-subunit goat polyclonal antibody | List Biological Laboratories | Cat.# 704 | (1:15000) |
| Antibody | anti-tyrosine hydroxylase (TH) mouse monoclonal antibody | Millipore | Cat.# MAB318 | (1:1000) |
| Antibody | anti-NeuN rabbit polyclonal antibody | Abcam | Cat.# ab104225 | (1:1000) |
| Antibody | anti-GFP chicken polyclonal antibody | Novus Biologicals | Cat.# NB100-1614 | (1:1000) |
| Antibody | anti-substance P mouse monoclonal antibody | Abcam | Cat.# ab14184 | (1:1000) |
| Antibody | anti-mouse IgG horseradish peroxydase (HRP) (host: rabbit, polyclonal) | DAKO | Cat.# P260 | (1:200) |
| Antibody | anti-goat IgG horseradish peroxydase (HRP) (host: rabbit, polyclonal) | DAKO | Cat.# P044901-2 | (1:200) |
| Antibody | anti-mouse Alexa Fluor 488 (host: donkey, polyclonal) | Jackson ImmunoResearch Laboratories | Cat.# 715-545-151 | (1:250) |
| Antibody | anti-mouse Cy3 (host: donkey, polyclonal) | Jackson ImmunoReseach Laboratories | Cat.# 715-165-151 | (1:250) |
| Antibody | anti-mouse Cy5 (host: donkey, polyclonal) | Jackson ImmunoReseach Laboratories | Cat.# 715-175-151 | (1:250) |
| Antibody | anti-rabbit Alexa Fluor 488 (host: donkey, polyclonal) | Jackson ImmunoReseach Laboratories | Cat.# 711-545-152 | (1:250) |
| Antibody | anti-rabbit Cy3 (host: donkey, polyclonal) | Jackson ImmunoReseach Laboratories | Cat.# 711-165-152 | (1:250) |
| Antibody | anti-rabbit Cy5 (host: donkey, polyclonal) | Jackson ImmunoReseach Laboratories | Cat.# 711-175-152 | (1:250) |
| Antibody | anti-chicken Alexa Fluor 488 (host: donkey, polyclonal) | Jackson ImmunoReseach Laboratories | Cat.# 703-545-155 | (1:250) |
| Chemical compound, drug | Neurotrace 647 | Invitrogen | Cat.# N21483 | (1:250) |
| Chemical compound, drug | DL-APV | Tocris | Cat.#. 0106 | |
| Chemical compound, drug | CNQX | Sigma-Aldrich | Cat.#. C239 | |
| Chemical compound, drug | Picrotoxin | Sigma-Aldrich | Cat.#. P1675 | |
| Chemical compound, drug | QX-314 | Sigma-Aldrich | Cat.#. L5783 | |
| Chemical compound, drug | cholera-toxin b-subunit in low-salt | List Biological Laboratories | Cat.# 104 | |
| Chemical compound, drug | cholera-toxin b-subunit Alexa Fluor 488 conjugate | Invitrogen | Cat.# C22841 | |
| Chemical compound, drug | cholera-toxin b-subunit Alexa Fluor 555 conjugate | Invitrogen | Cat.# C34776 | |
| Chemical compound, drug | cholera-toxin b-subunit Alexa Fluor 594 conjugate | Invitrogen | Cat.# C22842 | |
| Chemical compound, drug | cholera-toxin b-subunit Alexa Fluor 647 conjugate | Invitrogen | Cat.# C34778 | |
| Chemical compound, drug | Red Retrobeads | Lumafluor Inc | ||
| Software, algorithm | Matlab | MathWorks | R2015b | |
| Software, algorithm | Prism | GraphPad | GraphPad Prism 7 | |
| Software, algorithm | Neurolucida | MBF Bioscience | NL-11 | |
| Software, algorithm | CorelDRAW | Corel | CorelDRAW Graphics Suite X7 | |
| Software, algorithm | ImageJ | NIH | ImageJ Win64 bit | |
| Software, algorithm | ZEN | Zeiss | ZEN | |
| Software, algorithm | pClamp 9.2 | Molecular Devices | Molecular Devices | |
| Software, algorithm | Offline Sorter | Plexon | Version 3.3.3 |
Additional files
-
Transparent reporting form
- https://doi.org/10.7554/eLife.49995.018
Download links
A two-part list of links to download the article, or parts of the article, in various formats.
Downloads (link to download the article as PDF)
Open citations (links to open the citations from this article in various online reference manager services)
Cite this article (links to download the citations from this article in formats compatible with various reference manager tools)
An open cortico-basal ganglia loop allows limbic control over motor output via the nigrothalamic pathway
eLife 8:e49995.
https://doi.org/10.7554/eLife.49995


