Casposase structure and the mechanistic link between DNA transposition and spacer acquisition by CRISPR-Cas
- National Institute of Diabetes and Digestive and Kidney Diseases, National Institutes of Health, United States
Figures
Figure 1
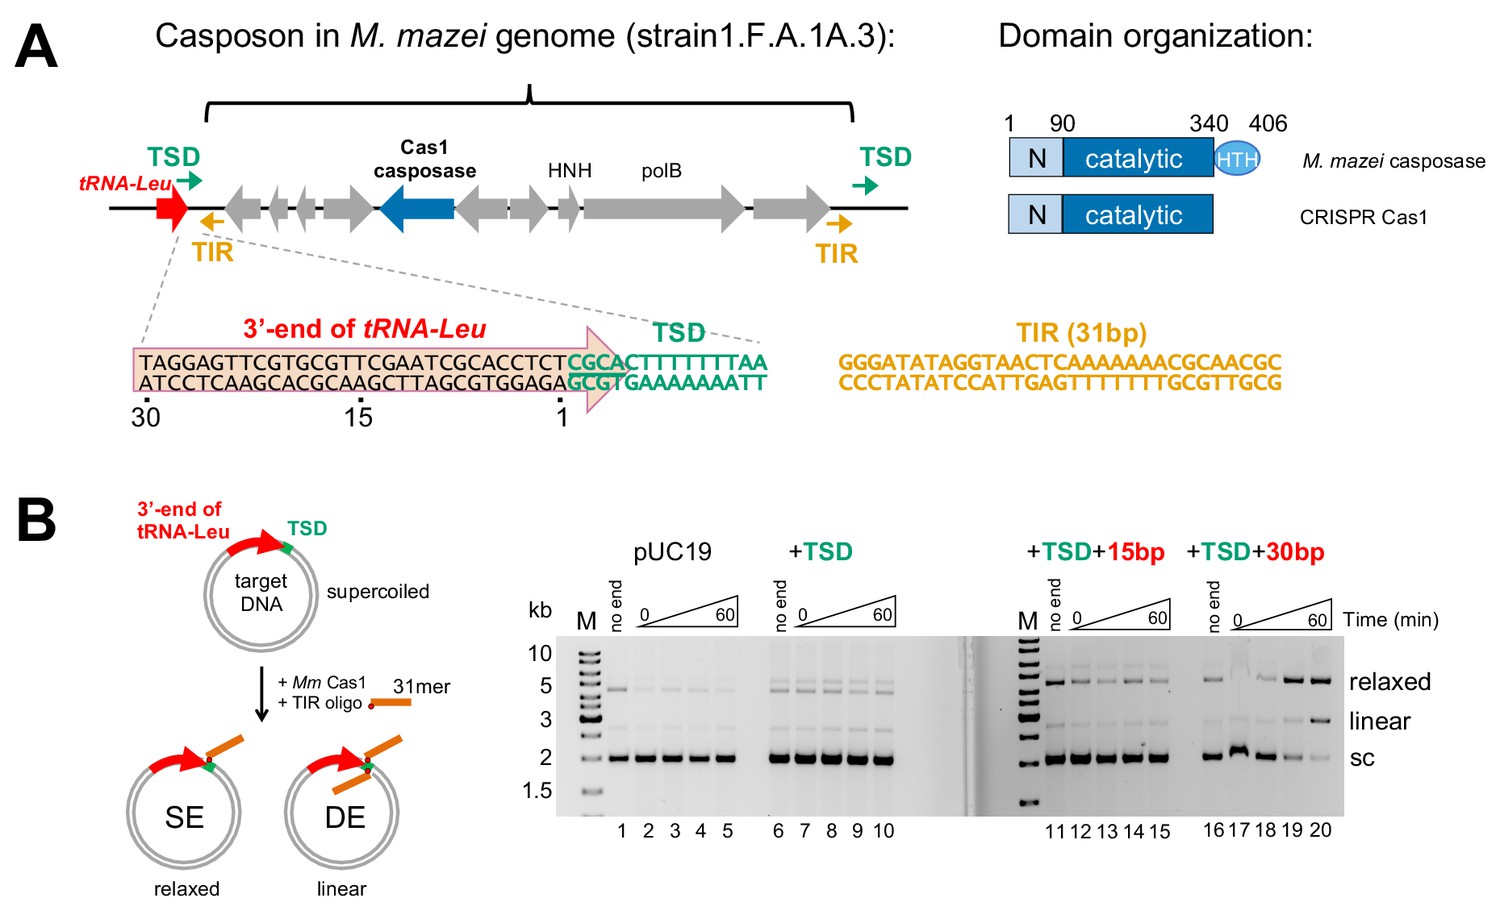
Methanosarcina mazei casposon organization and initial biochemical characterization.
(A) (left) Schematic of a representative casposon from Methanosarcina mazei (the gene organization of casposon MetMaz1FA1A3-C2 is shown; Krupovic et al., 2016) adjacent to host tRNA-Leu gene (red arrow). The last 4 bp of the tRNA-Leu gene overlap with 4 bp of the 14 bp target site duplication (TSD; green arrows) that flanks the casposon. The casposon Terminal Inverted Repeats (TIR) are shown as orange arrows. M. mazei casposon genes are as annotated by Krupovic et al. (2016), and are in gray with the exception of the putative Cas1-type casposase (in blue). Genes corresponding to a B-family type polymerase (‘polB’) and an HNH nuclease (‘HNH’) are marked. In the sequence below, a conserved 5'-CGCA motif at the 5'-end of the TSD is underlined. The sequence of the 31 bp TIR from strain S-6 and others, located at each casposon end, is shown in orange. (right) Relative to CRISPR Cas1, family two casposases have an additional C-terminal 60–70 residues predicted to form a helix-turn-helix (HTH) domain (Krupovic et al., 2014). Amino acid numbering is that of the M. mazei casposase. (B) In vitro integration assay of the M. mazei TIR into a target plasmid. The schematic at left shows the formation of relaxed and linear products corresponding to single-end (SE) and double-end (DE) integration of an oligonucleotide into a plasmid. The oligonucleotide is shown schematically in orange where the red dot indicates the 3'-OH nucleophile. In the agarose gels shown at the right, for the ‘no end’ controls, the plasmid was incubated for 60 min in the presence of protein and metal ion, but without the addition of the 31-mer TIR. For each reaction, the time points are: 0, 1, 5, and 60 min. Target: pUC19 (lanes 1–5); +14 bp TSD sequence (lanes 6–10); +TSD+15 bp more of the tRNA-Leu gene (lanes 11–15); +TSD+30 bp more of the tRNA-Leu gene (lanes 16–20).
Figure 2 with 1 supplement
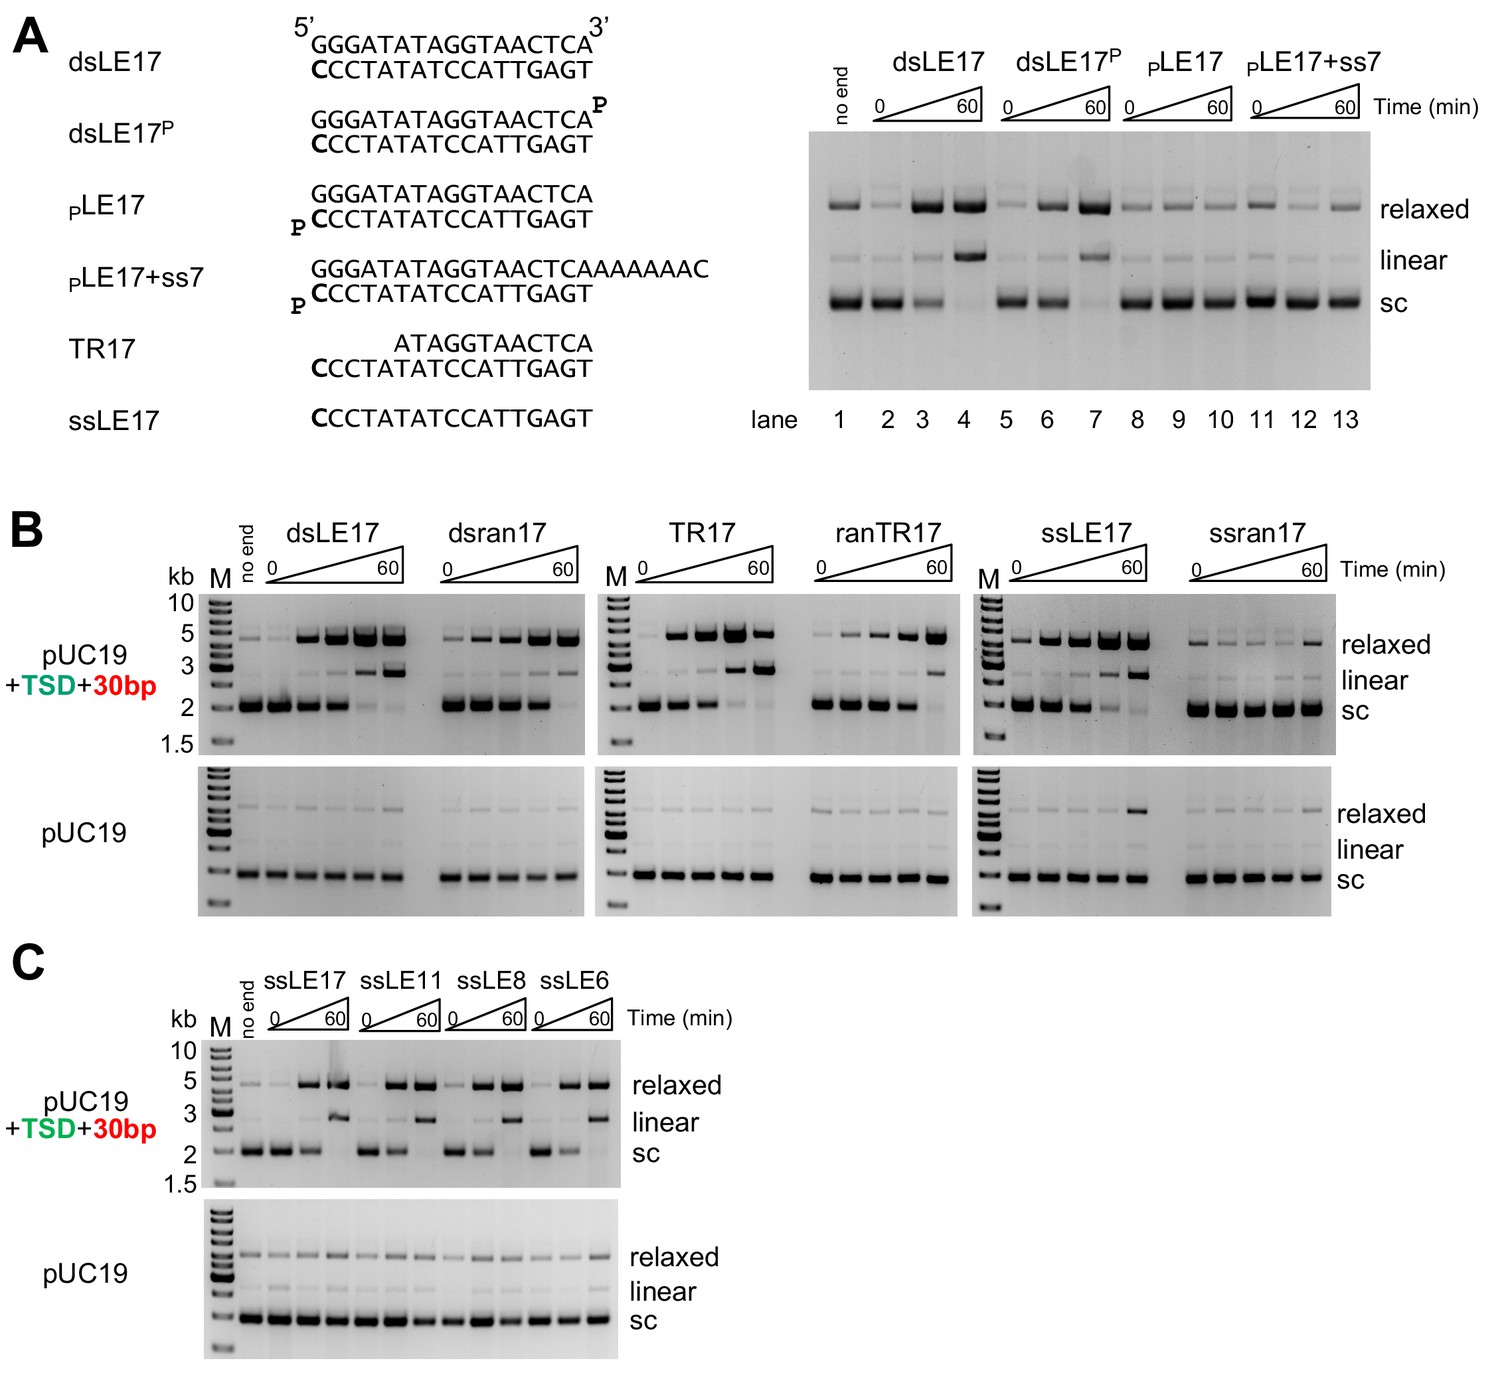
In vitro integration activity properties of the M. mazei casposase.
(A) Effect of blocking free 3'-OH ends on product formation. (left) Sequences of TIR oligonucleotides used to assay integration into pUC19+TSD+30 bp. The 3'-end C at the casposon end is in bold. (right) For each reaction shown, time points are: 0, 1, and 60 min. (B) Integration into the specific target plasmid (pUC19+TSD+30 bp, top) compared to integration into pUC19 (bottom). Integration was assayed using a variety of substrate forms as shown (all sequences can be found in Table S1). For each reaction, time points are: 0, 0.5, 1, 5, and 60 min. Reactions were performed in triplicate, and product quantitation is in Figure 2—figure supplement 1. (C) Integration of single-stranded casposon ends. For each reaction, time points are: 0, 1, and 60 min.
Figure 2—figure supplement 1
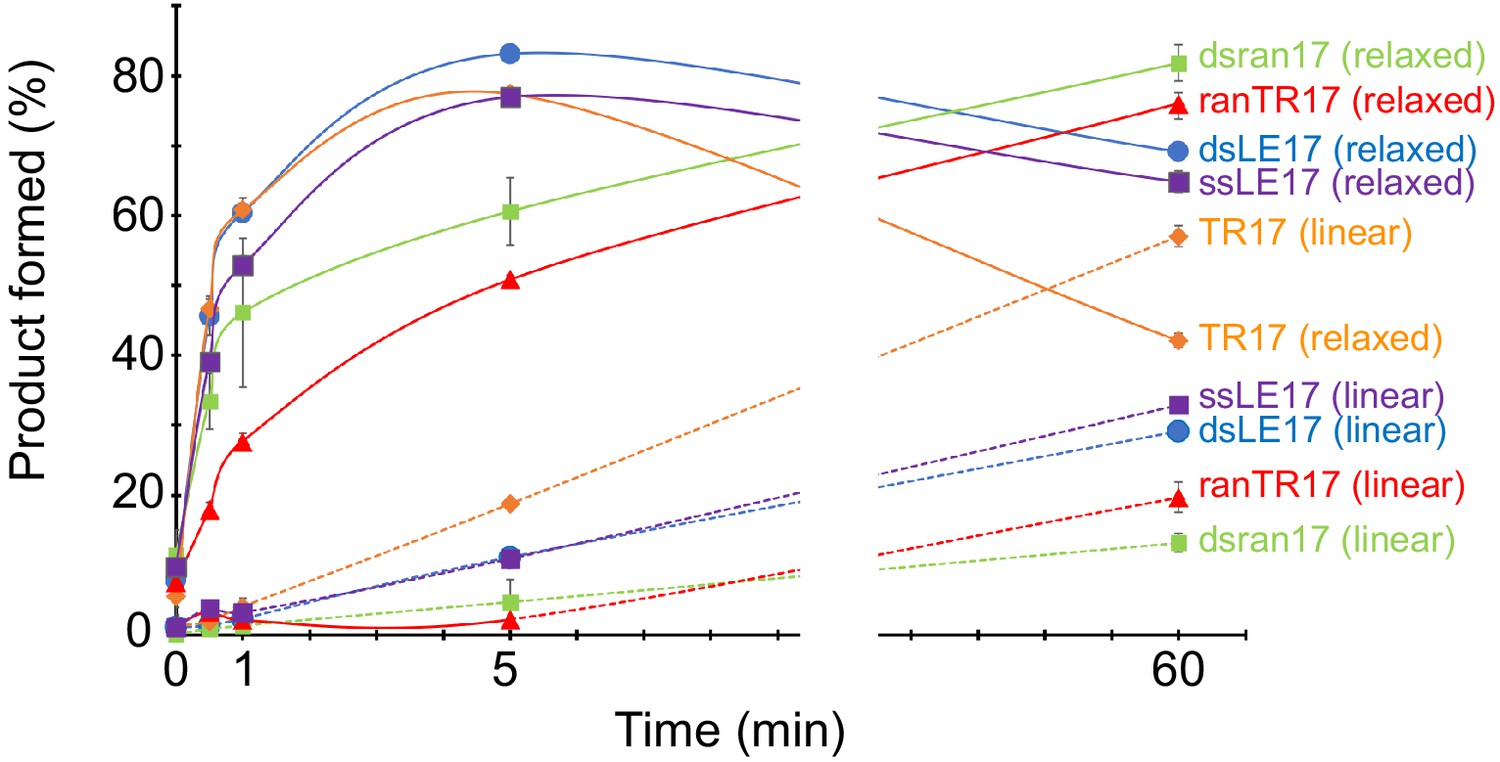
Quantitation of time course of product formation.
Data points are the mean of three replicates, and the error bars represent the standard deviation. The gap indicates there are no data points between 5 and 60 min.
Figure 3 with 1 supplement
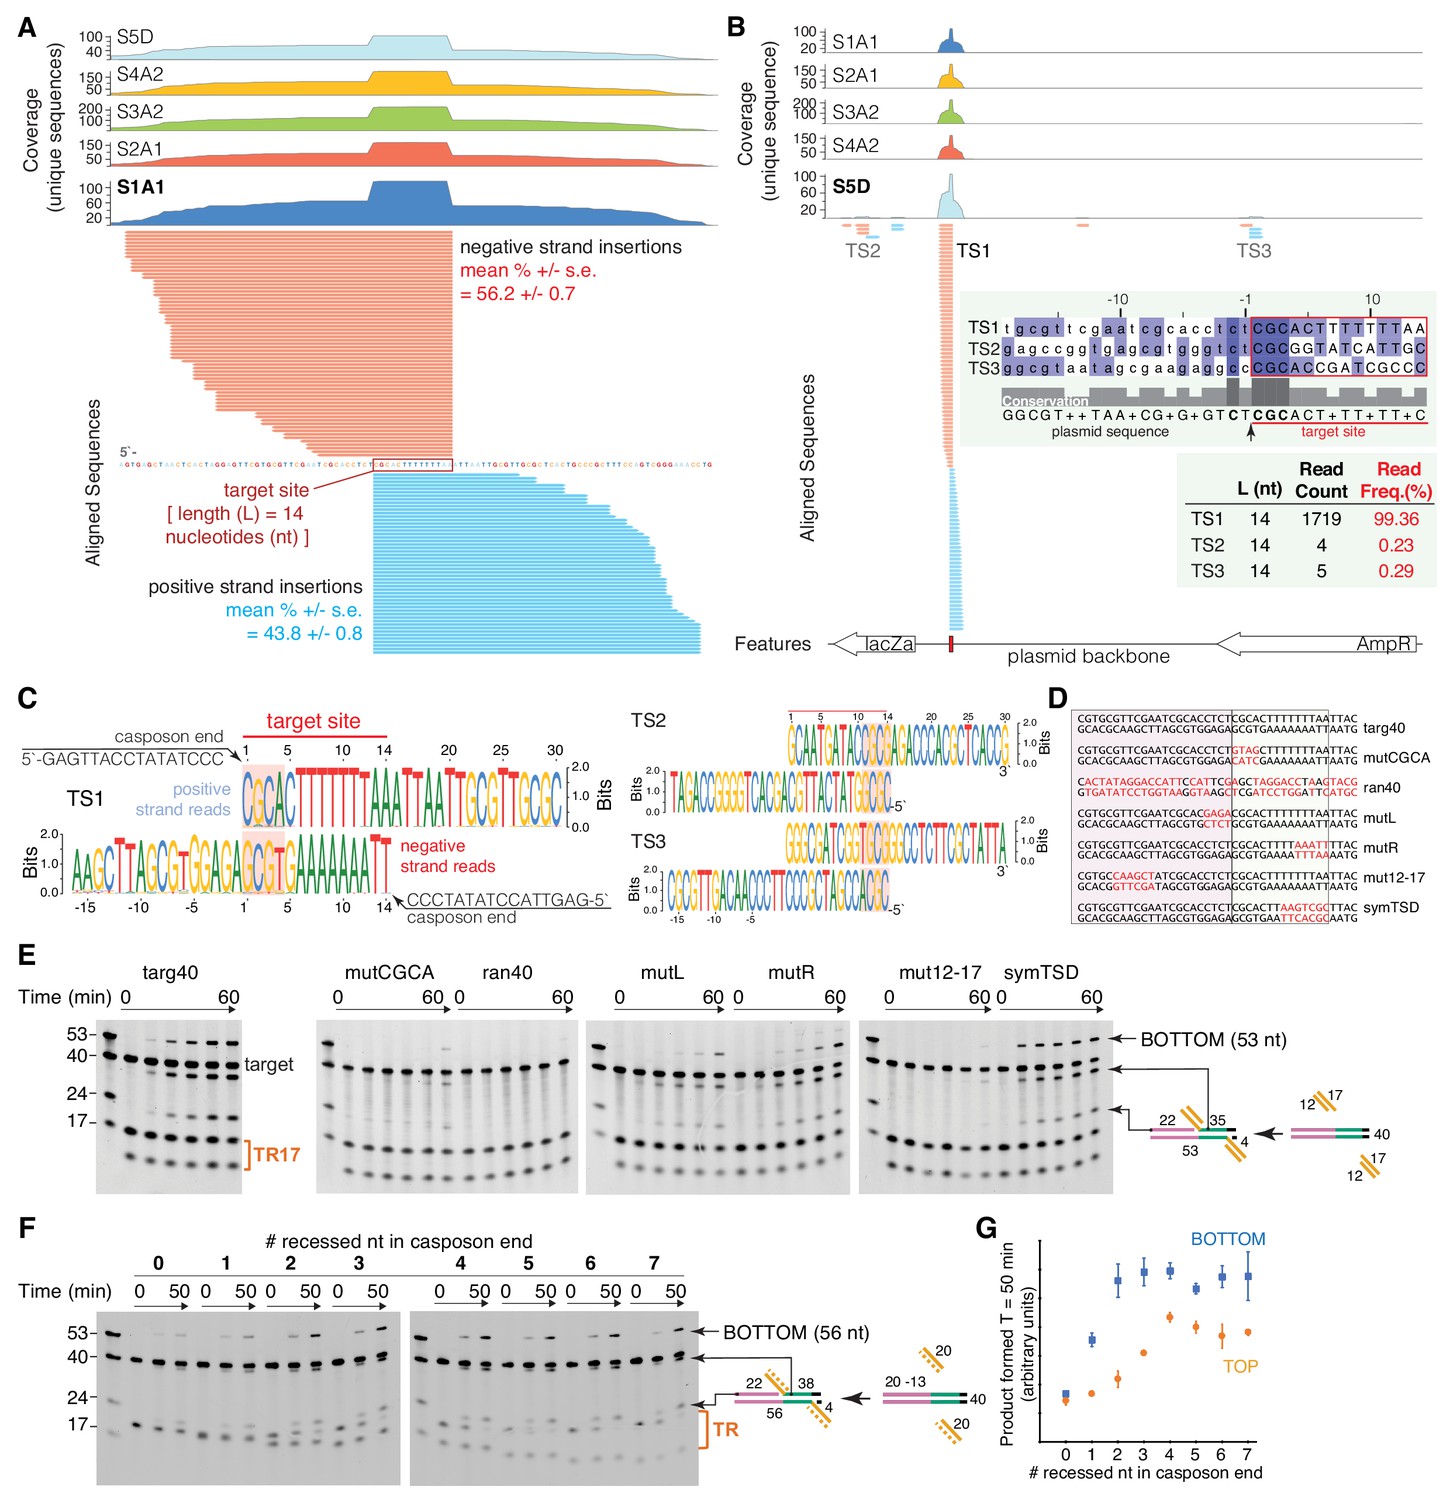
Characterization of target-site specificity.
(A) Double-end integration products of five independent reactions (sample S1-S5) were purified and analyzed by next generation sequencing (NGS). Sample 1–4 were PCR-amplified before sample preparation for NGS. Sample five was directly subjected to NGS sample prep. The five independent reactions show the same dominant target site (TS1). The substrate sequence 3’ of the novel insertion identifies the 14 bp target-site. Reads were collapsed by unique sequences, clipped 3’ of the spacer sequence, and aligned to the target plasmid (pUC19+TSD+30 bp). Mean read frequencies (+ /- standard error) for insertions on the positive (blue) and negative (red) strand (A) and a representative sequence logo (C) are depicted. The negative strand logo has been flipped to visualize the sequence complementarity. The CGCA motifs are highlighted. (B) Sample S5D showed additional minor target sites (TS2 and TS3) with similar target motifs (C). (D) Target variants for assay of TR17 integration into a 40-mer target. Nucleotides in red indicate where targ40 sequences were mutated. (E) As shown schematically at the right, integration into the target top strand generates a 22-mer and 35-mer product pair; integration into the bottom strand generates a 53-mer (and a 4-mer too short to be detected). For each reaction, time points are: 0, 0.25, 1, 2, 5, and 60 min. The first lane in each gel contains standard size markers for reference. (F) Integration of a 20mer casposon end (‘TR’ on the right) into targ40 as a function of the number of recessed nucleotides on the top strand. The experiment is shown schematically at the right where the recessed strand is shown as the dashed orange line. Reactions were performed in triplicate, and quantitation of product formation (as measured as band intensity) for both the bottom strand (blue) and top strands (orange) is shown in (G). Plotted points represent the mean, and the error bars correspond to the standard deviation. ssRNA can also be integrated (Figure 3—figure supplement 1).
Figure 3—figure supplement 1
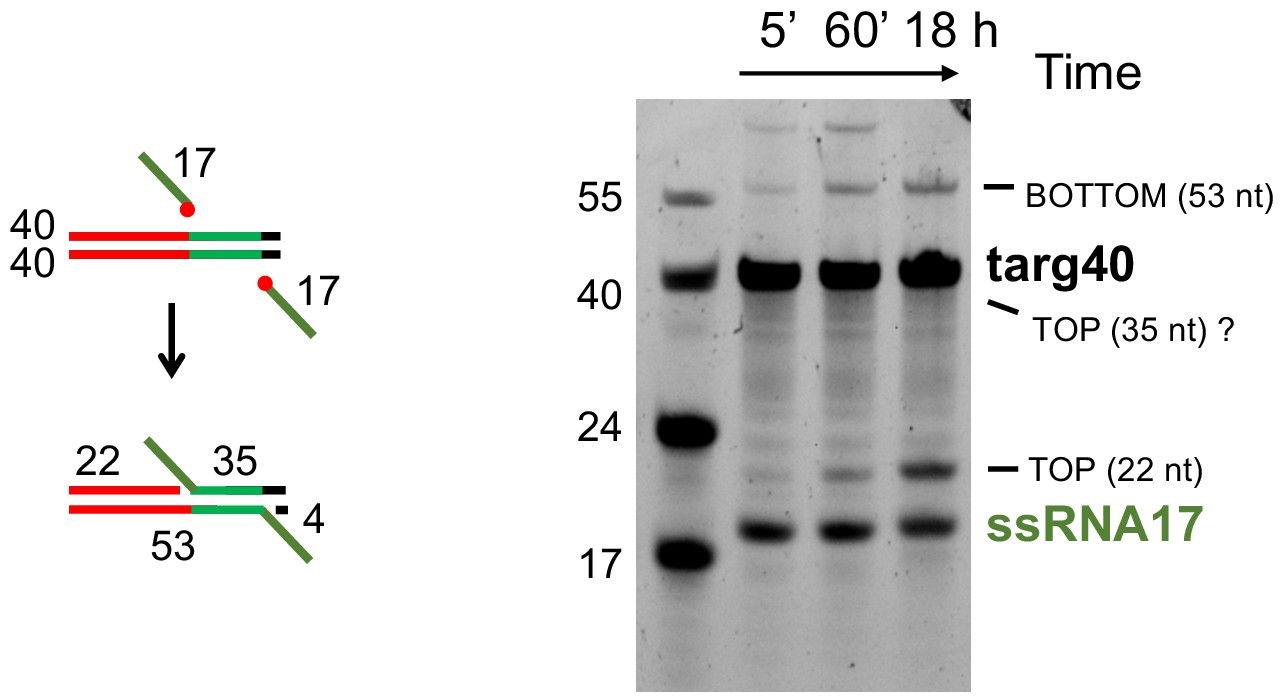
Integration of ssRNA into targ40.
The red circles in the schematic indicate 3’-OH groups of the RNA substrate. The expected 35 nt product of top strand insertion is not observed; it is possible it has altered mobility and is hidden under the targ40 substrate band or may have been disintegrated (the reverse reaction of integration). Note the altered mobilities of ssRNA17 relative to the 17mer DNA marker and the 53-nt DNA/RNA hybrid product of bottom strand integration relative to the 55mer DNA marker.
Figure 4 with 2 supplements
Characterization of casposase-DNA complexes.
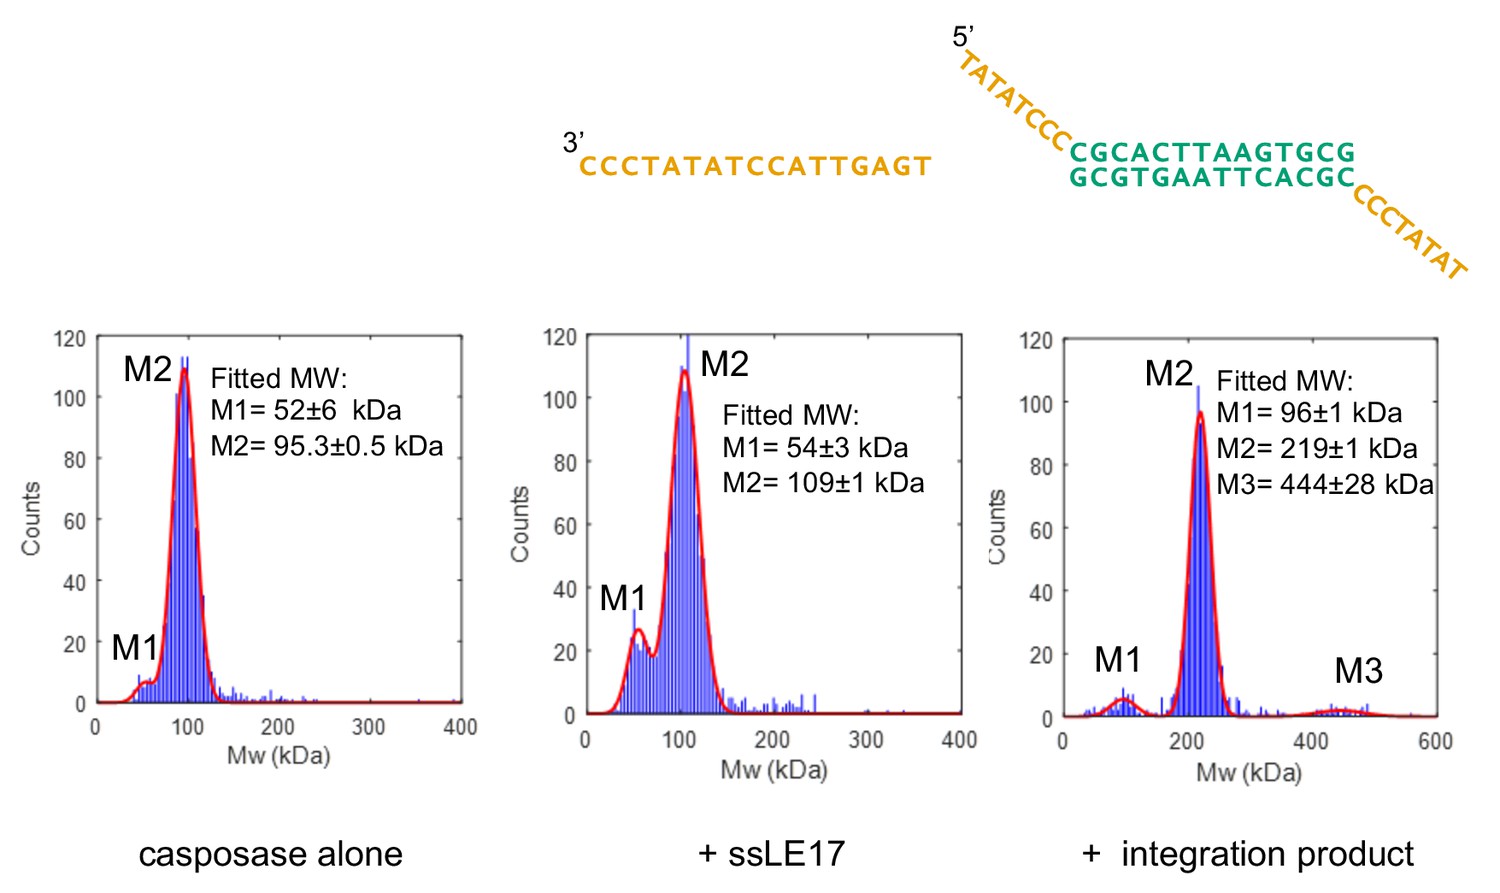
Characterization by interferometric scattering mass spectrometry (iSCAMS) analysis. Casposase alone (left; MWcalcmonomer = 49.4 kDa, dimer = 98.8 kDa), casposase bound to ssLE17 (center; MWcalc dimer+ssLE17 = 104 kDa, dimer+2xssLE17 = 109.1 kDa), and casposase bound to integration complex used for crystallographic studies (right, MWcalcDNA = 13.3 kDa; tetramer+DNA = 210.9 kDa). Each experiment was performed once for each indicated binding substrate, and all of the data is included in the mass histograms. The reported error corresponds to the fitting error to a Gaussian distribution model. Characterization by size-exclusion chromatography (SEC) is shown in Figure 4—figure supplements 1 and 2.
Figure 4—figure supplement 1
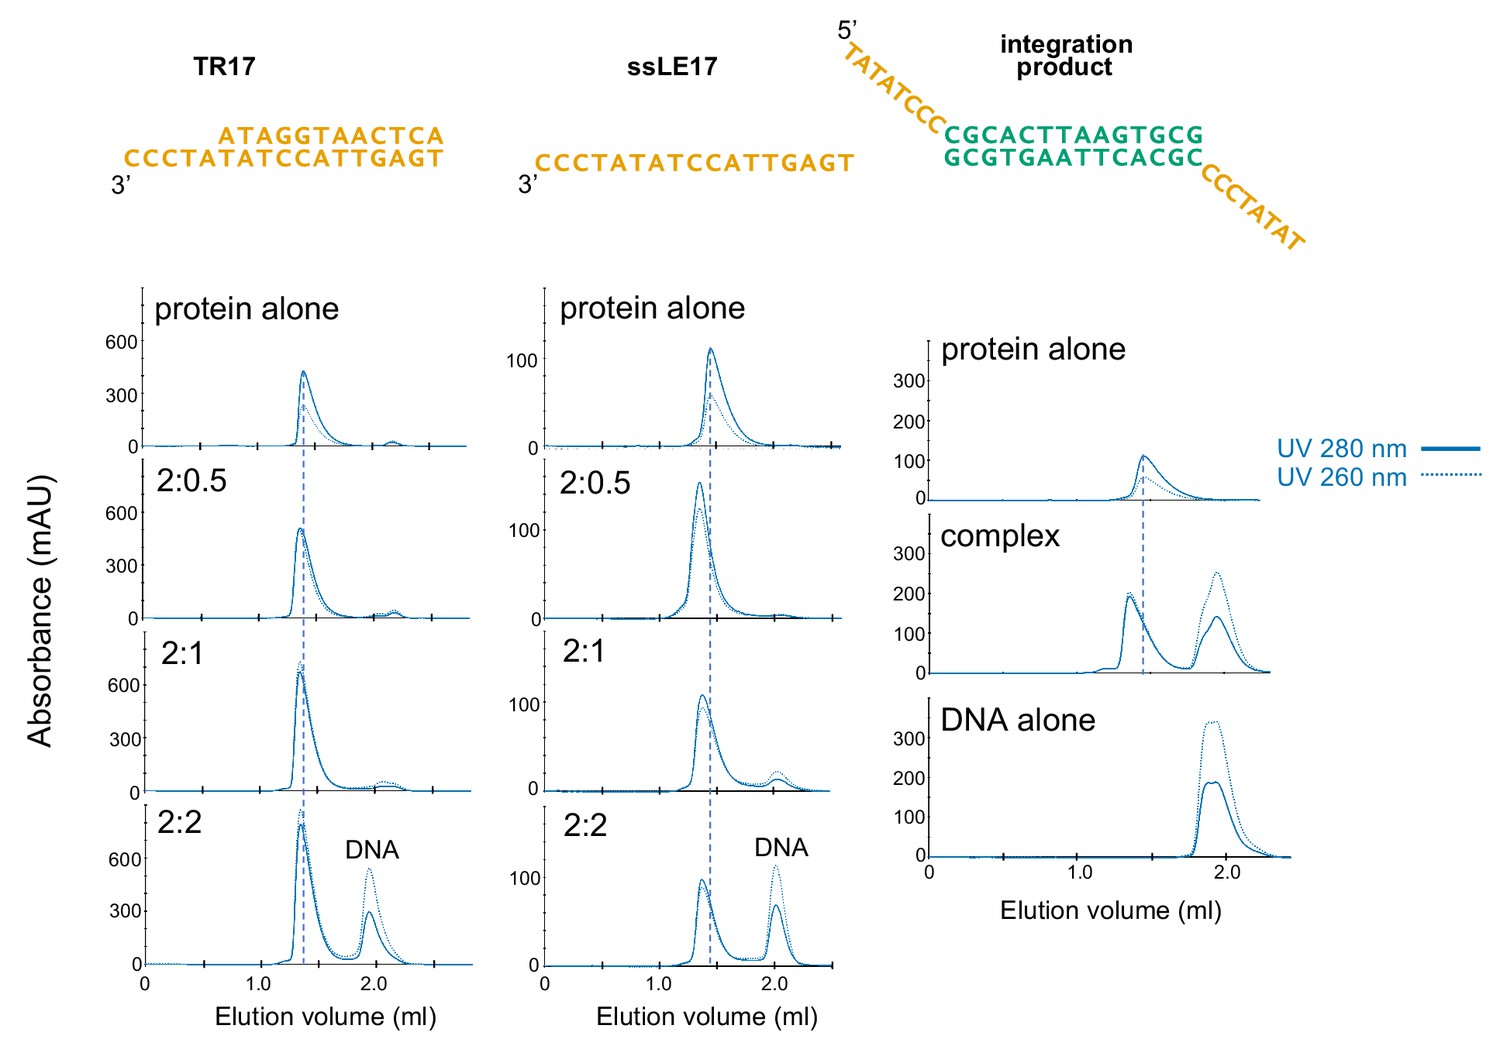
Characterization of casposase-DNA complexes by size-exclusion chromatography (SEC) analysis.
Samples were mixed at the indicated casposase:DNA ratios and dialyzed into binding buffer prior to injection onto an analytical Superdex 200 Increase 3.2/300 column. Experiments were performed at least three times, and sample chromatograms are shown.
Figure 4—figure supplement 2
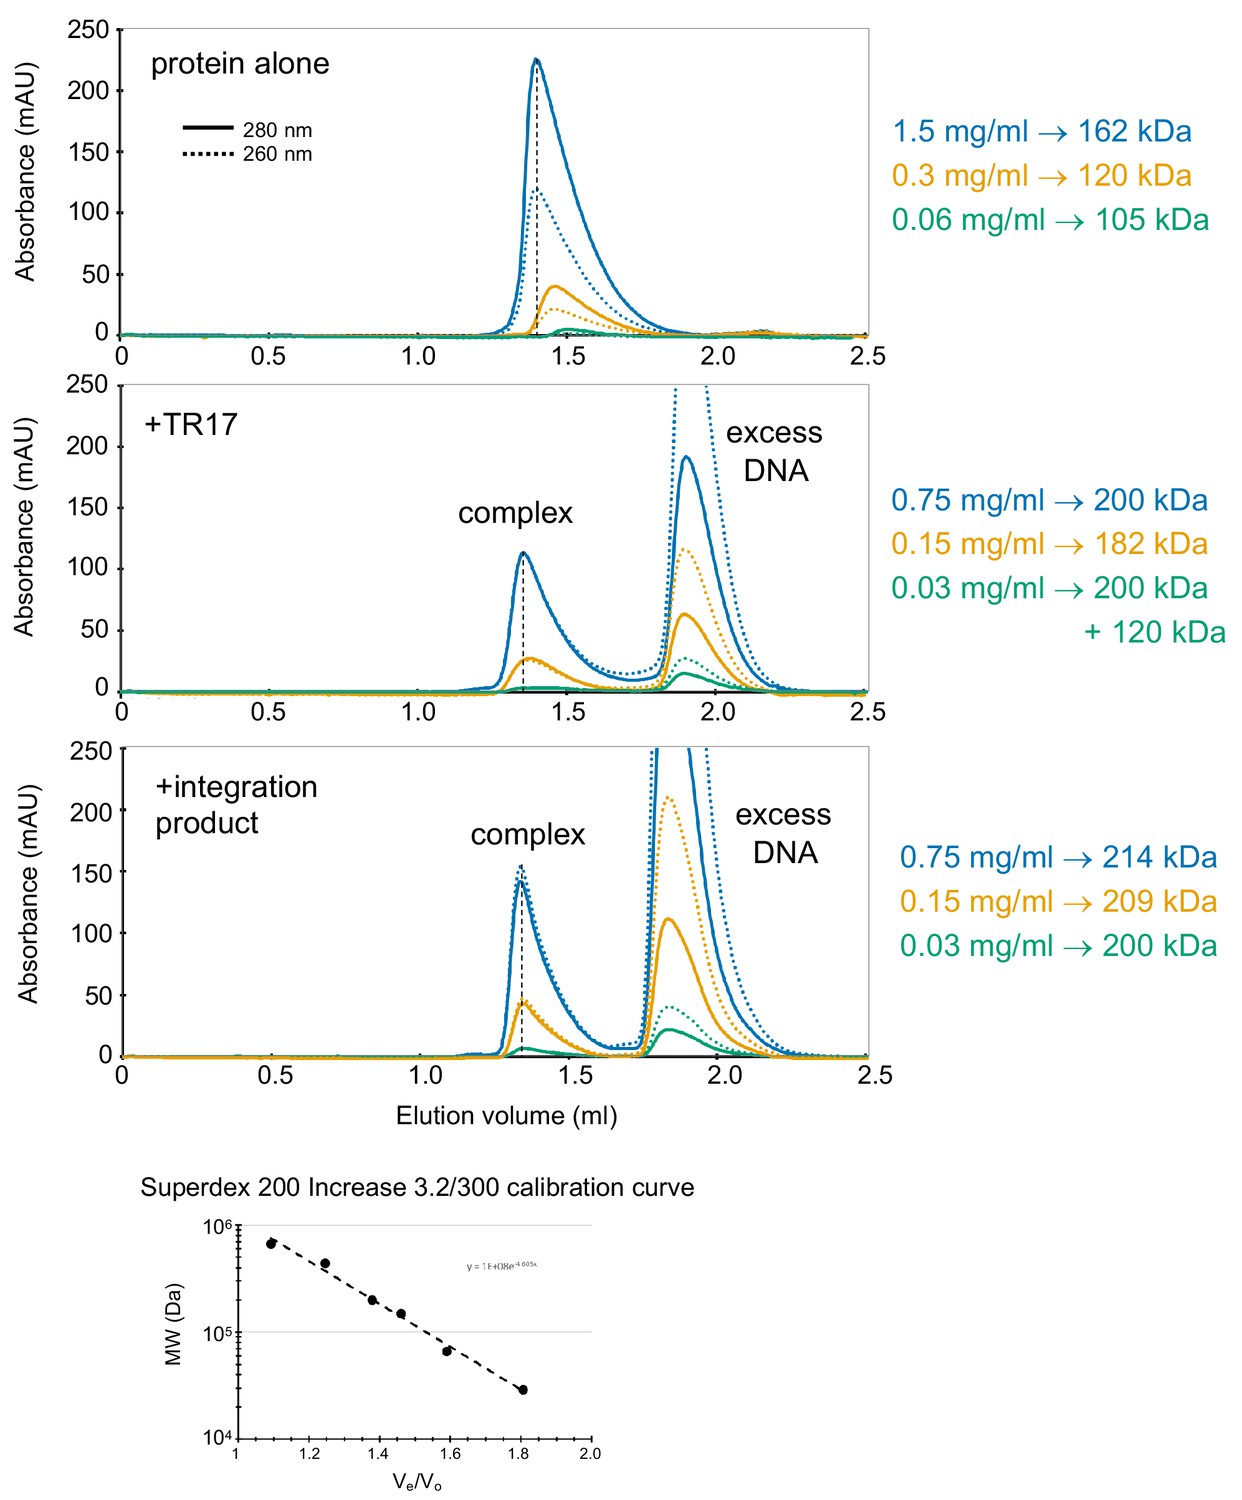
Characterization of casposase-DNA complexes by size exclusion chromatography (SEC) on a Superdex 200 Increase 3.2/300 column as a function of protein concentration.
Each experiment was performed twice and, in all cases, the elution positions were reproducible within 0.01 ml. The protein concentration used are indicated on the right, and the MWs corresponding to the peaks were determined from the standard curve shown at the bottom.
Figure 5 with 4 supplements
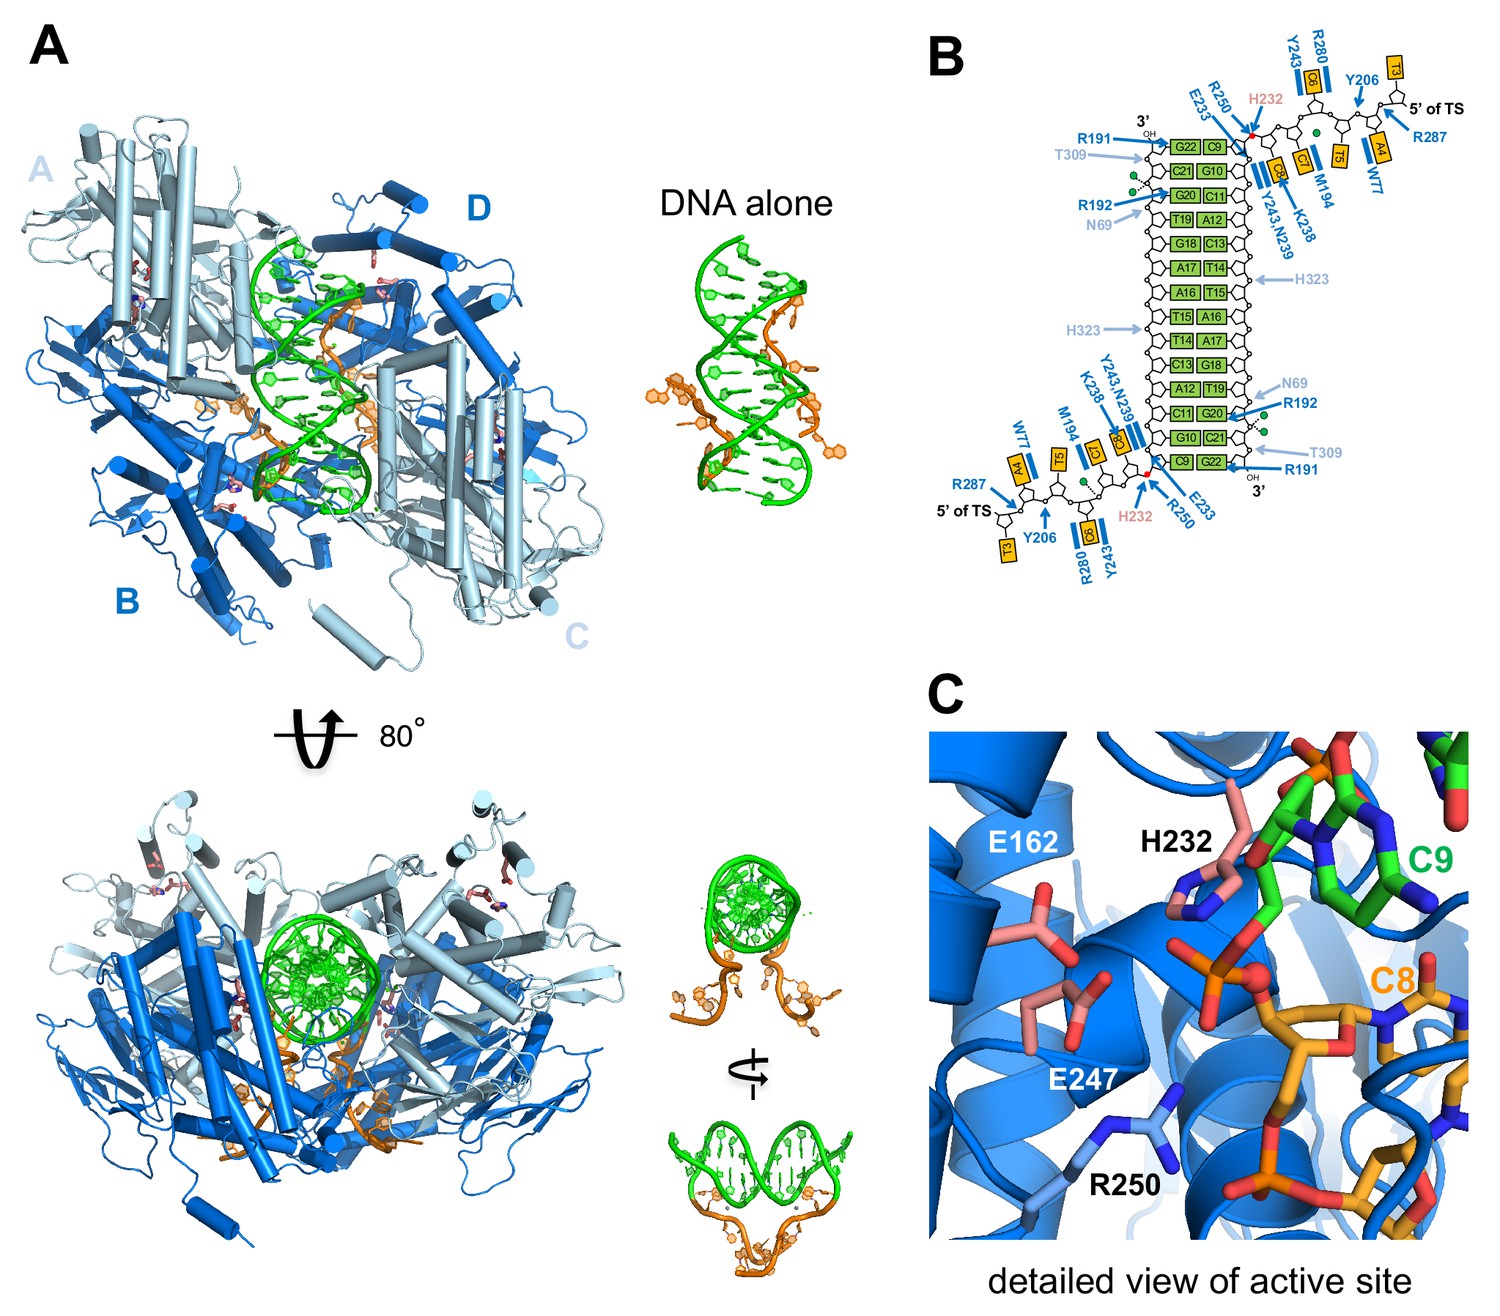
Structure of M. mazei casposase bound to an integration product mimic.
(A) Two single-stranded casposon ends (5'-TATATCCC; shown in orange) are integrated into a 14 bp dsDNA target (5'-CGCACTTAAGCGTG; shown in green). This color code is maintained throughout. In the tetramer, catalytic subunits (B and D) are in dark blue and noncatalytic subunits in light blue (A and C). Views of the DNA alone are shown to the right of each view in the same orientation. Active site residues are shown as sticks (pink). (B) Schematic showing hydrogen bond contacts between protein and DNA using the same color code as (A). Red circles marks the phosphates at which integration occurred. Green circles correspond to bound calcium ions. (C) Detailed view of the active site.
Figure 5—figure supplement 1

Representative electron densities.
(A) Experimental electron density after multi-domain non-crystallographic averaging at 3.2 Å resolution. (B) 2mFo-DFc electron density after the final Buster refinement at 3.1 Å resolution. (C) Composite simulated annealed omit map based on the final Buster-refined coordinates at 3.1 Å resolution. In all panels, electron density was contoured at the 1 sigma level and the final Buster-refined structure was overlaid. The orange sphere corresponds to a bound Ca 2+ ion from the crystallization buffer.
Figure 5—figure supplement 2
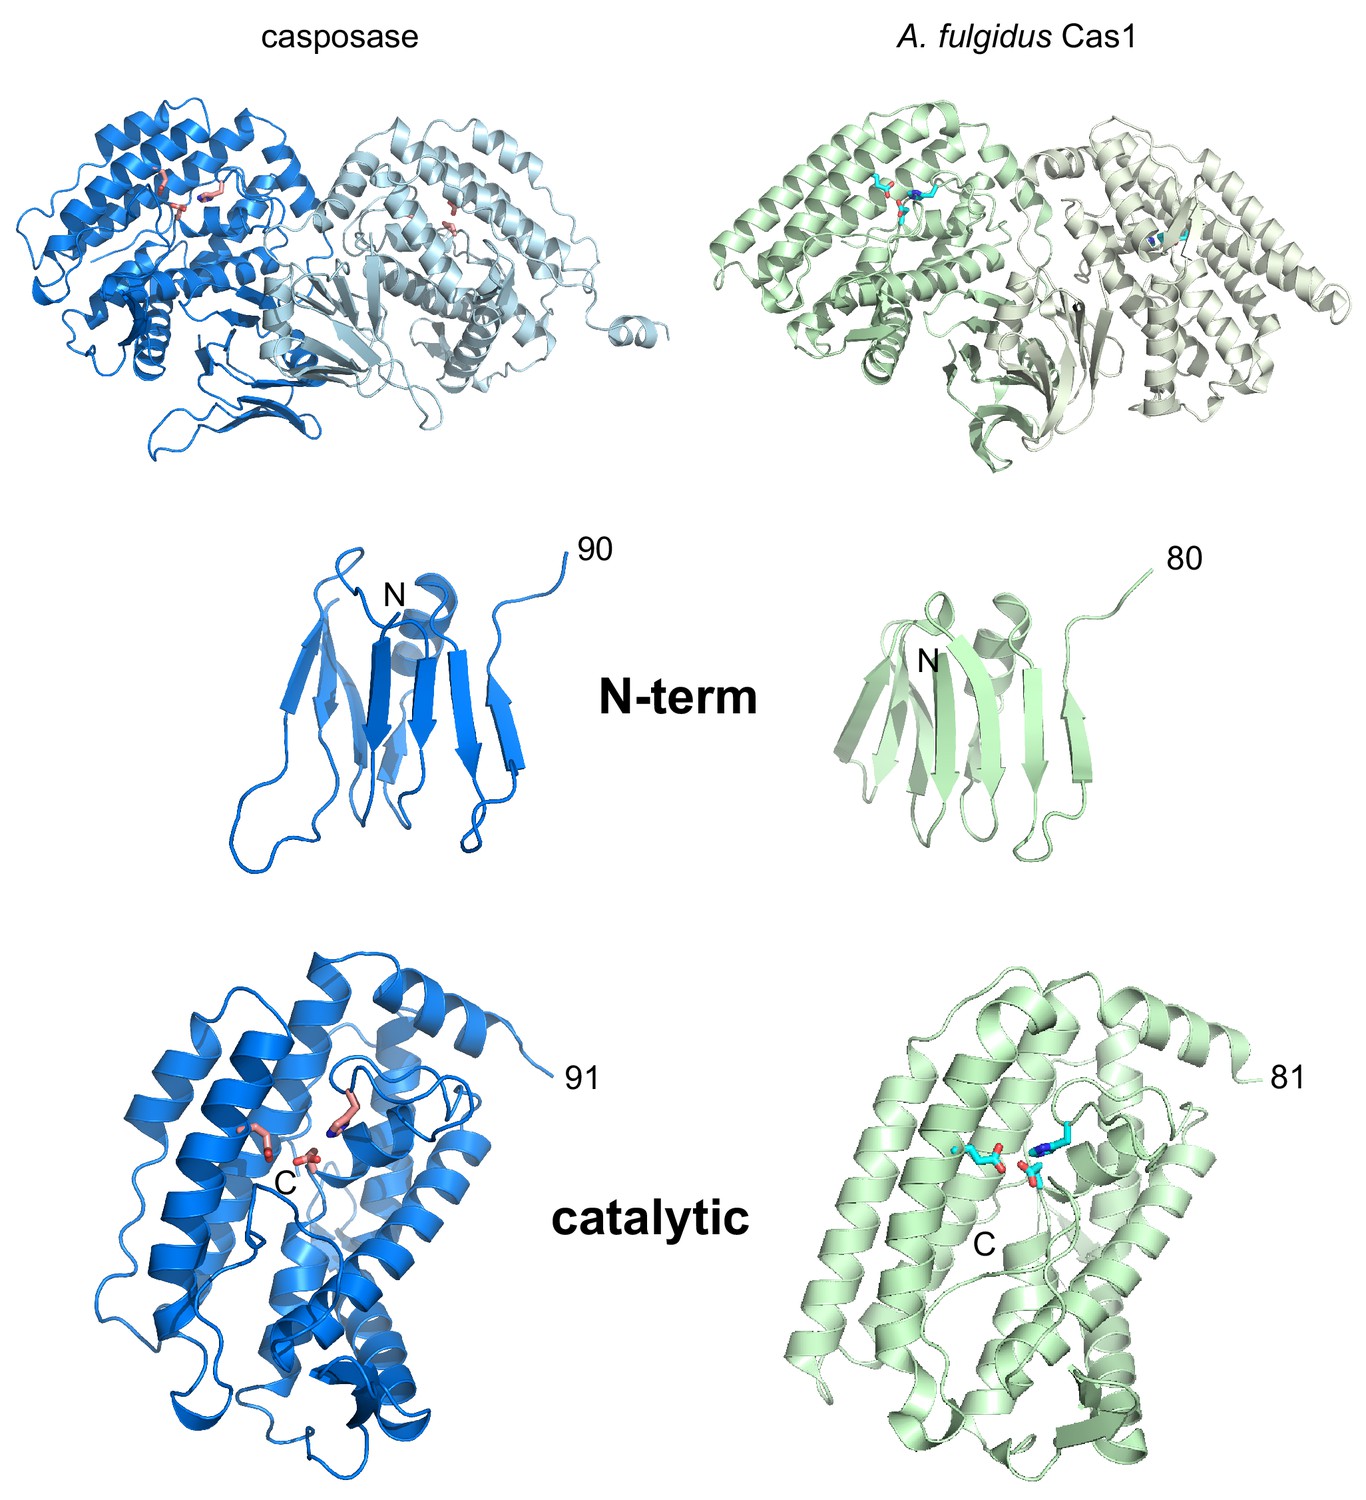
Side-by-side views of the aligned structures of the casposase and Cas1 from A. fulgidus (PDB ID 4n06; Kim et al., 2013).
Alignment is based on the catalytic monomer of the casposase. Residue numbers are indicated. Active site residues are shown as sticks.
Figure 5—figure supplement 3
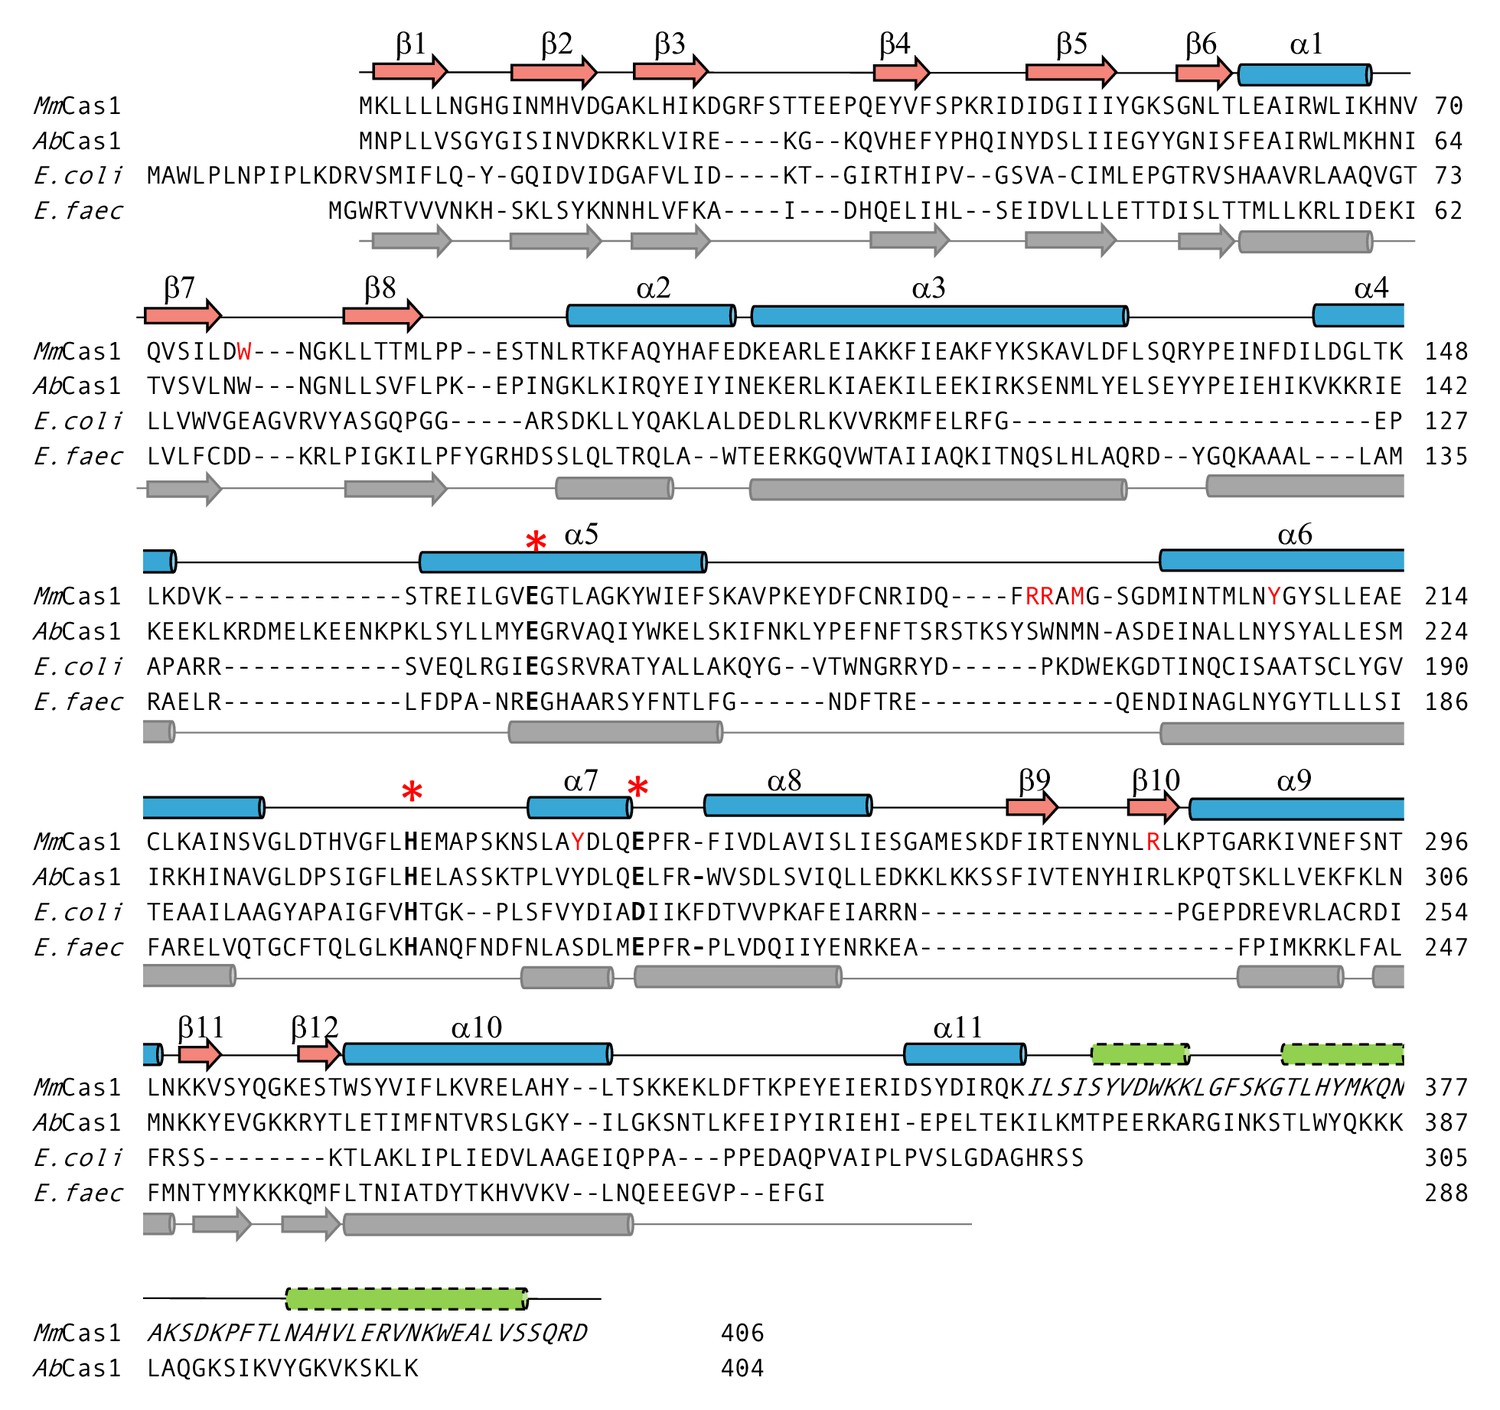
Structure-based alignment of M. mazei casposase to E. coli (5vvk) and E. faecalis Cas1 (5xvp).
The secondary structure elements on the top are for the casposase; those on the bottom correspond to those of E. faecalis (Xiao et al., 2017). Active site residues are marked with *. Residues mutated in this work are shown in red. Italics indicate the region of the casposase that cannot be assigned to the electron density. Green cylinders indicate predicted α-helices at the casposase C-terminus.
Figure 5—figure supplement 4
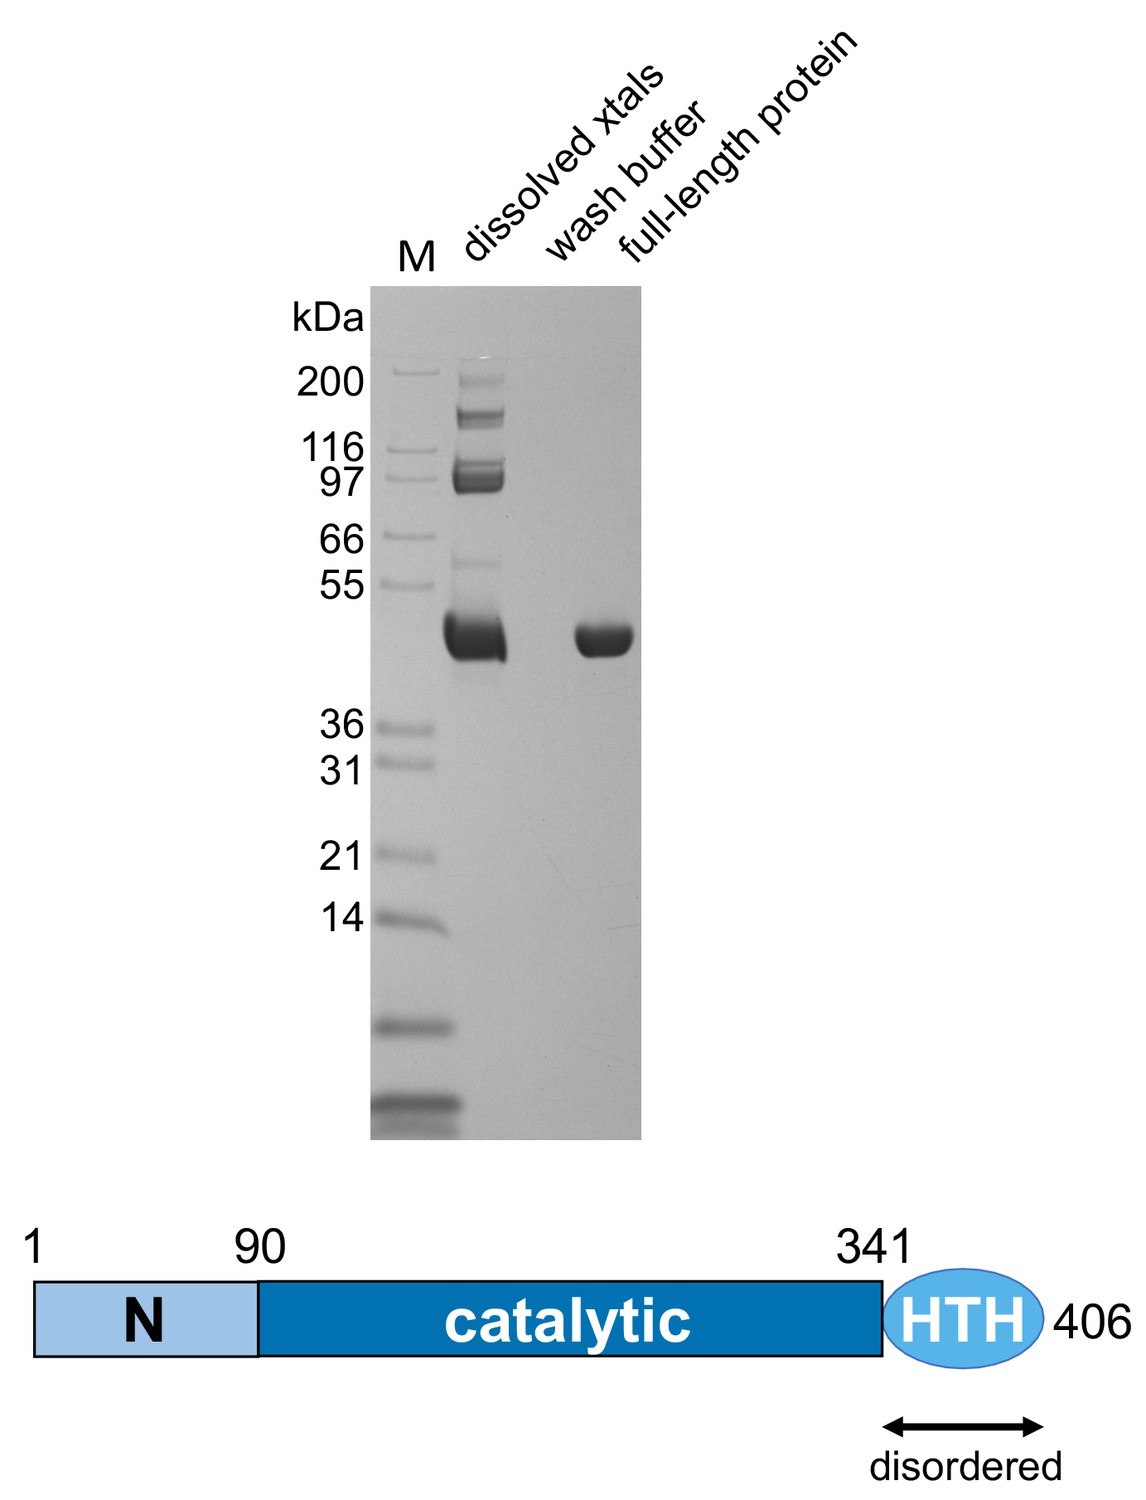
SDS-PAGE analysis of dissolved crystals showing that the casposase was not proteolytically degraded.
Casposase MW = 49.4 kDa.
Figure 6
Details of the casposase structure.
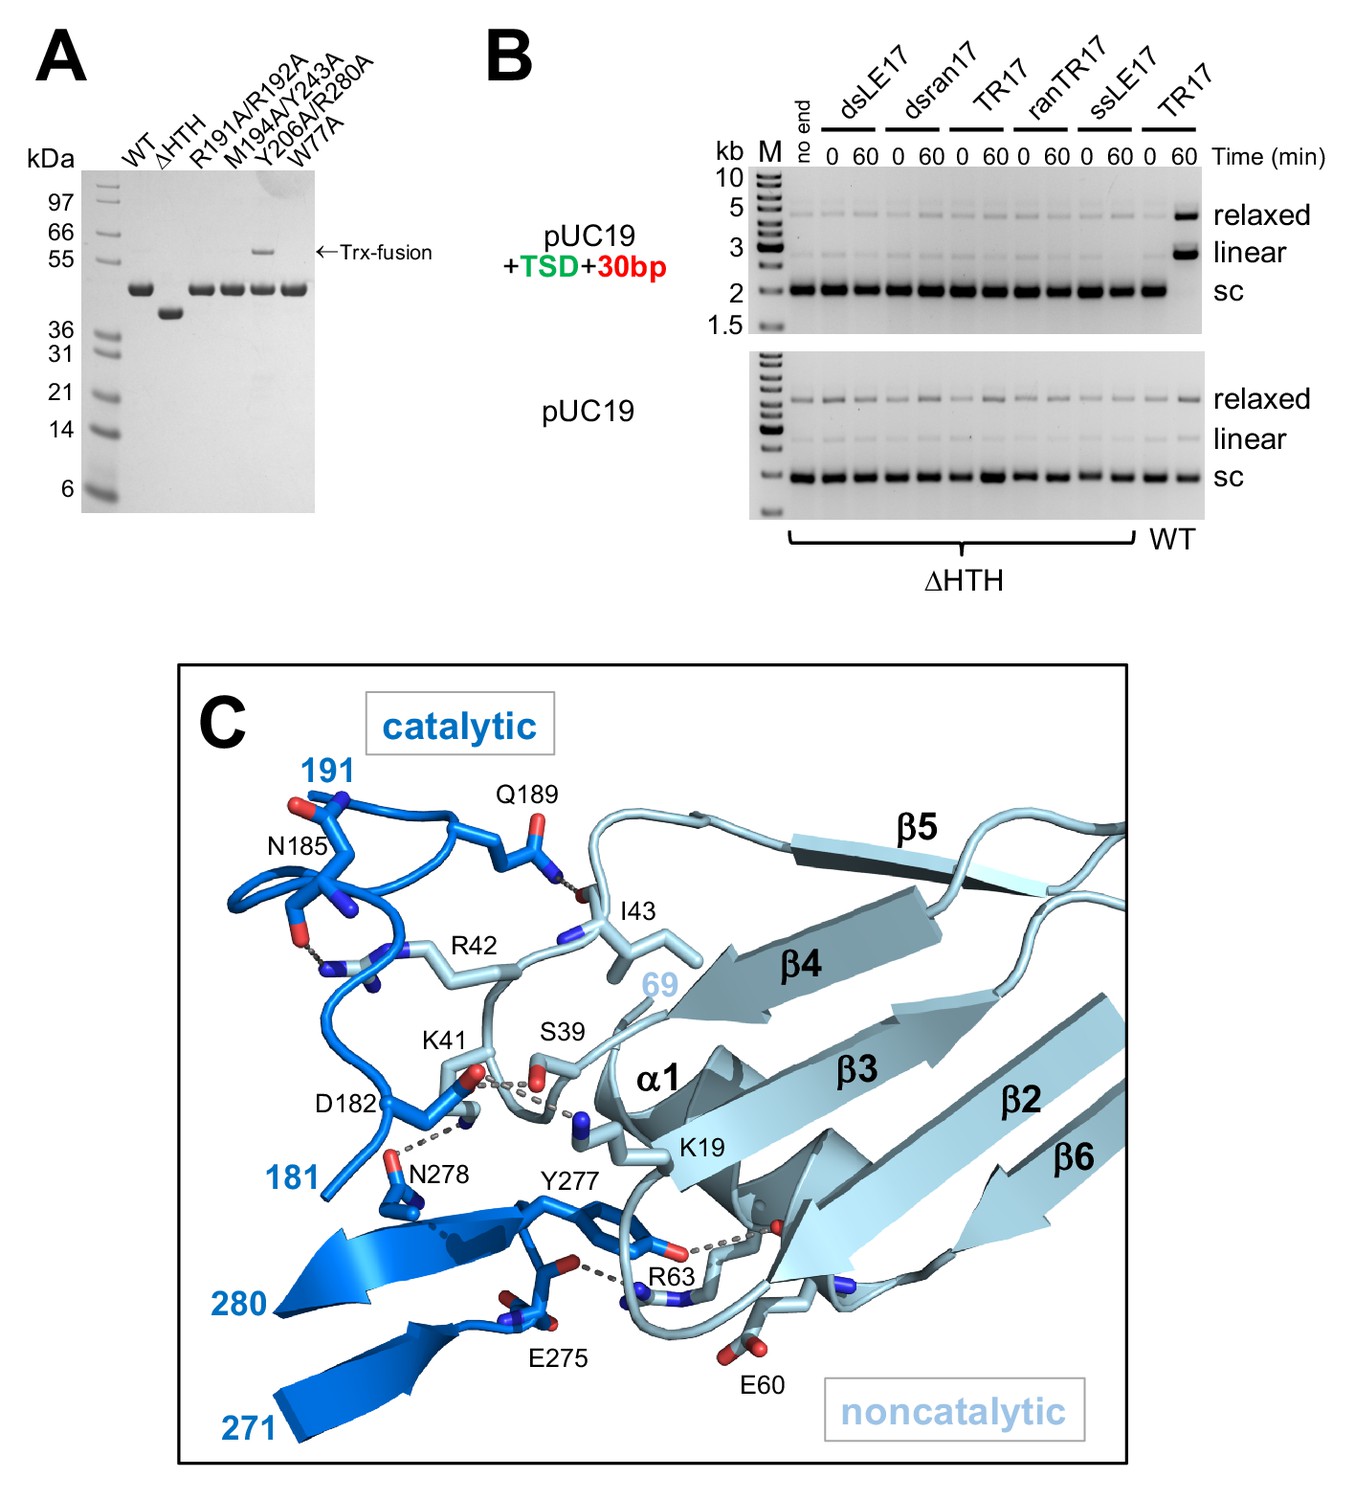
(A) SDS-PAGE analysis of proteins expressed and purified in this work. (B) Integration activity of the C-terminally truncated casposase, ΔHTH. There is no evidence for integration activity with either a target plasmid containing the casposon specific target site (top) or pUC19 alone (bottom). (C) Interactions at the casposase tetramerization interface. Shown are the hydrogen bond contacts between monomers A (noncatalytic) and D (catalytic), which are recapitulated between monomers B and C (not shown).
Figure 7 with 1 supplement
Binding of the casposon target site and casposon ends.
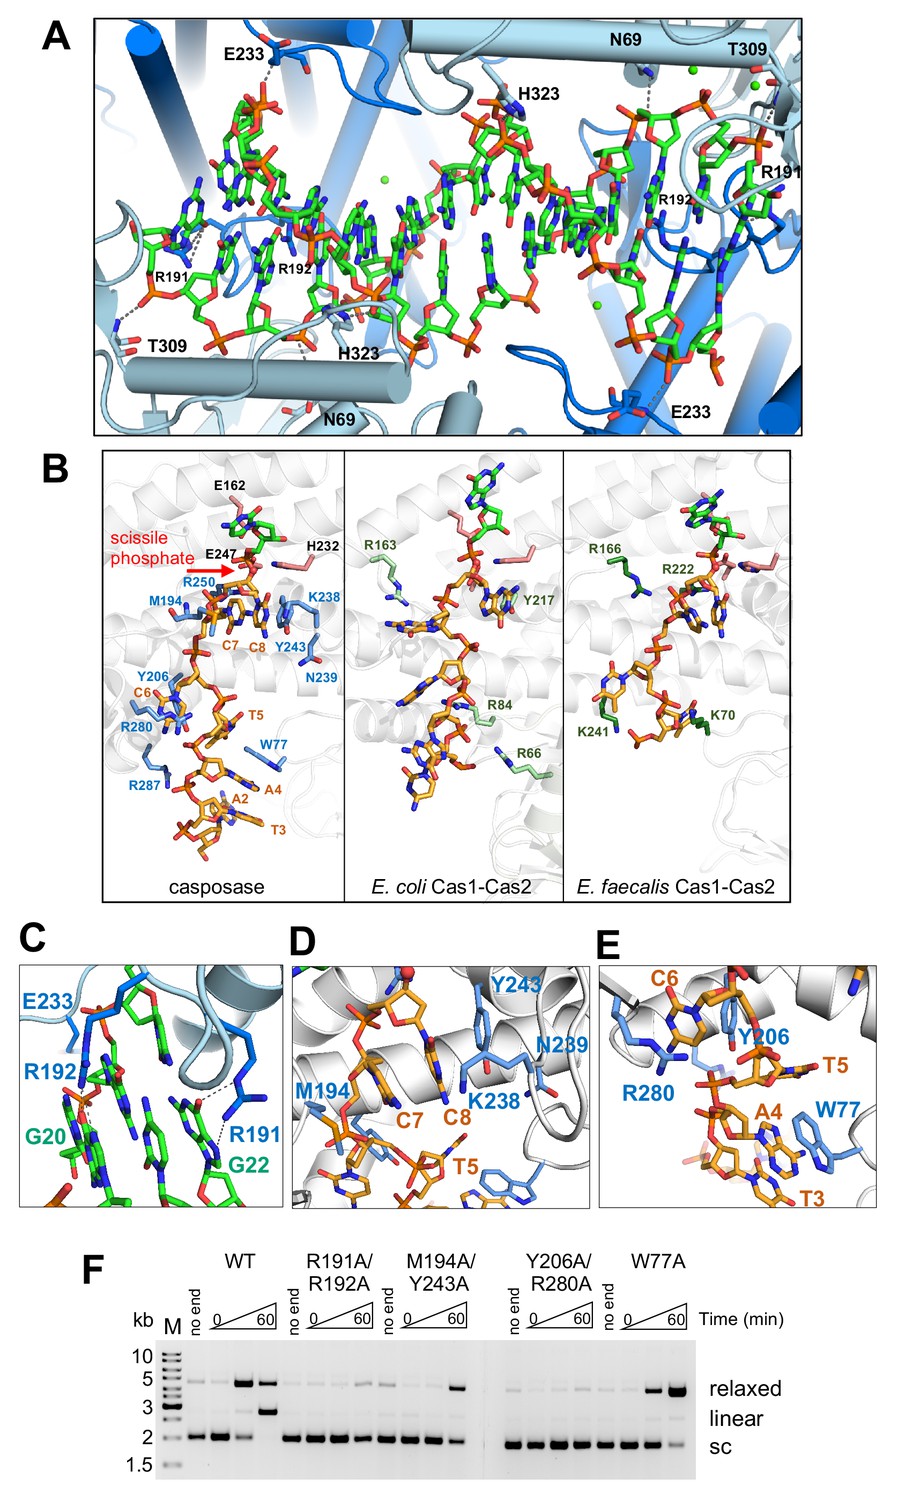
(A) Hydrogen-bond contacts between the casposase and target DNA (casposon ends omitted for clarity). Bound Ca2+ ions are shown in green. (B) Comparison of binding of ssDNA casposon ends (left) and the ssDNA 3'-overhangs of bound spacers in the E. coli type I-E (center; 5vvk) and E. faecalis type II-A (right; 5xvp) integrases. Structures were aligned based on the catalytic monomers. Active site residues are shown in pink, and the red arrow indicates the 3'-OH group where the casposon end is joined to target. (C) Detailed view of the interactions of R191 and R192. (D) Detailed view of the interactions involving C7 and C8. (E) Detailed view of the interactions involving C6. (F) Integration activity of point mutants using pUC19+TSD+30 bp as the target plasmid and TR17 as the casposon end mimic. For each protein, time points are: 0, 1, and 60 min. Comparison of integration activity of purified casposase mutants with varying casposon end oligonucleotides is shown in Figure 7—figure supplement 1.
Figure 7—figure supplement 1
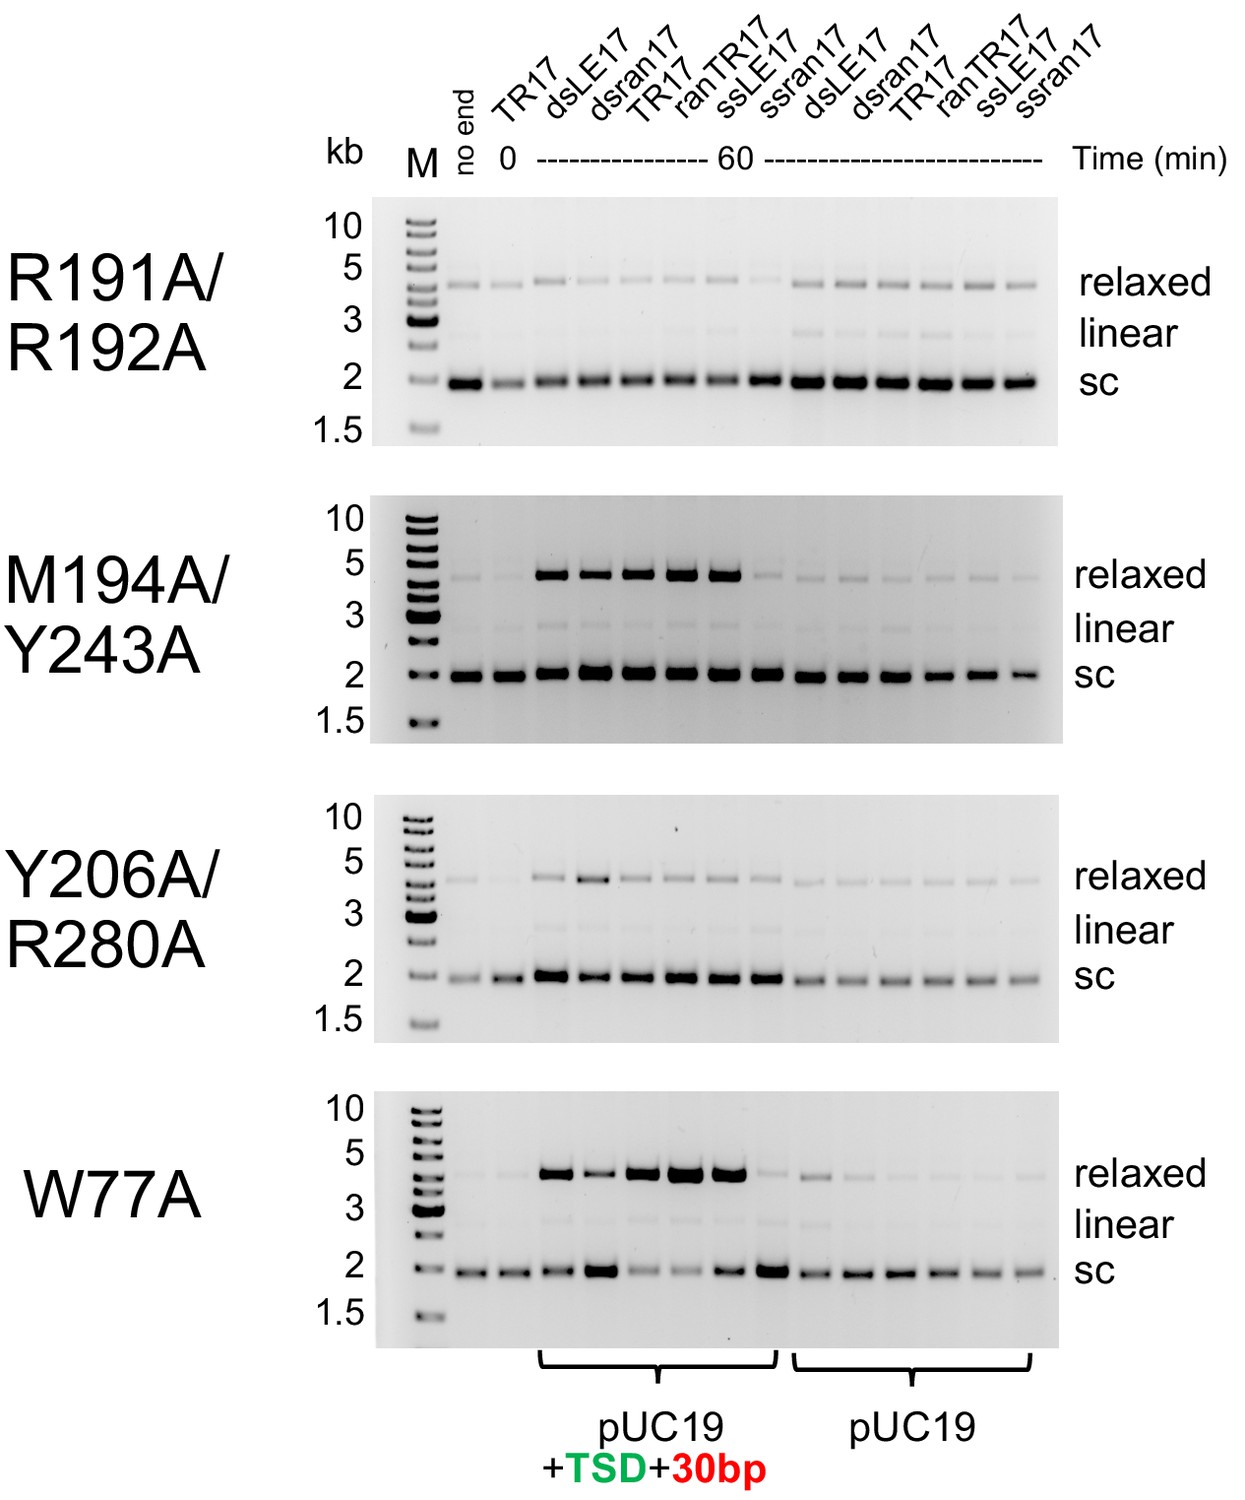
Comparison of integration activity of purified casposase mutants with casposon end oligonucleotides.
For the 'no end' reactions, reactions were for 60 min using pUC19. The TR17/T=0 reactions were also run using pUC19 as the target substrate. Reactions were carried out twice, and representative gels are shown.
Figure 8
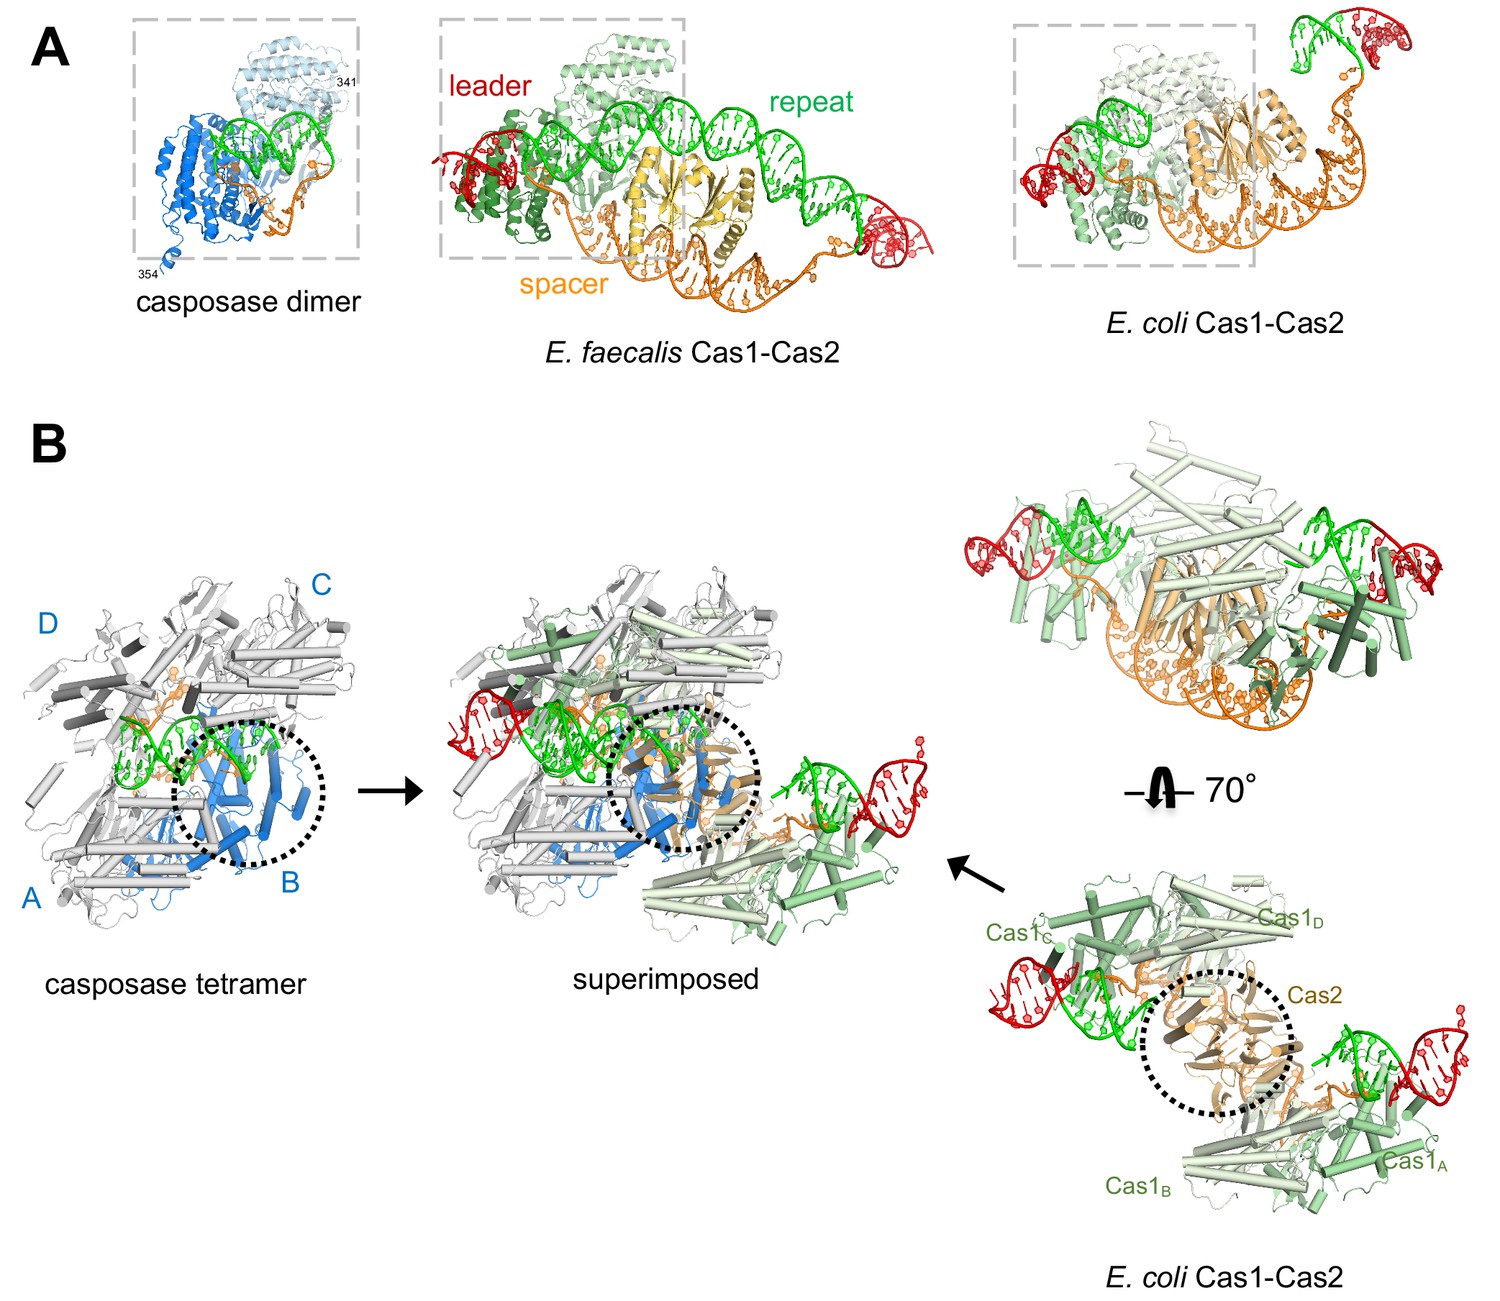
Features of the casposase-DNA complex.
(A) Comparison of a DNA-bound casposon dimer (left) to full-site bound CRISPR Cas1-Cas2 integrases of E. faecalis type II-A CRISPR Cas1-Cas2 (PDB ID 5xvp, center) and E. coli type I-E (PDB ID 5vvk, right). Aligned dimers are boxed in gray. Casposon ends and spacers are shown in orange, target in green, and leader DNA in red. The final visible amino acid in the electron density on each casposase C-terminal end is indicated. (B) Superposition of the structures (center; casposase monomer D aligned to E. coli Cas1c) shows that the location of the casposase monomer B (in blue) overlaps that of Cas2.
Figure 9 with 1 supplement
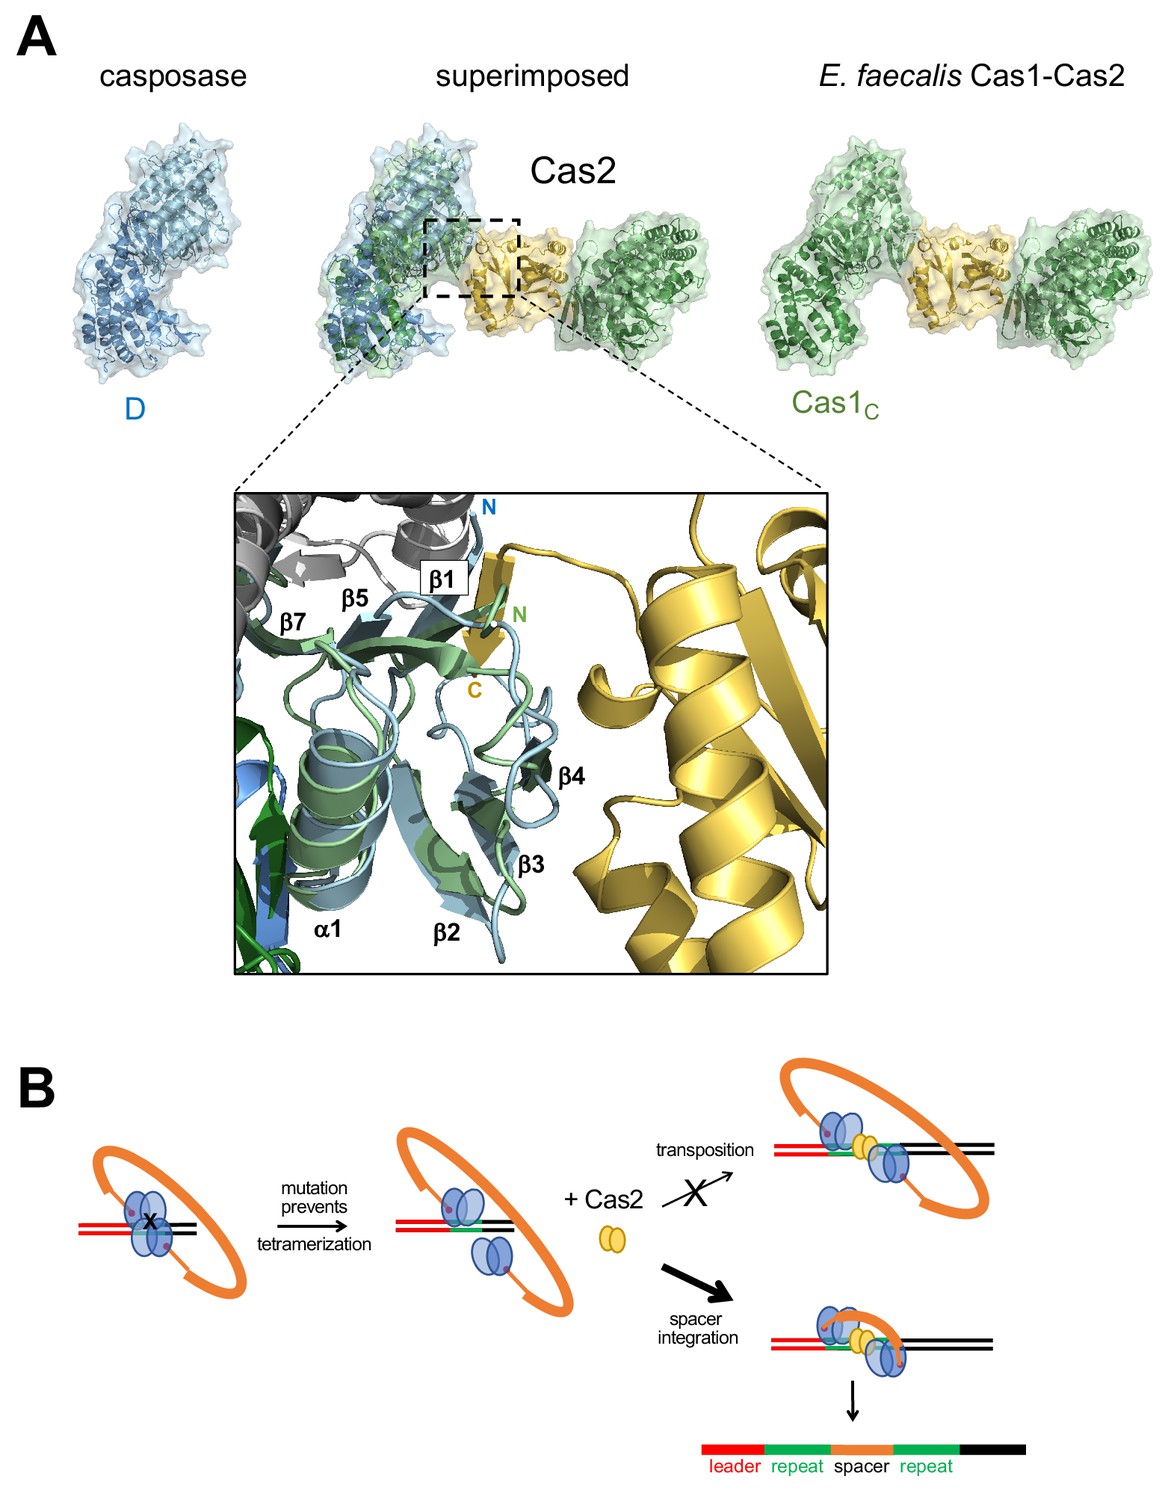
Proposed transformation from transposase to spacer integrase.
(A) Comparison of the surfaces of casposase dimer and Cas1-Cas2 of E. faecalis (5xvp). The structures were aligned based on the catalytic monomers of each. Also shown is a close-up of the interaction between the E. faecalis Cas1 N-terminal domain (green) and Cas2 (gold); the aligned casposon N-terminal domain is overlaid in blue. In the inset, the view is based on the alignment between noncatalytic domains. (B) Proposed evolutionary transformation from casposase to CRISPR-Cas integrase in which Cas2 becomes a preferred binding partner of a casposase dimer, in turn leading to the preferential integration of a spacer over the original casposon. See Figure 9—video 1.
Figure 9—video 1
Possible structural evolution from a casposase tetramer to a Cas1-Cas2 heterohexamer.
Tables
Table 1
X-ray structure determination detail.
| Data set | E1 | E2 | E3 | Refinement |
|---|---|---|---|---|
| Space group | P43212 | P43212 | P43212 | P43212 |
| Wavelength (Å) | 0.97930 | 0.97916 | 0.96802 | 0.97918 |
| Unit cell parameters | ||||
| a = b, c (Å) | 106.91, 424.61 | 106.98, 424.24 | 106.83, 423.30 | 106.99, 423.36 |
| α = β = γ (°) | 90, 90, 90 | 90, 90, 90 | 90, 90, 90 | 90, 90, 90 |
| Resolution range (Å) | 30.0–3.2 | 30.0–3.2 | 30.0–3.2 | 30.0–3.1 |
| No. of unique reflections | 77309 | 77464 | 77076 | 45362a |
| Redundancy | 7.08 | 7.13 | 7.19 | 14.52 |
| I/σI (3.29–3.2 Å) | 12.16 (1.28) | 12.45 (1.54) | 12.26 (1.93) | 13.3 (1.95) |
| BWilson (Å2) | 100.7 | 93.88 | 90.13 | 104.36 |
| Completeness (%) | 99.8 | 99.8 | 99.8 | 99.8 |
| Rmerge (%)b | 18.2 | 18.0 | 14.7 | 11.4 |
| CC1/2 (last resolution shell) | 49.2 | 60.8 | 77.0 | 81.9 |
| Phasing power (iso/ano) | 0.0/1.045 | 0.214/0.995 | 0.877/0.812 | |
| Figure of merit at 3.2 Å | 0.38 | |||
| Structure Refinement | ||||
| Resolution (Å) | 3.1 | |||
| Rwork/Rfree c | 0.198/0.256 | |||
| RMSD | ||||
| Bond lengths (Å) | 0.01 | |||
| Bond angles (°) | 1.17 | |||
| Average B factor (Å2) | 142.33 | |||
| No. atoms | ||||
| Protein | 11442 | |||
| DNA | 846 | |||
| Ligands (Ca2+) | 6 | |||
| Waters | 36 | |||
| No. of reflections | 45362 | |||
| Ramachandran plot (%) | ||||
| Favored | 86.6 | |||
| Allowed | 13.1 | |||
| Outliers | 0.2 | |||
-
Numbers in parentheses represent the value for the highest-resolution shell. RMSD, root-mean-square deviation.
a Friedel's law true.
-
b Rmerge = Σ|Ii − <I>|/ΣIi, where Ii is the intensity of measured reflection and <I> is the mean intensity of all symmetry-related reflections.
c Rfree = ΣT||Fcalc| – |Fobs||/ΣFobs, where T is a test dataset of about 5% of the total unique reflections randomly chosen and set aside prior to refinement.
Key resources table
| Reagent type (species) or resource | Designation | Source or reference | Identifiers | Additional information |
|---|---|---|---|---|
| Gene (Methanosarsina mazei) | casposase | WP_011035139.1 | ||
| Strain (E. coli) | Top10 | Invitrogen/ThermoFisher | C404003 | |
| Strain (E. coli) | B834(DE3) | MilliporeSigma | 69041–3 | |
| Commercial kit | Selenomethionine Medium Complete | Molecular Dimensions | MD12-500 | |
| Recombinant DNA reagent | pUC19 | Invitrogen | P/N 54357 | |
| Chemical compound, drug | PEG 8000 | Hampton Research | HR2-535 | |
| Chemical compound, drug | CHES, pH 9.0 | Hampton Research | HR2-256-05 | |
| Commercial kit | Nextera XT DNA sample prep | Illumina | #FC1311024 | |
| Software, algorithm | Rsubread package | http://bioconductor.org/packages/Rsubread | V1.34.7 | DOI: 10.18129/B9.bioc.Rsubread |
| Software, algorithm | Gviz package | https://bioconductor.org/packages/Gviz/ | V1.26.5 | |
| Software, algorithm | ggseqlogo | https://www.rdocumentation.org/packages/ ggseqlogo/versions/0.1 | V0.1 | |
| Software, algorithm | Biostrings | https://bioconductor.org/packages/release/bioc/html/Biostrings.html | V2.50.2, RRID:SCR_016949 | |
| Software, algorithm | Rsamtools | V1.34.1 | ||
| Software, algorithm | ShortRead | V1.40.0 | ||
| Software, algorithm | GenomicAlignments | V1.18.1 | ||
| Software, algorithm | Jalview | www.jalview.org | V1.0, RRID:SCR_006459 | |
| Software, algorithm | XDS | xds.mpimf-heidelberg.mpg.de | RRID:SCR_015652 | |
| Software, algorithm | XPREP | https://www.bruker.com | Bruker | |
| Software, algorithm | SHELXD | http://shelx.uni-ac.gwdg.de/ | Usón and Sheldrick, 1999; RRID:SCR_014220 | |
| Software, algorithm | SHARP | https://www.globalphasing.com > sharp | Bricogne et al., 2003 | |
| Software, algorithm | CCP4 | https://www.ccp4.ac.uk | Winn et al., 2011; RRID:SCR_007255 | |
| Software, algorithm | DM | https://www.ccp4.ac.uk | Cowtan, 1994; RRID:SCR_007255 | |
| Software, algorithm | O | http://xray.bmc.uu.se/alwyn/TAJ/Home.html | Jones and Kjeldgaard, 1997 | |
| Software, algorithm | CNS1.3 | http://cns-online.org/v1.3/ | Brunger, 2007 | |
| Software, algorithm | BUSTER 2.10.3 | https://www.globalphasing.com > buster | Bricogne et al., 2017 RRID:SCR_015653 | |
| Software, algorithm | Phenix 1.10 | www.phenix-online.org | Adams et al., 2010 RRID:SCR_014224 | |
| Software, algorithm | PyMOL v1.7 | https://pymol.org | Schrodinger, Inc | RRID:SCR_000305 |
Additional files
-
Supplementary file 1
DNA oligonucleotides used.
Random oligonucleotide sequences were generated using http://www.faculty.ucr.edu/~mmaduro/random.htm and were rejected only if they included a 3'-C nucleotide. Red indicates change from targ40 sequence.
- https://cdn.elifesciences.org/articles/50004/elife-50004-supp1-v2.docx
-
Transparent reporting form
- https://cdn.elifesciences.org/articles/50004/elife-50004-transrepform-v2.docx
Download links
A two-part list of links to download the article, or parts of the article, in various formats.
Downloads (link to download the article as PDF)
Open citations (links to open the citations from this article in various online reference manager services)
Cite this article (links to download the citations from this article in formats compatible with various reference manager tools)
Casposase structure and the mechanistic link between DNA transposition and spacer acquisition by CRISPR-Cas
eLife 9:e50004.
https://doi.org/10.7554/eLife.50004


