Metabolic stress is a primary pathogenic event in transgenic Caenorhabditis elegans expressing pan-neuronal human amyloid beta
- National University of Singapore, Singapore
- Yale-NUS College, Singapore
- University of Buffalo, United States
- ETH Zurich, Switzerland
- SingHealth Duke-NUS Academic Medical Centre, Singapore
- Duke-NUS Medical School, Singapore
Figures
Figure 1 with 1 supplement
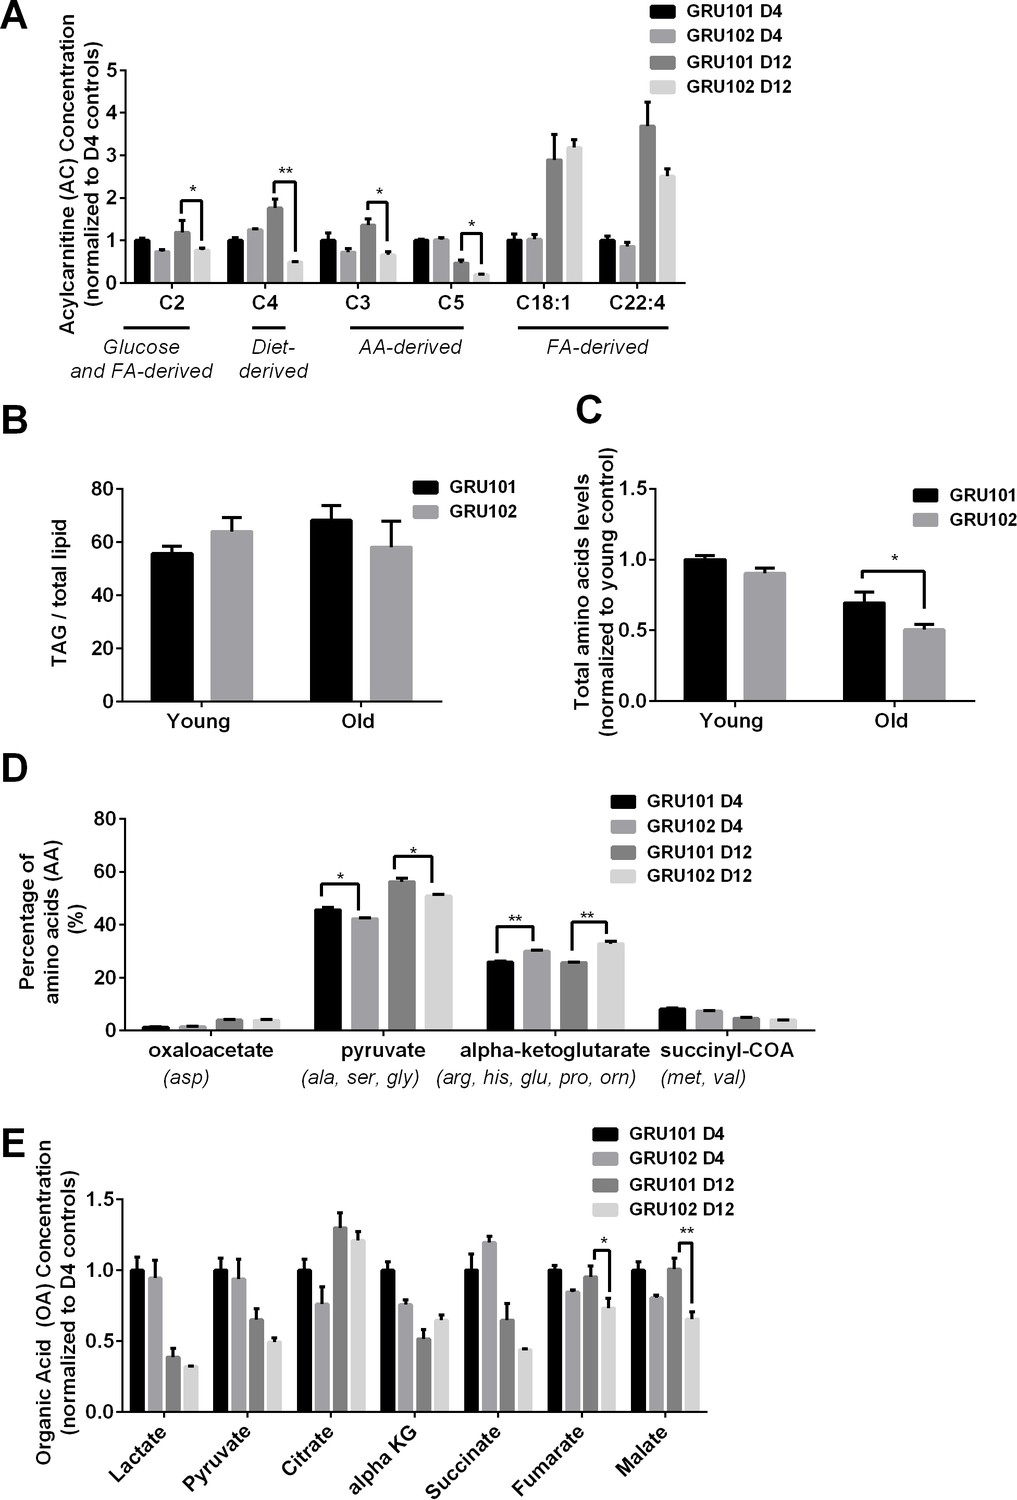
Metabolomics profile of GRU102 and its transgenic controls (GRU101).
(A) Acylcarnitines (AC) profile, (B) Triacylglyceride (TAG), (C) Total Amino acids (AA) level, (D) Percentage glucogenic AA, computed as [sum of AA forming the particular glucogenic substrate/total AA levels]. (E) Organic acids (OA) concentration of GRU101 and GRU102. All values were normalized to respective protein concentration and then to young GRU101 (Two-way ANOVA Dunnett’s multiple comparisons test, p<0.05, *; p<0.005, **; p<0.001, ***; n = 3 repeats per condition, with approximately 3000 animals per repeat collected from independent cohort). Similar results have been confirmed in one other independent trial (Figure 1—figure supplement 1).
-
Figure 1—source data 1
Metabolomics data for D4 and D12 GRU101 and GRU102.
All data were normalized to D4 GRU101.
- https://doi.org/10.7554/eLife.50069.004
Figure 1—figure supplement 1
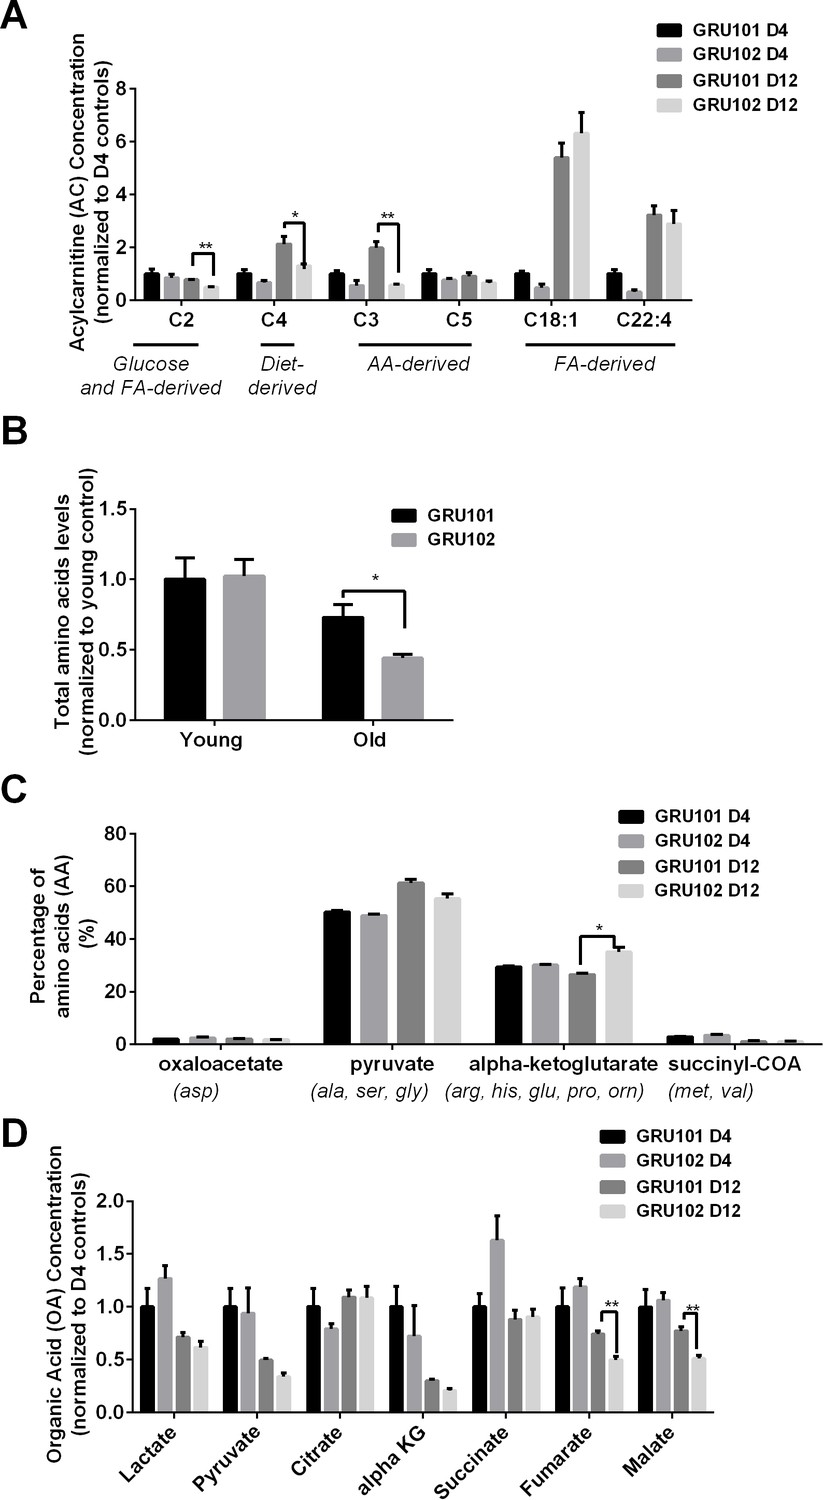
Metabolomics profile of GRU102 and its transgenic controls (GRU101) (independent repeat).
(A) Acylcarnitines (AC) profile, (B) Total Amino acids (AA) level, (C) Percentage glucogenic AA, computed as [sum of AA forming the particular glucogenic substrate/total AA levels] (D) Organic acids (OA) concentration of GRU101 and GRU102. All values were normalized to respective protein concentration and then to young GRU101 (Two-way ANOVA Dunnett’s multiple comparisons test, p<0.05, *; p<0.005, **; p<0.001, ***; n = 3 repeats per condition, with approximately 3000 animals per repeat collected from independent cohort).
Figure 2
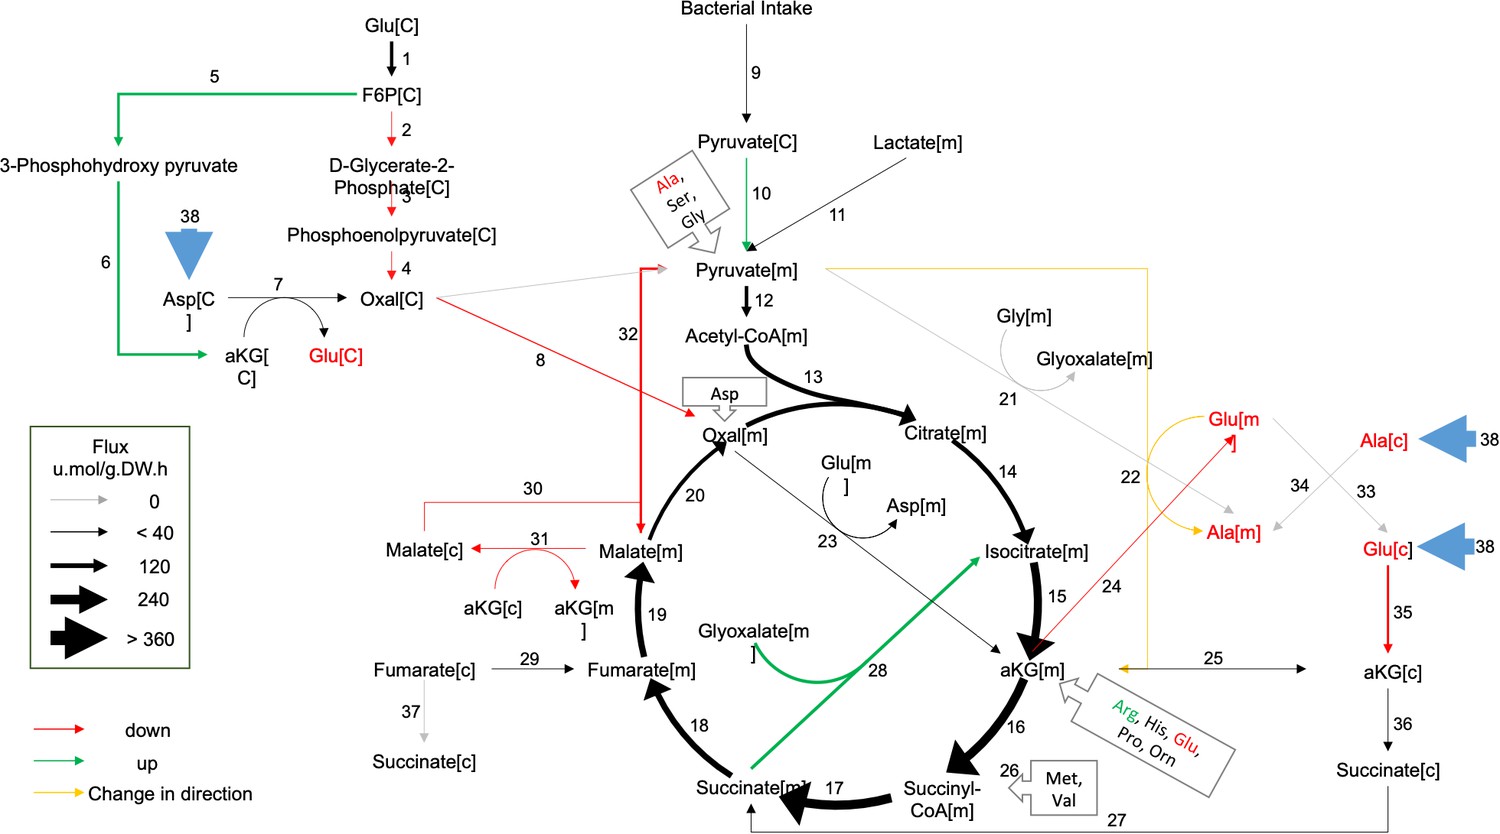
Metabolic flux in day 4 GRU102 modeled by metabolic flux balance analysis.
Changes in flux are shown relative to GRU101 controls. Refer to Source data file for raw flux values.
-
Figure 2—source data 1
Raw flux values derived from flux balance analysis.
- https://doi.org/10.7554/eLife.50069.006
Figure 3 with 2 supplements

aKGDH knockdown recapitulated metabolic detriments of GRU102.
(A) Diagram illustrating changes in key enzymes and metabolites involved in the TCA cycle. (B) alpha-KG dehydrogenase activity in GRU102 and GRU101 controls (Two-way ANOVA Dunnett’s multiple comparisons test, p<0.05, *; n = 4–8 repeats per condition, with approximately 1500 animals collected from independent cohorts). (C) Oxygen consumption rate (OCR) profiles comparing GRU101 and GRU102 fed with aKGDH RNAi or EV (n = 6 repeats per group, with 10 animals per repeat). (D) Scatter plot illustrating high degree of correlation in OCR timecourse of GRU102 and GRU101 fed with aKGDH RNAi. OCR values were normalized to average uncoupled values of GRU101 (n = 6 measurements for each condition). (E) Time taken to reach fully uncoupled respiration (state 3 u) after addition of chemical uncoupler, defined as OCR rising to a value of two standard deviation (SD) above average coupled/basal OCR (n = 6 repeats per group, with 10 animals per repeat, One-way ANOVA Sidak’s multiple comparison, p<0.05, *).
-
Figure 3—source data 1
Raw data for enzymatic activity assays.
- https://doi.org/10.7554/eLife.50069.010
-
Figure 3—source data 2
Raw data for Seahorse oxygen consumption rate profile for aKGDH knockdown animals.
- https://doi.org/10.7554/eLife.50069.011
Figure 3—figure supplement 1
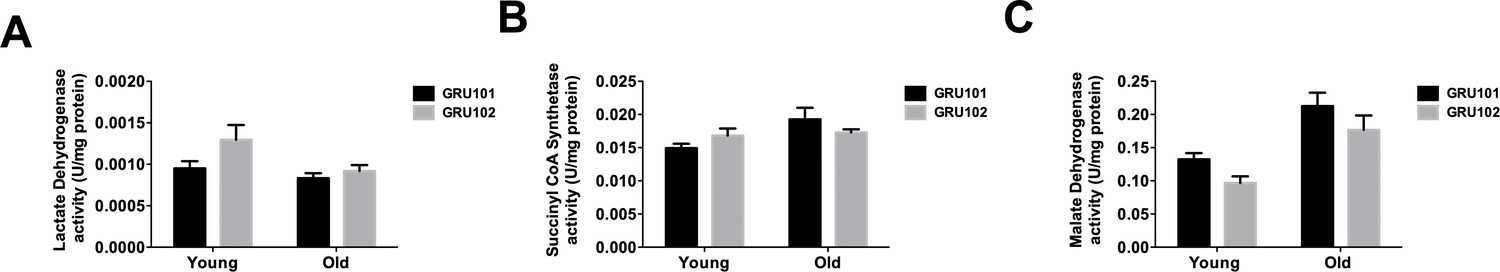
TCA cycle enzyme activities.
(A) Lactate dehydrogenase, (B) Succinyl CoA Synthetase and (C) Malate dehydrogenase activity in GRU102 and WT (n = 6 repeats per condition, with approximately 1500 animals collected from independent cohort).
Figure 3—figure supplement 2
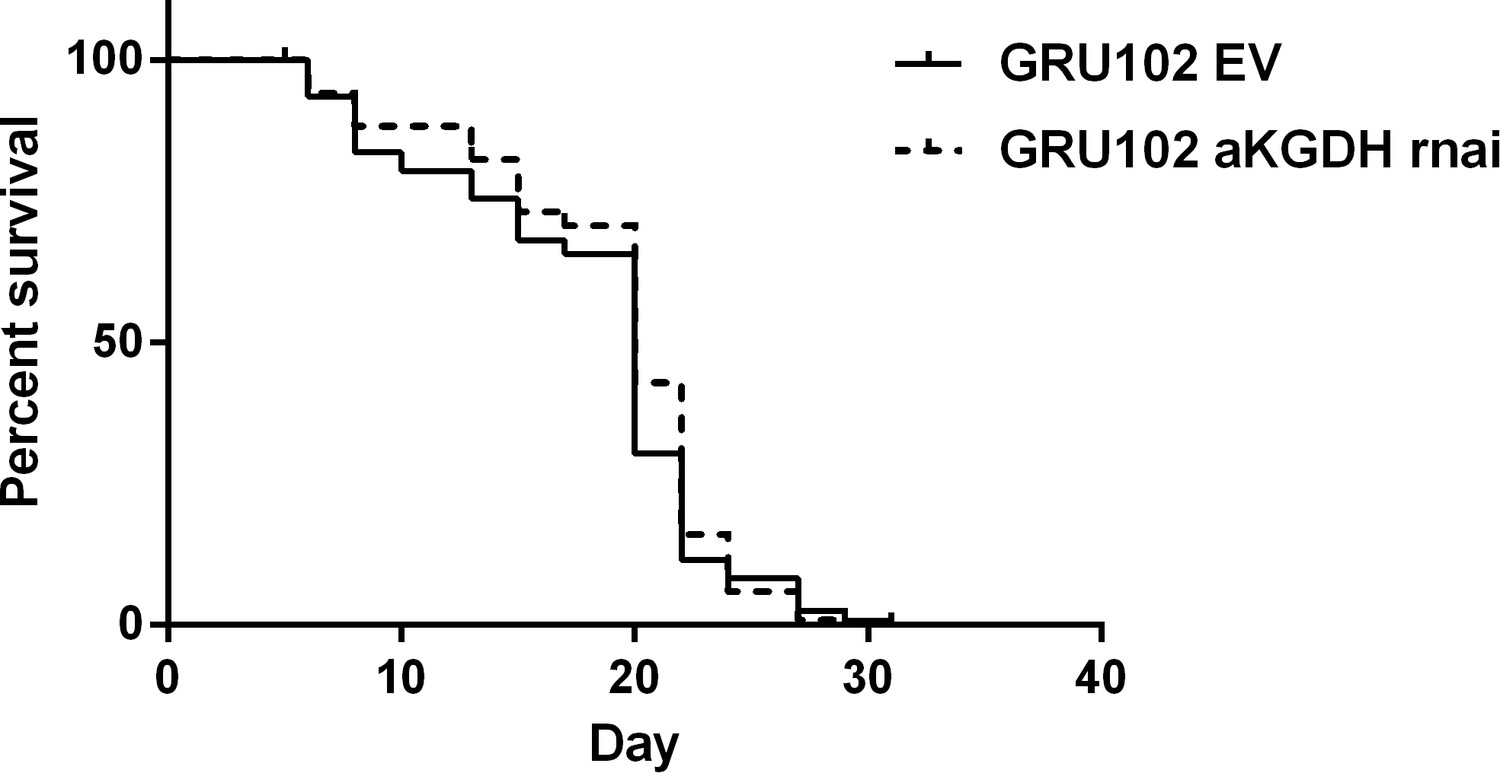
Survival curve of GRU102 fed with empty vector (EV) or aKGDH RNAi.
No significant differences were seen between the survival curves of the two conditions (n = 120 animals for each group).
Figure 4 with 1 supplement
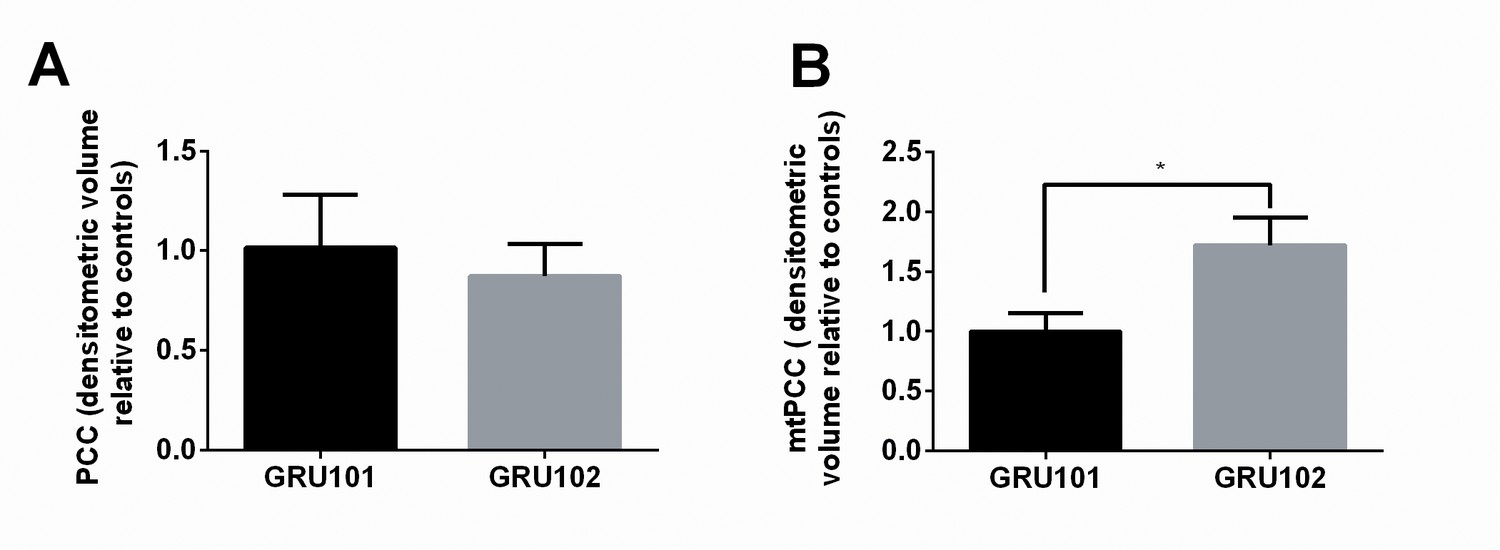
Evidence for ROS-related oxidative protein damage in GRU102.
(A) Densitometric analysis of protein carbonyl content (PCC) from whole lysate in young GRU101 and GRU102. (B) Densitometric analysis of mitochondrial protein carbonyl content (mtPCC) from whole lysate in young GRU101 and GRU102 (unpaired t-test, p<0.05, *; n = 3–7 repeats per condition, with approximately 1500 animals per repeat collected from independent cohorts).
-
Figure 4—source data 1
Protein carbonyl content (PCC) in D4 GRU101 and GRU102.
All values were normalized to D4 GRU101.
- https://doi.org/10.7554/eLife.50069.014
Figure 4—figure supplement 1
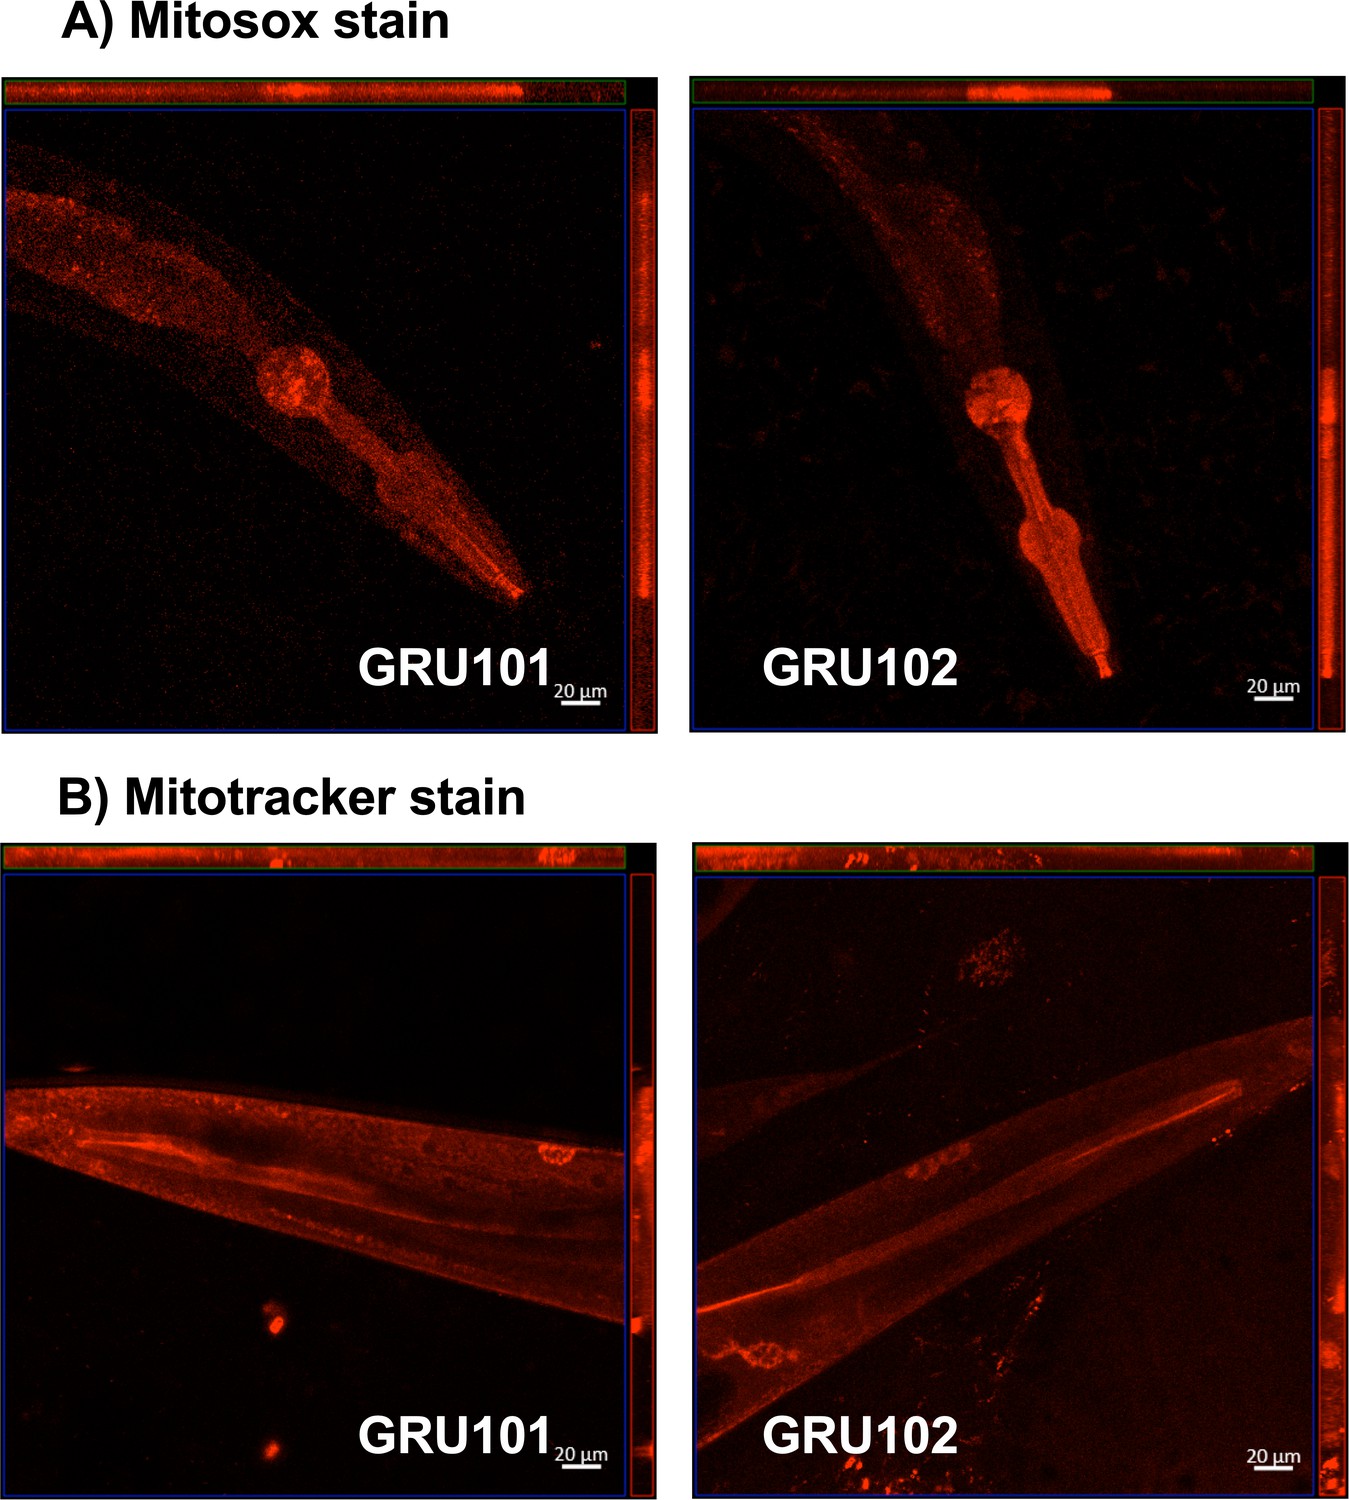
Mitosox and mitotracker staining of GRU101 and GRU102 animals.
(A) Mitosox stain was performed on day-4 animals, when reactive oxygen species (ROS)-mediated protein damage was observed. (B) Mitotracker stain was performed on day-10 animals, when impairment in mitochondrial health (reduction in oxygen consumption capacities measured by Seahorse metabolic flux) was first observed.
Figure 5 with 4 supplements

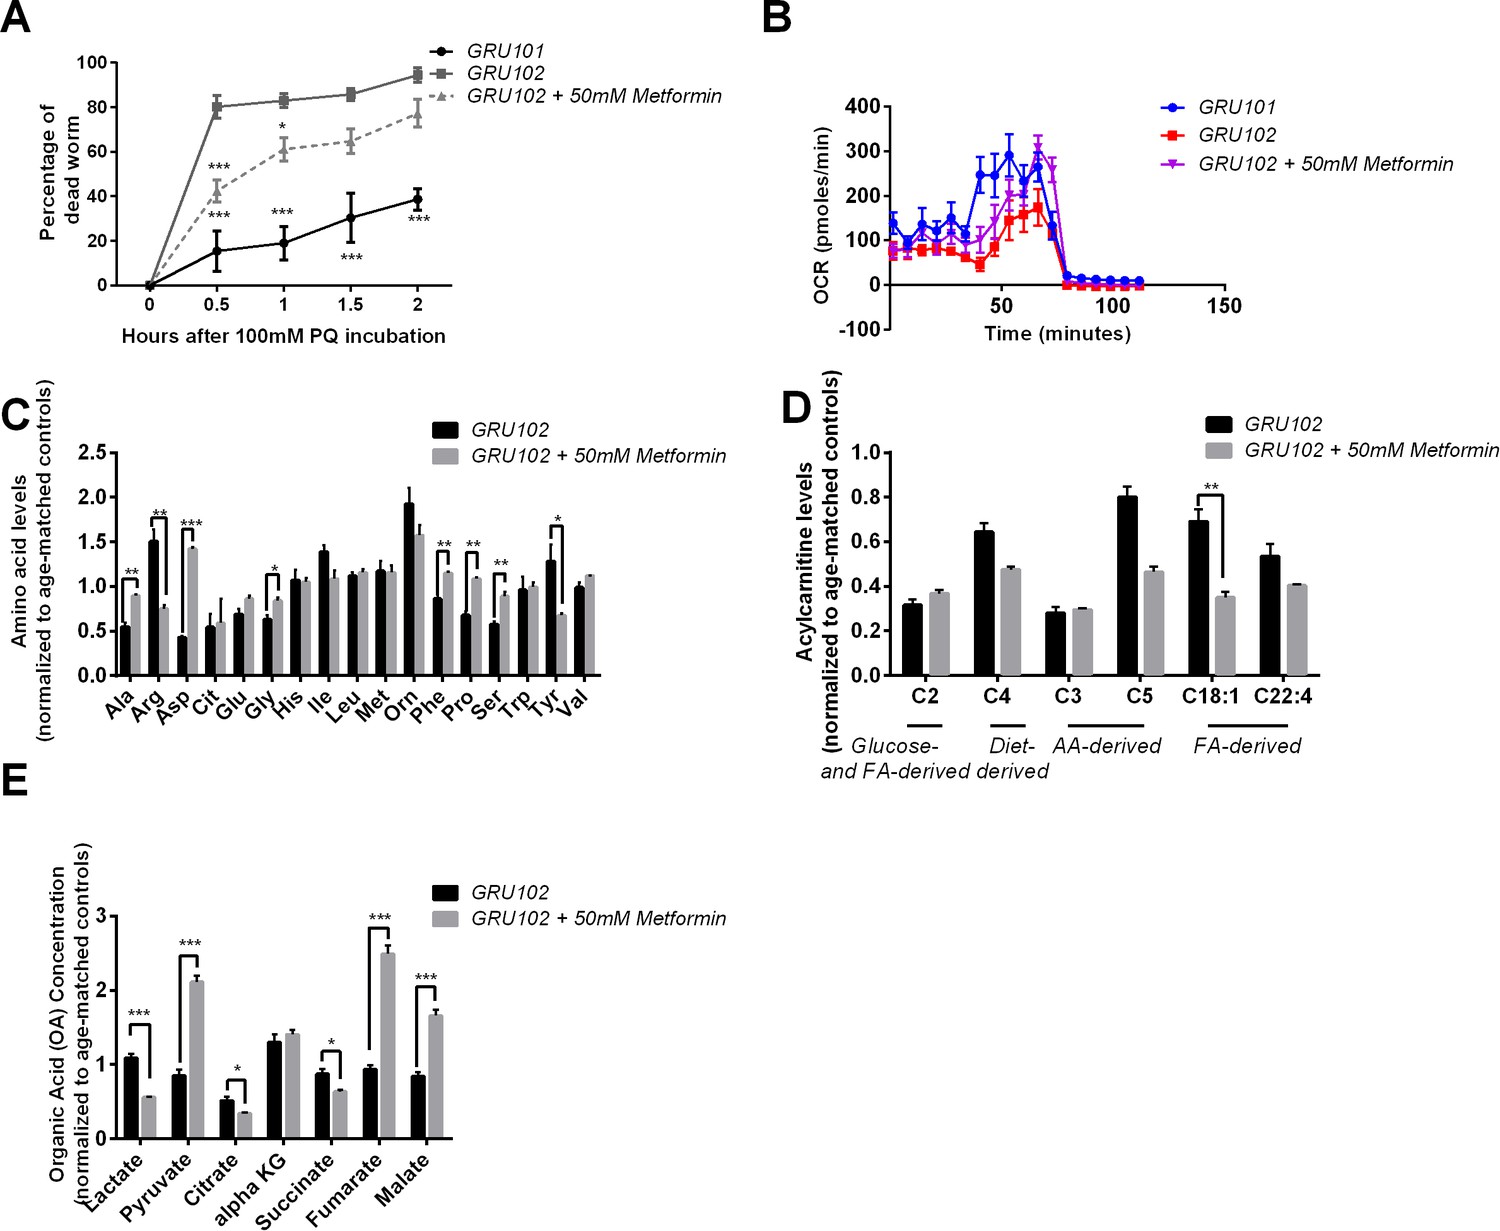
Effects of Metformin on Aβ-induced pathology in GRU102.
(A) Survival analysis of GRU102 animals treated with Metformin. At a dose of 50 mM, Metformin treatment significantly improved the lifespan of GRU102 (log-rank test p<0.005; n = 70–100 animals per condition). Similar result has been confirmed in two other independent trials (Supplementary file 3). (B) Time course of the percentage of dead animals observed as a function of time following treatment with 100 mM Paraquat (PQ). Metformin treatment improved PQ-stress resistance of GRU102 (Two-way ANOVA Dunnett’s multiple comparison, p<0.05, *; p<0.001, ***; n = 4 repeats per condition, with 10–20 animals per repeat). Similar result has been confirmed in one other independent trial. (C) Metabolic flux profile of Metformin-treated GRU102 (n = 6 repeats per condition, with 10 animals per repeat). Similar result has been confirmed in two other independent trials. (D) Amino acid, (E) Acylcarnitine, (F) Organic acid profile of Metformin-treated GRU102 on day 12. All values were normalized to respective protein level and then to age-matched GRU101 control (unpaired t-test, p<0.05, *; p<0.005, **; n = 3 repeats per condition with approximately 3000 animals per repeat collected in three independent cohorts). Similar result has been confirmed in one other independent trial (Figure 5—figure supplement 1).
-
Figure 5—source data 1
Metabolomics data for D12 GRU102 and D12 GRU102 treated with Metformin.
All values were normalized to D12 GRU101.
- https://doi.org/10.7554/eLife.50069.020
-
Figure 5—source data 2
Raw data for Seahorse oxygen consumption rate profile for D12 Metformin-treated GRU102.
- https://doi.org/10.7554/eLife.50069.021
Figure 5—figure supplement 1
Effects of Metformin on Aβ-induced pathology in GRU102 (Independent repeat).
(A) Time course of the percentage of dead animals observed when treated with 100 mM Paraquat (PQ). Metformin treatment improved PQ-stress resistance of GRU102 (Two-way ANOVA Dunnett’s multiple comparison, p<0.05, *; p<0.001, ***; n = 4 repeats per condition, with 10–20 animals per repeat). (B) Metabolic flux profile of Metformin-treated GRU102 (n = 6 repeats per condition, with 10 animals per repeat). (C) Amino acid, (D) Acylcarnitine, (E) Organic acid profile of Metformin-treated GRU102 on day 12. All values were normalized to respective protein level and then to age-matched GRU101 control (unpaired t-test, p<0.05, *; p<0.005, **; n = 3 repeats per condition with approximately 3000 animals per repeat collected in three independent cohorts).
Figure 5—figure supplement 2
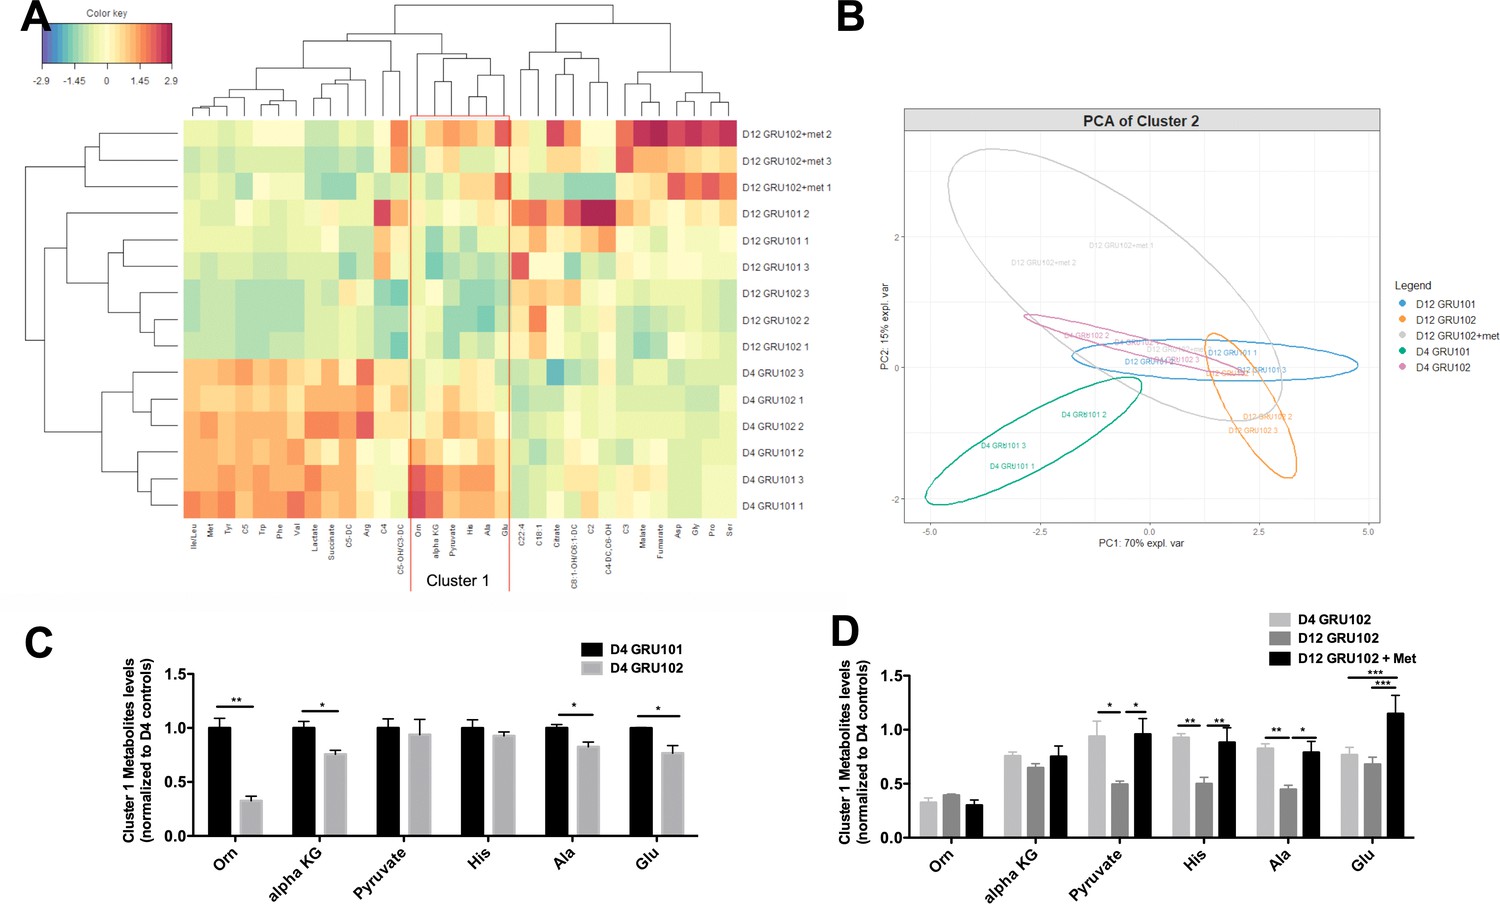
Metabolomics analysis of Metformin treatment.
(A) Heatmap analysis of metabolomics data. Abbreviation: Isoleucine/Leucine (Ile/Leu), Methionine (Met), Tyrosine (Tyr), Isovaleryl Carnitine (C5), Tryptophan (Trp), Phenylalanine (Phe), Valine (Val), Glutaryl-L-Carnitine (C5-DC), Arginine (Arg), Butyryl Carnitine (C4), Hydroxyvaleryl-L-carnitine/Methylmalonyl L-carnitine (C5-OH/C3-DC), Ornithine (Orn), alpha-ketoglutarate (alpha KG), Histidine (His), Alanine (Ala), Glutamic acid (Glu), Octadecanoyl carnitine (C18:1), Octenoyl-L-carnitine/Hexenoyl-L-carnitine (C8:1-OH/C6:1-DC), Acetyl carnitine (C2), Fumaryl-L-carnitine/Hydroxyhexanoyl L-carnitine (C4-DC/C6-OH), Propionyl carnitine (C3), Aspartate (Asp), Glycine (Gly), Proline (Pro), Serine (Ser). Color key represents the scaled abundance of a given metabolite, where the mean abundance of a given metabolite across the entire dataset was calculated (centering) and all the samples values were standardized to z-score (scaled by the standard deviation). For example, the scaled abundance of Ser for D12 GRU102 + met 2 was approximately 3 times the standard deviation higher from the mean abundance of Ser level across the entire dataset. (B) Principal component analysis (PCA) of cluster one metabolites. (C) Levels of cluster one metabolites in D4 GRU101 and D4 GRU102 (unpaired t-test, p<0.05, *; p<0.005, **; n = 3 repeats per condition with approximately 3000 animals per repeat collected in three independent cohorts). (D) Levels of cluster one metabolites in D4 GRU102, D12 GRU102 and D12 GRU102 + Metformin (unpaired t-test, p<0.05, *; p<0.005, **; p<0.001, ***; n = 3 repeats per condition with approximately 3000 animals per repeat collected in three independent cohorts).
Figure 5—figure supplement 3
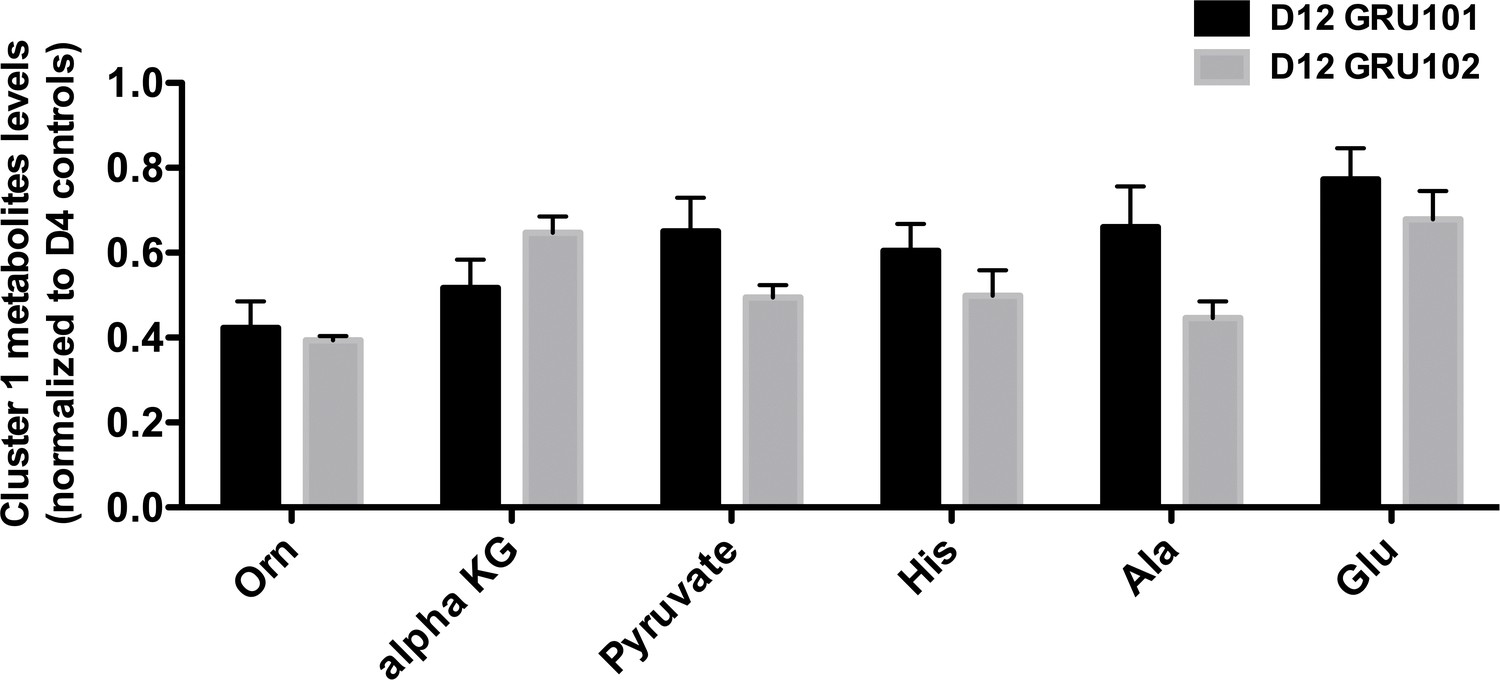
Levels of cluster one metabolites in old (day 12) animals.
No significant differences were observed between genotype on day 12.
Figure 5—figure supplement 4
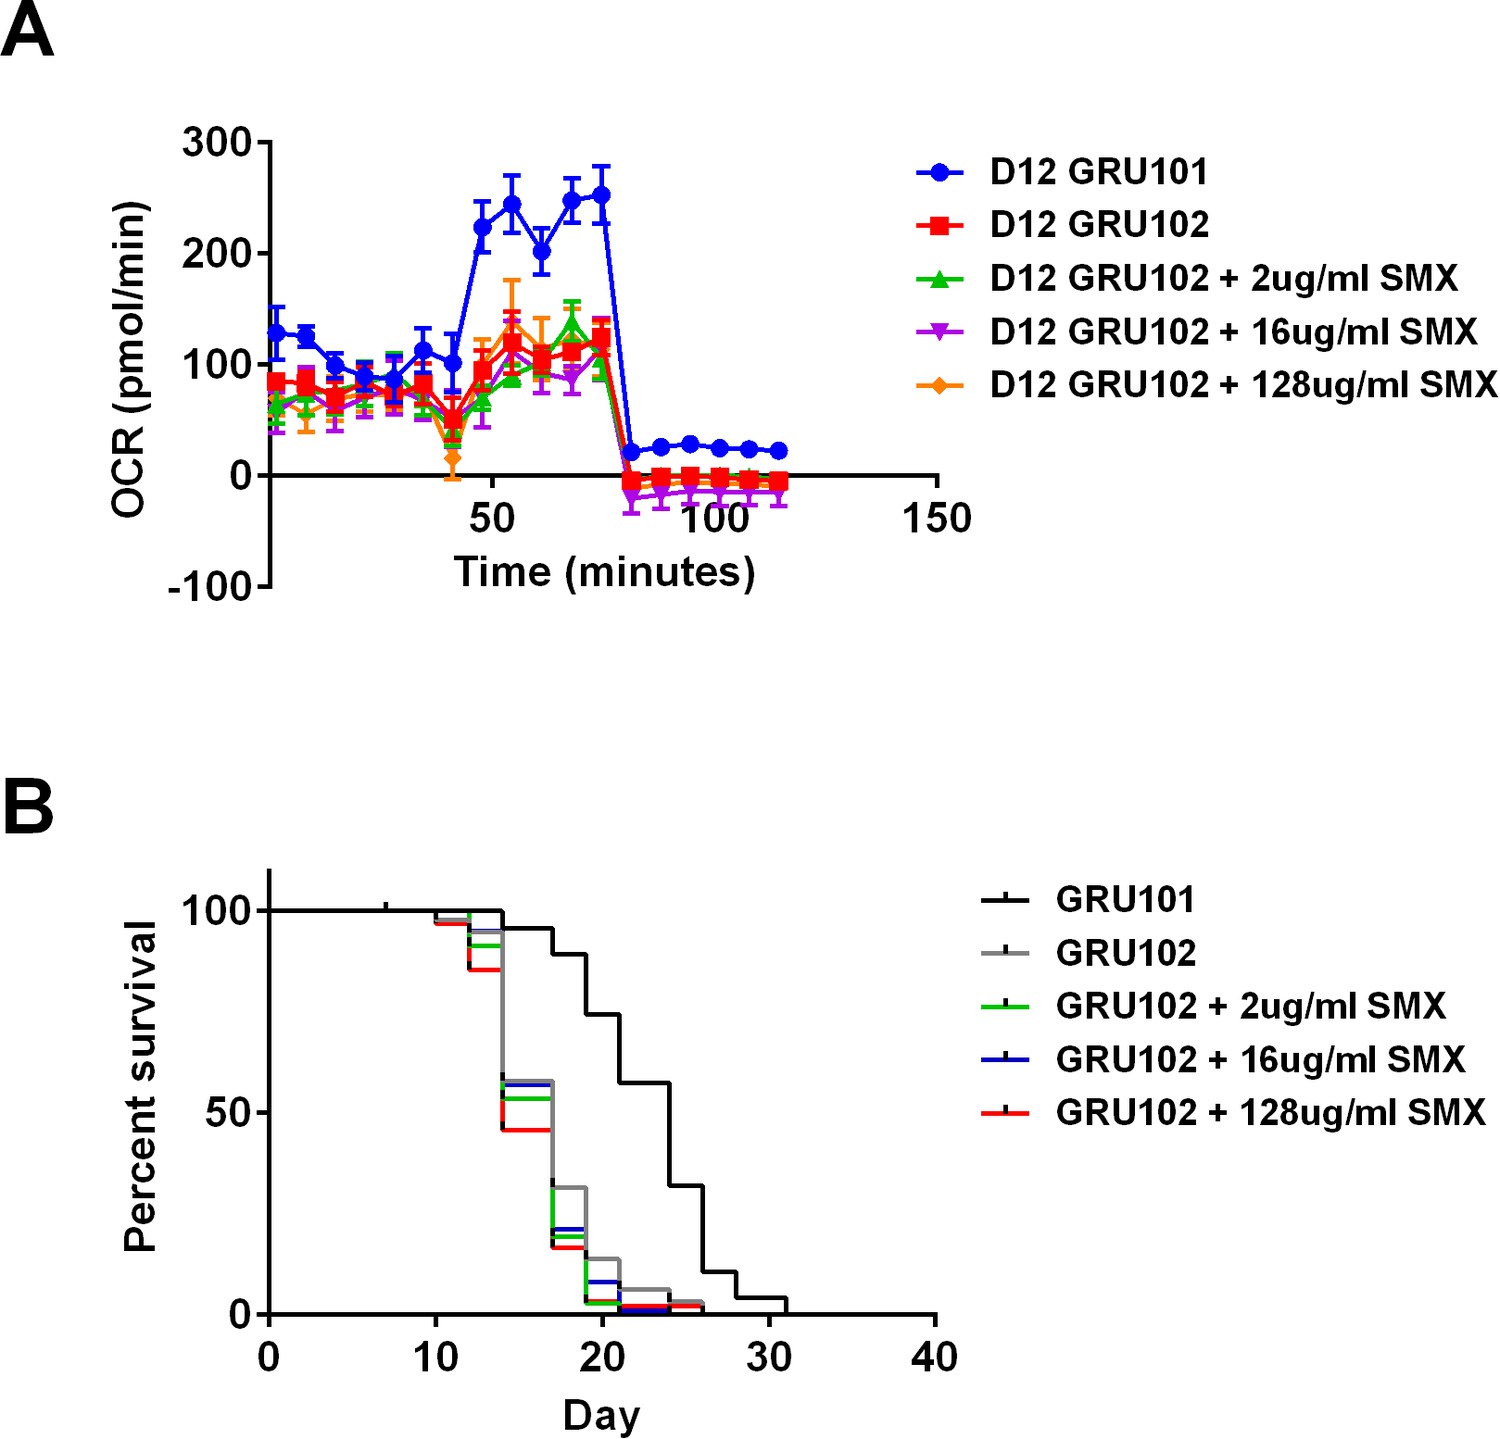
Sulfamethoxazole (SMX) did not rescue metabolic flux or lifespan detriments in GRU102.
(A) Metabolic flux profile of Sulfamethoxazole (SMX)-treated GRU102 (n = 6 repeats per condition, with 10 animals per repeat). (B) Lifespan curves of SMX-treated GRU102 (n > 95 animals per group). No significant differences were observed between GRU102 and GRU102 treated with SMX at any concentration.
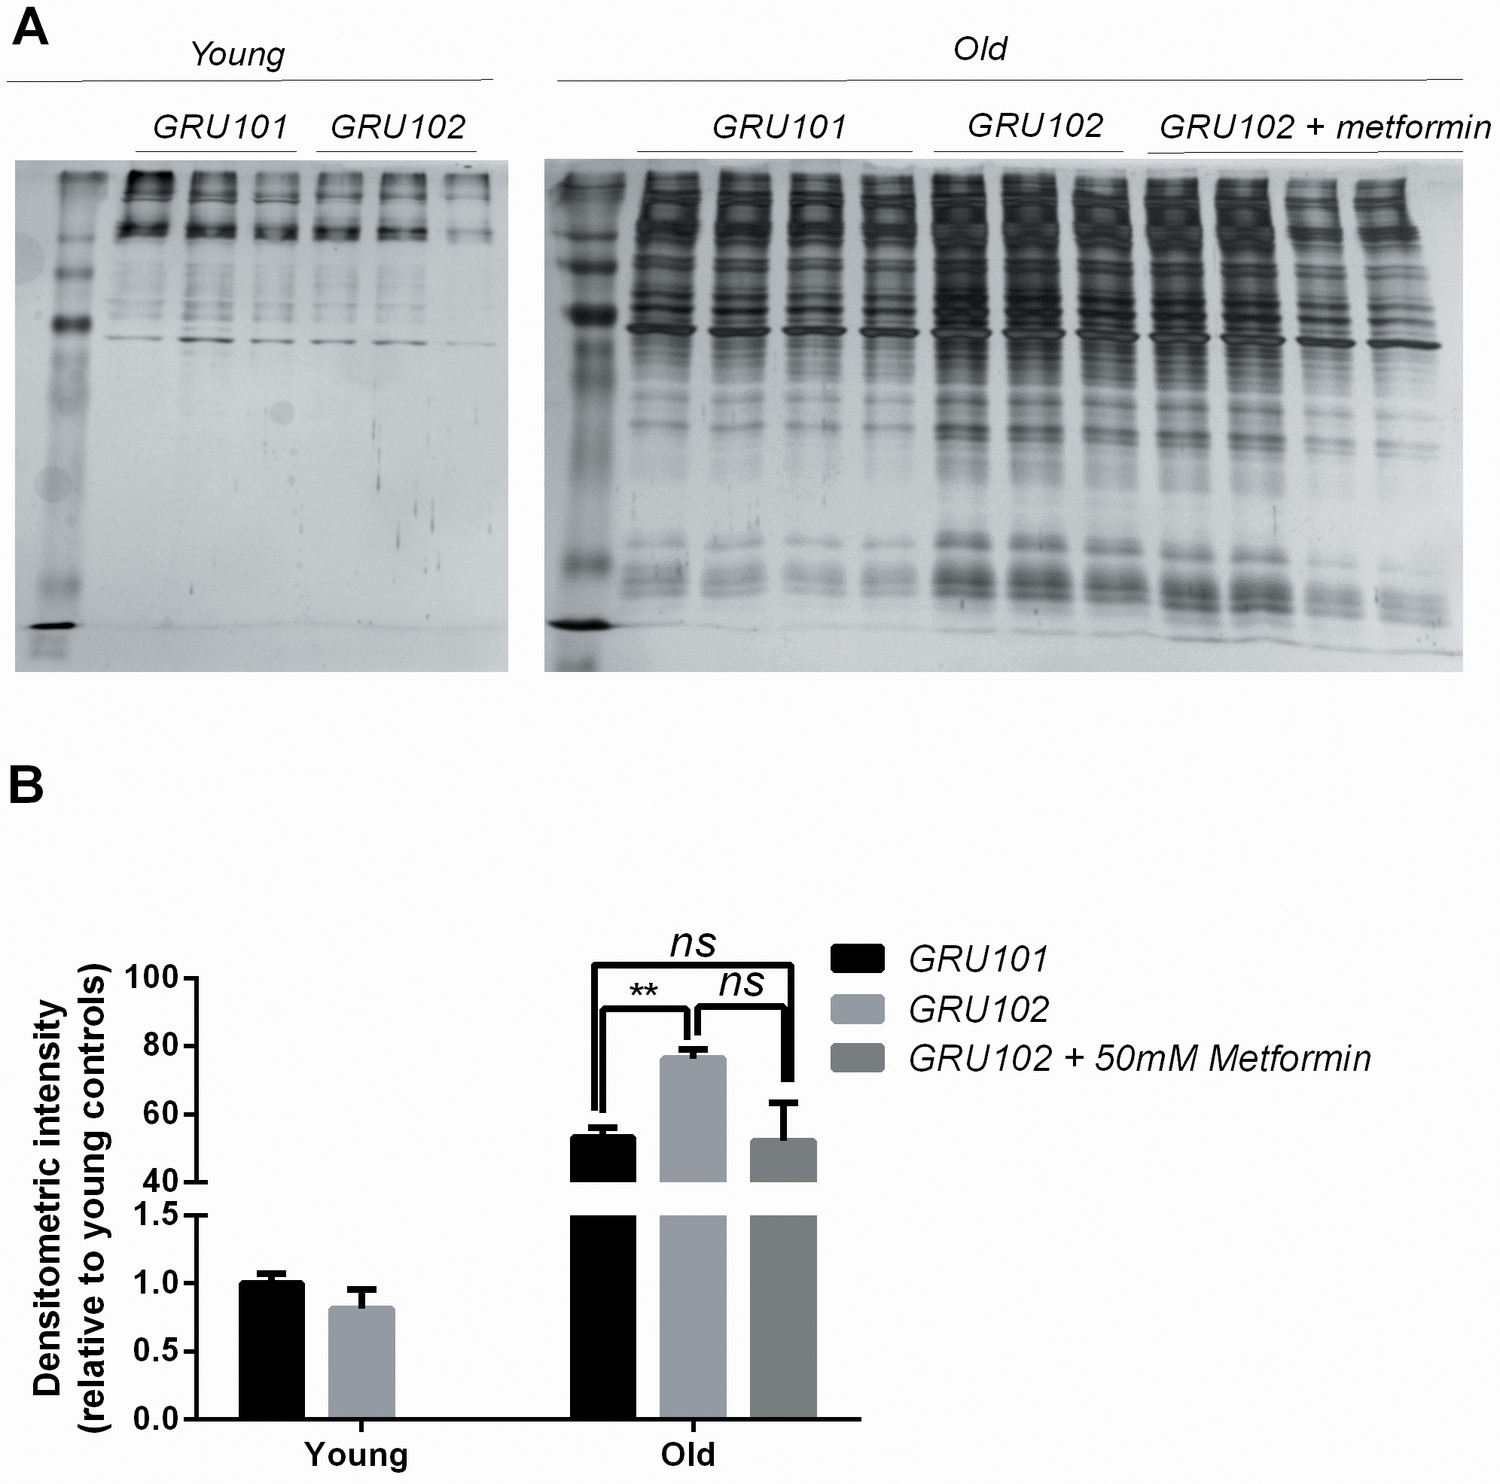
Figure 6 with 1 supplement
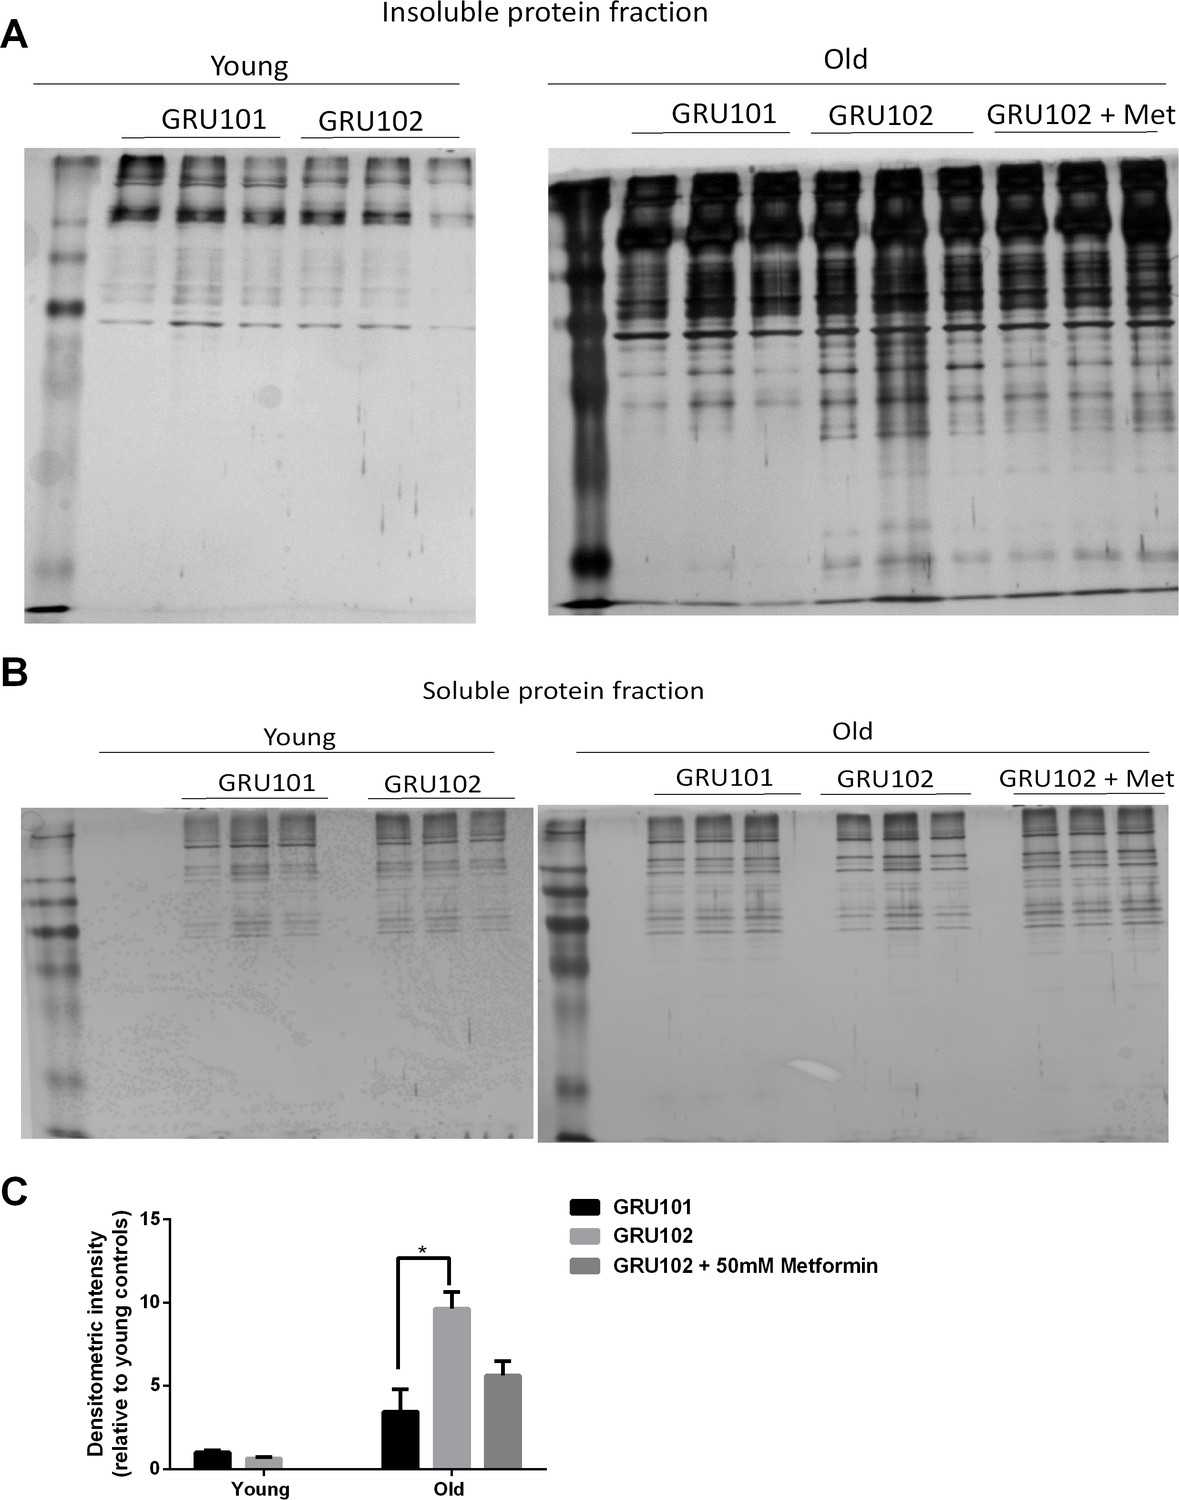
Levels of insoluble protein in GRU102.
(A) Silver stain of SDS-Page gel of detergent-insoluble protein, loaded based on five times the volume equivalent of 2 ug soluble protein determined by Bradford protein assay. (B) Silver stain of SDS-Page gel of 0.2 ug detergent-soluble protein determined by Bradford protein assay. (C) Normalized densitometric intensity corrected for differences in protein loading evaluated from soluble protein gel (Densitometric intensity of Gel A/Densitometric intensity of Gel B; Two-way ANOVA Dunnett’s multiple comparisons test, p<0.05, n = 3 repeats for all conditions, each repeat contains approximately 1500 animals collected in independent cohort). Similar result was observed in another independent repeat (Figure 6—figure supplement 1).
-
Figure 6—source data 1
Protein aggregate levels determined by insoluble gel.
Values were normalized by soluble gel and to Young GRU101.
- https://doi.org/10.7554/eLife.50069.024
Figure 6—figure supplement 1
Levels of insoluble protein in GRU102 (independent repeat).
(A) Silver stain of SDS-Page gel of detergent-insoluble protein, normalized to total protein in whole-worm lysate. (B, C) Densitometric analysis of the aggregation blot of young and old animals (Two-way ANOVA Dunnett’s multiple comparisons test, p<0.05, *; p<0.005, **; n = 4 repeats for all conditions except for old GRU102 with three repeats, each repeat contains approximately 1500 animals collected in independent cohort).
Figure 7

Graphical summary of the model of Aβ pathology in GRU102.
Pan-neuronal Aβ expression leads to an imbalance between reactive oxygen species (ROS) production and antioxidant (AOX) defense, resulting in oxidative stress as an early event in GRU102. Increase in mitochondrial protein carbonyl content (mtPCC) was also observed as an early phenomenon in GRU102. Elevated oxidative stress further affects ROS-sensitive Tricarboxylic Acid (TCA) cycle enzyme, including alpha-ketoglutarate dehydrogenase (aKGDH), resulting in a reduction of its activity as well as altered levels of TCA metabolites (aKGDH, fumarate and malate) in old GRU102. Together with the reduction in electron transfer chain (ETC) complex I and IV activities as well as low ATP levels in the GRU102 animals we reported previously (Fong et al., 2016), these phenomena result in metabolic stress. Proteostasis, an energy-intensive process, is impaired by metabolic and oxidative stress, resulting in an increase in general protein aggregates. Treatment with Metformin (Met) increases stress resistance and rescues metabolic defects of GRU102. Metformin-treated GRU102 also appears to reduce the increase in protein aggregates in GRU102, even though it could not fully rescue this phenotype.
Tables
Key resources table
| Reagent type (species) or resource | Designation | Source or reference | Identifiers | Additional information |
|---|---|---|---|---|
| Strain (C. elegans) | GRU101 gnaIs1 [myo-2p::yfp] | Caenorhabditis Genetics Center | ||
| Strain (C. elegans) | GRU102 Gnals2 [myo-2p::YFP + unc-119p::Abeta1-42] | Caenorhabditis Genetics Center | ||
| Commercial assay or kit | Qiagen RNAeasy micro kit | Qiagen | Cat. No 74004 | |
| Commercial assay or kit | Alpha-Ketoglutarate Dehydrogenase Activity Colorimetric A ssay Kit | BioVision Inc | Cat. No K678 | |
| Commercial assay or kit | Succinyl-CoA Synthetase Activity Colorimetric Assay Kit | BioVision Inc | Cat. No K597 | |
| Commercial assay or kit | Malate Dehydrogenase Activity Colorimetric Assay Kit | BioVision Inc | Cat. No K654 | |
| Commercial assay or kit | Lactate Dehydrogenase Activity Colorimetric Assay Kit | BioVision Inc | Cat. No K726 | |
| Chemical compound, drug | 1,1-Dimethylbiguanide hydrochloride (Metformin) | Sigma Aldrich | Product no D150959 |
Author response table 1
| Original data in manuscript | Data in independent replicate | Modifications made in the manuscript | |
|---|---|---|---|
| Figure 1A | Acylcarnitines derived from amino acids, C3 and C5, were significantly reduced in D12 GRU102 | Only C3 was significantly reduced in D12 GRU102; C5 showed a trend towards reduction but the difference did not reach statistical significance in D12 GRU102 | We removed the sentence stating that C5-Acylcarnitine was significantly reduced and focused only on C3-Acylcarntine: “AA-derived AC species (C3-carnitine) was also significantly reduced in old GRU102 (Figure 1A), suggesting that AA metabolism was affected in old GRU102.” |
| Figure 1D | Percentage of amino acids forming pyruvate were significantly lower in both D4 and D12 GRU102 Percentage of amino acids forming aKG were significantly higher in both D4 and D12 GRU102 | Reduction in percentage of amino acids forming pyruvate did not reach statistical significance in both D4 and D12 GRU102 Increase in percentage of amino acids forming aKG was only statistically significant in D12 GRU102, but not in D4 GRU102 | We removed the phrase that the percentage of amino acids forming pyruvate was significantly lower and focused only on the increase in percentage of amino acids forming aKG: “This analysis of the AA profile demonstrated that, in comparison to age-matched controls, the percentage of glucogenic AA forming alpha-Ketoglutarate (aKG) was significantly increased in old GRU102 animals (Figure 1D).” |
| Figure 5D | Metformin significantly increased levels of Ala, Asp, Gly, Leu, Met, Phe, Pro, Ser, Trp and Val in D12 GRU102. | Metformin significantly increased levels of Ala, Asp, Gly, Phe, Pro, Ser while significantly decreased levels of Arg and Tyr in D12 GRU102. | The general trend that Metformin increased levels of several individual amino acids still holds, even though the two replicates showed a slight variation in the identity of amino acids that were increased. We have modified our wording as follows: “We found that Metformin treatment increased the abundance of many AA in GRU102, with Alanine, Glycine, Proline and Serine consistently increased in both replicates (Figure 5D, Figure 5—figure supplement 1).” |
| Figure 5E | Metformin significantly increased levels of C3-acylcarnitine and also C5-acylcarnitine, even though the latter did not reach statistical significance. | Levels of C3-acylcarnitine appear similar between Metformin-treated and untreated GRU102. Metformin also appears to reduce the levels of C5-acylcarnitine, even though the reduction did not reach statistical significance. | Given the different trends observed in the two replicates, we feel that the increase in C3-acylcarnitine originally observed was within the noise of the measurement, and hence has removed its discussion in the manuscript. |
Additional files
-
Supplementary file 1
Nutritional and metabolic parameters used in metabolic flux balance analysis.
- https://doi.org/10.7554/eLife.50069.026
-
Supplementary file 2
List of reactions that show directional inconsistency in flux variability analysis (FVA).
- https://doi.org/10.7554/eLife.50069.027
-
Supplementary file 3
Summary of all lifespan trials with Metformin-treatment.
- https://doi.org/10.7554/eLife.50069.028
-
Transparent reporting form
- https://doi.org/10.7554/eLife.50069.029
Download links
A two-part list of links to download the article, or parts of the article, in various formats.
Downloads (link to download the article as PDF)
Open citations (links to open the citations from this article in various online reference manager services)
Cite this article (links to download the citations from this article in formats compatible with various reference manager tools)
Metabolic stress is a primary pathogenic event in transgenic Caenorhabditis elegans expressing pan-neuronal human amyloid beta
eLife 8:e50069.
https://doi.org/10.7554/eLife.50069


