Two roles for the yeast transcription coactivator SAGA and a set of genes redundantly regulated by TFIID and SAGA
- Fred Hutchinson Cancer Research Center, United States
Figures
Figure 1 with 4 supplements
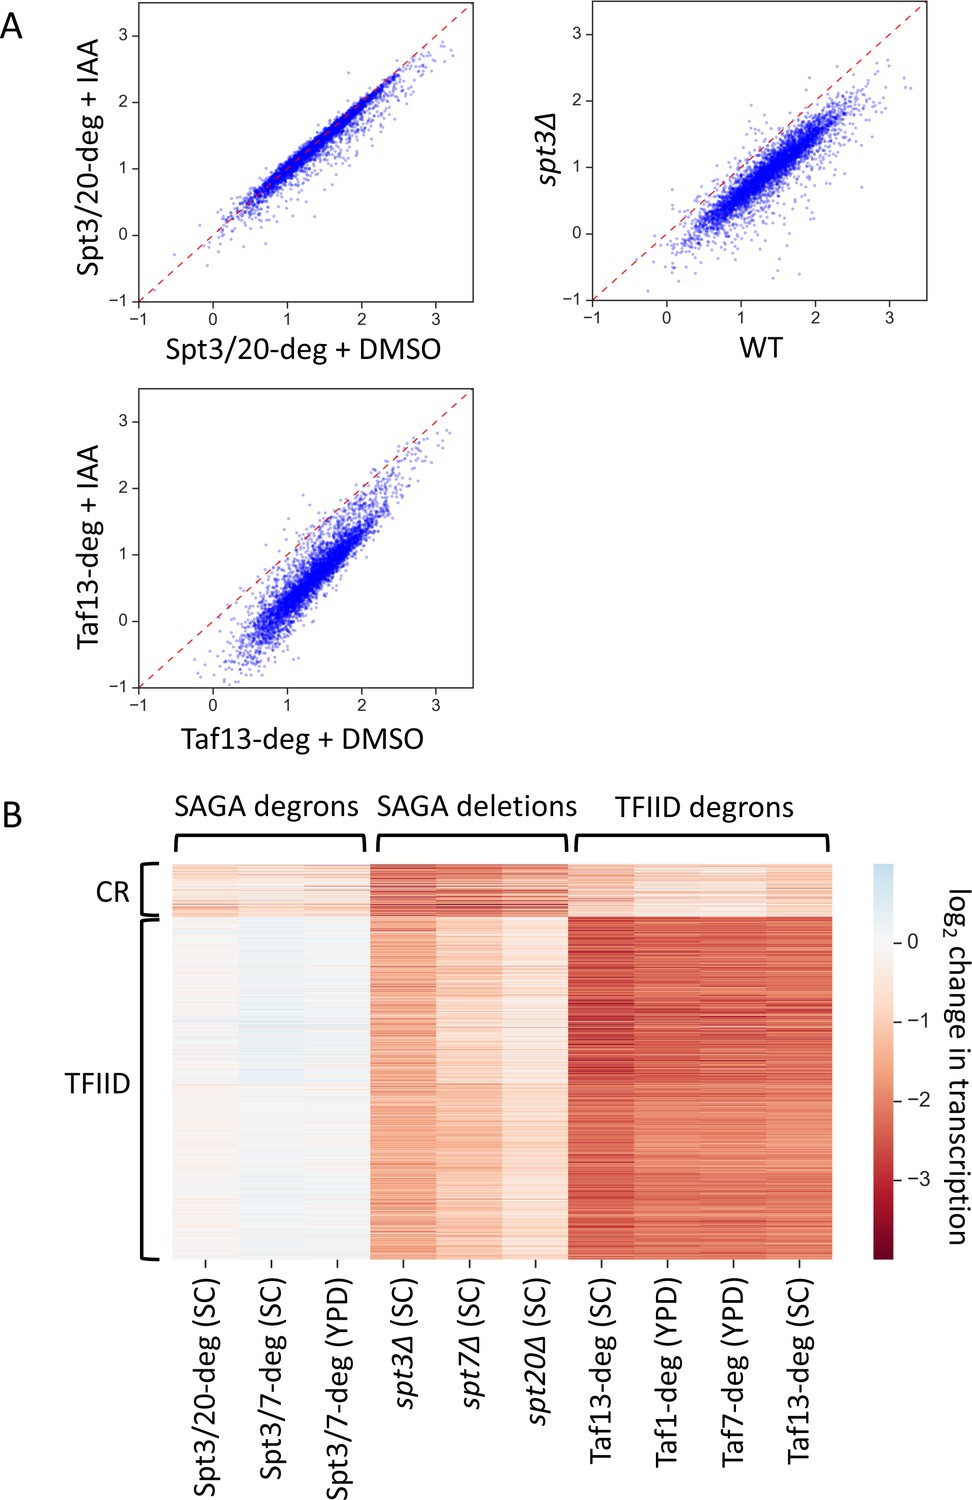
Two distinct classes of yeast genes based on SAGA and TFIID dependence.
(A) Scatter plots comparing normalized signal per gene in corresponding samples. Log10 scale is used for X and Y axes. Mean values from replicate experiments are plotted. All presented experiments were done in SC media. (B) Heatmap representation of log2 change in transcription values. Mean values from replicate experiments are plotted. Genes are grouped by results of k-means clustering analysis of SAGA deletion and TFIID degron experiments. Two clusters were found to give the best separation using silhouette analysis. Log2 change values from relevant experiments for all 4900 genes were used as an input for k-means algorithm (‘KMeans’ function from Python sklearn.cluster library with default settings).
Figure 1—figure supplement 1
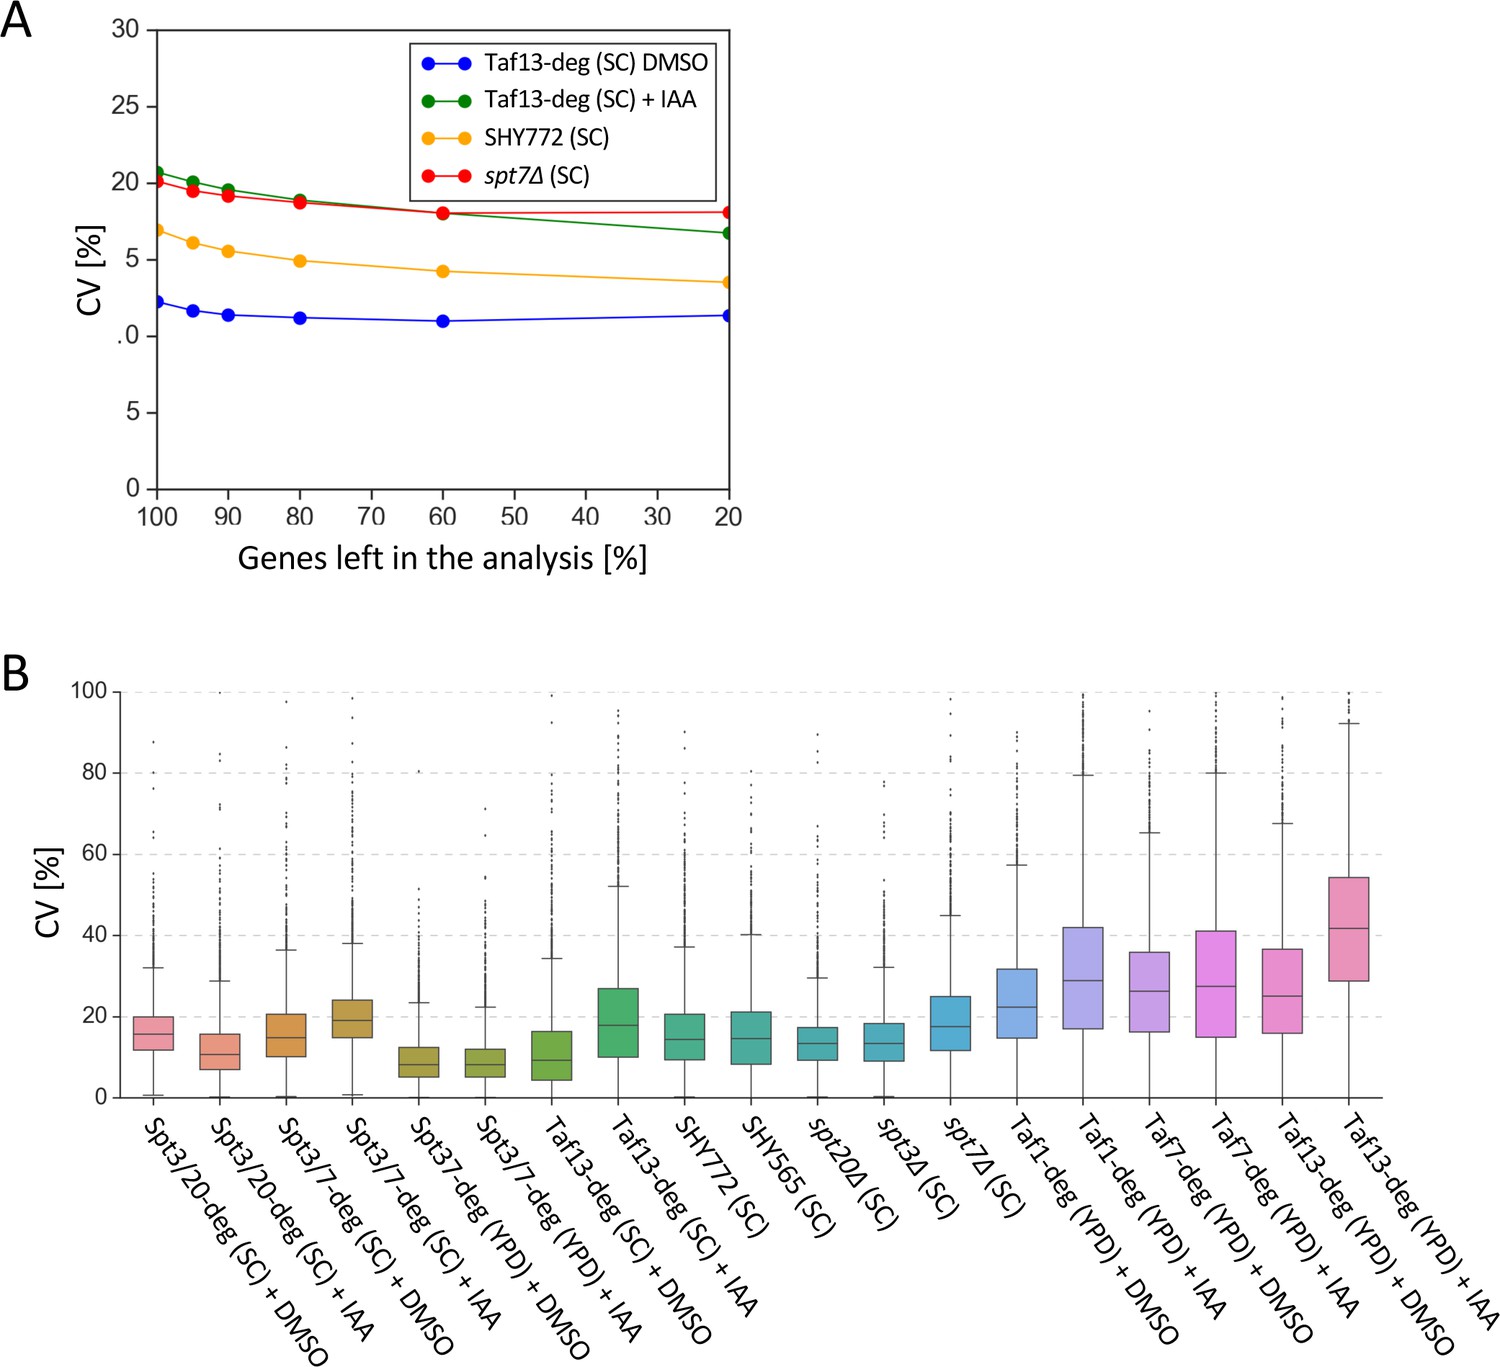
Biological replicates for 4-thioU RNA-seq experiments show low variability.
(A) Average coefficients of variation (CV) for selected experiments vs the percentage of genes analyzed (after first filtering out 639 genes which did not have RNA-seq signal in at least one experiment and sorting the remaining 5158 genes by expression level). CV values were calculated for each gene based on normalized read counts. Genes were sorted by the expression level. The biggest relative decrease in observed average CV is visible after filtering out 5% lowly expressed genes. Consequently 95% of 5158 genes (i.e. 4900 genes) were used in the rest of this work. (B) Gene-specific coefficients of variation (CV) for all 4-thioU RNA-seq experiments. All samples were done in triplicate except the YPD-grown Taf-degron cultures and wild-type BY4705 samples (labeled SHY772) that were done in duplicate. CV values were calculated for each gene based on normalized read counts for replicate experiments.
-
Figure 1—figure supplement 1—source data 1
Coefficient of variation values for different experiments used to plot Figure 1—figure supplement 1.
- https://cdn.elifesciences.org/articles/50109/elife-50109-fig1-figsupp1-data1-v2.xlsx
Figure 1—figure supplement 2

Auxin-degron system allows for efficient degradation of target TFIID and SAGA subunits.
(A) Degron depletion in single or double degron strains. Western blot showing degron efficiency in cells grown in synthetic complete media. Experiment was done in biological triplicates (A, B, and C cultures). Variable amounts of the untreated samples were loaded to allow quantitation of degron efficiency. Blots were probed with a-V5 monoclonal (Spt20, Spt3, Spt7, Taf13, Taf1, Taf7-degrons) or a-Tfg2 polyclonal antibodies. (B) Western analysis of TFIID subunits in Taf-degron strains grown in YPD. Experiment was done in biological duplicates (A and B cultures).
Figure 1—figure supplement 3
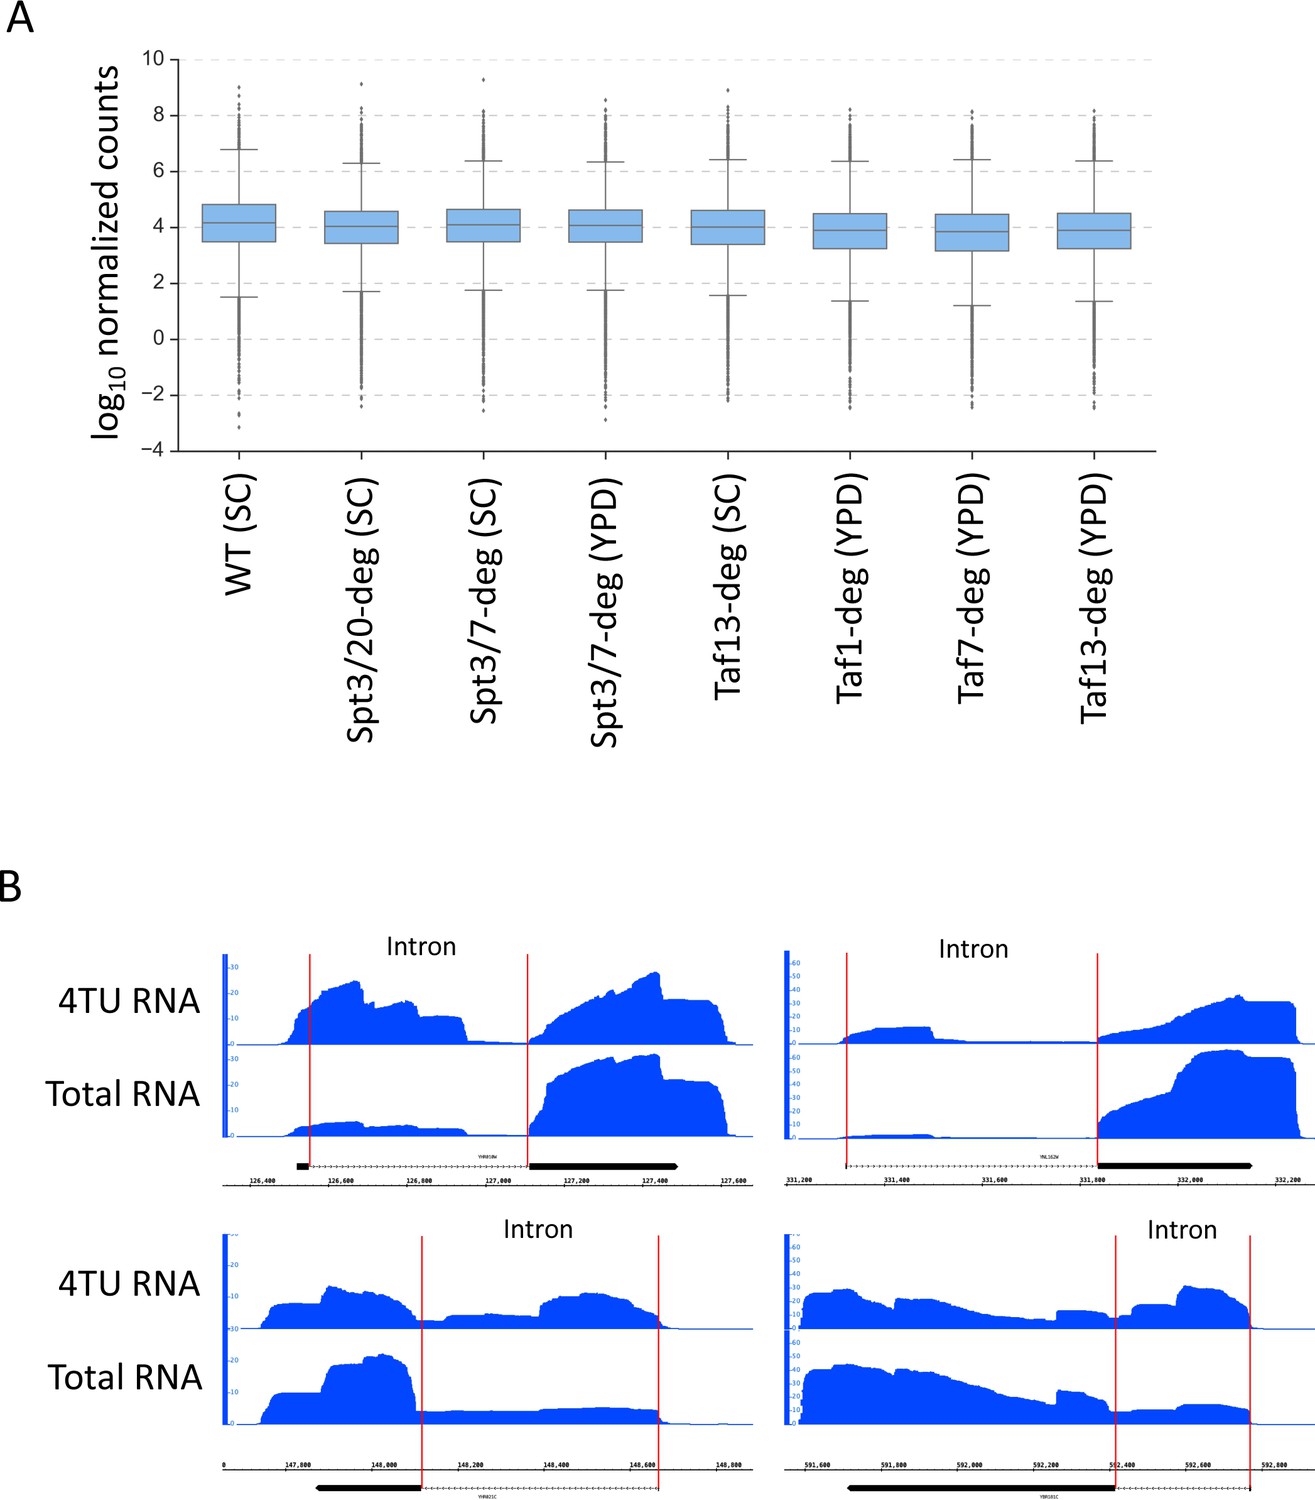
Validation of mutant strain fitness and enrichment of nascent transcripts in 4thioU RNA-seq experiments.
(A) Box plot of gene expression level in selected experiments following DMSO treatment. Mean value for replicate samples was used. Log10 scale is used for Y axis. (B) Genome browser images showing the comparison of signal at selected intron-containing genes between total RNA sample and 4TU RNA-enriched sample.
-
Figure 1—figure supplement 3—source data 1
Mean values of log10 expression per gene for selected DMSO treated samples used to plot Figure 1—figure supplement 3A.
- https://cdn.elifesciences.org/articles/50109/elife-50109-fig1-figsupp3-data1-v2.xlsx
Figure 1—figure supplement 4
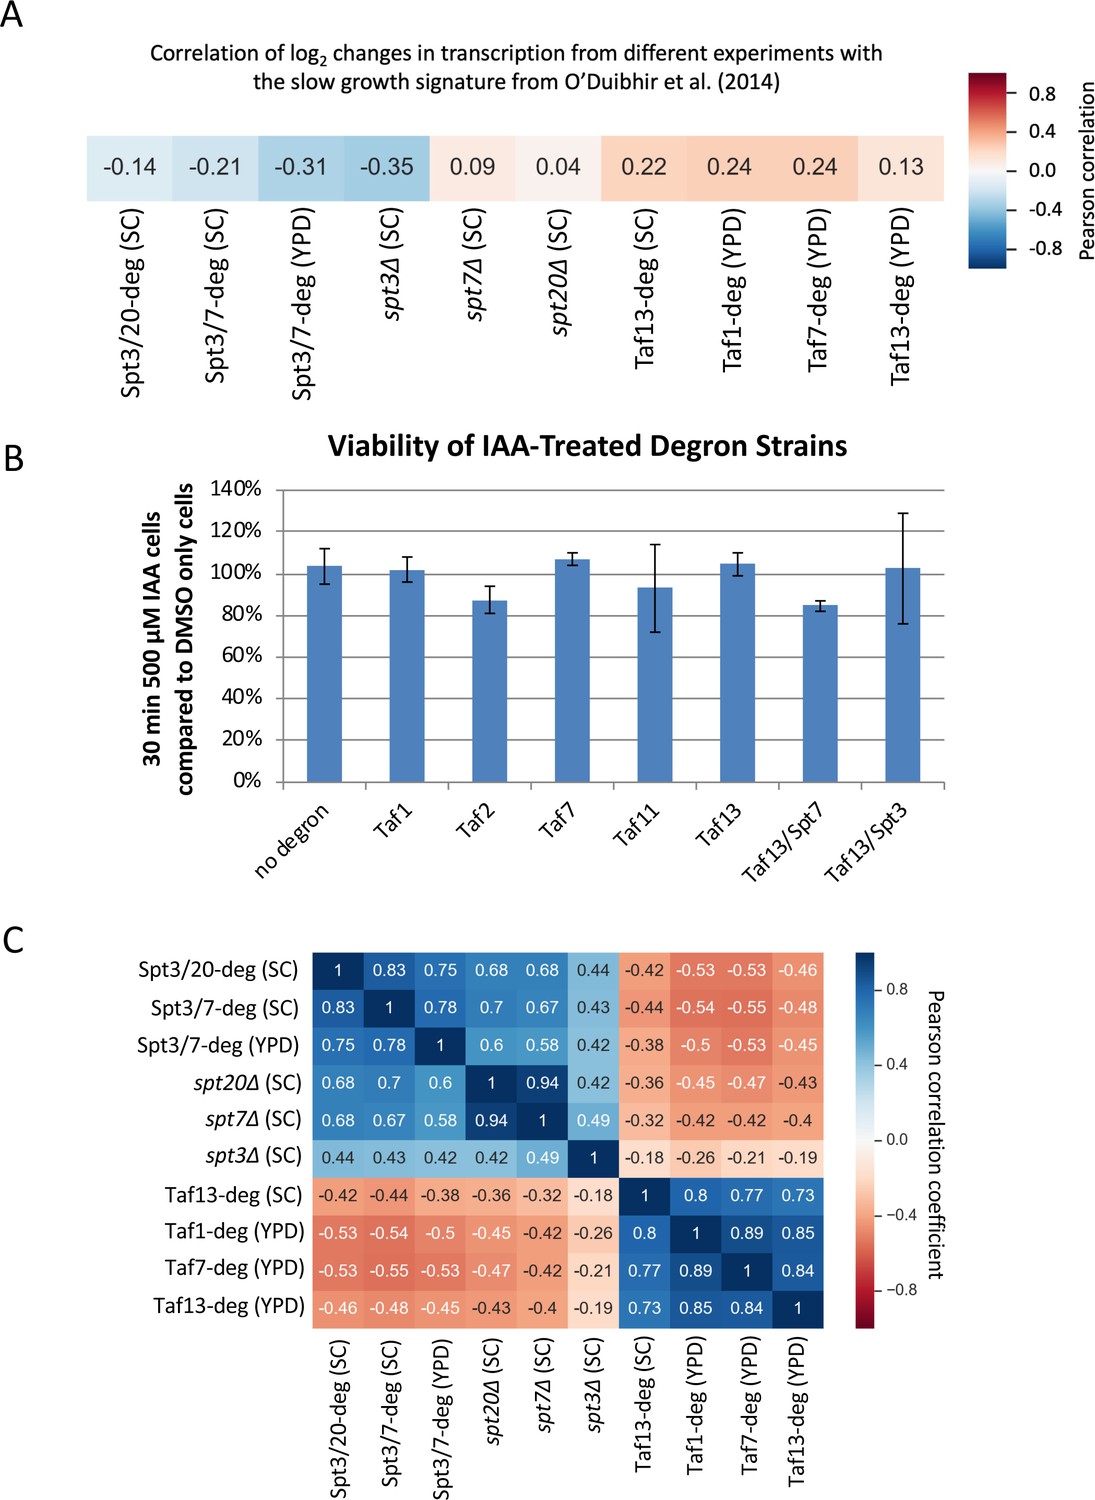
Mutant genotype and IAA treatment for 30 minutes do not compromise viability of tested strains.
(A) Correlation matrix of Pearson correlation coefficient values between log2 changes in transcription in SAGA and TFIID depletion experiments and the slow growth signature defined in O'Duibhir et al. (2014). Mean values from replicate experiments were used. (B) Bar plot showing the viability of degron-containing and WT yeast after a 30 min incubation with IAA. Viability measured in duplicate cultures by growth on YPD plates lacking IAA. (C) Correlation matrix of Pearson correlation coefficient values between log2 changes in transcription in all SAGA and TFIID depletion experiments. Mean values from replicate experiments were used.
-
Figure 1—figure supplement 4—source data 1
Average log2 changes in transcription in the degron and deletion strains same as in Supplementary file 3 with additional column (SGS) containing the values of slow growth signature defined in O'Duibhir et al. (2014).
Table was used to plot the heatmap in Figure 1—figure supplement 4A.
- https://cdn.elifesciences.org/articles/50109/elife-50109-fig1-figsupp4-data1-v2.xlsx
Figure 2 with 1 supplement
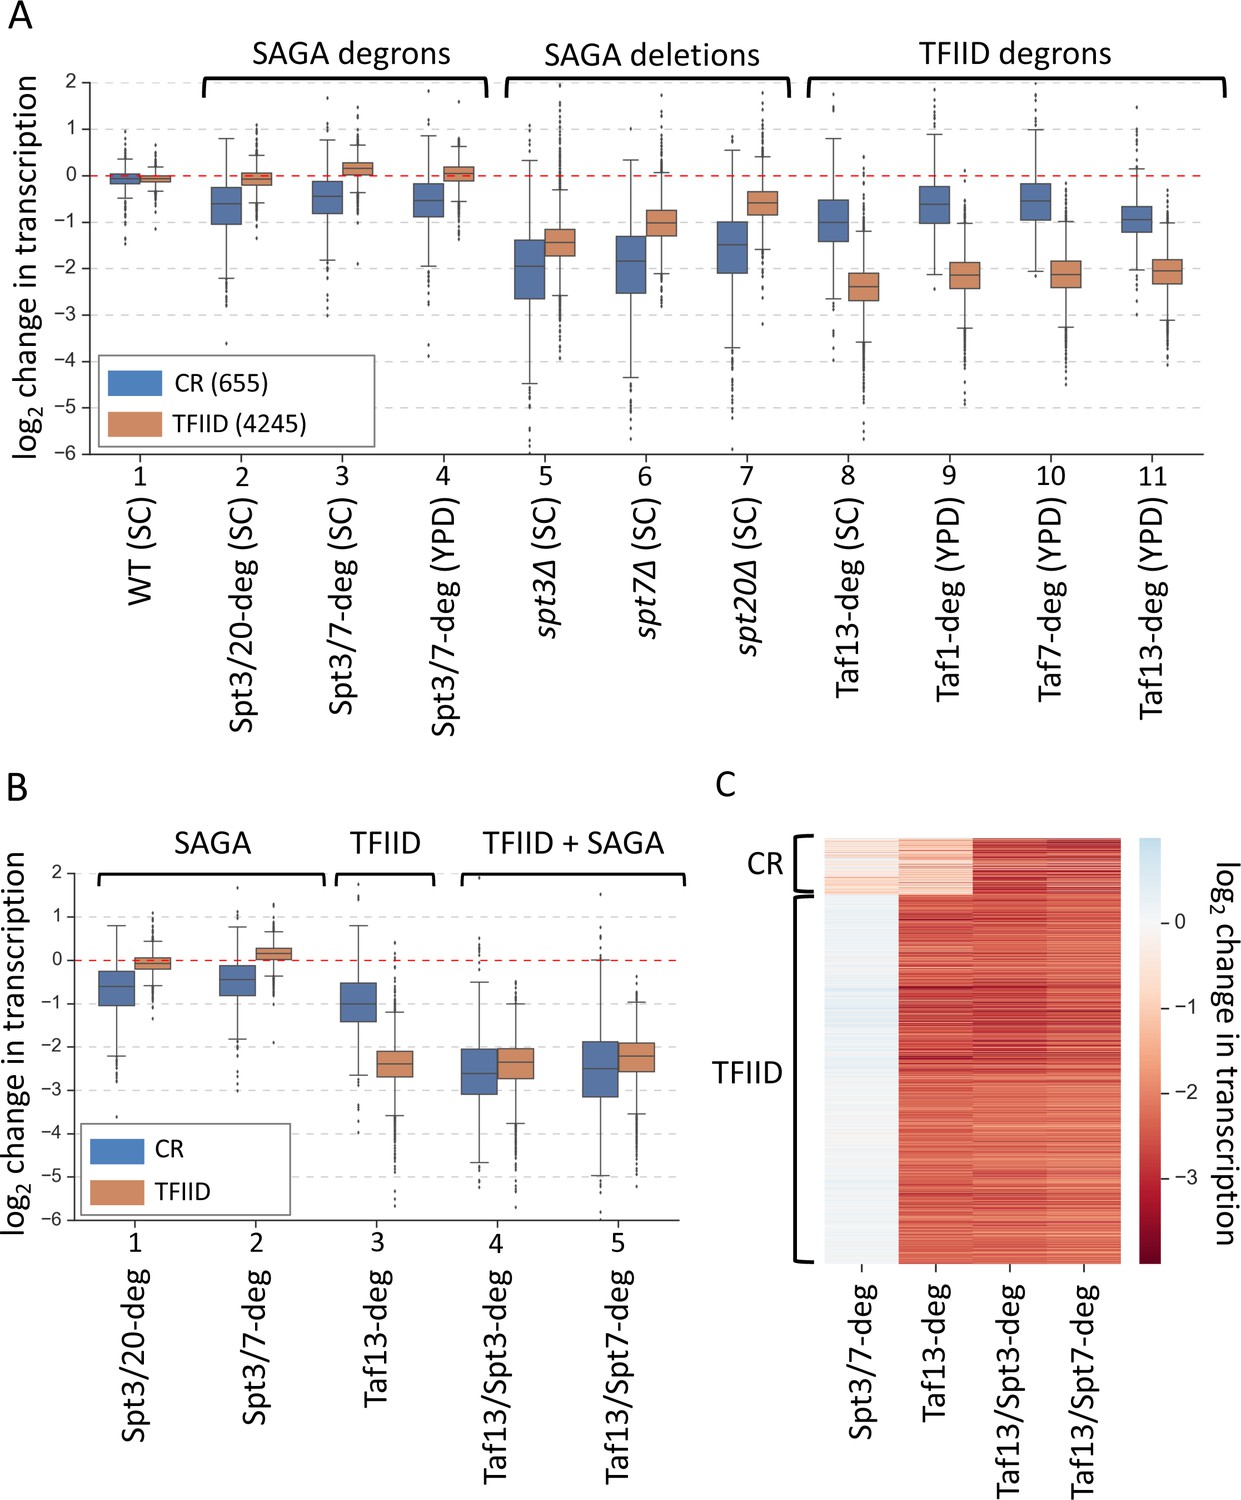
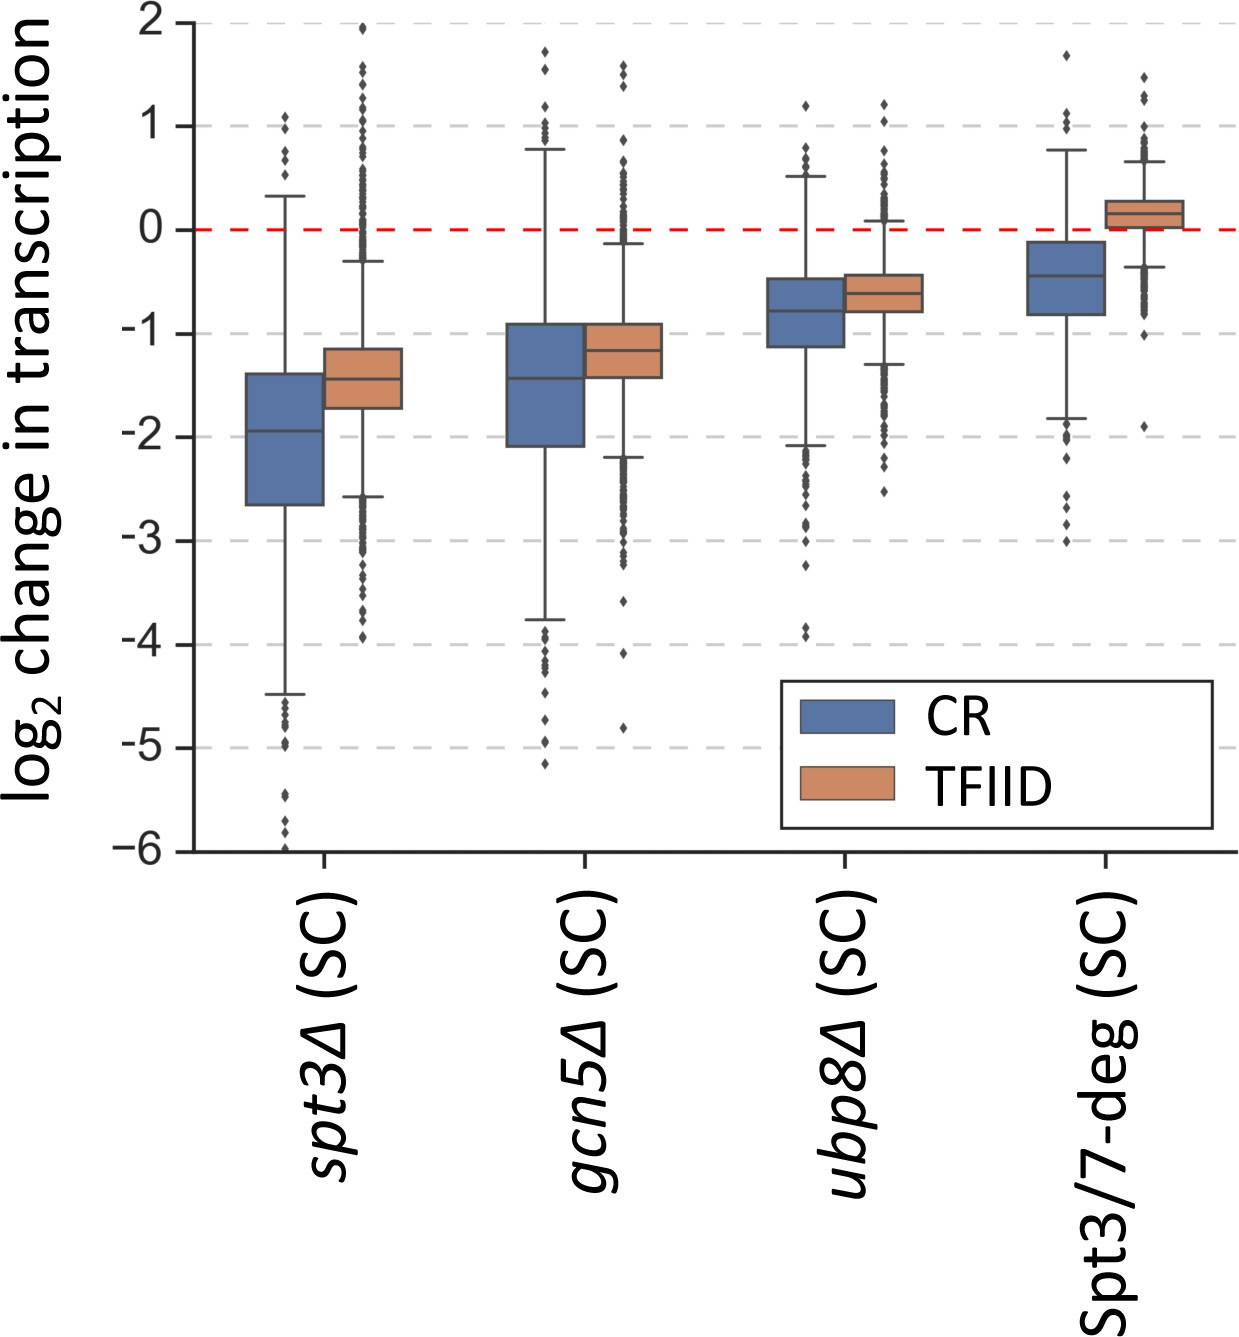
Simultaneous depletion of SAGA and TFIID severely affects transcription from almost all genes.
(A) Box plot showing the log2 change in transcription per gene upon perturbing cellular levels of SAGA or TFIID. Genes are divided into two classes according to results of the k-means clustering analysis of SAGA deletion and TFIID degron experiments from Figure 1. Mean values from replicate experiments are plotted. (B) Box plot and (C) heat map comparing results of depletion of SAGA or TFIID with simultaneous depletion of both coactivators. Genes are grouped into two categories from Figure 1. All experiments in panels B and C were done in SC media. Mean values from replicate experiments are plotted.
Figure 2—figure supplement 1

Coactivator-redundant genes show extensive loss transcription upon depletion of both TFIID and SAGA.
(A) Scatter plots comparing results of Taf13-deg and Taf13/Spt3-deg experiments for coactivator-redundant (CR) genes and TFIID genes. (B) Scatter plot of gene expression rank vs the difference between the results of Spt3/Taf13-degron experiment and the sum of effects of independent depletions of SAGA and TFIID (Spt3/20 deg and Taf13-deg experiments). Only CR genes are plotted (655 genes). Gene with rank one is most highly expressed.
Figure 3 with 2 supplements
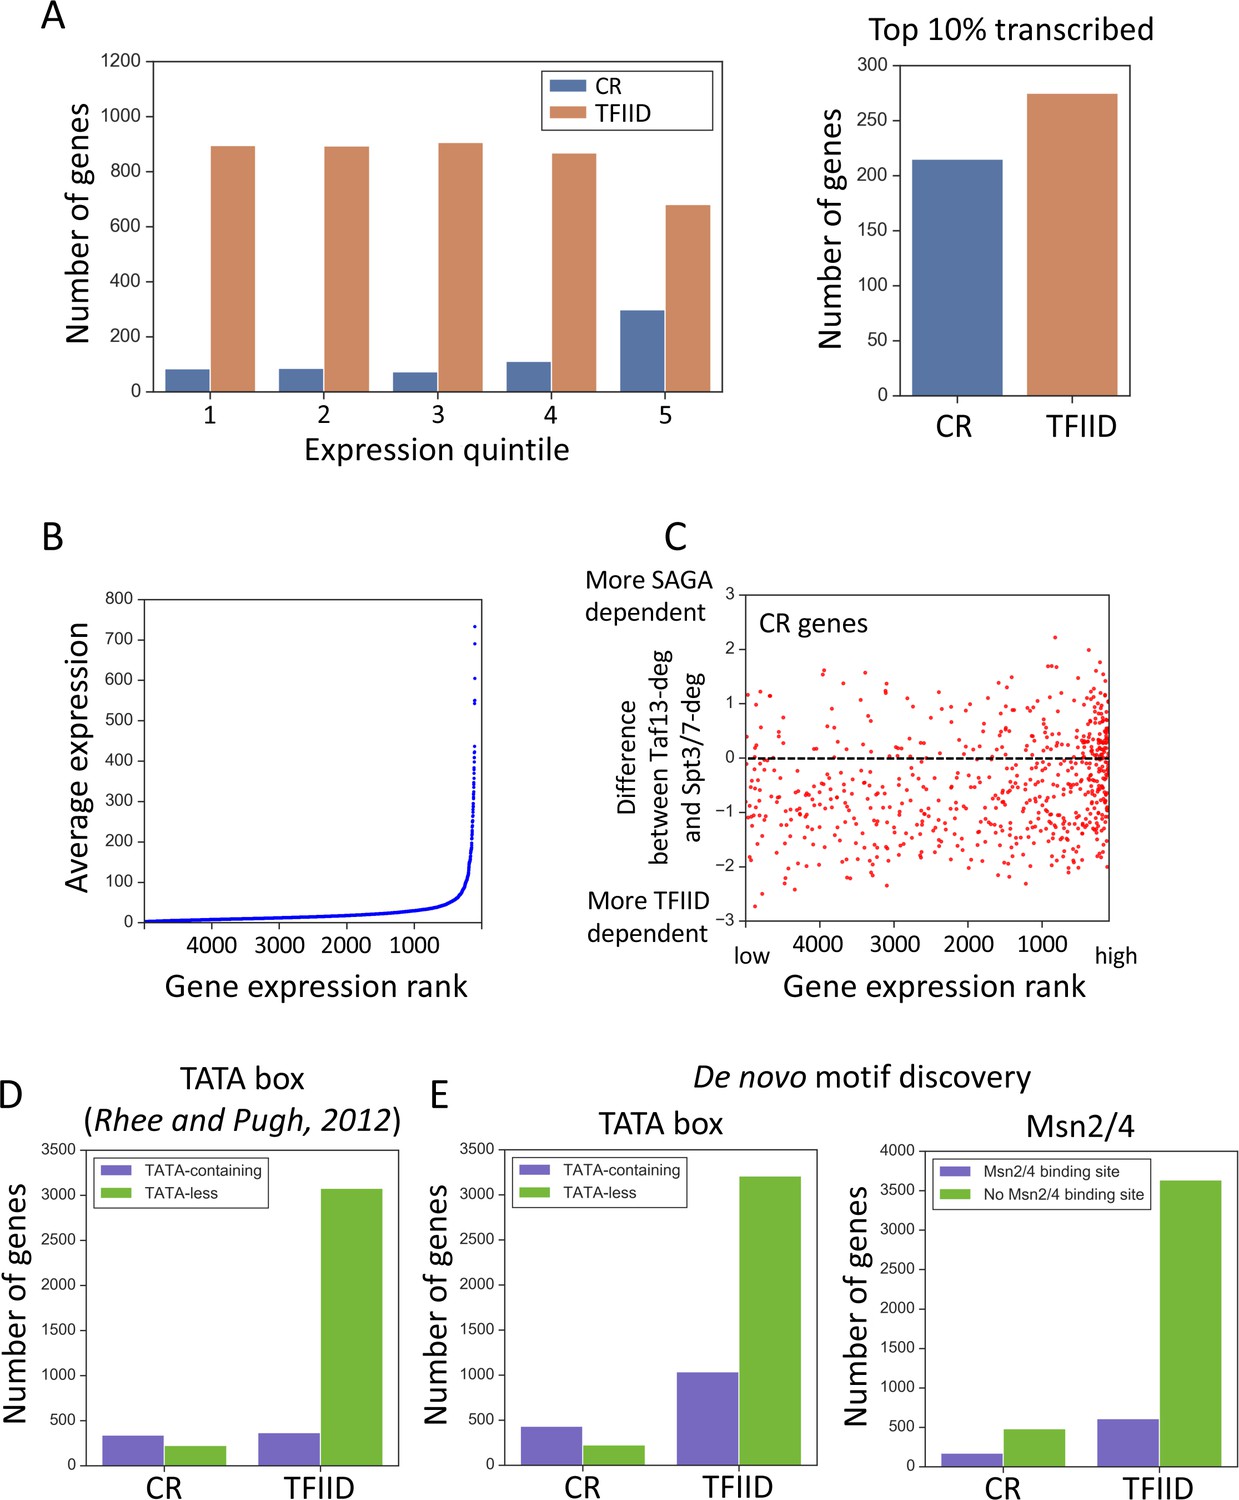
Properties associated with TFIID-dependent and coactivator-redundant genes.
(A) Bar plot comparing the number of genes in each gene class as a function of expression level (left panel) and among the top 10% highly transcribed genes (right panel). Quintile five contains the most highly expressed genes. (B) Scatter plot of average expression vs the gene expression rank. Gene with rank one is most highly expressed. (C) Scatter plot comparing gene expression rank with the difference in sensitivity of genes to rapid Taf13 and Spt3/7 depletion. Only coactivator-redundant (CR) genes are plotted (655 genes). (D) Number of TFIID and coactivator-redundant (CR) genes among TATA-less and TATA-containing categories. Consensus TATA was defined as TATAWAW and the TATA-element positions from Pugh and colleagues (Rhee and Pugh, 2012) were used. (E) Results of a motif search guided by results of de novo motif discovery (Materials and methods). TATA box and Msn2/4 binding site were the most highly represented motifs for CR genes (Supplementary file 5). Each motif was searched among all 4900 promoters classified in this study. For TATA box, a consensus TATAWAW was used and the search was limited to the area from 200 bp upstream to TSS. For Msn2/4 a consensus (A/C/G)AGGGG was used (Stewart-Ornstein et al., 2013), and the search was limited to a region from 300 bp upstream to 50 bp upstream relative to TSS. All promoters carrying at least one consensus sequence in the defined range were classified as containing either TATA or the Msn2/4 binding site.
-
Figure 3—source data 1
Table containing gene classification defined in this work and the TATA-containing/TATA-less definitions from Rhee and Pugh (2012).
Data was used to plot Figure 3D.
- https://cdn.elifesciences.org/articles/50109/elife-50109-fig3-data1-v2.xlsx
-
Figure 3—source data 2
Tables containing gene classification defined in this work and the classification of genes into categories based on the presence of a TATA-box or Msn2/4 binding site based on promoter search performed in this work.
Data were used to plot Figure 3E.
- https://cdn.elifesciences.org/articles/50109/elife-50109-fig3-data2-v2.xlsx
Figure 3—figure supplement 1
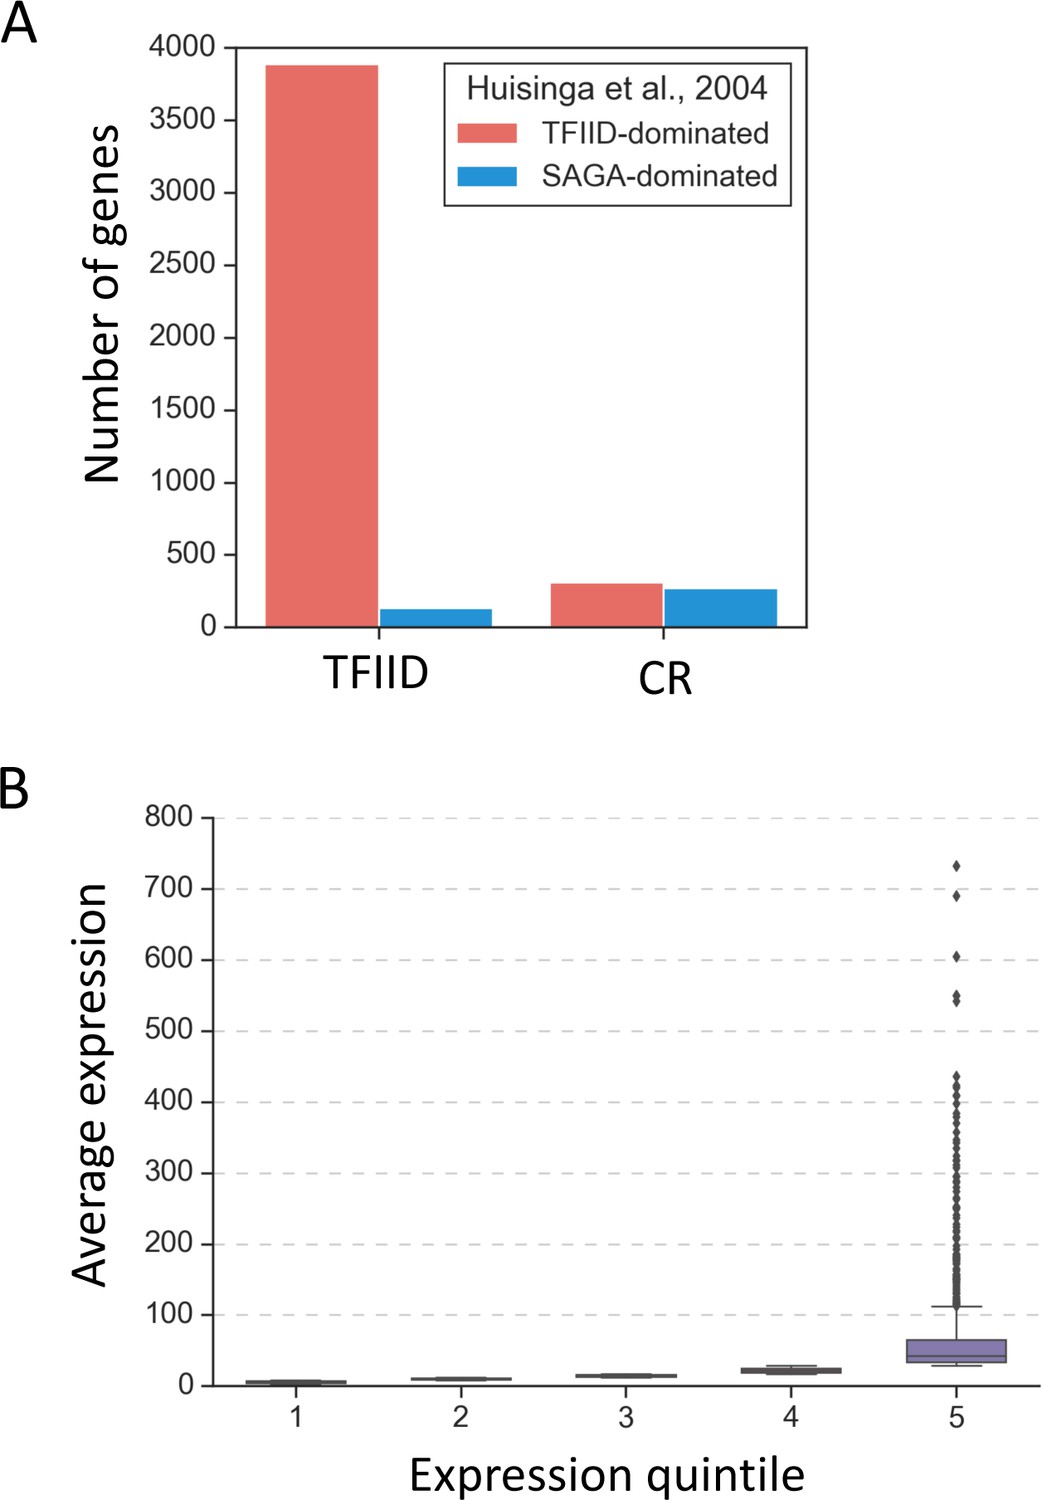
Properties of the TFIID and coactivator-redundant gene classes.
(A) Barplot comparing previously defined categories ‘TFIID-dominated’ and ‘SAGA-dominated’ genes (Huisinga and Pugh, 2004) with categories defined in this study. (B) Boxplot representation of average expression per gene in expression quintiles based on 4thioU RNA labeling.
-
Figure 3—figure supplement 1—source data 1
Table containing gene classification defined in this work and the gene classes defined in Huisinga and Pugh (2004).
Data was used to plot Figure 3—figure supplement 1A.
- https://cdn.elifesciences.org/articles/50109/elife-50109-fig3-figsupp1-data1-v2.xlsx
Figure 3—figure supplement 2
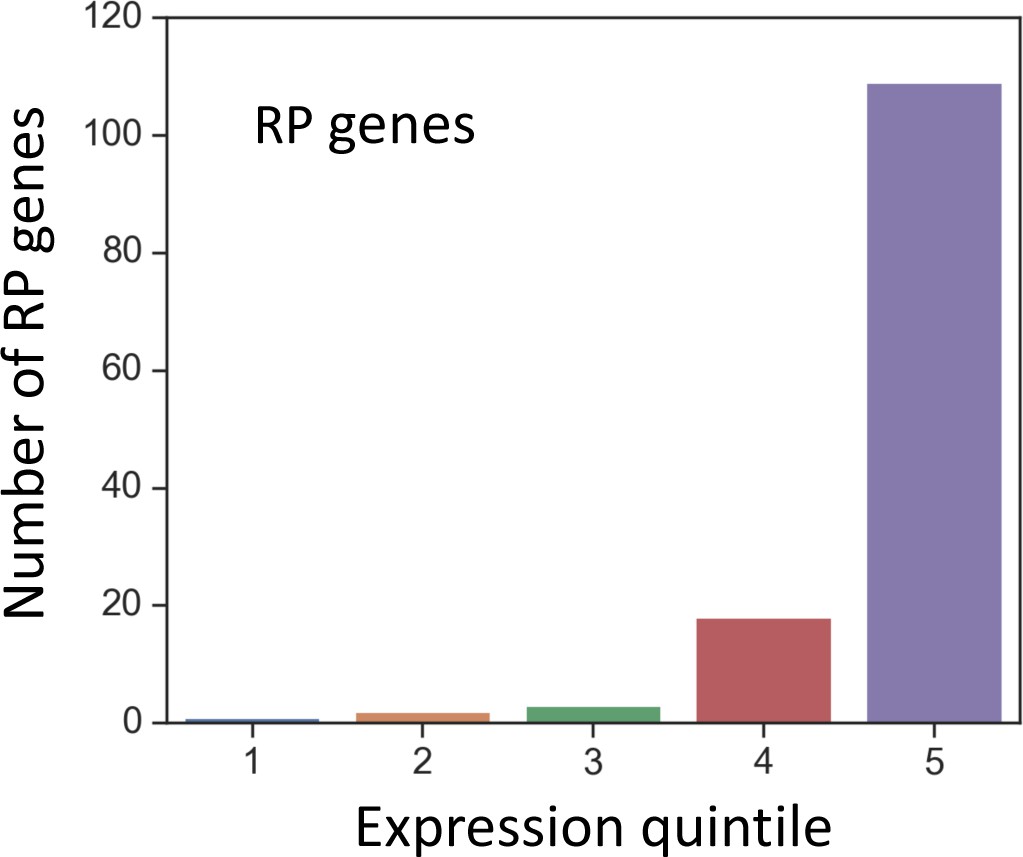
The number of ribosomal protein (RP) genes within each expression quintile.
Figure 4
Changes in transcription (from 4thioU RNA-seq) observed in the SAGA deletion strains and in the Spt3/7 degron strain after rapid depletion.
Mean values from replicate experiments are plotted and the genes are divided into TFIID-dependent and coactivator-redundant (CR) categories.
Figure 5 with 2 supplements
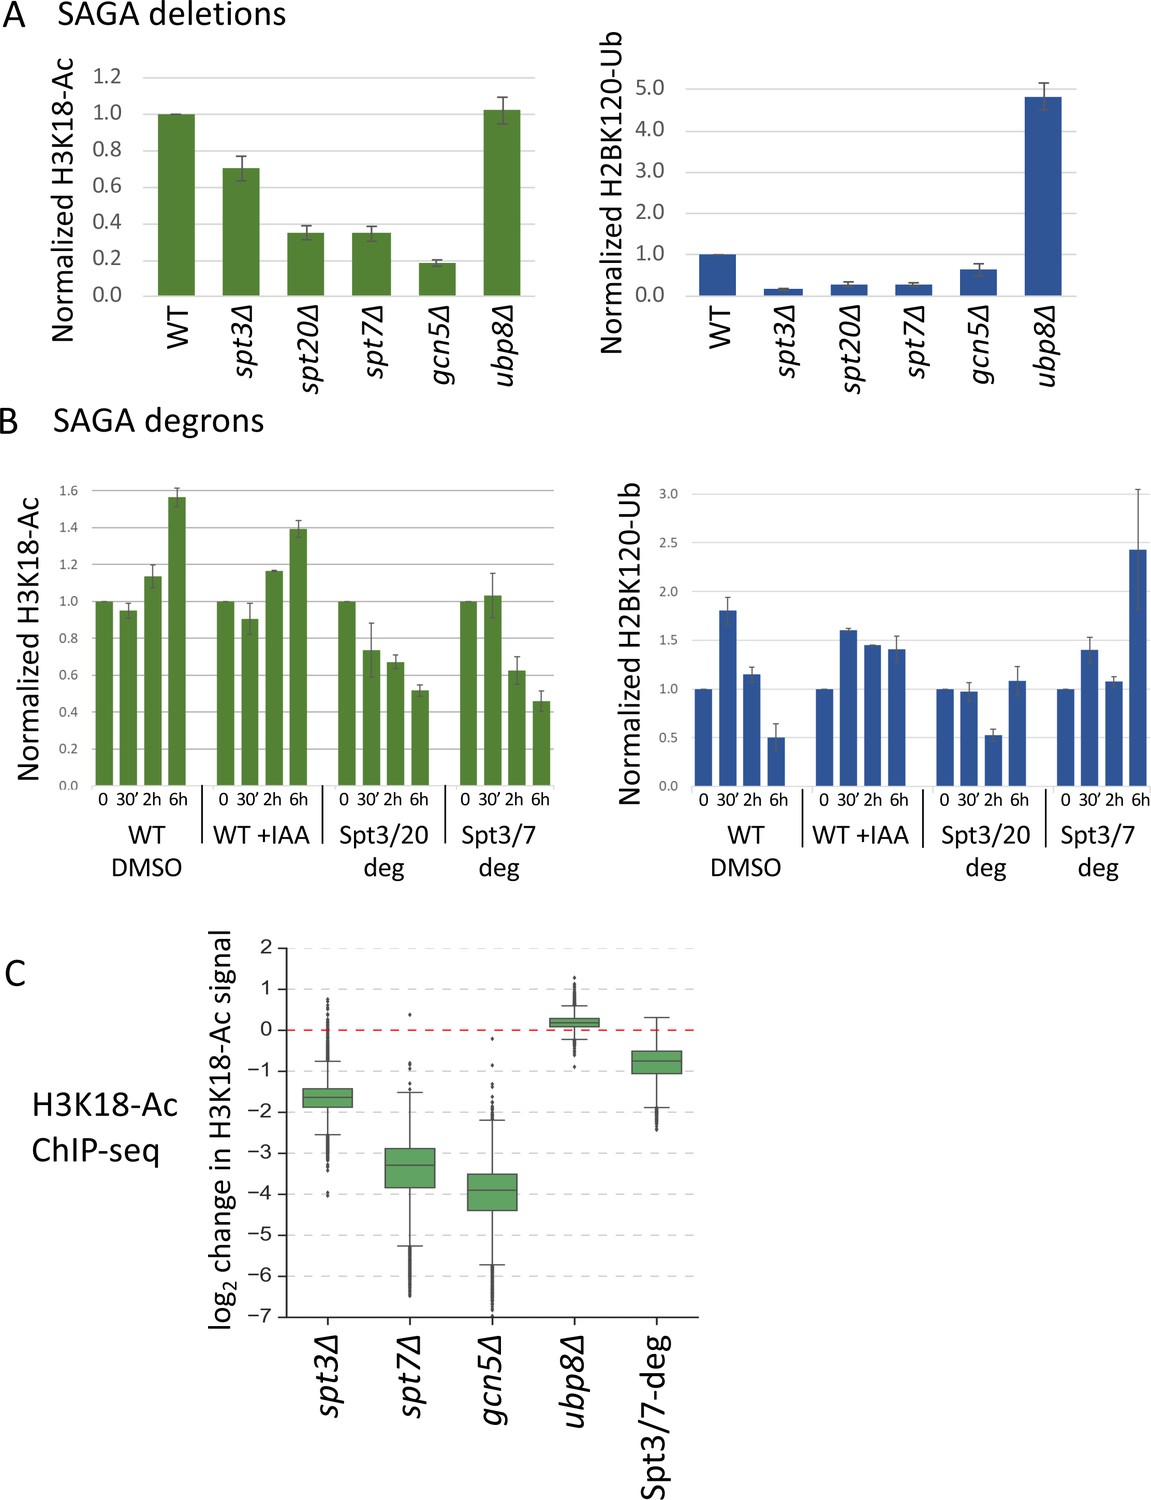
Histone modifications in SPT deletion and degron strains.
(A, B) Quantitation of total H3K18-Ac and H2B-Ub in the SPT deletion and degron strains, normalized to the TFIIH subunit Tfg2 as a loading control. Data are from Figure 5—figure supplement 1. In panel (B), time after IAA or DMSO addition is indicated. (C) Box plot showing the ChIP-seq assayed log2 change per gene in H3K18-Ac signal in the SAGA deletion mutants and Spt3/7 degron strain. Degron strain was treated for 30 min with IAA before formaldehyde crosslinking. Mean values from replicate experiments are plotted.
-
Figure 5—source data 1
Quantification of western blot results presented in Figure 5—figure supplement 1.
Data was used to make graphs in Figure 5AB.
- https://cdn.elifesciences.org/articles/50109/elife-50109-fig5-data1-v2.xlsx
Figure 5—figure supplement 1
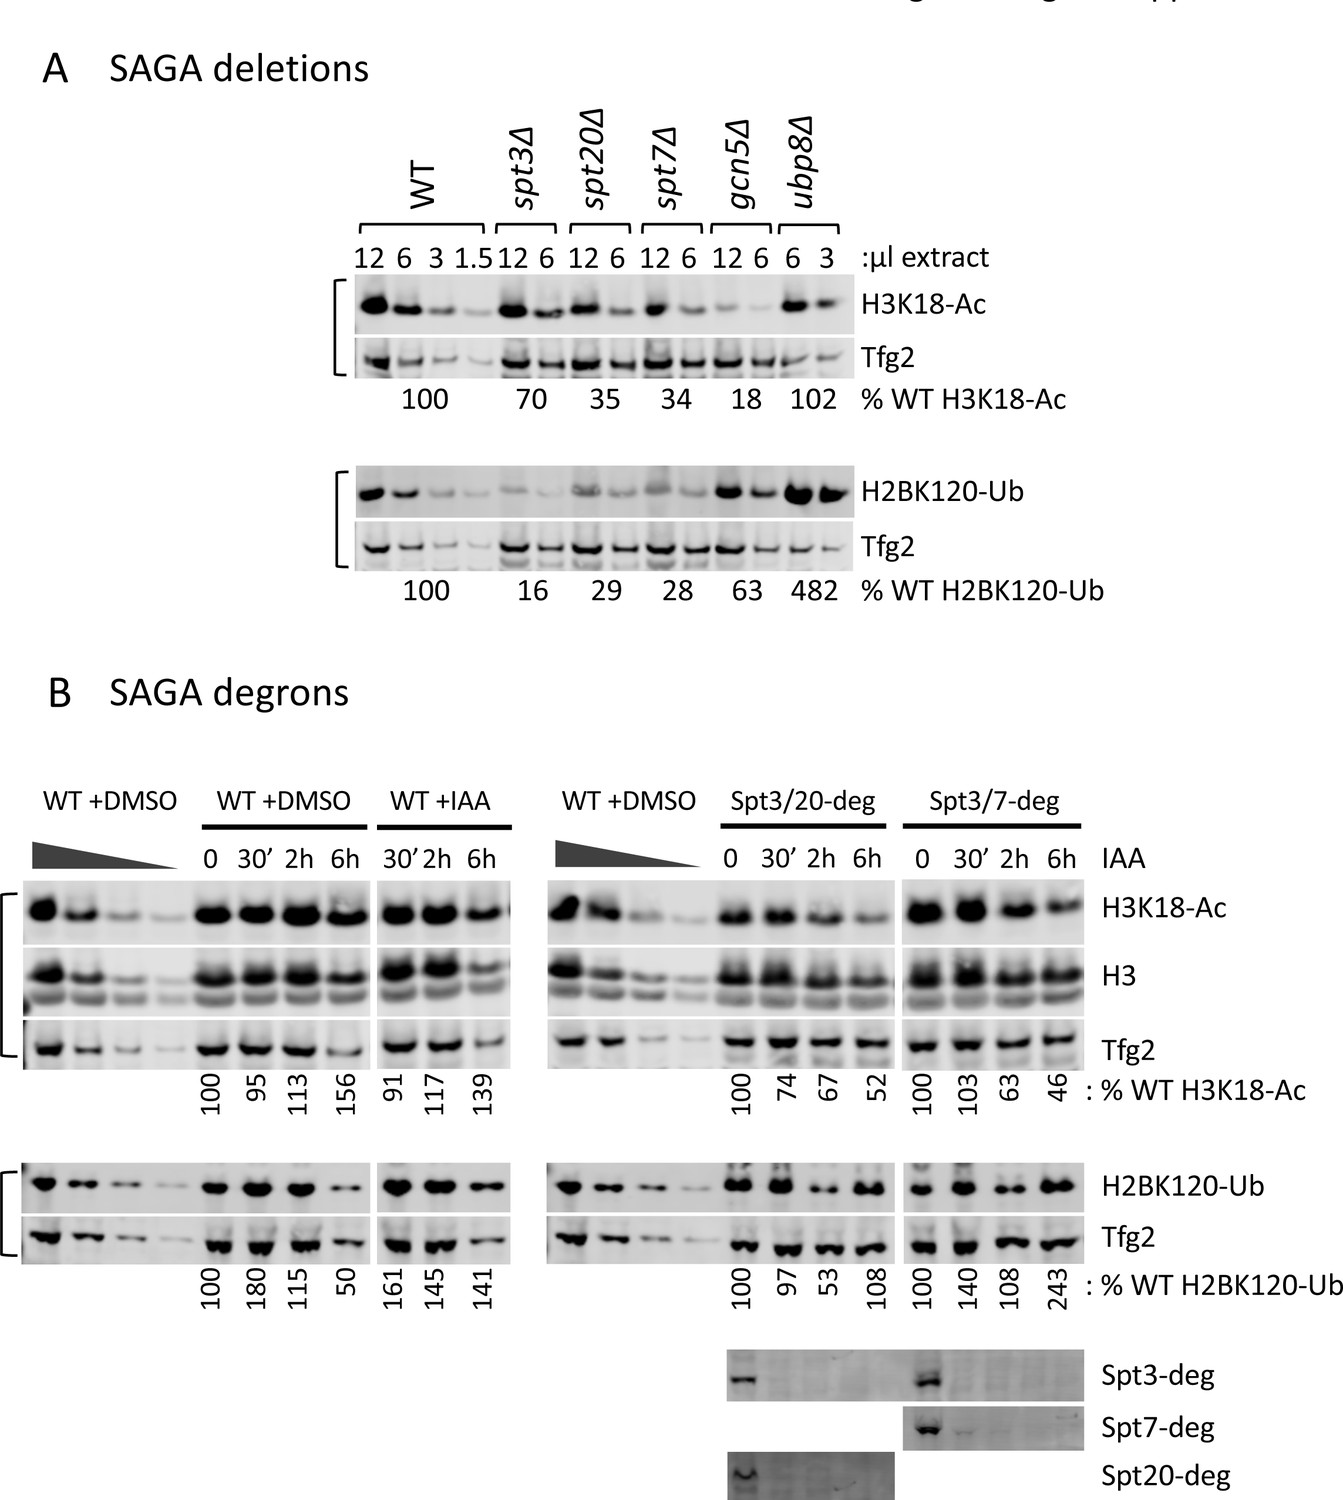
Histone modifications in SPT deletion and degron strains.
(A, B) Quantitation of total H3K18-Ac and H2B-Ub in the SPT deletion and degron strains as indicated. Depletion of the degron-tagged subunits is also shown. Data used for quantitation in Figure 5. Variable amounts of wild-type samples without IAA treatment were loaded to allow quantitation of histone modifications. Blots were probed with α-H3K18-Ac, α-H2B-Ub, α-Tfg2, α-H3 polyclonal antibodies and α-V5 monoclonal antibodies (for the degron-tagged subunit) as indicated.
Figure 5—figure supplement 2

ChIP-seq analysis of H3K18-Ac signal in the SAGA deletion mutants and Spt3/7 degron strains.
The degron strain was treated for 30 min with IAA or DMSO before formaldehyde crosslinking. (A) Genome browser images showing comparison of normalized signal at representative genomic locations. Mean values from replicate experiments are shown. (B) Box plot showing the log2 change per gene in H3K18-Ac signal in the SAGA deletion mutants and Spt3/7 degron strain. Genes are divided into two classes according to results of the k-means clustering analysis of SAGA deletion and TFIID degron experiments from Figure 1. Mean values from replicate experiments are plotted. (C) Correlation matrix of Pearson correlation coefficient values between log2 changes in H3K18-Ac signal in the SAGA deletion mutants and Spt3/7 degron strain. Mean values from replicate experiments were used.
Figure 6 with 1 supplement

TFIID and SAGA show widespread binding to both gene classes.
(A) Average plots of Taf1, Taf7, Taf13, Spt3 and Spt7 ChEC DNA cleavage versus free MNase cleavage. Signals were averaged for bound promoters only. (B) Venn diagram showing the overlap of bound promoters in Taf7 and Spt7 experiments. (C) Number of promoters bound by the indicated subunit of TFIID or SAGA with genes separated into coactivator-redundant and TFIID-dependent gene categories.
Figure 6—figure supplement 1
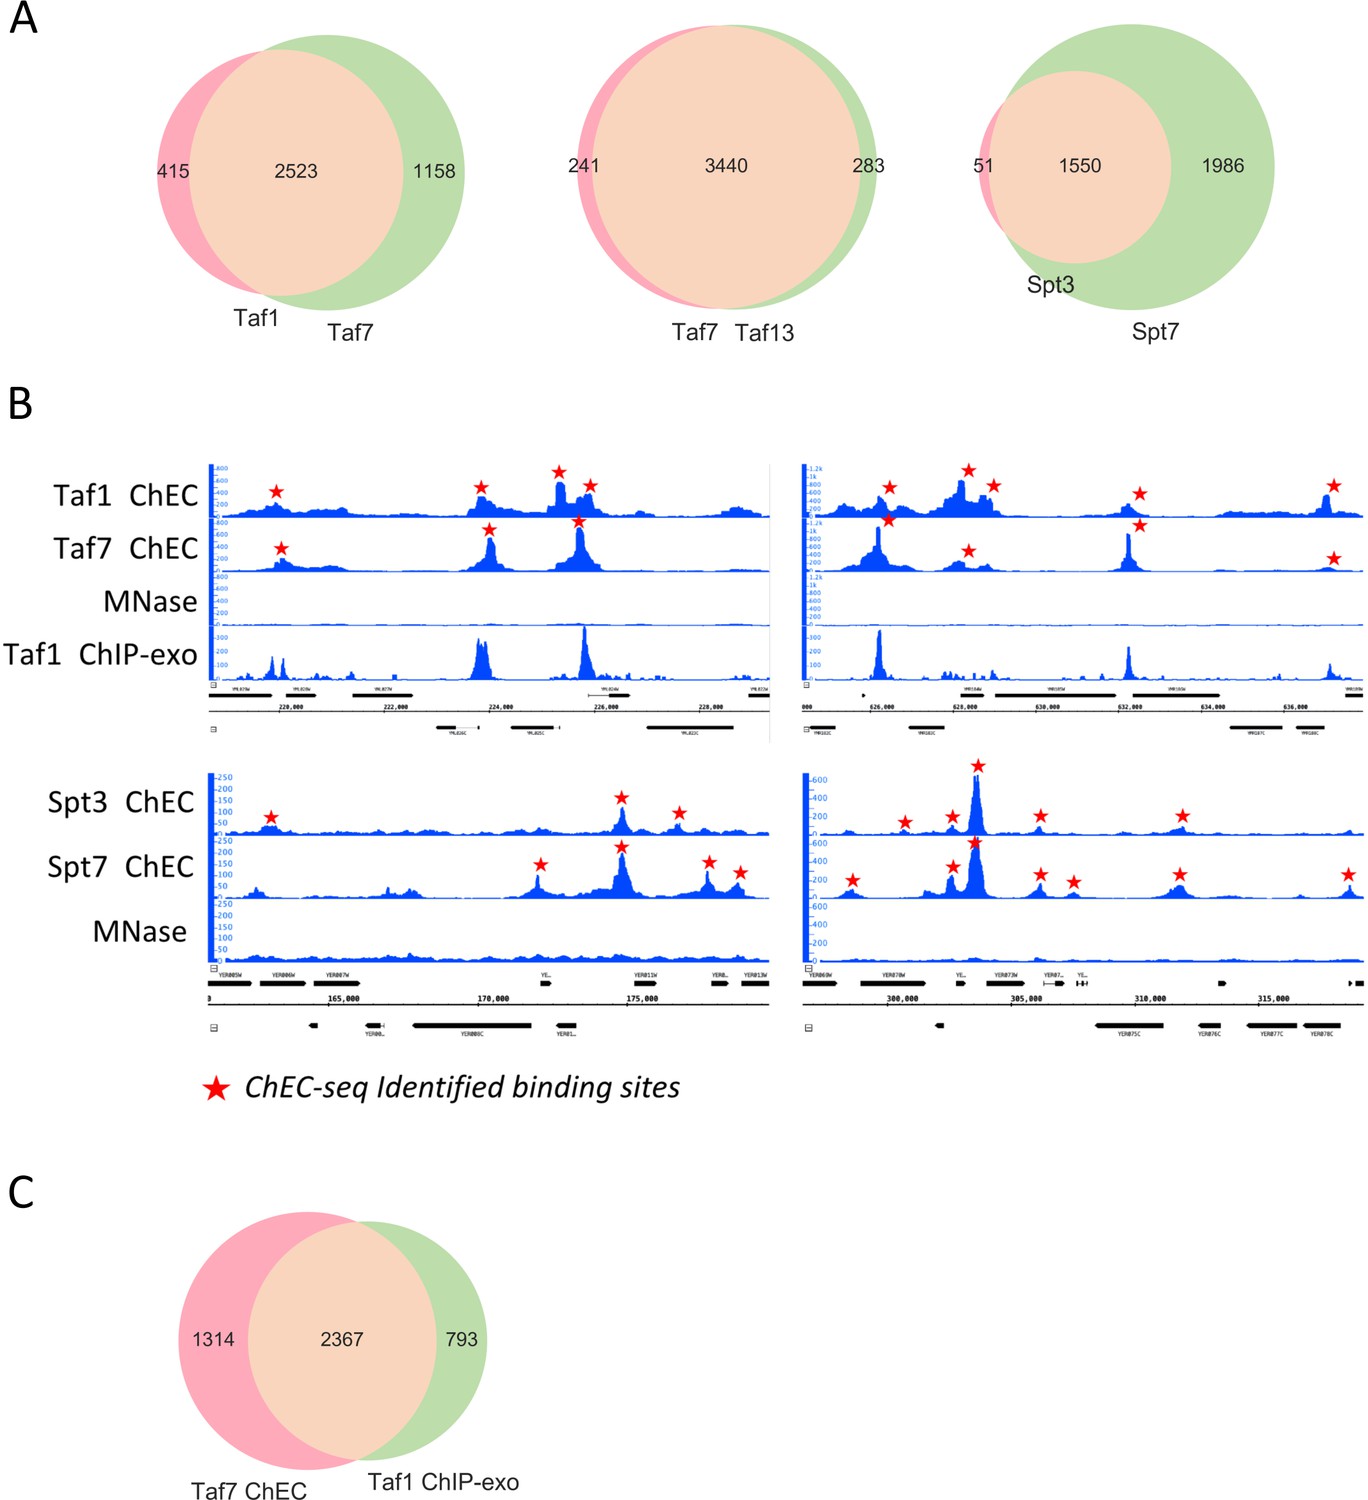
Different TFIID and SAGA subunits show extensive overlap of binding sites.
(A) Venn diagrams showing the overlap of promoters bound by different factors. (B) Genome browser images showing comparison of normalized signal at representative genomic locations. Identified binding sites, found in at least three out of four replicate experiments are marked by red stars. (C) Venn diagram comparing promoters bound by Taf1 as assayed by ChEC-seq or ChIP-exo (Vinayachandran et al., 2018).
Figure 7 with 1 supplement
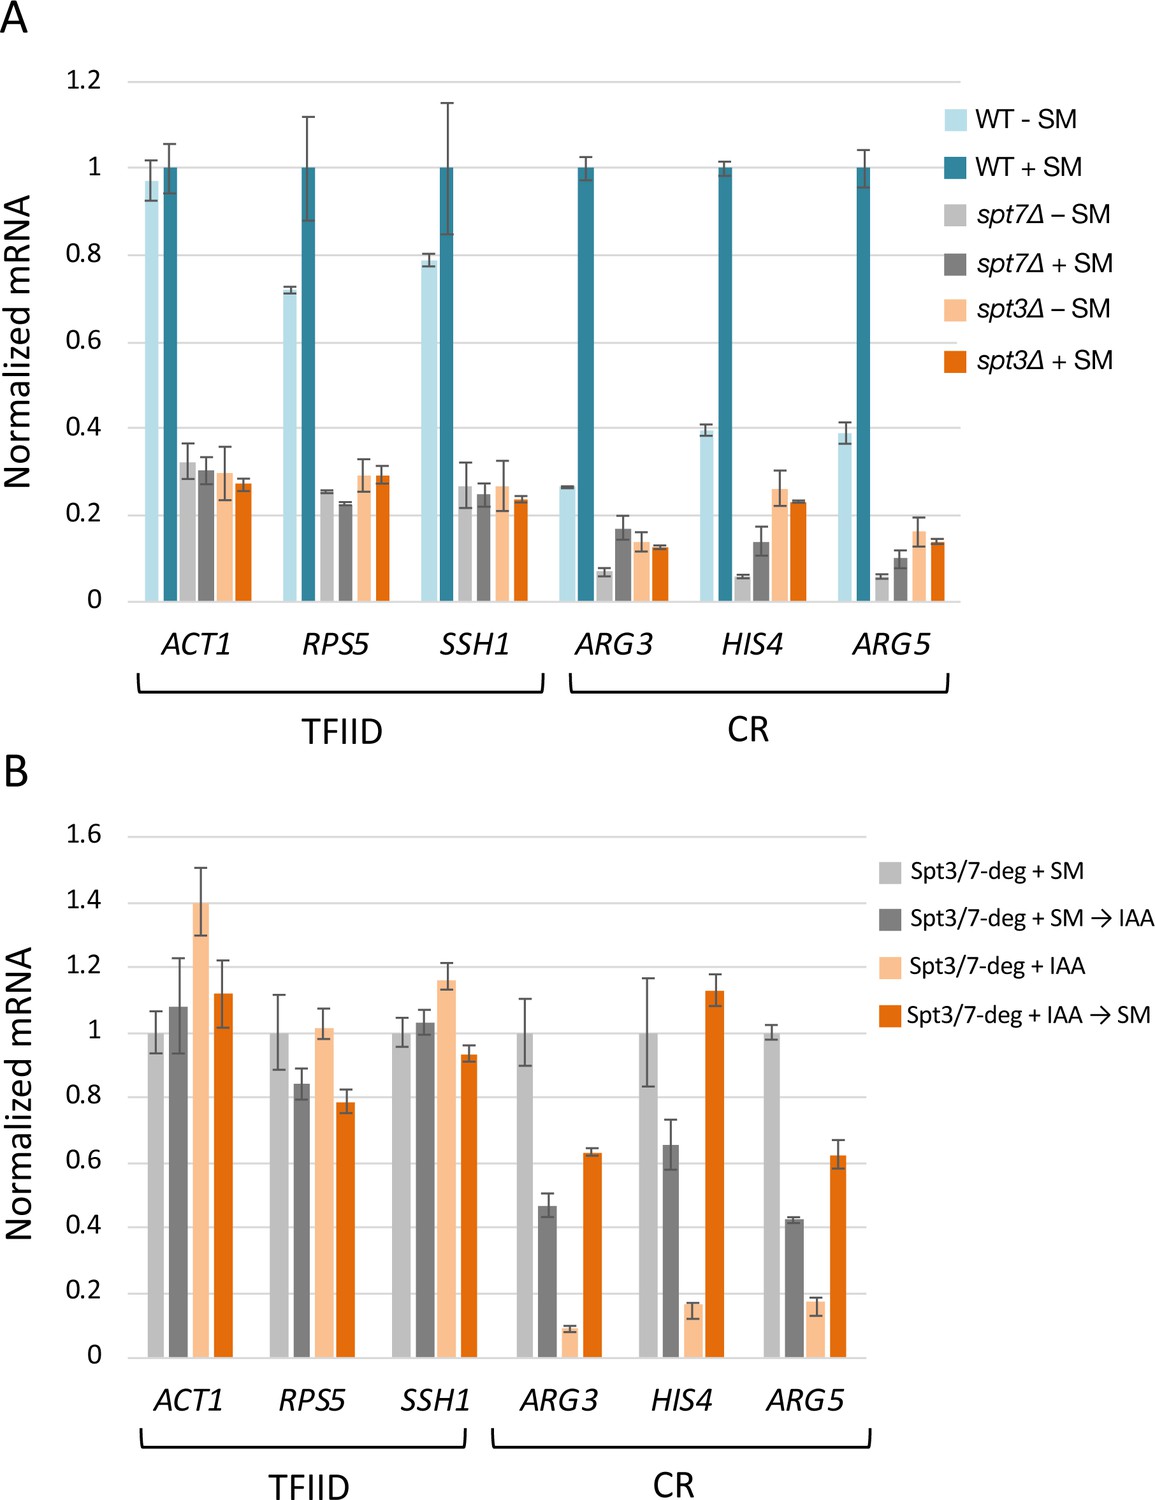
Rapid SAGA depletion does not prevent transcription activation by Gcn4.
(A) RT-qPCR analysis of 4-thio Uracil labeled RNA purified from indicated SPT deletion strains in the presence or absence of SM or (B) from SPT-degron strains induced with SM either before or after treatment with IAA. Samples were normalized by spike-in of labeled S. pombe cells before RNA isolation, and RT qPCR values from each S. cerevisiae gene were normalized to the value of the S. pombe tubulin gene. Each experiment was performed in two biological and three technical replicates. Error bars represent the standard error of the mean for two biological replicates (values obtained after averaging results for three technical replicates).
-
Figure 7—source data 1
Data from RT-qPCR analysis used for the plots in Figure 7.
- https://cdn.elifesciences.org/articles/50109/elife-50109-fig7-data1-v2.xlsx
Figure 7—figure supplement 1
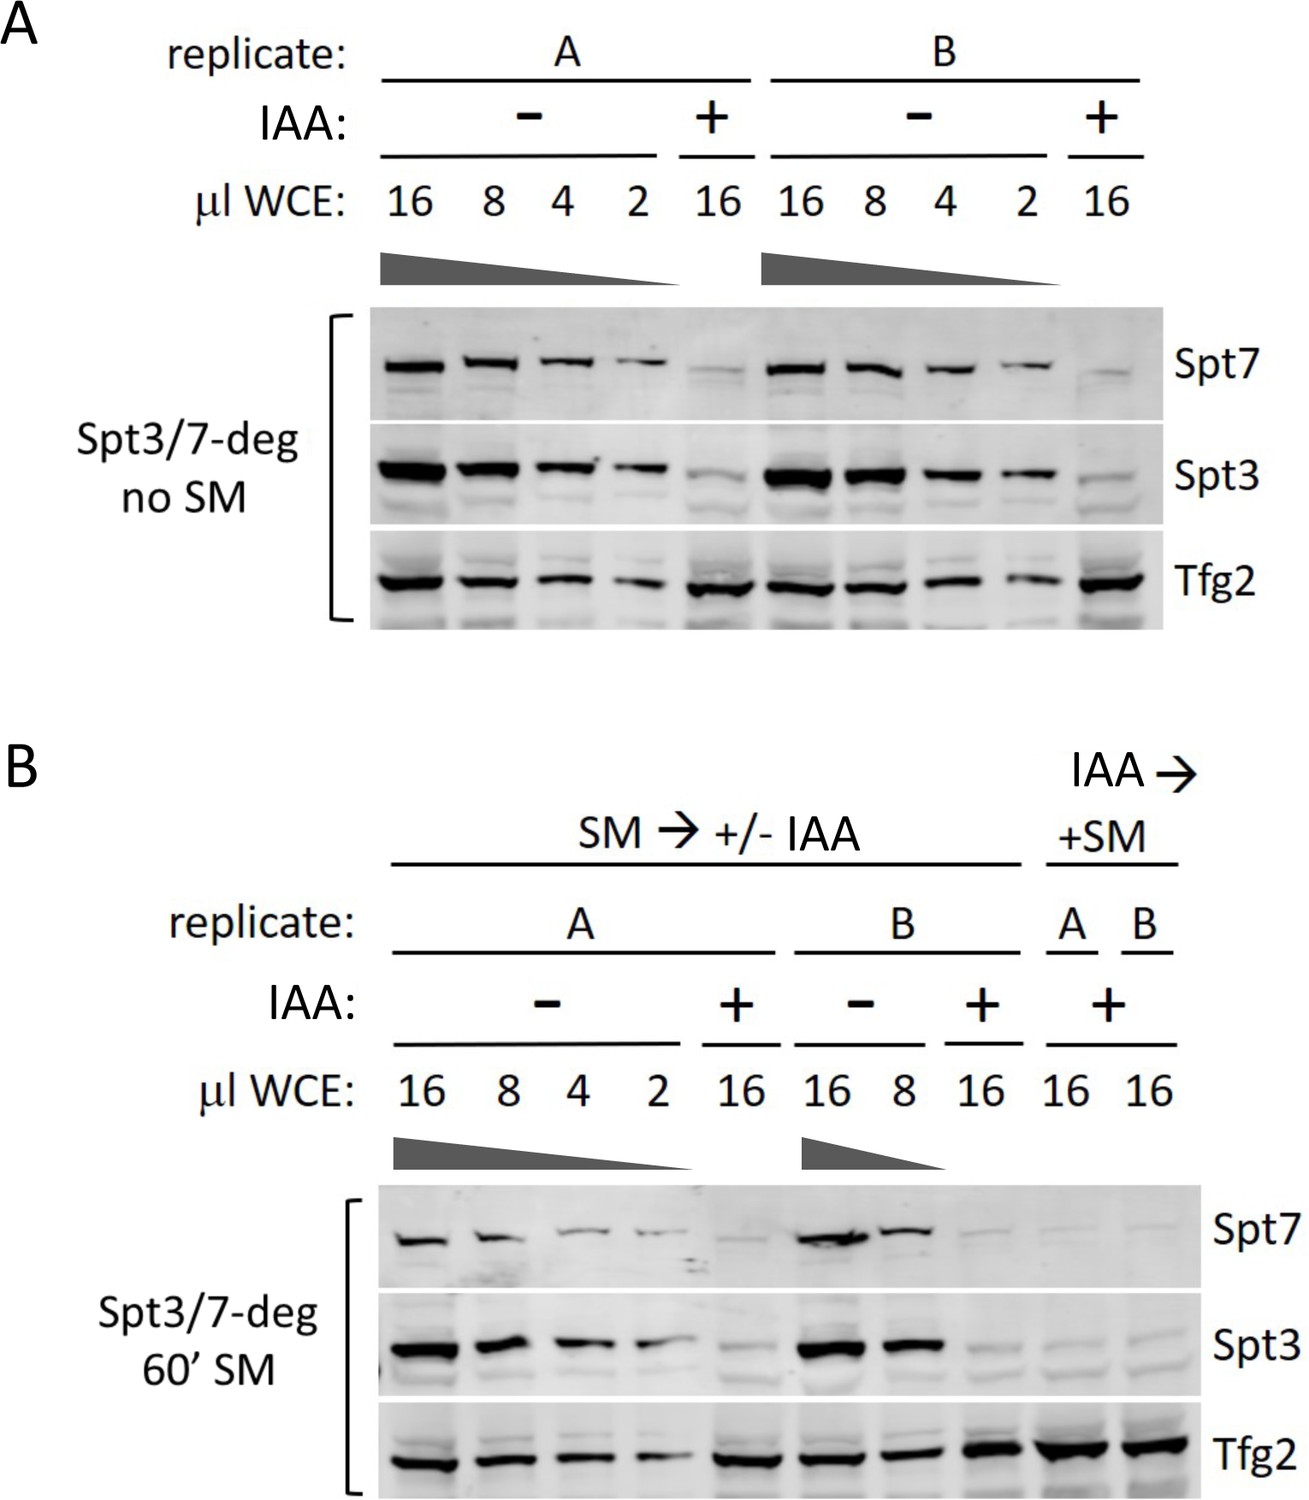
Degron efficiency in synthetic complete media with or without SM induction and IAA addition.
(A) Western analysis of the Spt/7-degron strain without SM and with or without IAA. (B) Western analysis of the Spt3/7-degron strain treated with SM either before or after IAA addition. Blot was probed with α-V5 antibody (degron-tagged proteins) and α-Tfg2 as control.
Figure 8
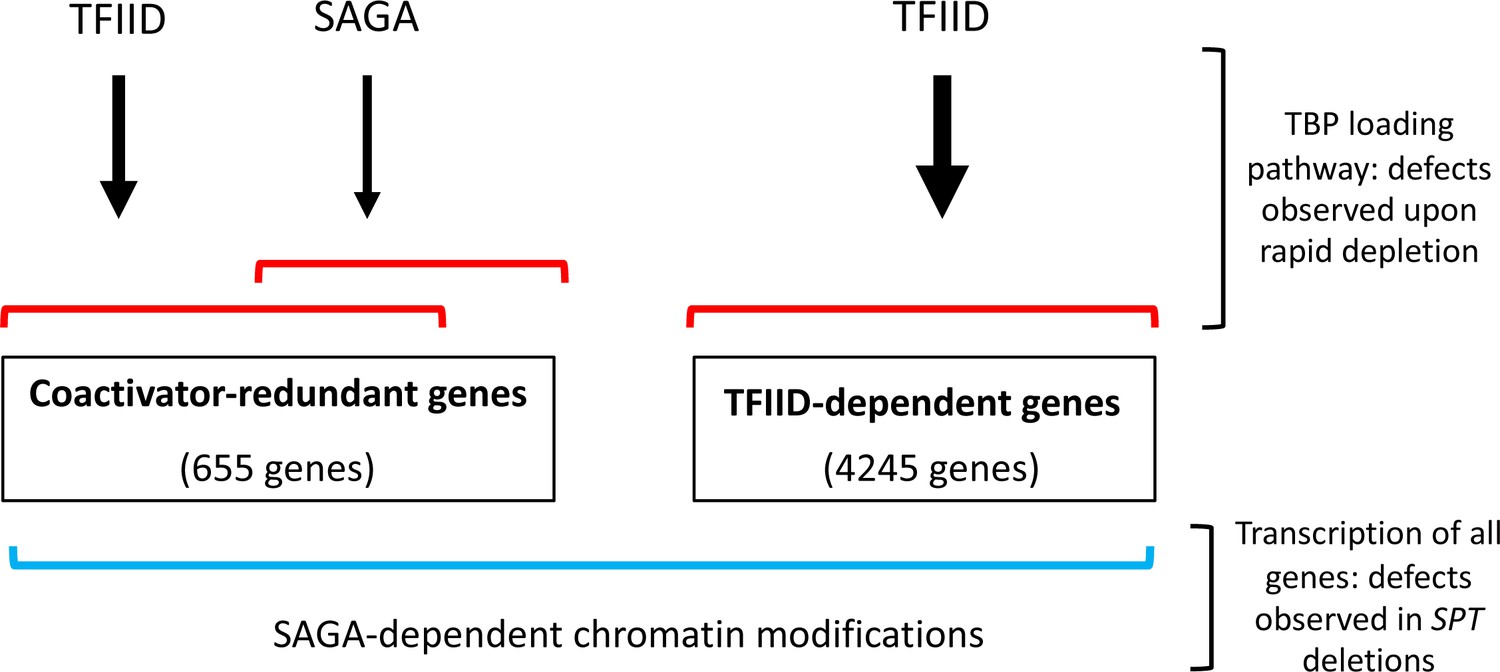
Model for roles of TFIID and SAGA and two different gene classes.
Of the ~83% of yeast protein-coding genes analyzed in this study (4900 genes), the number of genes in each class is shown. Expression of genes in the TFIID set is strongly TFIID-dependent with little or no change after rapid SAGA depletion. TFIID and SAGA both contribute to expression of the coactivator-redundant genes where these factors have substantial overlapping function as revealed by rapid depletion experiments. Prior work suggests that these effects are due in part to the TBP-promoter DNA loading functions of TFIID and SAGA. Expression of nearly all genes is dependent on a separate function of SAGA, revealed by deletions in SAGA subunit genes, that is strongly linked to chromatin modifications that change slowly after rapid SAGA depletion.
Additional files
-
Supplementary file 1
Spike-in normalized signal for all genes (5158) which had detectable transcription in 48 RNA-seq samples collected in this study (samples for simultaneous depletion of SAGA and TFIID, GCN5 and UBP8 deletion experiments and WT control auxin experiment were not used for this analysis).
Expression column is the average signal for all DMSO and WT samples. This value was further normalized by the gene length to give normalized expression which was used to sort the genes from the highest to the lowest expression.
- https://cdn.elifesciences.org/articles/50109/elife-50109-supp1-v2.xlsx
-
Supplementary file 2
Average spike-in normalized signal for replicate experiments for the final set of 4900 genes analyzed in this study and average expression per gene (based on DMSO and WT experiments).
Rows are sorted by the average expression.
- https://cdn.elifesciences.org/articles/50109/elife-50109-supp2-v2.xlsx
-
Supplementary file 3
Average log2 changes in transcription in the degron and deletion strains, results of k-means clustering and average expression per gene (based on DMSO and WT experiments).
Rows are sorted by the average expression.
- https://cdn.elifesciences.org/articles/50109/elife-50109-supp3-v2.xlsx
-
Supplementary file 4
Average log2 changes in transcription from degron experiments simultaneously depleting SAGA and TFIID components (Spt3/Taf13 and Spt7/Taf13).
Data for other strains, results of k-means clustering and average expression per gene are the same as shown in Supplementary file 3. Rows are sorted by the average expression.
- https://cdn.elifesciences.org/articles/50109/elife-50109-supp4-v2.xlsx
-
Supplementary file 5
Motif enrichments found in the TFIID-dependent and coactivator-redundant gene classes.
- https://cdn.elifesciences.org/articles/50109/elife-50109-supp5-v2.xlsx
-
Supplementary file 6
Average log2 changes in transcription for GCN5 and UBP8 deletion experiments.
Data for other strains, results of k-means clustering and average expression per gene are the same as shown in Supplementary file 3. Rows are sorted by the average expression.
- https://cdn.elifesciences.org/articles/50109/elife-50109-supp6-v2.xlsx
-
Supplementary file 7
Average log2 changes in H3K18-Ac signal in the SAGA deletion mutants and Spt3/7 degron strain.
- https://cdn.elifesciences.org/articles/50109/elife-50109-supp7-v2.xlsx
-
Supplementary file 8
Average spike-in normalized ChEC signals at bound promoters for the following MNase-fusions: Taf1, Taf7, Taf13, Spt3 and Spt7.
Genes in each table are sorted by signal intensity.
- https://cdn.elifesciences.org/articles/50109/elife-50109-supp8-v2.xlsx
-
Supplementary file 9
S. cerevisiae and S. pombe strains used in this study.
Strains were validated using a combination of genetic assays, phenotypic analysis, Western analysis, PCR analysis and nucleic acid sequencing.
- https://cdn.elifesciences.org/articles/50109/elife-50109-supp9-v2.docx
-
Transparent reporting form
- https://cdn.elifesciences.org/articles/50109/elife-50109-transrepform-v2.docx
Download links
A two-part list of links to download the article, or parts of the article, in various formats.
Downloads (link to download the article as PDF)
Open citations (links to open the citations from this article in various online reference manager services)
Cite this article (links to download the citations from this article in formats compatible with various reference manager tools)
Two roles for the yeast transcription coactivator SAGA and a set of genes redundantly regulated by TFIID and SAGA
eLife 9:e50109.
https://doi.org/10.7554/eLife.50109


