Evidence that a positive feedback loop drives centrosome maturation in fly embryos
- University of Oxford, United Kingdom
Figures
Figure 1 with 1 supplement
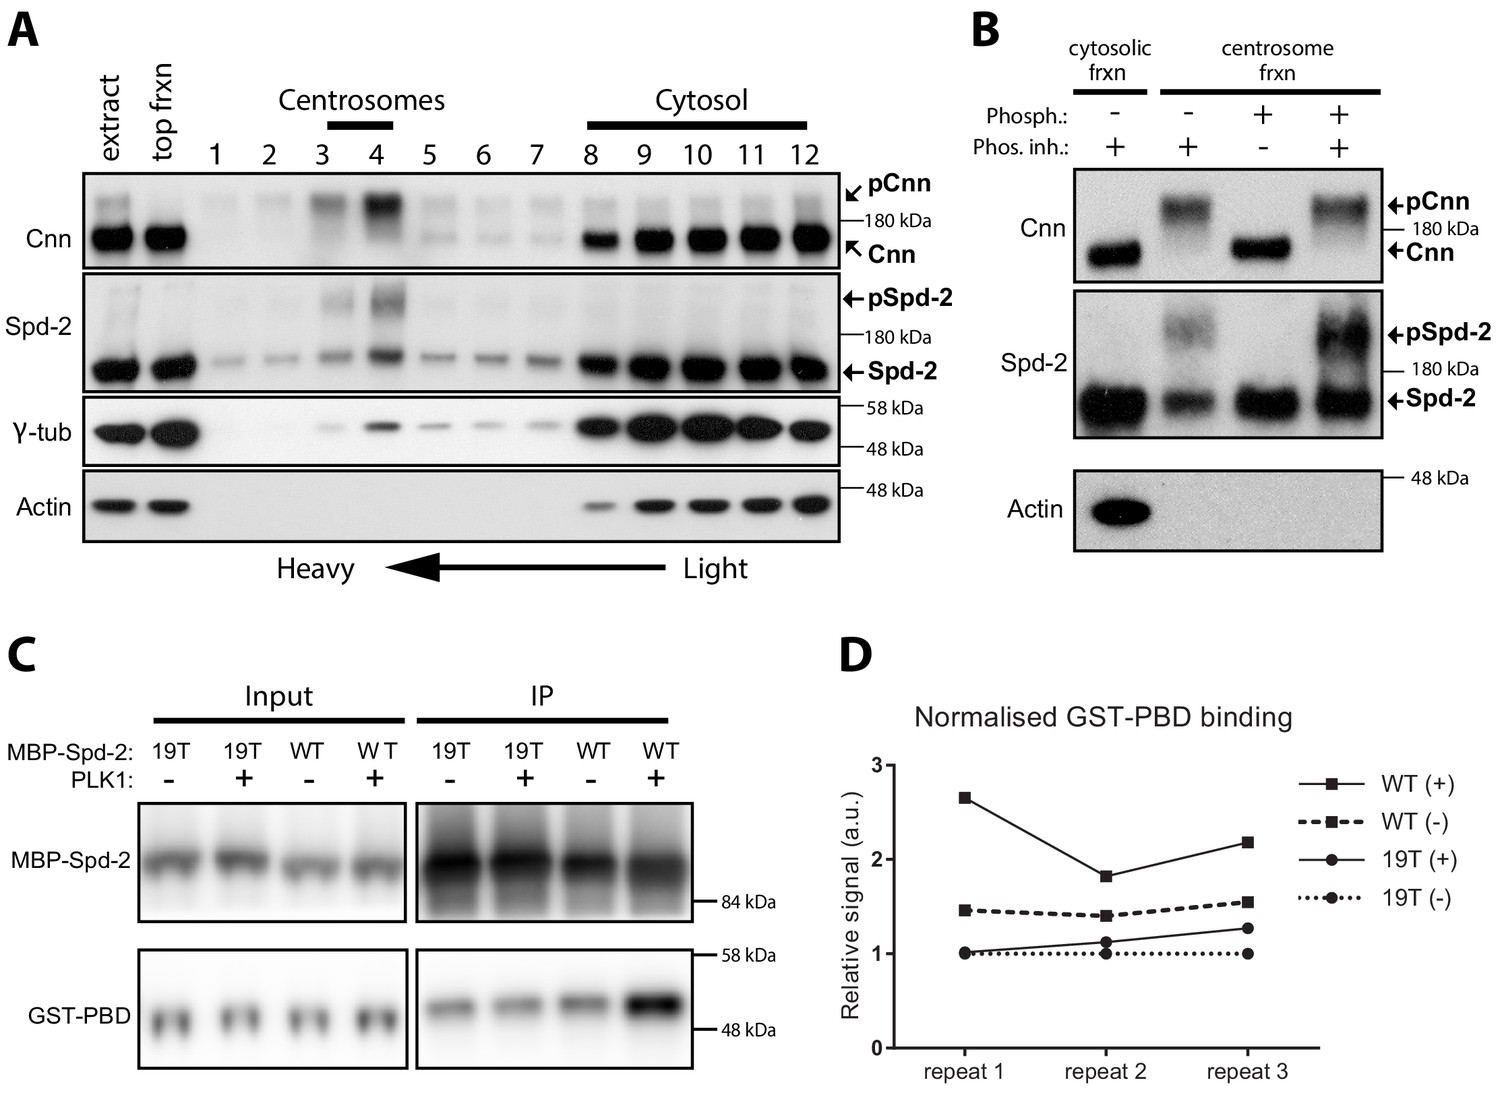
Spd-2 is phosphorylated at centrosomes and can bind the PBD in vitro in a manner that is enhanced by phoshorylation.
(A) Western blot of a sucrose step-gradient purification of centrosomes from embryo extracts probed with anti-Cnn, Spd-2, γ-tubulin and Actin antibodies, as indicated. The gradient fractions are labelled 1 (heaviest) to 12 (lightest), and the cytosolic and centrosomal-peak fractions are indicated. (B) A western blot of centrosomal fractions from the step gradient treated with phosphatase (with or without phosphatase inhibitor), and probed with the indicated antibodies; the cytosolic fraction is also shown. The Cnn and Actin blots were presented previously (Conduit et al., 2014a) (reproduced here under a CC-BY 3.0 licence https://creativecommons.org/licences/by/3.0/), and were performed contemporaneously with the Spd-2 blot shown here. The blots shown are representative of two technical replicates for each of two biological repeats. (C) Western blot of an experiment in which recombinant WT MBP-Spd-2(aa352-758) or mutant MBP-Spd-2(aa352-758)−19T were bound to MBP-Antibody-beads then either phosphorylated or not phosphorylated by human recombinant Plk1 (+/-) before mixing with human recombinant GST-PBD (Input). The beads were washed and any proteins still bound to the beads were eluted (IP). The Input and IP fractions were probed with either anti-Spd-2 antibodies (top panels) or anti-GST antibodies (bottom panels). (D) Graph shows the quantification of the amount of GST-PBD bound to the indicated beads (normalised to the amount of Spd-2 in each fraction) in three independent repeats; + /- indicates treatment with Plk1. To facilitate comparisons between repeats, the data is shown normalised to the signal from each 19T(-) sample. Enhanced binding of GST-PBD to the phosphorylated WT protein was observed in all three experiments, but was somewhat variable. Due to the variation and the small sample size (n = 3), we were unable to determine whether the data was normally distributed, so we could not apply parametric tests for statistical significance. Non-parametric tests did not indicate a significant increase in binding to the phosphorylated protein (p<0.05), but these tests do not work well with such a low number of repeats.
-
Figure 1—source data 1
Figure 1D source data, quantification of GST-PBD signal.
- https://doi.org/10.7554/eLife.50130.004
Figure 1—figure supplement 1
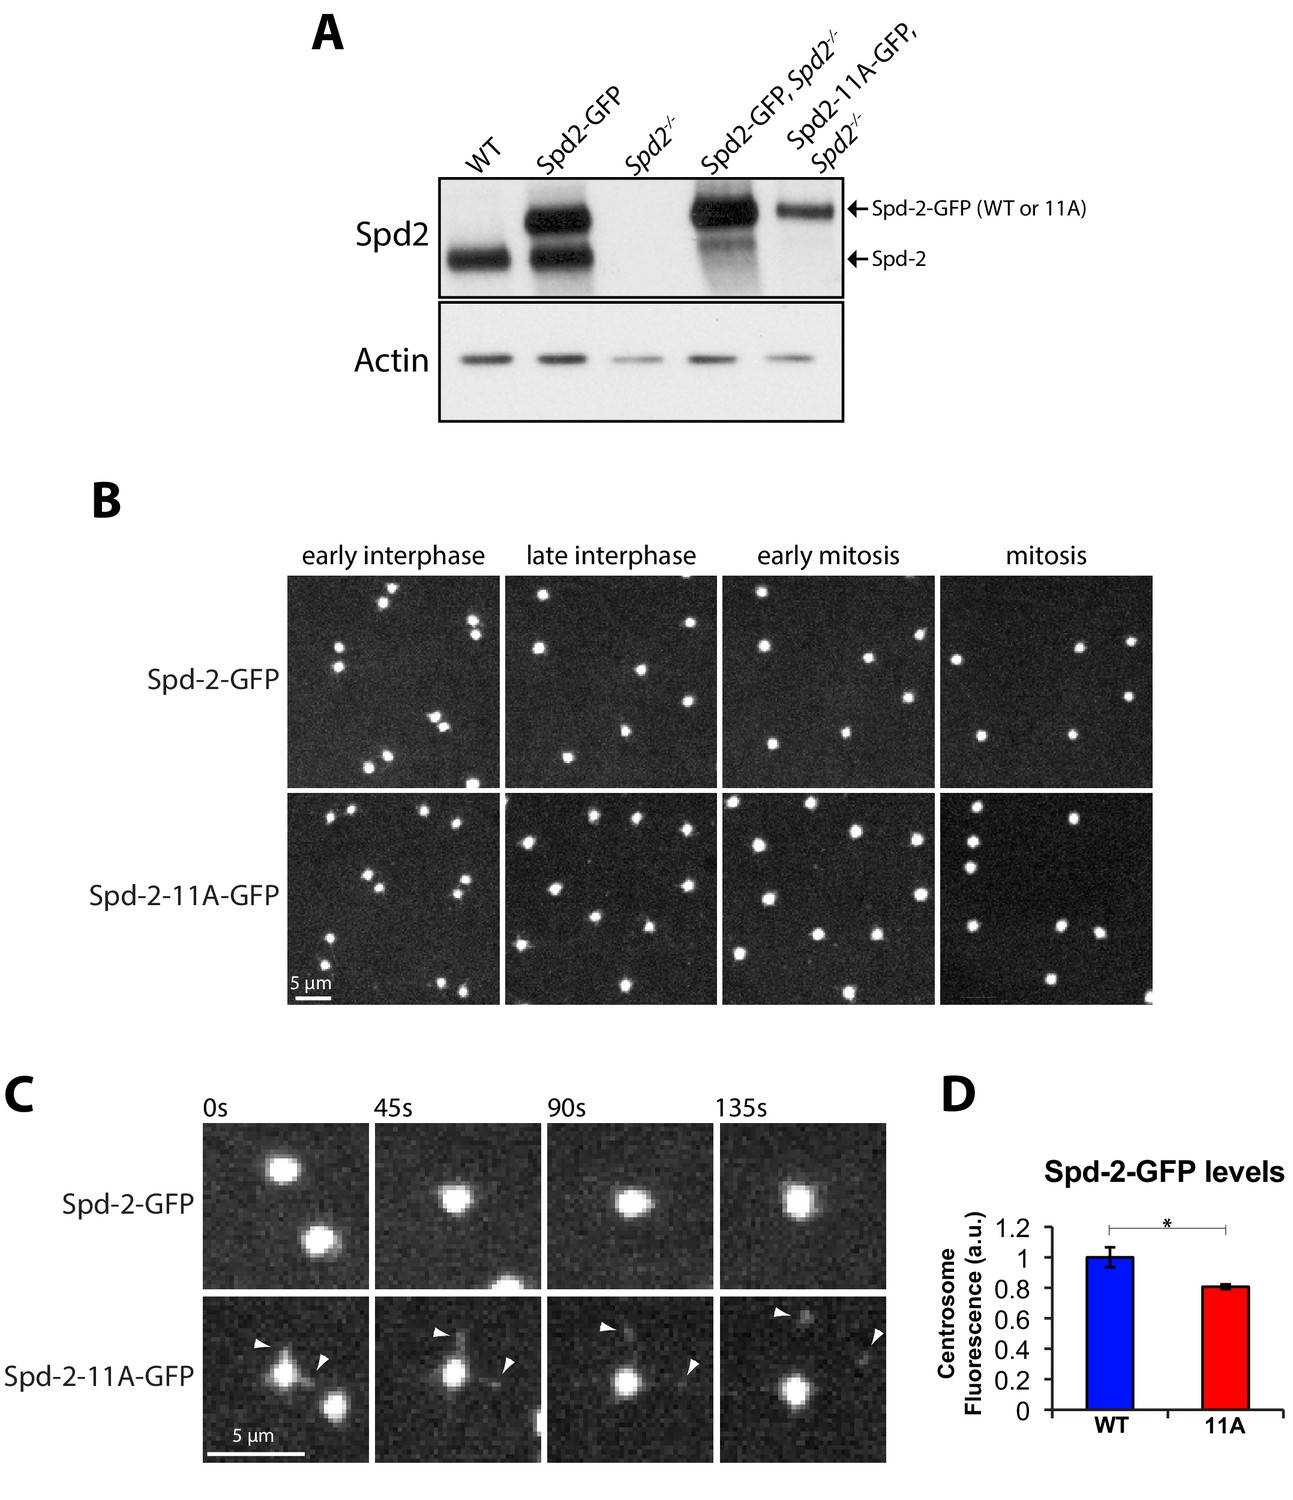
Mutation of several centrosomal phosphosites in Spd-2 appears to have only a small effect on the centrosomal function of Spd-2 in vivo.
(A) Western blot analysis of WT or Spd-2 mutant larval brain cells expressing either Spd-2-GFP or Spd-2-11A-GFP (as indicated). (B) Micrographs show stills of living Spd-2 mutant embryos expressing either Spd-2-GFP or Spd-2-11A-GFP, imaged on a spinning disk confocal microscope. Both constructs efficiently rescue the Spd2 mutant embryos (data not shown), which normally do not develop due to a failure in pronuclear fusion (Dix and Raff, 2007). (C) Micrographs show a magnified view of centrosomes, highlighting that although WT Spd-2-GFP and Spd-2-11A-GFP are both highly concentrated at centrosomes, a small number of ‘flares’ of Spd-2-11A-GFP can be detected that are constantly being ejected from the centrosomes (arrowheads); such Spd-2 flaring can occur when the PCM matrix has been weakened (Conduit et al., 2014b). (D) Graph quantifies the centrosomal fluorescent intensity of either Spd-2-GFP or Spd-2-11A-GFP at mid-late S-phase in Spd-2 mutant embryos (in arbitrary fluorescence units [a.u.], WT normalised to 1). 10 centrosomes per embryo were analysed; n = 5 embryos for each condition. Bars represent mean ± SEM. The Shapiro-Wilk normality test was used to check Gaussian distribution of the data. The difference between the two datasets was determined to be statistically significant using the unpaired t test with Welch’s correction (*, p<0.05).
-
Figure 1—figure supplement 1—source data 1
Figure 1—figure supplement 1D source data, quantification of centrosomal fluorescent intensity of either Spd-2-GFP or Spd-2-11A-GFP.
- https://doi.org/10.7554/eLife.50130.005
Figure 2 with 1 supplement
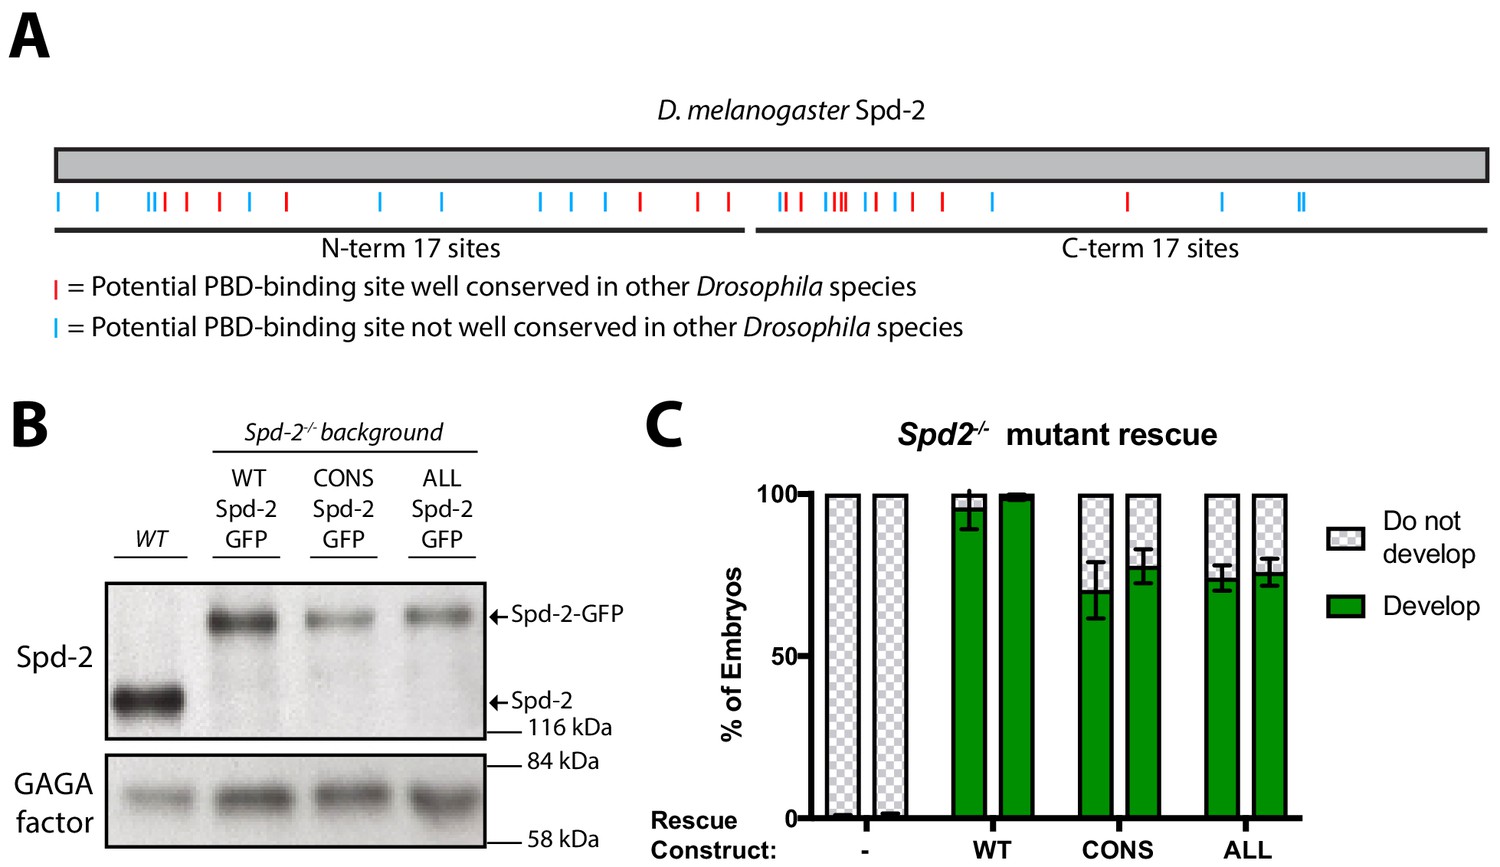
Generating forms of Spd-2 that should be unable to bind the PBD.
(A) A schematic representation of Drosophila melanogaster Spd-2, indicating the position of S-S/T motifs that are either highly conserved (present in at least 11/12 Drosophila species analysed—red lines), or not highly conserved (blue lines). (B) Western blot of WT embryos, or Spd-2 mutant embryos expressing either WT Spd-2-GFP, Spd-2-CONS-GFP or Spd-2-ALL-GFP, as indicated, probed with either anti-Spd-2 antibodies or anti-GAGA transcription factor antibodies (Raff et al., 1994) (as a loading control). The blot shown is representative of three technical replicates. (C) Bar charts quantify the percentage of Spd-2 mutant embryos that had initiated development after expression of either WT Spd-2-GFP, Spd-2-CONS-GFP or Spd-2-ALL-GFP, as indicated. The chart shows the data from two independent biological repeats in which 3 lots of >50 embryos were collected and scored independently; error bars represent the standard deviation (SD).
-
Figure 2—source data 1
Figure 2A, Figure 2—figure supplement 1 source data; Spd-2 sequence alignment.
- https://doi.org/10.7554/eLife.50130.010
-
Figure 2—source data 2
Figure 2C source data, quantification of pronuclear arrest.
- https://doi.org/10.7554/eLife.50130.015
Figure 2—figure supplement 1
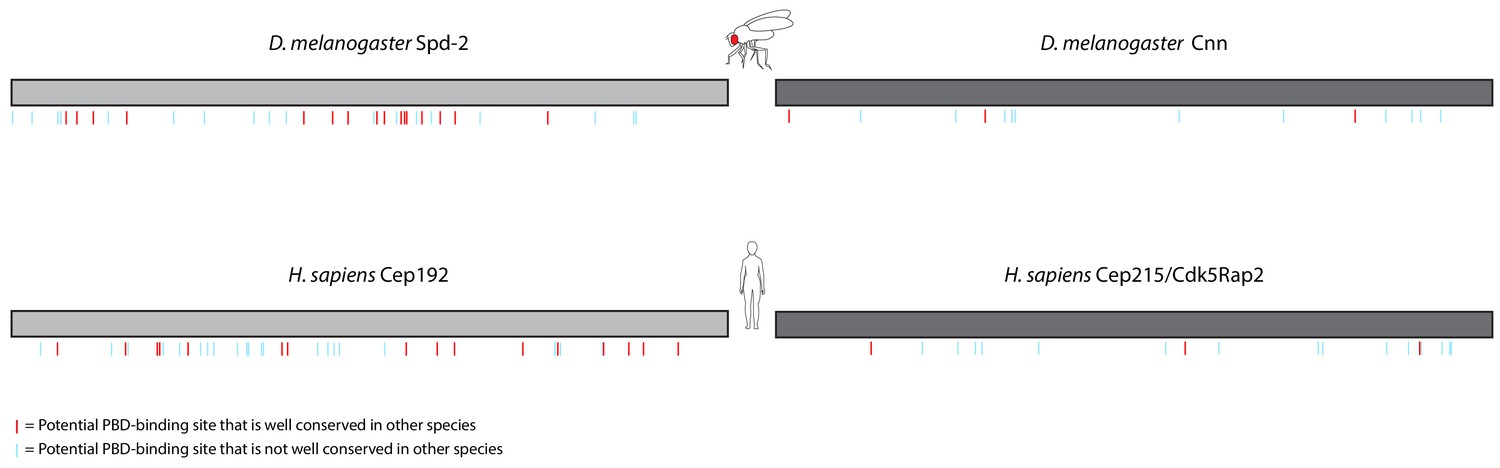
Distribution of S-S/T motifs in Spd-2/Cep192 and Cnn/Cep215 protein families.
Schematic representation of the amino acid sequences of D. melanogaster Spd-2 (1146aa) and H. sapiens Cep192 (isoform 1, 1941aa) (light grey), and D. melanogaster Cnn (1148aa) and H. sapiens Cep215/Cdk5Rap2 (1893aa) (dark grey). Because these proteins have different numbers of amino acids, the cartoons have been normalised to the same length for ease of comparison. The position of each S-S/T motif (potential PBD binding site) is indicated with lines underneath each cartoon: red lines indicate potential PBD-binding sites that are conserved in at least 11 of 12 Drosophila species or eight of nine mammalian species; light blue lines indicate sites that are less well conserved. Note that the fly and human homologues of Spd-2/Cep192 and Cnn/Cep215 share little sequence identity (~23% and ~24%, respectively), yet the number and overall distribution of potential PBD binding sites is quite similar. Note also that we use Isoform 1 of Cep192 in this comparison, but similar results are obtained with the longer isoform 3 (2537aa), and an analysis of both isoforms is included in the MSAs shown in the accompanying data files.
-
Figure 2—figure supplement 1—source data 1
Cep192 (isoform 3) sequence alignment.
- https://doi.org/10.7554/eLife.50130.011
-
Figure 2—figure supplement 1—source data 2
Cep192 sequence alignment.
- https://doi.org/10.7554/eLife.50130.012
-
Figure 2—figure supplement 1—source data 3
Cep215 sequence alignment.
- https://doi.org/10.7554/eLife.50130.013
-
Figure 2—figure supplement 1—source data 4
Cnn sequence alignment.
- https://doi.org/10.7554/eLife.50130.014
Figure 3

Centrosomes in Spd-2-CONS and Spd-2-ALL embryos recruit less Spd-2 and organise fewer MTs.
(A) Micrographs show stills of living Spd-2 mutant embryos expressing the MT-marker Jupiter-mCherry (red) and either WT Spd-2-GFP, Spd-2-CONS-GFP or Spd-2-ALL-GFP (green, as indicated). Time (in seconds) as the embryos progress from early S-phase (t = 0 s) to Anaphase (t = 720 s) is indicated. Embryos expressing the mutant proteins exhibited a range of mitotic defects, such as detached spindle poles (white arrowheads), that were more severe in Spd-2-ALL-GFP embryos. The Spd-2-CONS-GFP embryo shown here did not yet have any defects making it easier to compare to the WT-Spd-2-GFP embryo. (B,C) Graphs quantify the centrosomal intensity of the various Spd-2-GFP fusion proteins (B) or the centrosomal MT intensity (C) during late S-phase (t = 270 s). Each dot represents the average intensity of the five brightest centrosomes in a single embryo (n = 10, 9 and 8 embryos for WT, CONS and ALL embryos, respectively); error bars indicate the mean ± SD of each population of embryos scored. The D’Agostino–Pearson omnibus normality test was used to test for the Gaussian distribution of data. One-Way ANOVA with Tukey's multiple comparisons test was used when data passed the normality test (Jupiter-mCherry datasets); Kruskal-Wallis test with Dunn's multiple comparisons test was used otherwise (**, p<0.01; ***, p<0.001).
-
Figure 3—source data 1
Figure 3B,C source data; quantification of Spd-2-GFP and Jupiter-mCherry centrosomal intensity.
- https://doi.org/10.7554/eLife.50130.017
Figure 4
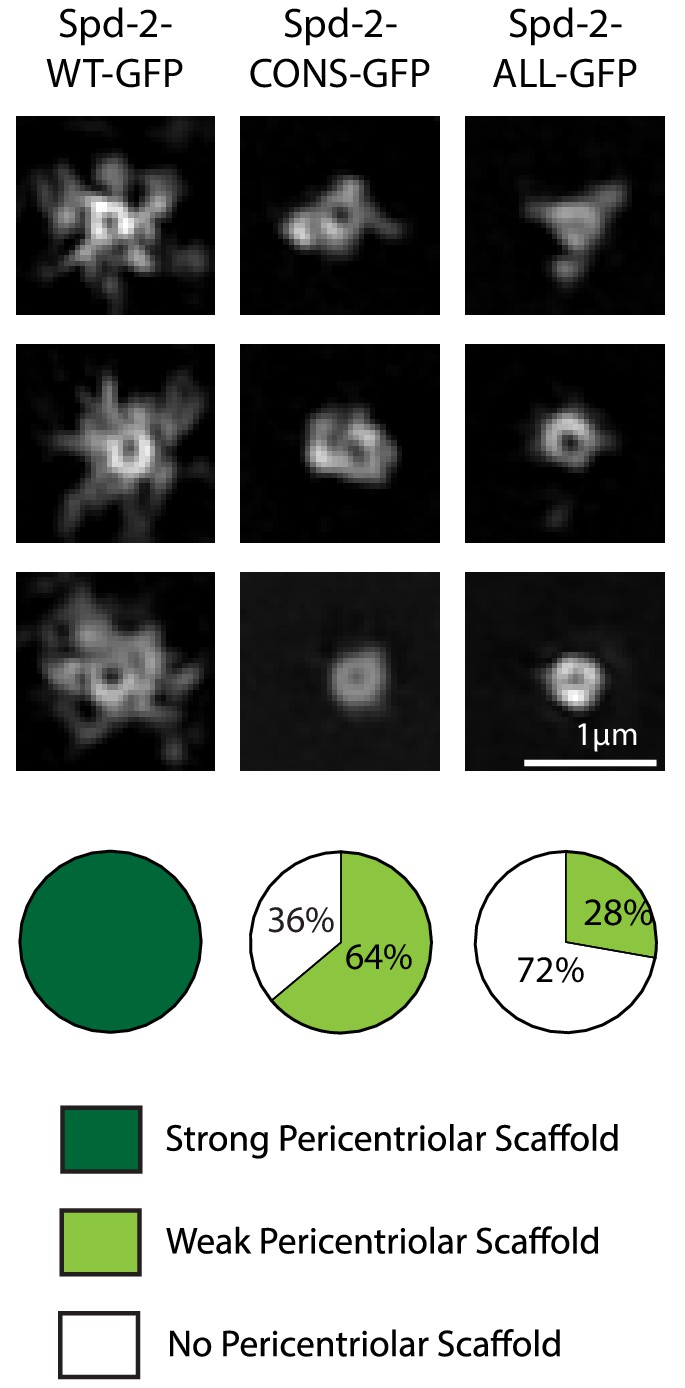
Spd-2-CONS and Spd-2-ALL do not efficiently assemble a PCM scaffold.
Micrographs show 3D-SIM images of individual centrosomes from Spd-2 mutant embryos expressing WT Spd-2-GFP, Spd-2-CONS-GFP or Spd-2-ALL-GFP (as indicated). Pie charts quantify the percentage of centrosomes that were scored qualitatively as having a strong (dark green), weak (light green) or no (white) pericentriolar scaffold (n = 36, for each genotype, respectively). In this, and all other SIM experiments, images were only included in the analysis if the reconstruction was deemed of sufficient quality by SIM-Check (Ball et al., 2015) (see Materials and methods for a full explanation of image quality control). All centrosomes were imaged in mid-late S-phase when the centrosomal levels of Spd-2 are maximal (see Figure 8). All scorings were performed blind by researchers not involved in the data acquisition.
-
Figure 4—source data 1
Figure 4 source data, results from blind scoring.
- https://doi.org/10.7554/eLife.50130.019
Figure 5 with 1 supplement
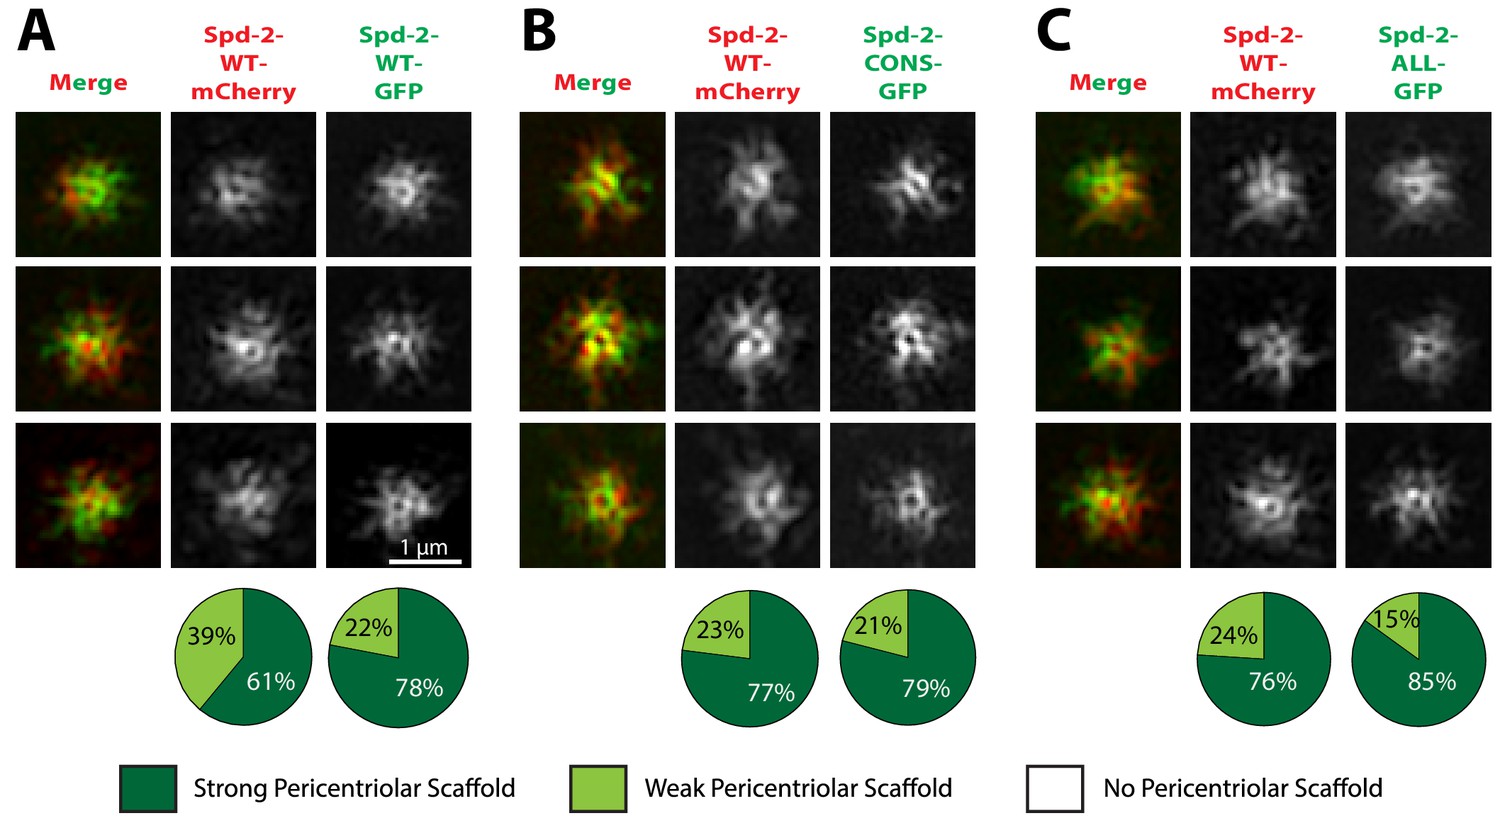
Spd-2-CONS and Spd-2-ALL can efficiently assemble into a PCM scaffold formed by WT Spd-2.
(A-C) Micrographs show 3D-SIM images of individual centrosomes from Spd-2 mutant embryos expressing WT Spd-2-mCherry and one copy of either WT Spd-2-GFP (A), Spd-2-CONS-GFP (B) or Spd-2-ALL-GFP (C). Pie charts quantify the percentage of centrosomes that were scored qualitatively as having a strong (dark green), weak (light green) or no (white) pericentriolar scaffold (n = 16 individual centrosomes, two images (channels) per centrosome, for each genotype, respectively). All centrosomes were imaged in mid-late S-phase when the centrosomal levels of Spd-2 are maximal (see Figure 8). All scorings were performed blind by researchers not involved in the data acquisition.
-
Figure 5—source data 1
Figure 5A–C source data, results from blind scoring.
- https://doi.org/10.7554/eLife.50130.022
Figure 5—figure supplement 1

Spd-2-GFP diffuses as a monomer in the cytoplasm.
Fluorescence Correlation Spectroscopy (FCS) allows one to calculate a fluorescent count-rate per molecule (CPM); graph shows the CPM of various fluorescent proteins, measured in living embryos, as indicated (mean ± SEM). Measurements from embryos expressing monomeric or dimeric NeonGreen illustrate how the CPM can clearly distinguish monomeric and dimeric proteins within living Drosophila embryos. As expected from their fluorescent properties, monomeric GFP (mGFP), here measured in vitro, exhibited a lower CPM than mNeonGreen, but Spd-2-GFP exhibited a nearly identical CPM to mGFP—indicating that Spd-2-GFP is monomeric in the embryo cytoplasm. To further confirm that Spd-2-GFP is monomeric in the cytoplasm, we compared the CPM of Spd-2-GFP in embryos expressing only Spd-2-GFP (Spd-2-GFP) and embryos expressing one copy of Spd-2-GFP and one copy of the endogenous unlabelled Spd-2 gene (Spd-2-GFP/+). No change in the CPM was observed, indicating that the Spd-2-GFP molecules cannot dimerise with the endogenous unlabelled Spd-2 to form a dimer with a reduced fluorescence. Every data point represents the average of the 6 × 10 s FCS recordings of an individual embryo. Statistical significance was assessed using unpaired t-test (****p<0.0001; ns = non significant).
-
Figure 5—figure supplement 1—source data 1
Figure 5—figure supplement 1 source data; FCS analysis.
- https://doi.org/10.7554/eLife.50130.023
Figure 6 with 1 supplement

Polo is recruited to centrioles but cannot assemble into a PCM scaffold in Spd-2-CONS and Spd-2-ALL embryos.
(A,B) Micrographs show 3D-SIM images of individual centrosomes from Spd-2 mutant embryos expressing Polo-GFP (green in merged images) and either WT Spd-2-mCherry (A) or Spd-2-CONS-mCherry (B) (red in merged images). Pie charts quantify the percentage of centrosomes that were scored qualitatively as having a strong (dark green), weak (light green) or no (white) pericentriolar scaffold (n = 15 individual centrosomes, two images (channels) per centrosome, for each genotype, respectively). All centrosomes were imaged in mid-late S-phase when the centrosomal levels of Spd-2 are maximal (see Figure 8). All scorings were performed blind by researchers not involved in the data acquisition. The defect in scaffold assembly is stronger in the Spd-2 mutant embryos expressing Polo-GFP and Spd-2-CONS-mCherry when compared to Spd-2 mutant embryos expressing just Spd-2-CONS-GFP (Figure 4). This appears to be due to a genetic interaction between Polo-GFP and Spd-2-CONS-mCherry, as mutant embryos expressing just Spd-2-CONS-mCherry had a similar phenotype to embryos expressing just Spd-2-CONS-GFP (data not shown) (see main text).
-
Figure 6—source data 1
Figure 6 source data, results from blind scoring.
- https://doi.org/10.7554/eLife.50130.026
Figure 6—figure supplement 1

Abnormal Polo-GFP and Spd-2-mCherry distribution and mitotic defects in Spd-2 mutant embryos rescued with Spd-2-CONS-mCherry or Spd-2-ALL-mCherry.
Micrographs show stills of living Spd-2 mutant embryos expressing Polo-GFP (green) and either WT Spd-2-mCherry, Spd-2-CONS-mCherry or Spd-2-ALL-mCherry (red, as indicated). Images are maximum intensity projections of z-stacks acquired on a spinning disk confocal microscope. Most embryos rescued with Spd-2-ALL-mCherry did not develop to syncytial blastoderm stages and the few that did exhibited severe defects (as in the example shown here), making it difficult to accurately stage the embryos. The primary cause of these defects is hard to assess, as these embryos tend to keep cycling through repeated cycles of division even after abnormalities occur—so they quickly accumulate defects. Nevertheless, our data are consistent with the possibility that centrosome dysfunction is the major cause of these defects.
Figure 7 with 1 supplement
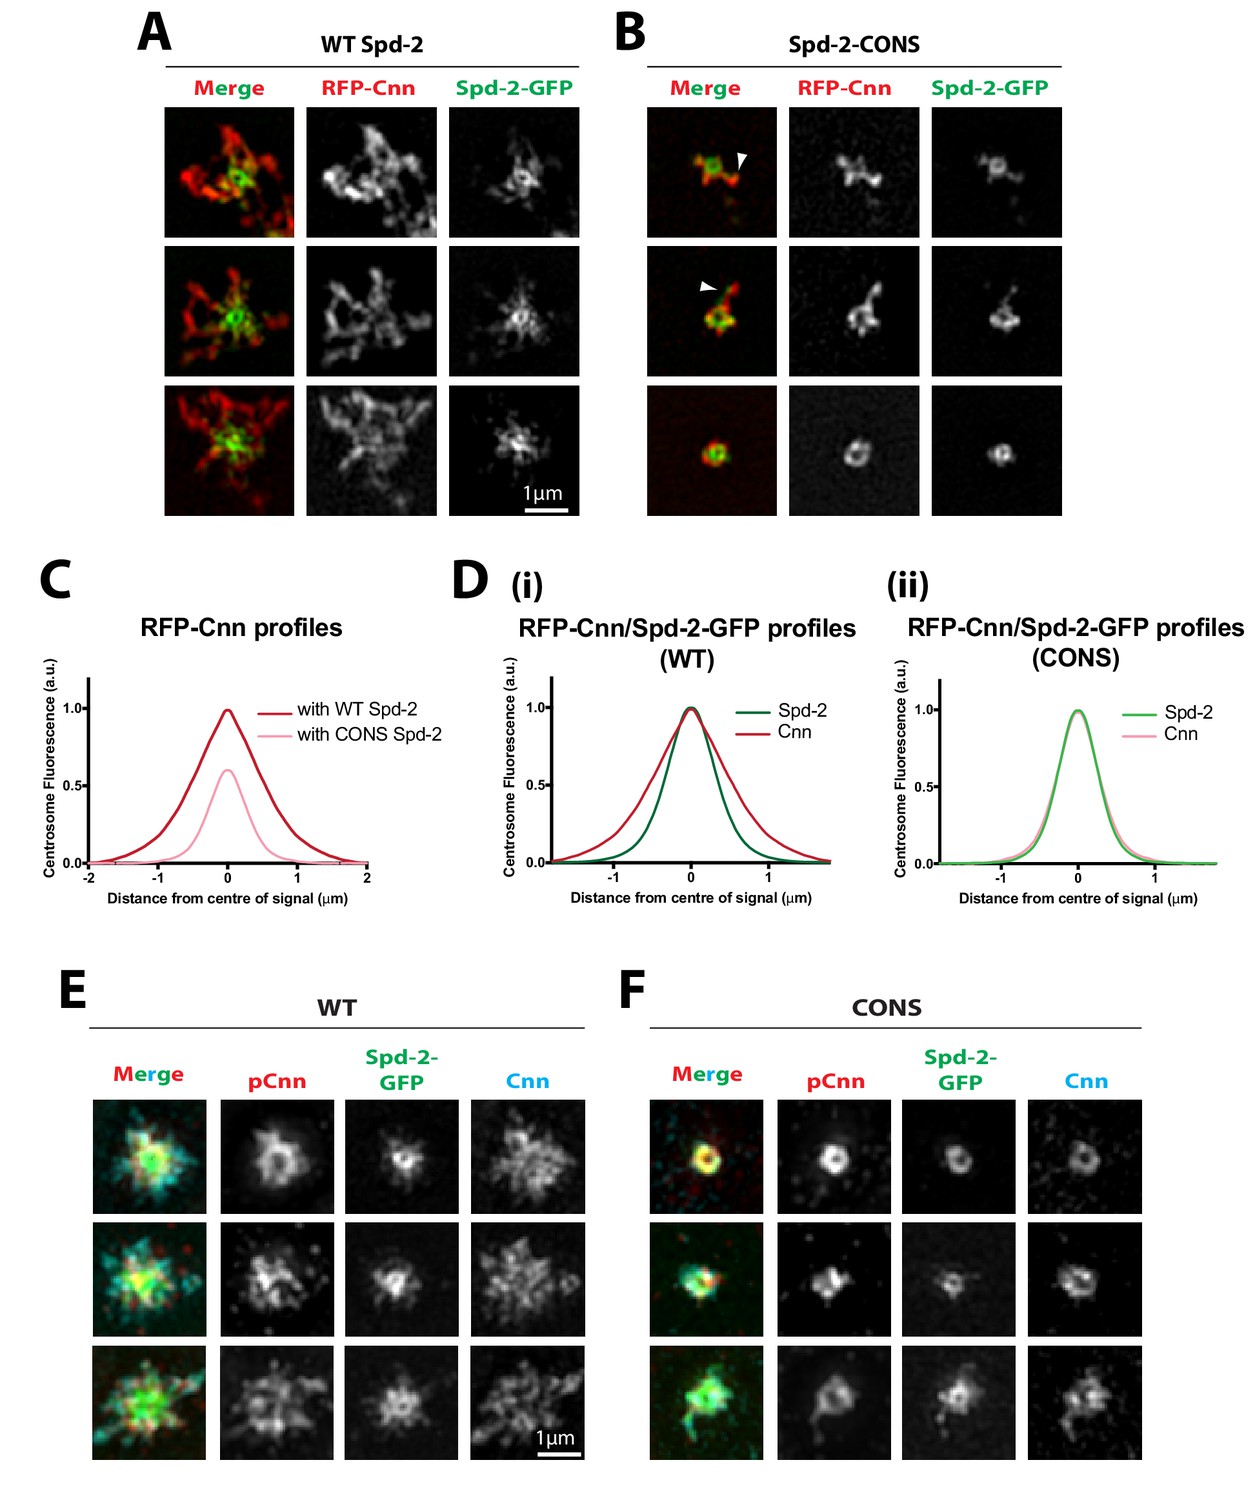
Cnn is recruited to, and phosphorylated at, centrioles in Spd-2-CONS embryos, but it does not efficiently assemble into an extended scaffold.
(A,B) Micrographs show 3D-SIM images of individual centrosomes from living Spd-2 mutant embryos expressing RFP-Cnn (red in merged images) and either WT Spd-2-GFP (A) or Spd-2-CONS-GFP (B) (green in merged images). Arrowheads indicate examples of occasional protrusions of RFP-Cnn and Spd-2-CONS-GFP. (C,D) Graphs compare the radial distributions of RFP-Cnn around the mother centriole in WT Spd-2-GFP and Spd-2-CONS-GFP embryos (C), or the radial distribution of RFP-Cnn and Spd-2-GFP in either WT Spd-2-GFP (D[i]) or Spd-2-CONS-GFP embryos (D[ii]). Data for these graphs was obtained from living embryos examined on a spinning disk confocal system; five centrosomes per embryo were analysed: n = 8 and 7 embryos for WT and CONS embryos, respectively. (E,F) Micrographs show 3D-SIM images of individual centrosomes from Spd-2 mutant embryos expressing either WT Spd-2-GFP (E) or Spd-2-CONS-GFP (F) that were fixed and stained with antibodies against GFP, phospho-Cnn, or total-Cnn (green, red and cyan in merged images, respectively).
-
Figure 7—source data 1
Figure 7C,D source data; radial profile analysis.
- https://doi.org/10.7554/eLife.50130.029
Figure 7—figure supplement 1
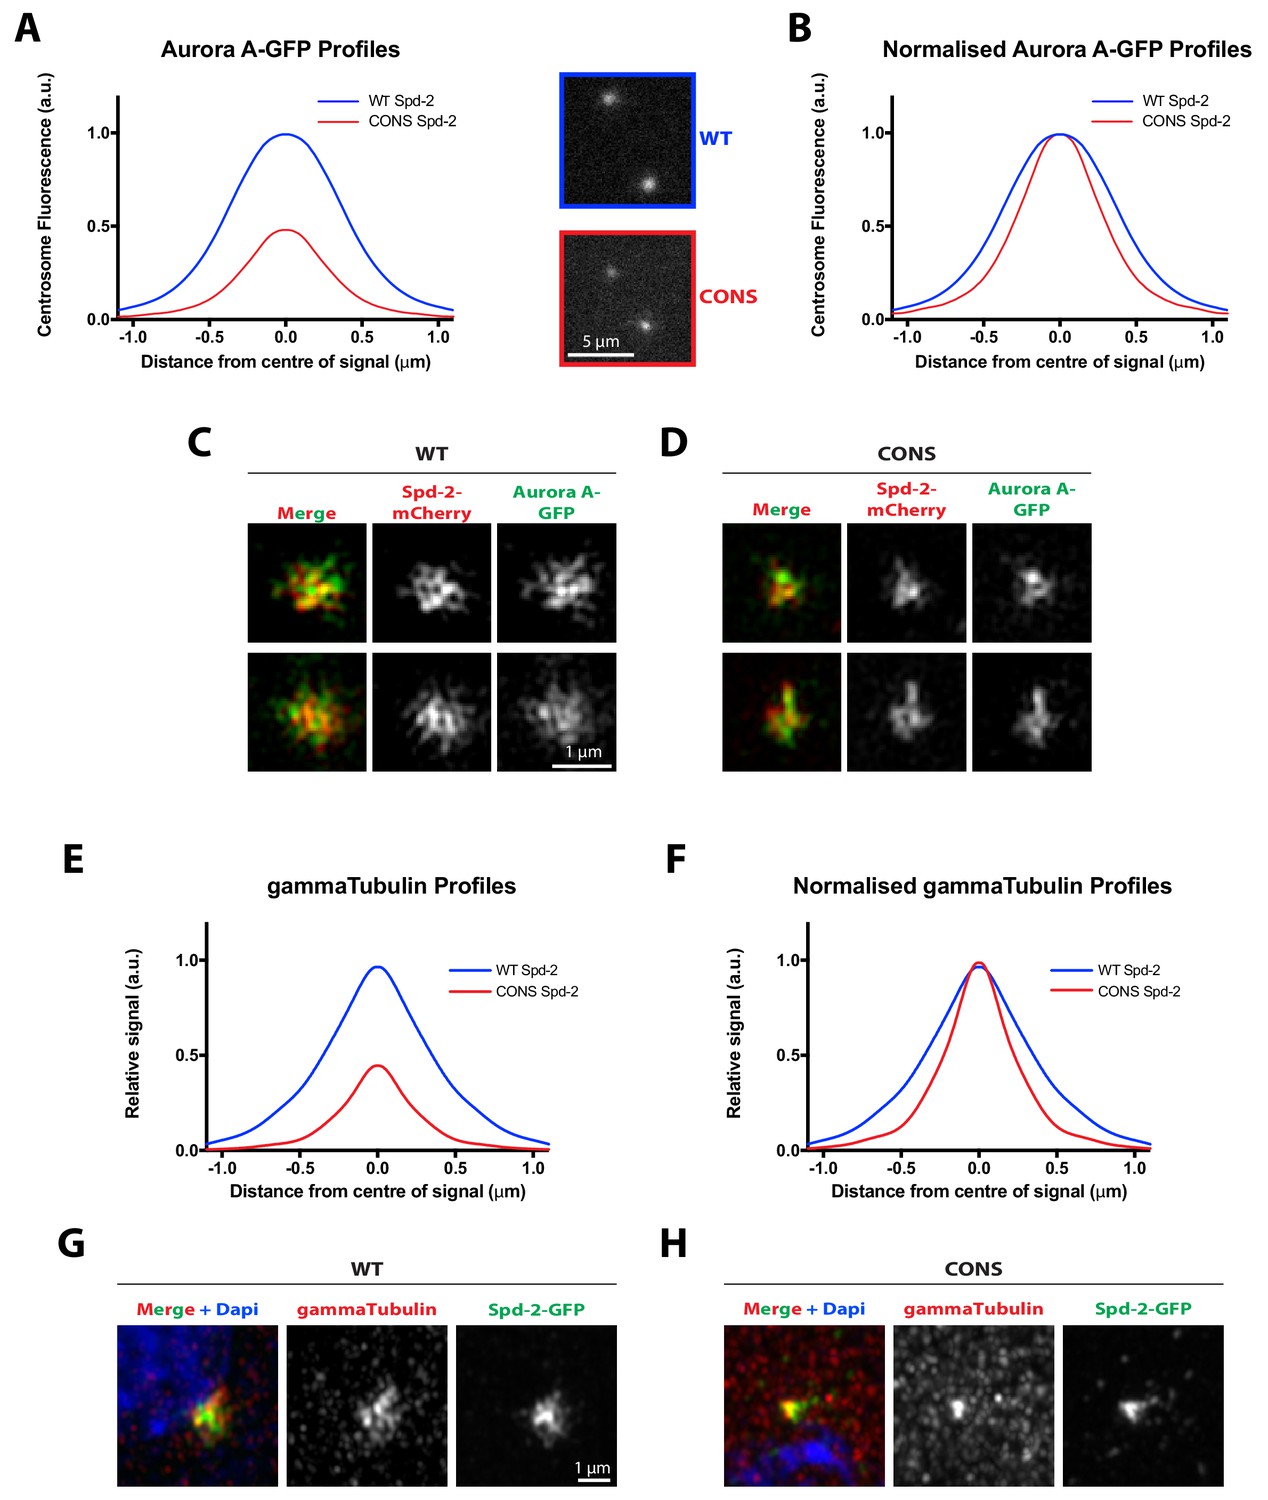
Evidence that the entire mitotic PCM does not expand outwards around the mother centriole in Spd-2-CONS embryos.
(A) Graph compares the radial distribution of the PCM component Aurora-A-GFP around the mother centriole in living WT Spd-2-mCherry (blue) and Spd-2-CONS-mCherry embryos (red). Insets show examples of typical spinning disk-confocal images used for this analysis; five centrosomes per embryo were analysed, n = 4 and 8 embryos for WT and CONS embryos, respectively. (B) Graph shows the same data as shown in (A), but normalised so that the peak intensity of both genotypes = 1. This emphasises how even if the centrosomal Aurora A-GFP signal is normalised for fluorescence intensity, Aurora A-GFP spreads out around the mother centriole to a lesser extent in Spd-2-CONS-mCherry embryos than in WT Spd-2-mCherry embryos. (C,D) Micrographs show 3D-SIM images of individual centrosomes from Spd-2 mutant embryos expressing Aurora A-GFP (green in merged images) and either WT Spd-2-mCherry (C) or Spd-2-CONS-mCherry (D) (red in merged images). (E–F) Same analysis as presented in panels (A–B), but analysing the distribution of the PCM component ɣ-tubulin in fixed embryos. For radial profiles, we analysed 1 pair of centrosomes per embryo, five embryos per technical replicate (embryos collected and processed independently), and three technical replicates, total n = 15 embryos per condition. (G–H) Micrographs show Airyscan images of individual centrosomes from Spd-2 mutant embryos expressing WT Spd-2-GFP (G) or Spd-2-CONS-GFP (H) (green in merged images) stained with an anti-ɣ-tubulin antibody (red) and DAPI (blue in merged images.
-
Figure 7—figure supplement 1—source data 1
Figure 7—figure supplement 1A,B source data; radial profile analysis.
- https://doi.org/10.7554/eLife.50130.030
-
Figure 7—figure supplement 1—source data 2
Figure 7—figure supplement 1E,F source data; radial profile analysis.
- https://doi.org/10.7554/eLife.50130.031
Figure 8 with 3 supplements
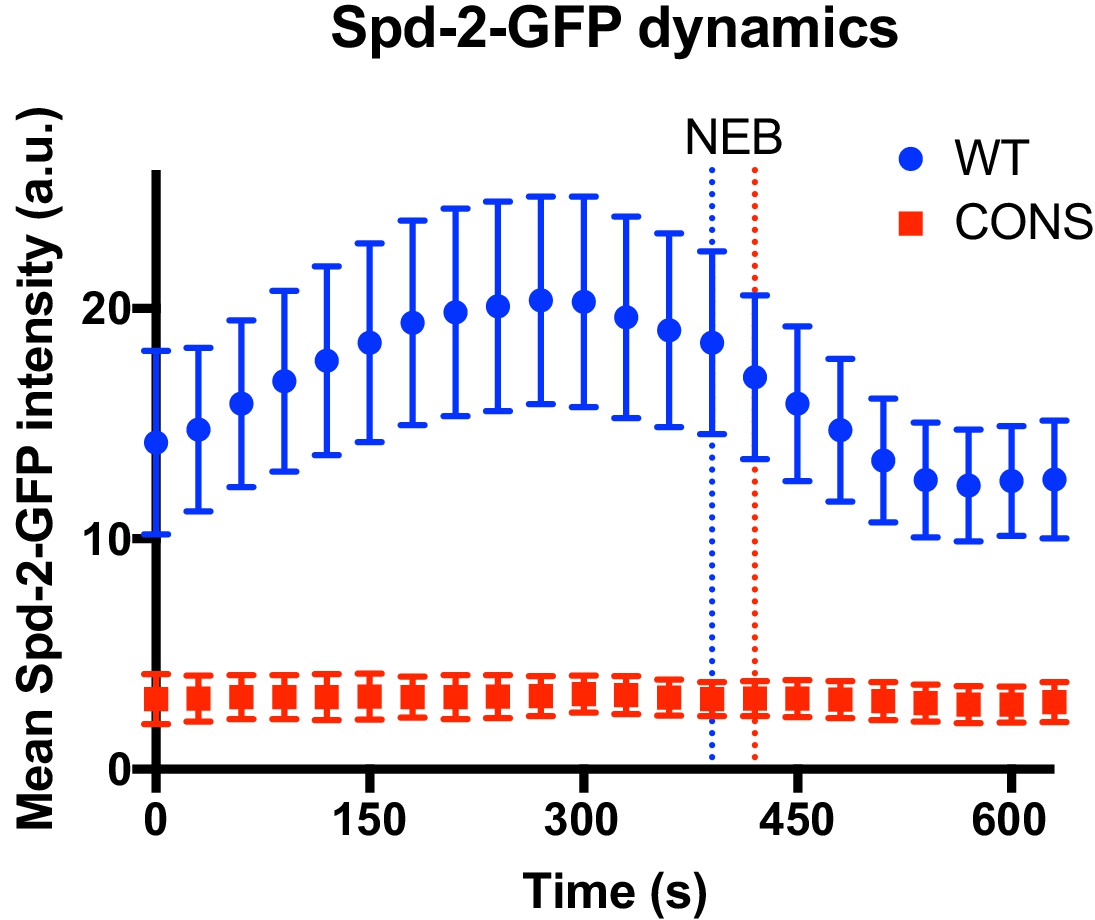
Centrosome maturation dynamics in Spd-2-CONS embryos.
Graph compares the mean (± SD) centrosomal Spd-2-GFP intensity (in arbitrary units [a.u.]) through an entire embryonic cell cycle (nuclear cycle 12) in Spd-2 mutant embryos expressing either WT Spd-2-GFP (blue) or Spd-2-CONS-GFP (red); n = 155 and 75 centrosomes analysed, respectively. Time in seconds is indicated, and the time when centrosomes first separate at the start of S-phase is set as t = 0; the time of mitotic entry—scored as the time of nuclear envelope breakdown (NEB)—is indicated by the dotted vertical lines. Because the length of S-phase varies in individual embryos—384s ± 46s or 369s ± 30s (mean ± SD) for WT Spd-2-GFP and Spd-2-GFP-CONS, respectively—we cannot simply average the data at each time point from multiple embryos, so representative embryos are shown here. The analysis of all 14 WT Spd-2-GFP (blue) or Spd-2-CONS-GFP (red) embryos that were monitored in this way is shown in Figure 8—figure supplement 1 and Figure 8—figure supplement 2, respectively.
-
Figure 8—source data 1
Figure 8 source data, centrosomal Spd-2-GFP intensity through an entire embryonic cell cycle (embryos WT #13 and CONS #2).
- https://doi.org/10.7554/eLife.50130.036
-
Figure 8—source data 2
Figure 8, Figure 8—figure supplement 1, Figure 8—figure supplement 2 source data; centrosomal Spd-2-GFP intensity through an entire embryonic cell cycle (all the embryos).
- https://doi.org/10.7554/eLife.50130.037
Figure 8—figure supplement 1

Centrosome maturation dynamics in Spd-2 mutant embryos rescued by WT Spd-2-GFP.
Graphs show the mean ± SD centrosomal WT Spd-2-GFP intensity (in arbitrary units [a.u.]) through an entire embryonic cell cycle (nuclear cycle 12) for 14 different embryos. Number of centrosomes analysed per embryo = 52–171. Time (s) is indicated; t = 0 was set as the time that centrosomes first separated at the start of S-phase. Dashed lines indicate nuclear envelope breakdown (NEB).
Figure 8—figure supplement 2

Centrosome maturation dynamics in Spd-2 mutant embryos rescued by Spd-2-GFP-CONS.
Graphs show the mean ± SD centrosomal Spd-2-CONS-GFP intensity (in arbitrary units [a.u.]) through an entire embryonic cell cycle (nuclear cycle 12) for 14 different Spd-2-CONS-GFP embryos. Number of centrosomes analysed per embryo = 44–124. Time (s) is indicated; t = 0 was set as the time that centrosomes first separated at the start of S-phase. Dashed lines indicate nuclear envelope breakdown (NEB).
Figure 8—figure supplement 3
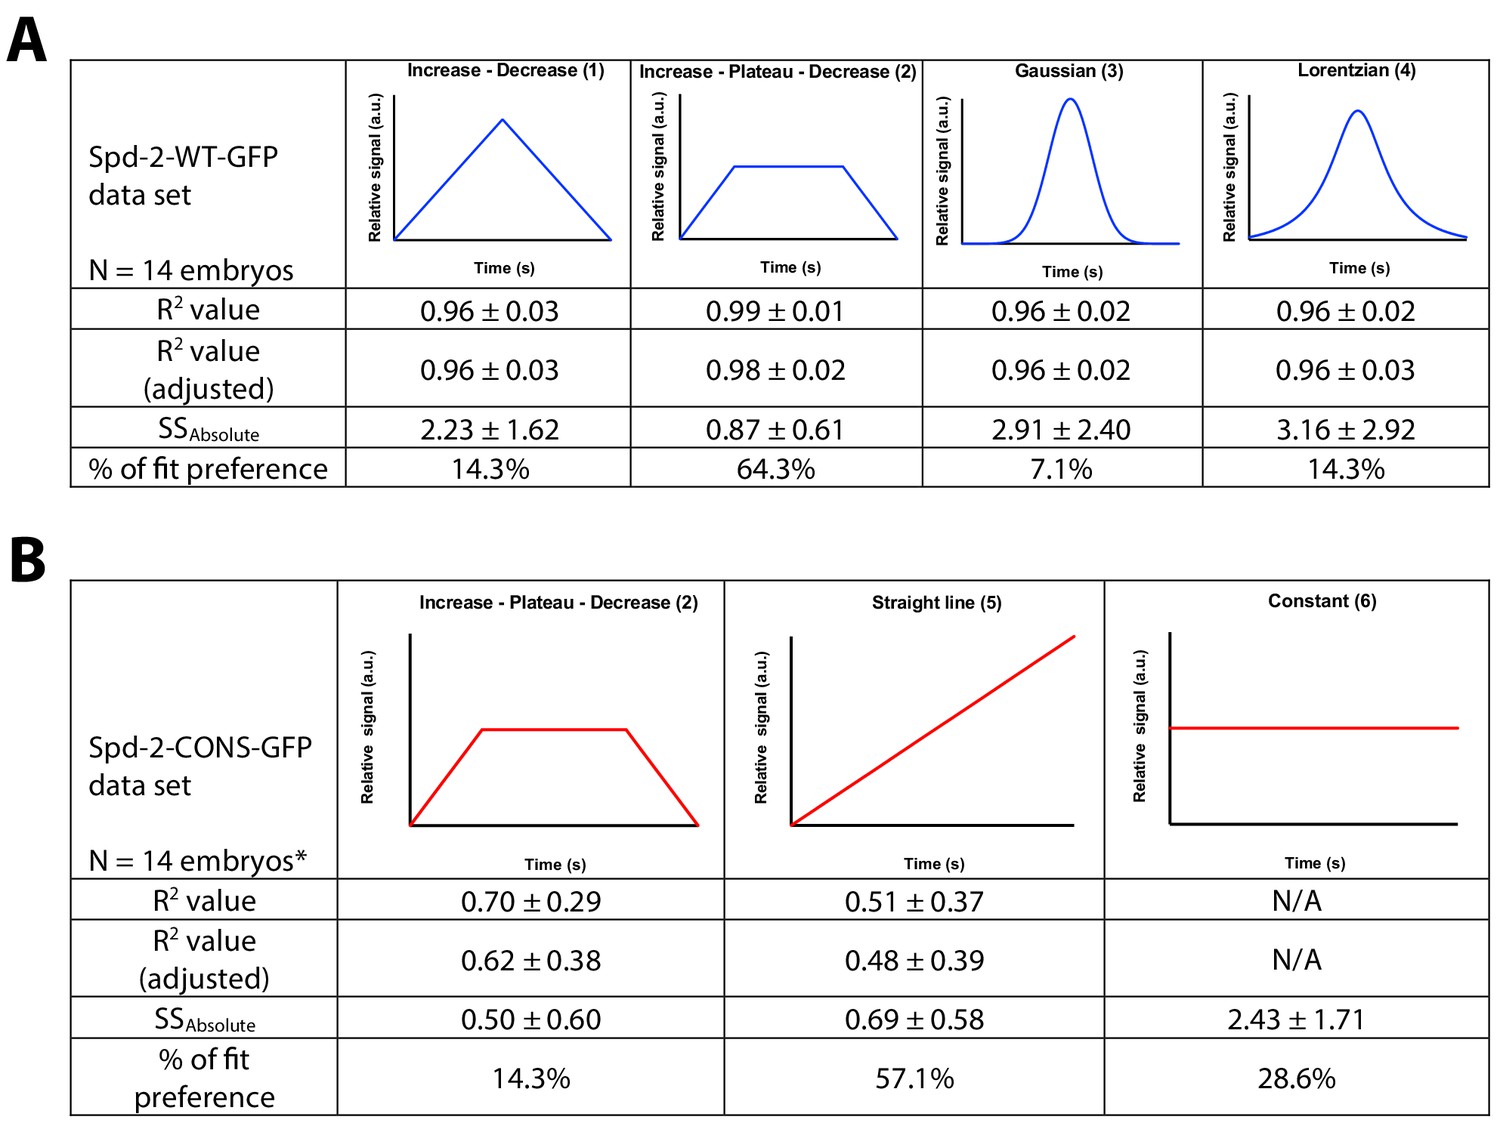
A schematic illustration of the models tested for the regression analysis of Spd-2-GFP dynamics during centrosome maturation.
The Spd-2-GFP dynamic data for each individual embryo (Figure 8, and Figure 8—figure supplements 1 and 2) was assessed using the nonlinear regression (curve fit) analysis function in GraphPad Prism 7. The functions tested are illustrated schematically in the graphs. R2, adjusted R2, and absolute sum-of- square values are used as a measure for goodness-of-fit. (A) The data for WT Spd-2-GFP was fitted against four different functions to assess the most suitable model: (1) user-defined linear growth followed by linear decrease; (2) user-defined linear growth followed by plateau followed by linear decrease; (3) Gaussian function; (4) Lorentzian function. The preferred model was (2). (B) The data for Spd-2-CONS-GFP was fitted against the preferred model for the WT data (2), but the data seemed to be described better as a straight line, so it was also fitted against two additional models: (5) a standard straight line; (6) a user-defined linear constant line. The preferred model was (5), although the average slope value was nearly zero (−0.0005 ± 0.0054; mean ± SD), indicating that the appropriate model in practice would be (6), a constant line. *The data from two Spd-2-CONS embryos did not converge for the Increase - Plateau -Decrease model.
Figure 9 with 2 supplements
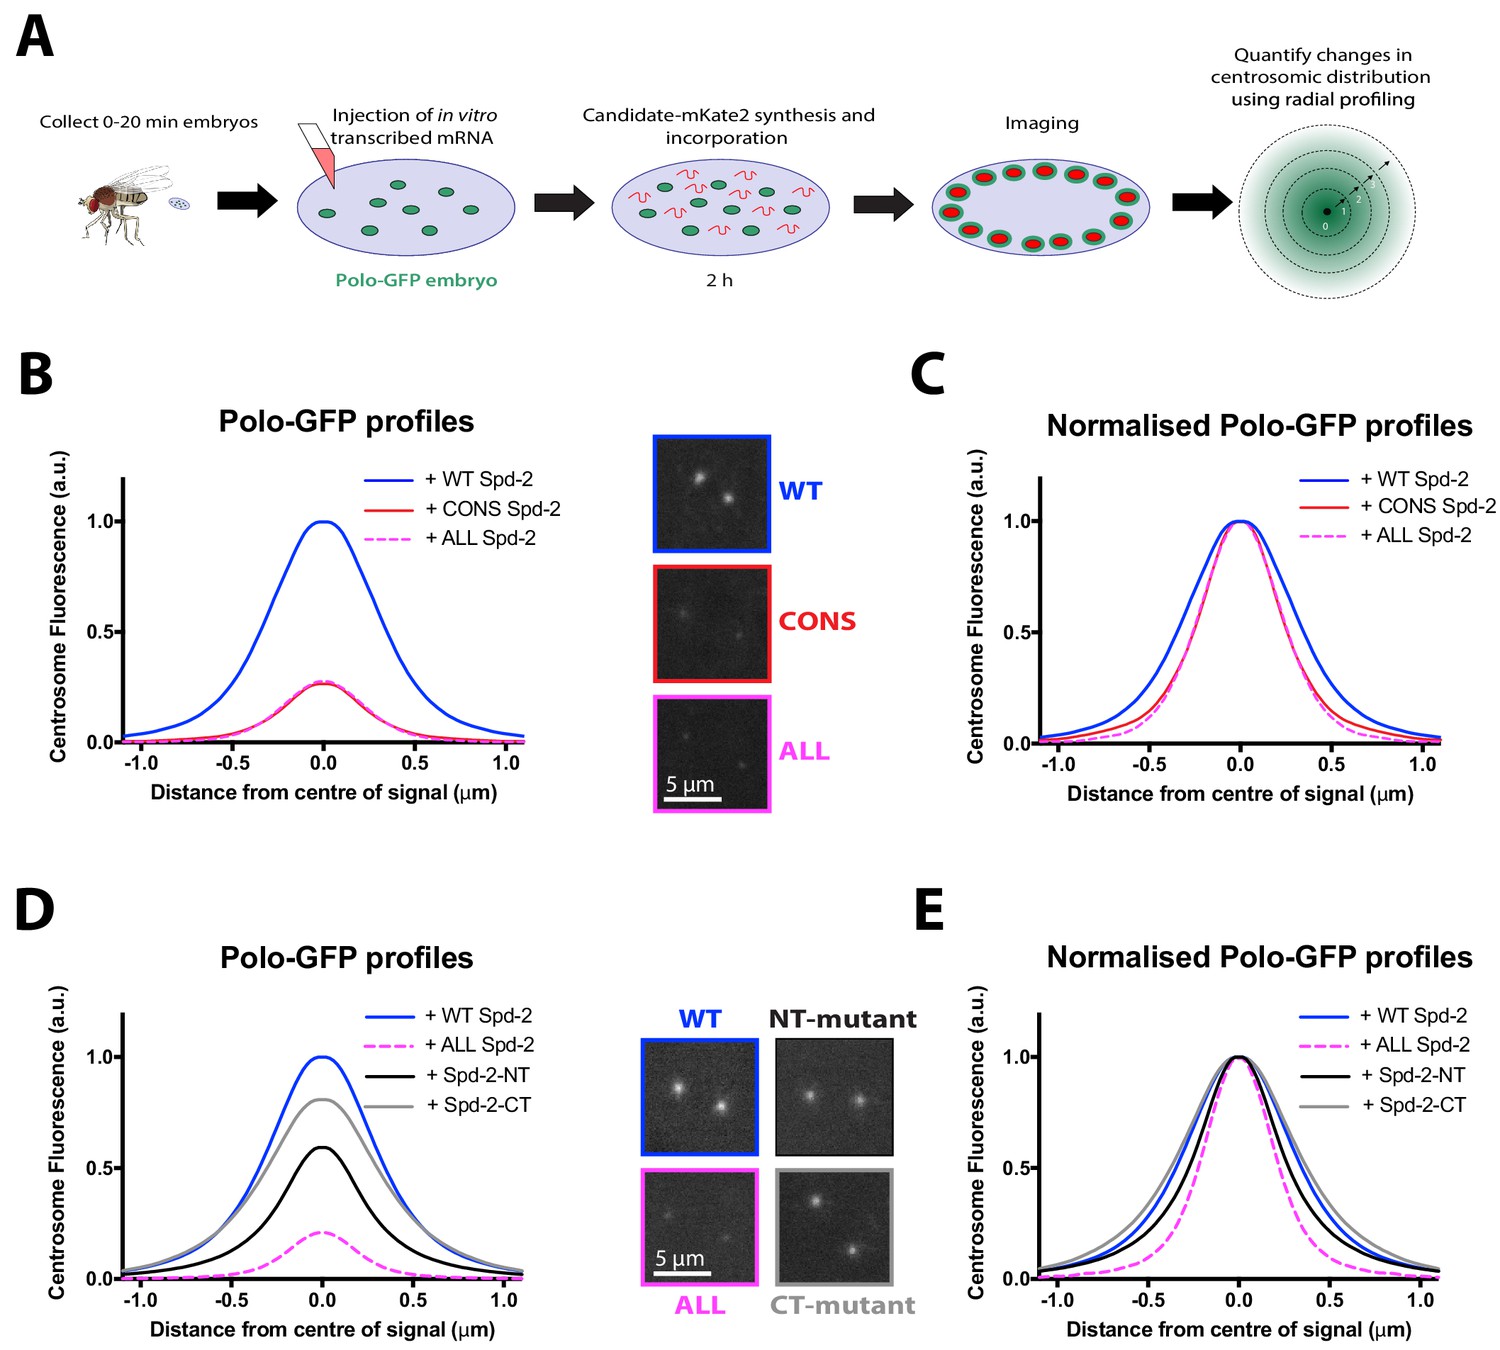
No single S-S/T motif in Spd-2 is essential for recruiting Polo to centrosomes.
(A) Schematic illustration of the mRNA injection assay used to analyse the effect of various Spd-2-mKate2 fusion proteins on Polo-GFP recruitment. (B) Graph compares the radial distribution of Polo-GFP around the mother centriole in living WT embryos expressing Polo-GFP and injected with mRNAs encoding either WT Spd-2-mKate2, Spd-2-CONS-mKate2 or Spd-2-ALL-mKate2, as indicated; five centrosomes per embryo were analysed: n = 7, 6 and 9 embryos, respectively. Insets show examples of typical spinning disk confocal images used for this analysis. (C) Graph shows the same data as shown in (B), but normalised so that the peak intensity of all genotypes = 1. This emphasises how even if the centrosomal Polo-GFP signal is normalised for fluorescence intensity, Polo-GFP spreads out around the mother centriole to a lesser extent in the embryos expressing Spd-2-CONS-mKate2 or Spd-2-ALL-mKate2 than WT Spd-2-mKate2. These observations recapitulate our findings from transgenic lines expressing these Spd-2-GFP-fusions in a Spd-2 mutant background. (D,E) Same analysis as presented in panels (B,C), but analysing the distribution of Polo-GFP in embryos expressing either Spd-2-ALL-mKate2, or one of two versions of Spd-2 in which the potential Polo binding sites in either the N-terminal or C-terminal region of Spd-2 have been mutated, as indicated; five centrosomes per embryo were analysed: n = 13, 6, 13 and 10 embryos, respectively.
-
Figure 9—source data 1
Figure 9B,C source data; radial profie analysis (part 1).
- https://doi.org/10.7554/eLife.50130.041
-
Figure 9—source data 2
Figure 9B,C source data; radial profie analysis (part 2).
- https://doi.org/10.7554/eLife.50130.042
-
Figure 9—source data 3
Figure 9B,C source data; radial profie analysis (part 3).
- https://doi.org/10.7554/eLife.50130.043
-
Figure 9—source data 4
Figure 9B,C source data; radial profie analysis (part 4).
- https://doi.org/10.7554/eLife.50130.044
-
Figure 9—source data 5
Figure 9B,C source data; radial profie analysis (part 5).
- https://doi.org/10.7554/eLife.50130.045
-
Figure 9—source data 6
Figure 9D,E source data, radial profile analysis.
- https://doi.org/10.7554/eLife.50130.046
Figure 9—figure supplement 1

A multiple sequence alignment (MSA) of Spd-2 protein sequences from different species highlighting the known PBD binding motifs.
The MSA aligns 13 different Spd-2 homologues from various Drosophila species with C. elegans SPD-2 and two isoforms of human Cep192. The previously identified Polo-binding sites in human Cep192 and C. elegans SPD-2 are indicated in boxes (red and blue, respectively), and the potential corresponding Drosophila sequences, if any, are highlighted in the larger surrounding boxes. No obvious Drosophila motifs are found at equivalent positions for the human Cep192 sites (red boxes) (although these regions of the protein do not align well so equivalent positions are difficult to infer), while there is a similar potential motif at an equivalent position to the single C. elegans motif (blue box). This motif is potentially phosphorylated by Cdk1, so we also mutated a second nearby S-S/T sequence that is conserved in Drosophila that could be phosphorylated by Cdk1 (yellow box) to generate the Spd-2-AA-mKate2 construct.
Figure 9—figure supplement 2
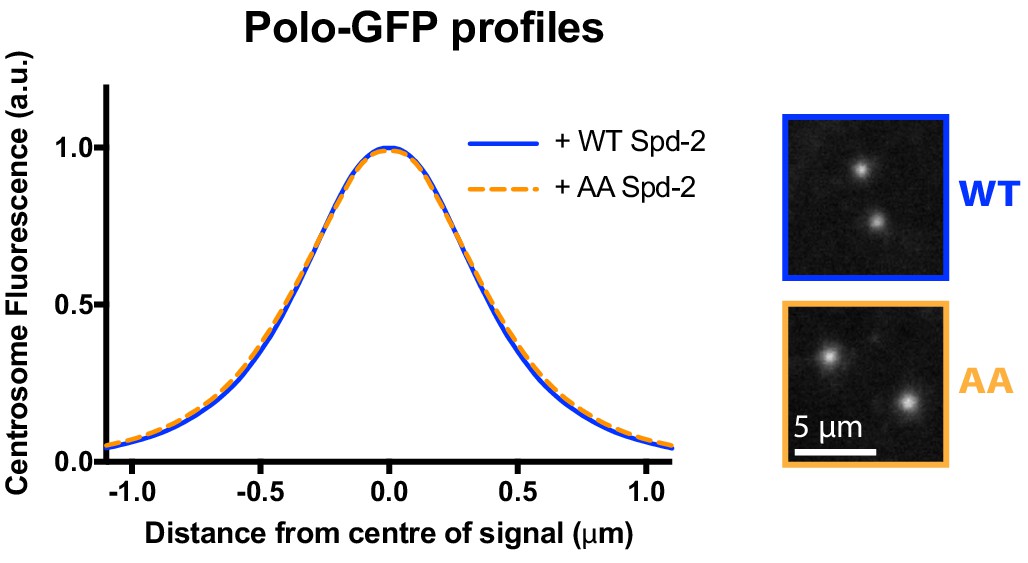
Spd-2-AA-mKate2 does not detectably perturb the centrosomal distribution of Polo-GFP.
Graph compares the radial distribution of Polo-GFP around the mother centriole in living WT embryos expressing Polo-GFP and injected with mRNAs encoding either WT Spd-2-mKate2 or Spd-2-AA-mKate2, as indicated; five centrosomes per embryo were analysed: n = 5 and 6 embryos, respectively.
Insets show examples of typical spinning disk-confocal images used for this analysis. Note that these datasets are not normalised to each other, and the AA mutation does not detectably perturb the localisation of Polo-GFP.
-
Figure 9—figure supplement 2—source data 1
Radial profile analysis.
- https://doi.org/10.7554/eLife.50130.047
Figure 10
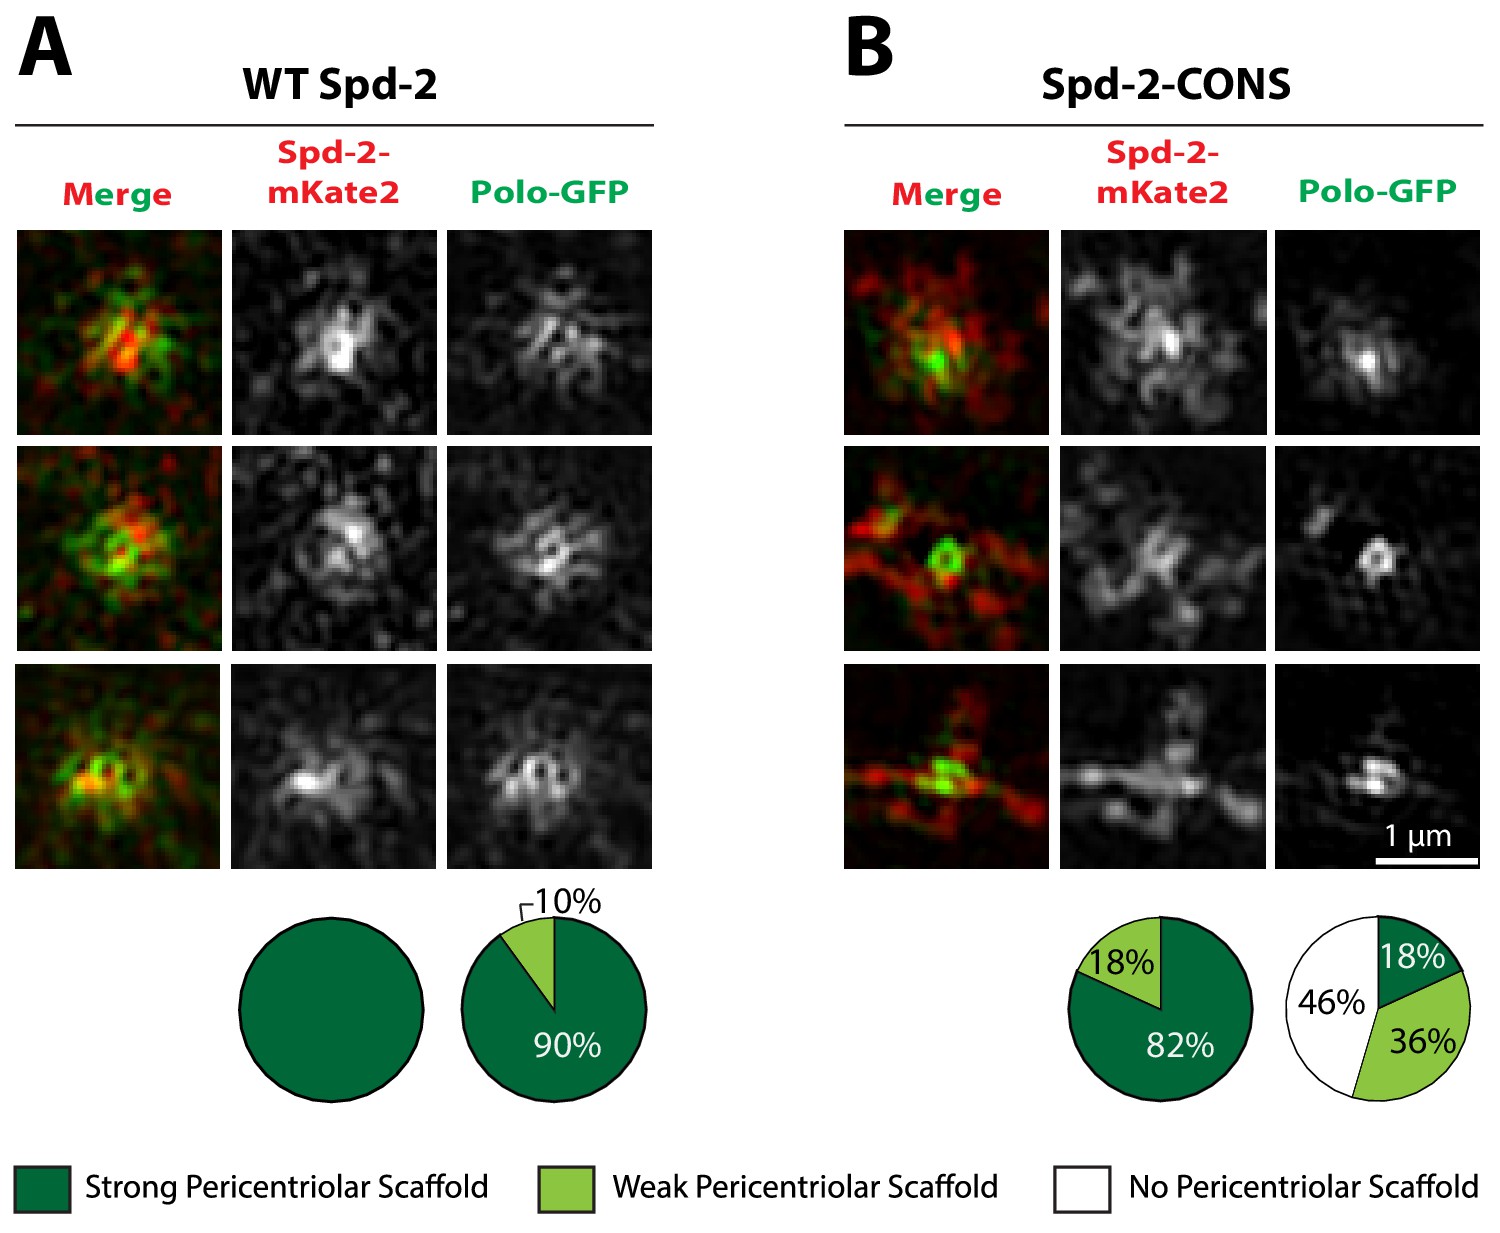
The recruitment of Polo-GFP to the PCM is perturbed in embryos expressing Spd-2-CONS-mKate2, even if a PCM scaffold is still detectable.
(A,B) Micrographs show 3D-SIM images of individual centrosomes from embryos expressing Polo-GFP (green in merged images) injected with mRNA encoding either WT Spd-2-mKate2 (A) or Spd-2-CONS-mKate2 (B) (red in merged images). Pie charts quantify the percentage of centrosomes that were scored qualitatively as having a strong (dark green), weak (light green) or no (white) pericentriolar scaffold (n = 10 and 11 individual centrosomes, two images (channels) per centrosome, for WT and CONS injections, respectively). All centrosomes were imaged in mid-late S-phase when the centrosomal levels of Spd-2 are maximal (see Figure 8). All scorings were performed blind by researchers not involved in the data acquisition. Note that mKate2 is relatively slow folding, and the fusion proteins are just expressed from the injected mRNA, so the signal-to-noise ratio is low and the 3D-SIM images reconstruct relatively poorly. Nevertheless the presence of a Spd-2-CONS-mKate2 scaffold is clear, even when the Polo-GFP signal in the scaffold is very weak (B).
-
Figure 10—source data 1
Figure 10 source data, results from blind scoring.
- https://doi.org/10.7554/eLife.50130.049
Figure 11
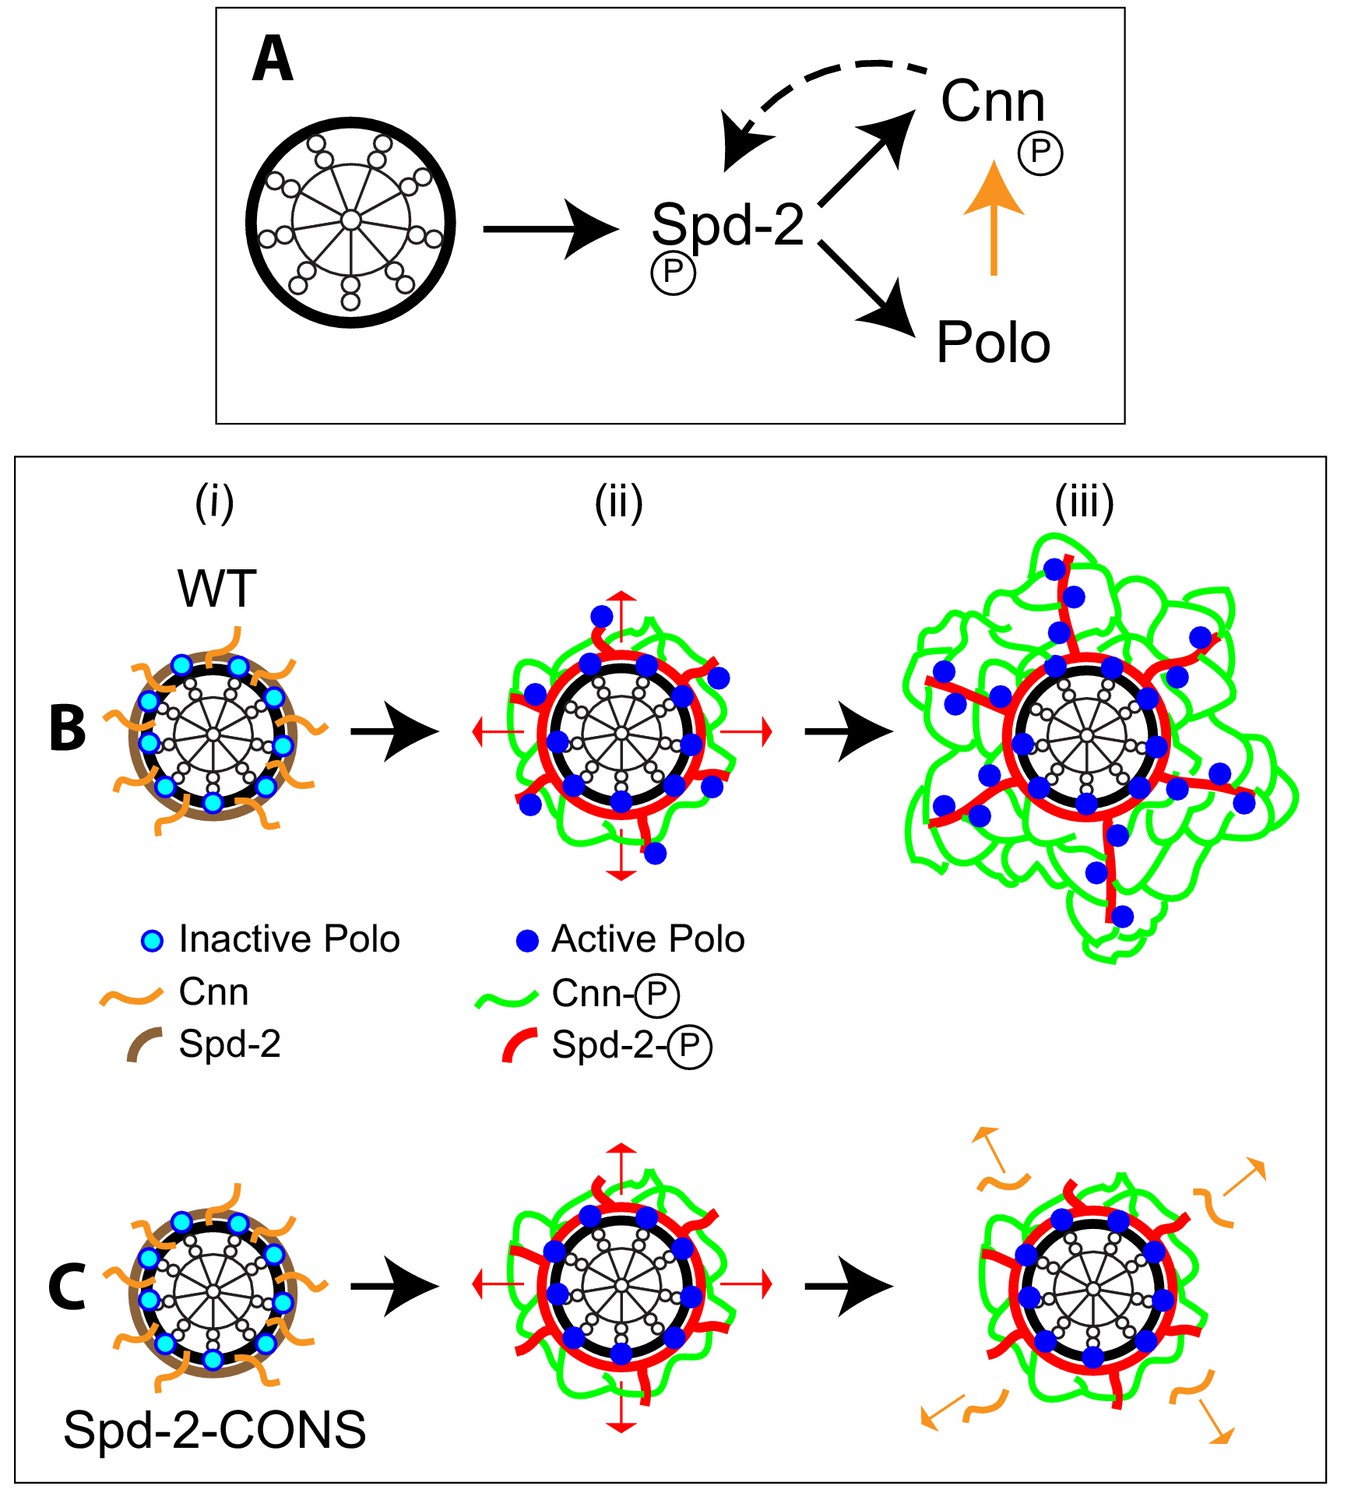
Spd-2, Polo and Cnn appear to form a positive feedback loop that drives the expansion of the mitotic PCM scaffold.
(A) A schematic summary of the proposed positive feedback loop that drives the expansion of the mitotic PCM scaffold in Drosophila embryos. Solid black lines indicate recruitment, solid orange line indicates phosphorylation, dashed line indicates that Cnn does not recruit Spd-2, but rather helps to stabilise the Spd-2 scaffold that has been recruited to the mother centriole and is fluxing outwards. Polo may phosphorylate Spd-2 to create additional S-S/T(p) motifs that can then recruit more Polo, but this is not depicted here. This circuit is a classical positive feedback loop; ultimately, however, it relies on the mother centriole as a source of Spd-2, because Cnn itself cannot recruit more Spd-2 or Polo into the scaffold. (B,C) Schematics illustrate the process of centrosome maturation in a WT cell (B), and a cell in which Spd-2 cannot recruit Polo (C). During interphase (i), Spd-2, Polo and Cnn are all recruited to the mother centriole. Polo is inactive, Spd-2 and Cnn are not phosphorylated, so no scaffold forms. As cells prepare to enter mitosis (ii), Polo is activated, and the centrosomal Spd-2 and Cnn are phosphorylated, allowing them to initially assemble into a ‘mini-scaffold’ around the mother centriole. The phosphorylated Spd-2 scaffold then starts to flux away from the mother centriole (red arrows). In normal cells (B[iii]), the expanding Spd-2 scaffold recruits more Cnn and more Polo, allowing more Cnn scaffold to assemble. The Cnn scaffold cannot recruit more Spd-2 or Polo, but it stabilises the expanding Spd-2 scaffold; this allows the Spd-2 scaffold to accumulate around the mother centriole. This creates a positive feedback loop that drives an increasing rate of expansion of the Spd-2 and Cnn scaffolds around the mother centriole. If the expanding Spd-2 scaffold cannot recruit Polo (C[iii]), the Cnn recruited to the expanding Spd-2 scaffold is too far away from the centriole to get phosphorylated by Polo so it cannot form a scaffold and rapidly dissipates into the cytosol (orange arrows). The positive feedback loop is broken, and centrosome maturation fails.
Tables
Table 1
Identification of Spd-2 sites phosphorylated at the centrosome.
The Table lists amino acids in Spd-2 that were identified as being phosphorylated in the centrosomal fractions of embryo extracts, but not the cytosolic fractions, by Mass Spectroscopy. The Peptide score is the Mascot Ion Score (Koenig et al., 2008)—scores > 29 indicate identity or extensive homology (p<0.05). Phosphorylated amino acids are marked in red. These sites were mutated together with an additional 4 Ser/Thr resides that could potentially have been phosphorylated in these peptides (blue) to generate Spd-2-11A-GFP.
| Peptide sequence | Peptide score | High-scoring phosphorylated site | Additional sites mutated |
|---|---|---|---|
| GTNIFEPAEITGR | 53.03 | S121 | - |
| TNQPLLEPESNVLDSVGEK | 65.26 | T329 | - |
| RPPSSSEILSLAIDK | 38.85 | S397 | - |
| KPLPLADHPQITISR | 34.55 | S484 | - |
| RVIATMGLIPR | 29.93 | S569 | - |
| NLPLPR | 42.33 | S614 | S617, S618 |
| GLGVAVPR | 64.8 | S673 | T671, S672 |
Table 2
The Table lists several previously identified Spd-2 peptides that include the potential PBD binding motif S-S/T(p).
Definitively identified phosphorylated sites within PBD binding motifs are shown in red. Sites listed in brackets have been identified as phosphorylated but the scores were low (shown in blue); or have not been identified in Drosophila melanogaster, but have been definitively identified in other closely related species (shown in purple). Other phosphorylated sites which are on the same reported peptide, but are not part of a PBD binding motif, are shown in bold. The phospho-proteomic screens in which these peptides were identified are listed.
| Peptide sequence | Phospho sites | Other phospho sites | Ref. | Also |
|---|---|---|---|---|
| VFGDLFSKGRR | S34 S35 | (S37) | Zhai et al., 2008 | - |
| ALETLEKPRPSRSQAK | S76 | S73 | Bodenmiller et al., 2007 | - |
| EKPSLSVAEILKSFVEK | (S156) | S146 S148 | Bodenmiller et al., 2007 | Zhai et al., 2008 |
| SSS | (S185) | Hu et al., 2019 | - | |
| SENIWNIVSNPNRSR | S310 S311 | (S308) S315 | Bodenmiller et al., 2007 | Zhai et al., 2008; Hu et al., 2019 |
| RPPEILSLSAIDK | (S389) (S390) S391 | (S395) S397 | Bodenmiller et al., 2007 | Zhai et al., 2008 |
| DIDLNSDTVEVVNHLWEHGR | (S413) (T414) | S410 (T412) | Zhai et al., 2008 | - |
| ADTDPVETEAEADIDEWPPVKEPSRR | (S515) (T516) | T499 T504 S522 | ||
| AASPDGVRPLTCTEDENDEEDEDKTPVNKK | S538 S539 (S540) | S536 (T547) (T549) T561 | ||
| KALSSTRLDGCDVAVASSTER | S581 S582 | (S584) | ||
| NLSPLPR | S617 S618 | S614 | Bodenmiller et al., 2007 | Zhai et al., 2008 Hu et al., 2019 |
| SCLPLLDTSSDRR | S624 S625 (S630) (T631) | Zhai et al., 2008 | Hu et al., 2019 | |
| SCLSSPLLDSTTSDRR | S634 | Habermann et al., 2012 | - | |
| ANSPAGSEASSTSGFTASGR | S650 | S654 | Bodenmiller et al., 2007 | - |
| KANSSPAGSEASTSGFTASGR | (S658) | S654 | Zhai et al., 2008 | - |
| RGLGTVAVPR | S673 S674 | (T672) | Zhai et al., 2008 | This study; Habermann et al., 2012 |
Table 3
Fitting parameters and chosen diffusion models for FCS experiments.
α , Anomalous subdiffusion parameter; AR, Structural parameter; ds, Diffusing species; bs, Blinking state of the fluorophore; ts, Triplet state of the fluorophore.
| Protein | Fitting boundaries (ms) | α | AR | Model |
|---|---|---|---|---|
| mGFP | 4 × 10⁻⁴ - 1 × 10² | 1.00 | 5 | one ds one ts |
| Spd-2-GFP | 4 × 10⁻⁴ - 1 × 10³ | 0.65 | one ds one ts | |
| mNeonGreen (pPlk4) | 4 × 10⁻⁴ - 2 × 10² | 0.70 | one ds one ts | |
| mNeonGreen (pSas-6) | 4 × 10⁻⁴ - 2 × 10² | 0.75 | one ds one ts | |
| dNeonGreen | 4 × 10⁻⁴ - 4 × 10² | 0.85 | one ds one bs one ts |
Additional files
-
Supplementary file 1
Key Resources Table.
- https://doi.org/10.7554/eLife.50130.052
-
Transparent reporting form
- https://doi.org/10.7554/eLife.50130.053
Download links
A two-part list of links to download the article, or parts of the article, in various formats.
Downloads (link to download the article as PDF)
Open citations (links to open the citations from this article in various online reference manager services)
Cite this article (links to download the citations from this article in formats compatible with various reference manager tools)
Evidence that a positive feedback loop drives centrosome maturation in fly embryos
eLife 8:e50130.
https://doi.org/10.7554/eLife.50130


