Long-lived metabolic enzymes in the crystalline lens identified by pulse-labeling of mice and mass spectrometry
- Northwestern University, United States
Figures
Figure 1
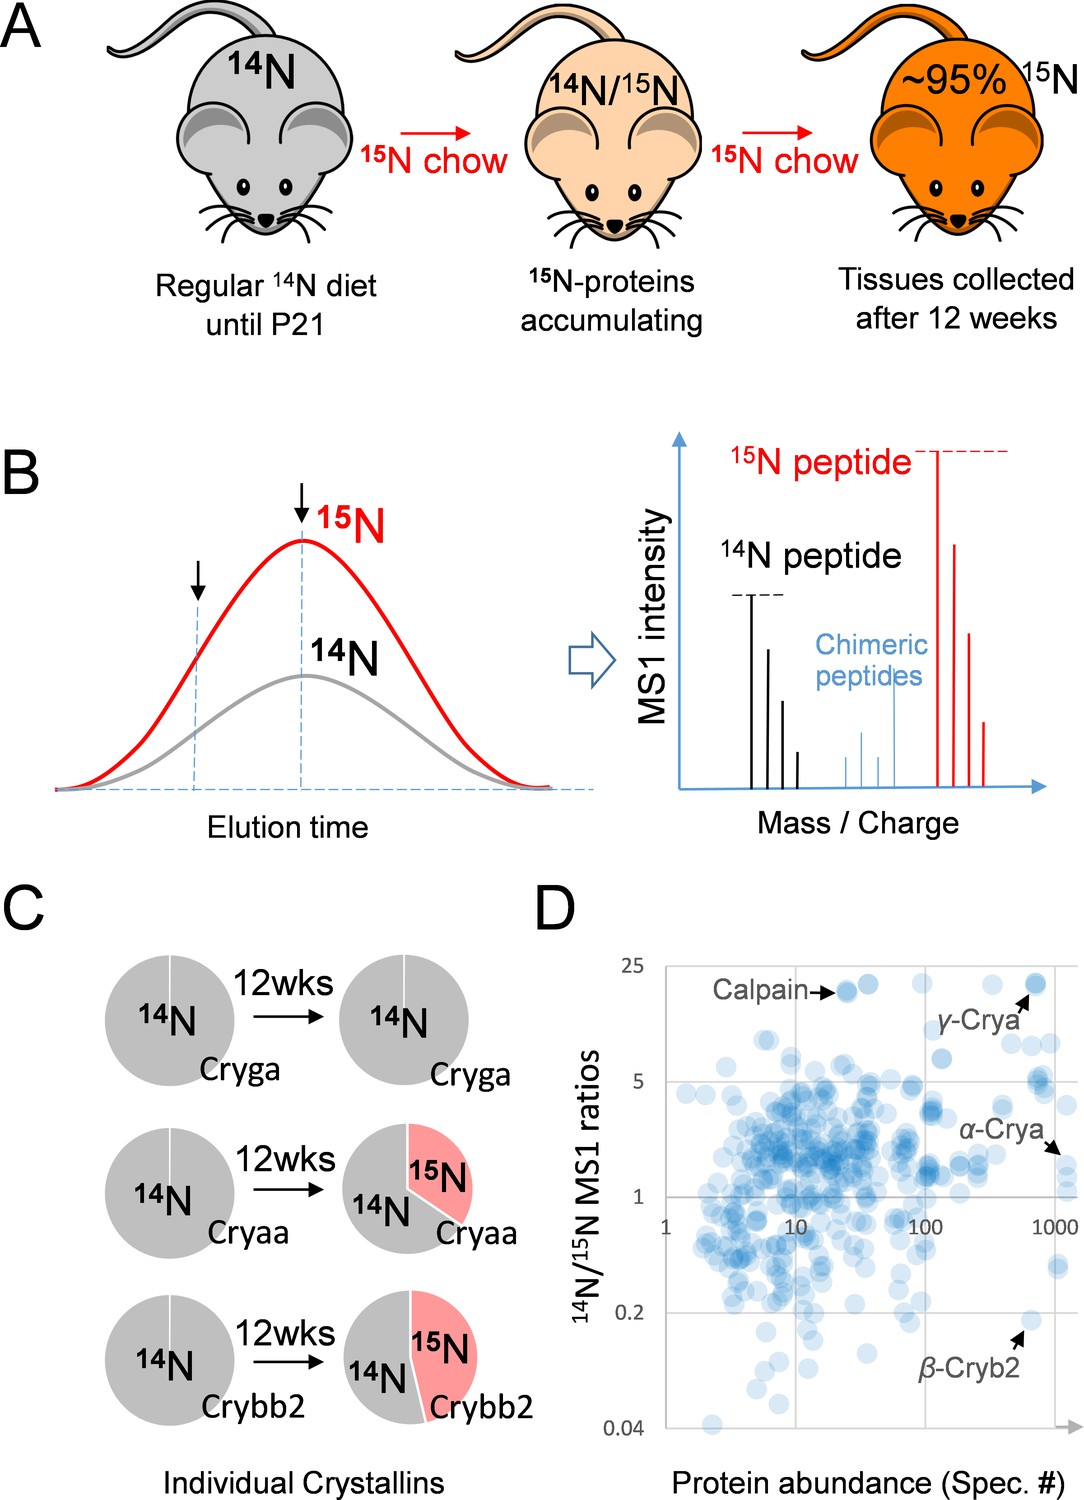
The 15N-labeling workflow for measuring the protein dynamics.
(A) After weaning, C57BL/6J mice were subjected to an exclusively 15N chow diet starting at P21 for a total duration of 12 weeks. 15N was incorporated into newly synthesized proteins. (B) In LC-MS/MS, 14N- and 15N-peptides of the same sequence co-elute (left panel). Regardless of where MS/MS is triggered (arrows pointing at random positions), the MS1 peptide signal intensities between the 14N and 15N channels reflect of their relative abundance (right panel). (C) Representative proteins showed different turnover rates. D. Among 543 lens proteins (blue dots) that were quantified via their 14N vs. 15N ratios (y-axis), there was a wide range of total protein abundance as estimated by MS/MS spectral counts (x-axis). Note that Calpain protease was long-lived, and the highly abundant α-, β- and γ-Crystallin proteins each had different levels of 14N and 15N.
Figure 2
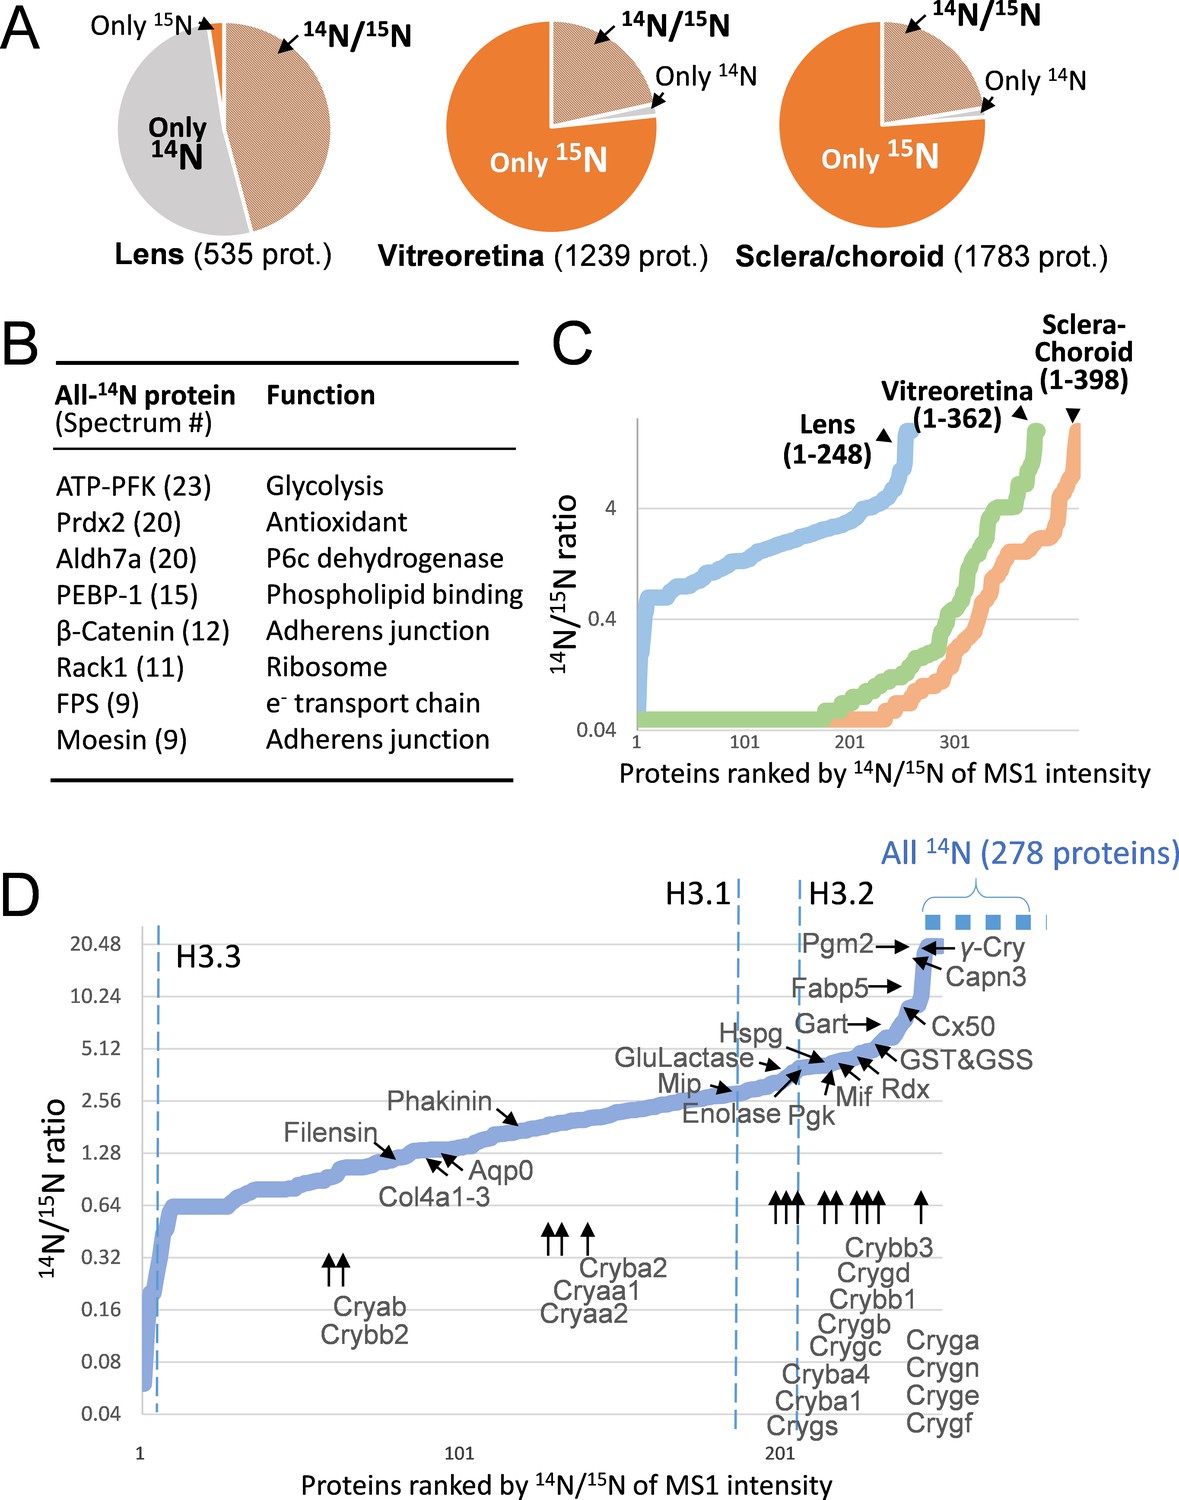
The lenticular proteins generally had longer life times than the vitreoretinal and sclera/choroid proteins.
(A) Inter-tissue comparison of protein longevity showing numbers of proteins based on 14N-peptides only, 15N-peptides only, or 14N/15N ratios calculated (hatched pie). While in the lens a large number of protein had a greater proportion of 14N, other ocular tissues had a faster protein turnover with more proteins completely labeled with 15N within 12 weeks. (B) A list of the most abundant proteins that were only detected by 14N peptides with the absence of 15N. (C) Among the proteins identified with both 14N and 15N peptides—248, 362 and 398 proteins in the lens, the vitreoretinal and the sclera/choroid, respectively, the distribution of 14N-to-15N ratios of the lens proteins was different than those of the other tissues. As expected, the lens had the highest proportion of its 14N-proteins remaining. (D) The distribution of 14N/15N ratios from low to high as in Figure 2C. There is a long list of 278 proteins with only their 14N-proteins detected (dotted blue line to upper right), indicating possibly less 14N to 15N conversion of these proteins than those measured with 14N/15N ratios. Proteins that are implicated in cataract including structural proteins, gap junction and water channels, and metabolic enzymes are listed with arrows pointing to their corresponding values. The family of Crystallin proteins are listed below. Benchmark Histones H3.3 and H3.1/3.2 are also listed, representing transcription vs. cell proliferation activities, respectively.
Figure 3
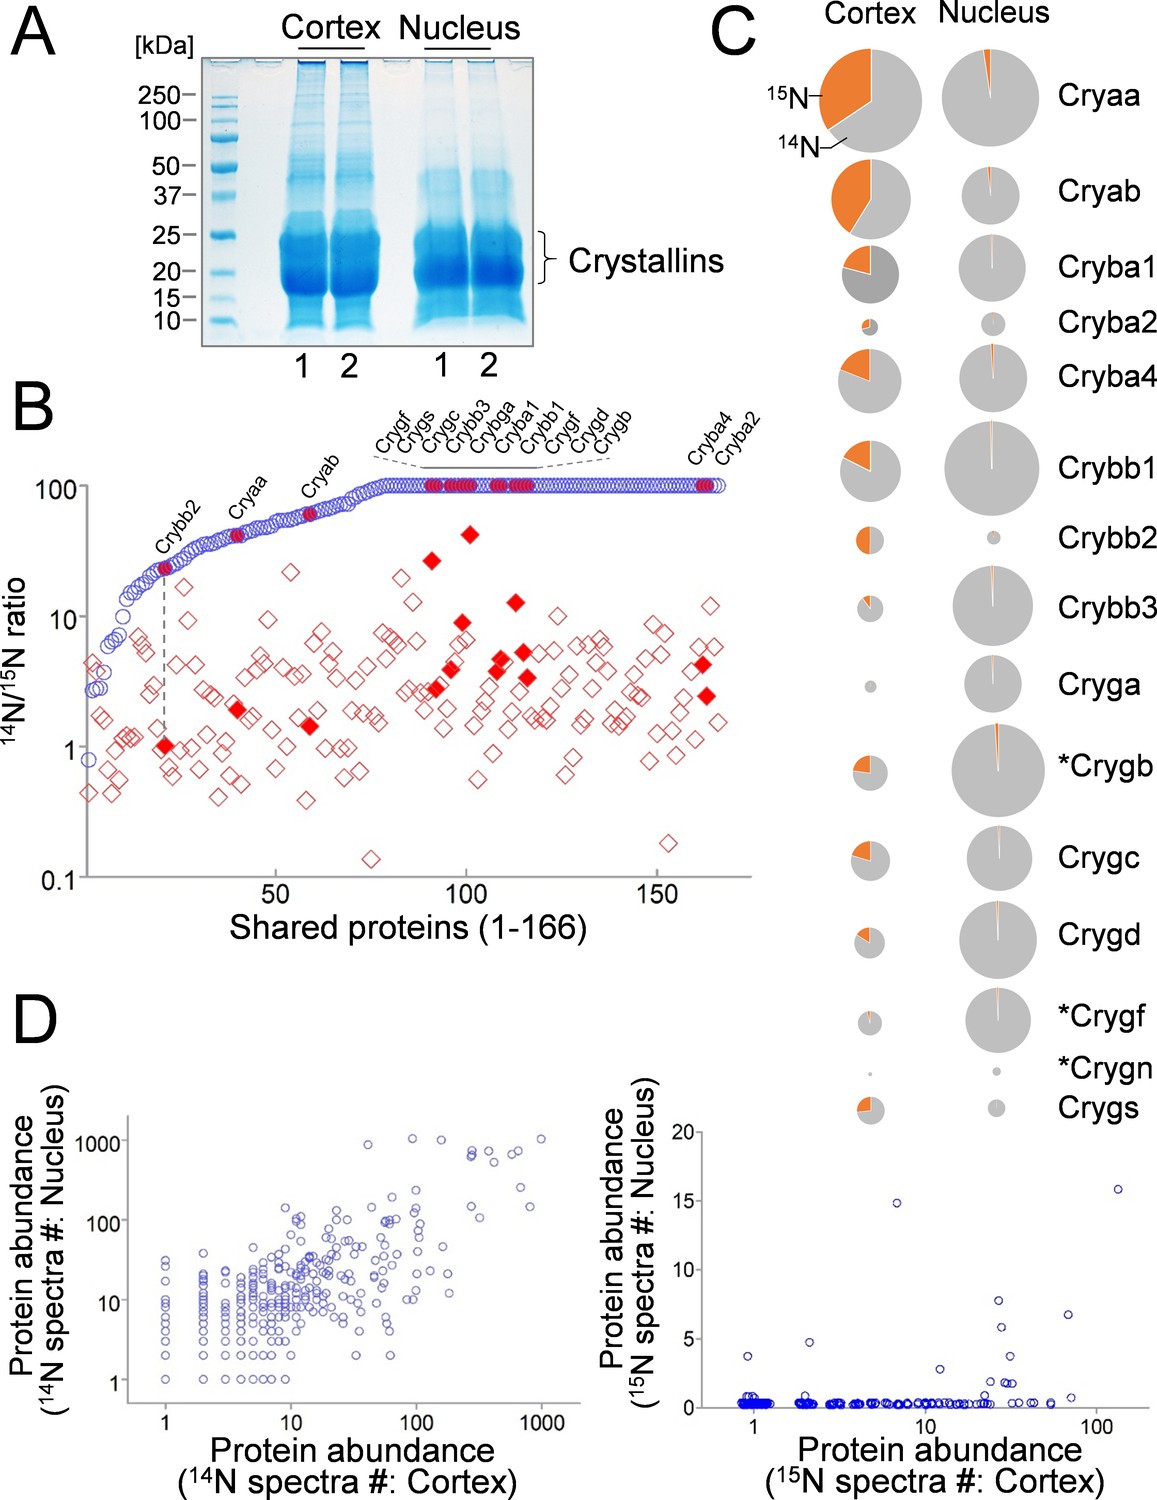
Comparison of lens cortex and nucleus proteins by 14N/15N ratios.
(A) Lens tissues from the the cortex and the nucleus were separately harvested and subsequently resolved by SDS-PAGE. Prominent gel bands of Crystallins were present in both cortex and nucleus fractions, whereas in the higher molecular weight areas of the gel the cortex tissue appeared more intensely stained for its protein contents. (B) A direct comparison of 166 proteins identified in both cortex (red diamond) and nucleus (blue circle) plotted along the x-axis with their 14N/15N ratios separately plotted against the y-axis. In all proteins their 14N/15N ratios were higher in the nucleus (an arbitrary ceiling of the ratios was set at 100 that reflects no protein turnover). There was a wide range of the ratios among individual proteins in the cortex, including all subtypes of Crystalline (filled shapes in red). The ratio values for nuclear Crystallins are also indicated with filled circles at the corresponding x-axis positions (example illustrated by the dotted line). (C) When individual Crystallin isoforms are compared with respect to their abundance (circle size) in the cortex and the nucleus, there is a general trend of more γ-Crystallins (Cryg) in the nucleus with similar α- and β-Crystallin (Crya and Cryb) contents as compared to the cortex. The 14N/15N ratio indices (pie-chart) among these isoforms in the cortex were also different. Asterisks: Crystallins that are not expressed in human lens. (D) Total spectra counts that reflect the relative abundance of individual proteins were plotted for cortex vs. nucleus distributions. Among the old 14N-proteins there was a relatively balanced distribution between the two fractions (left panel). In contrast, the newer 15N-proteins were mostly concentrated only in the cortex (right panel).
Figure 4
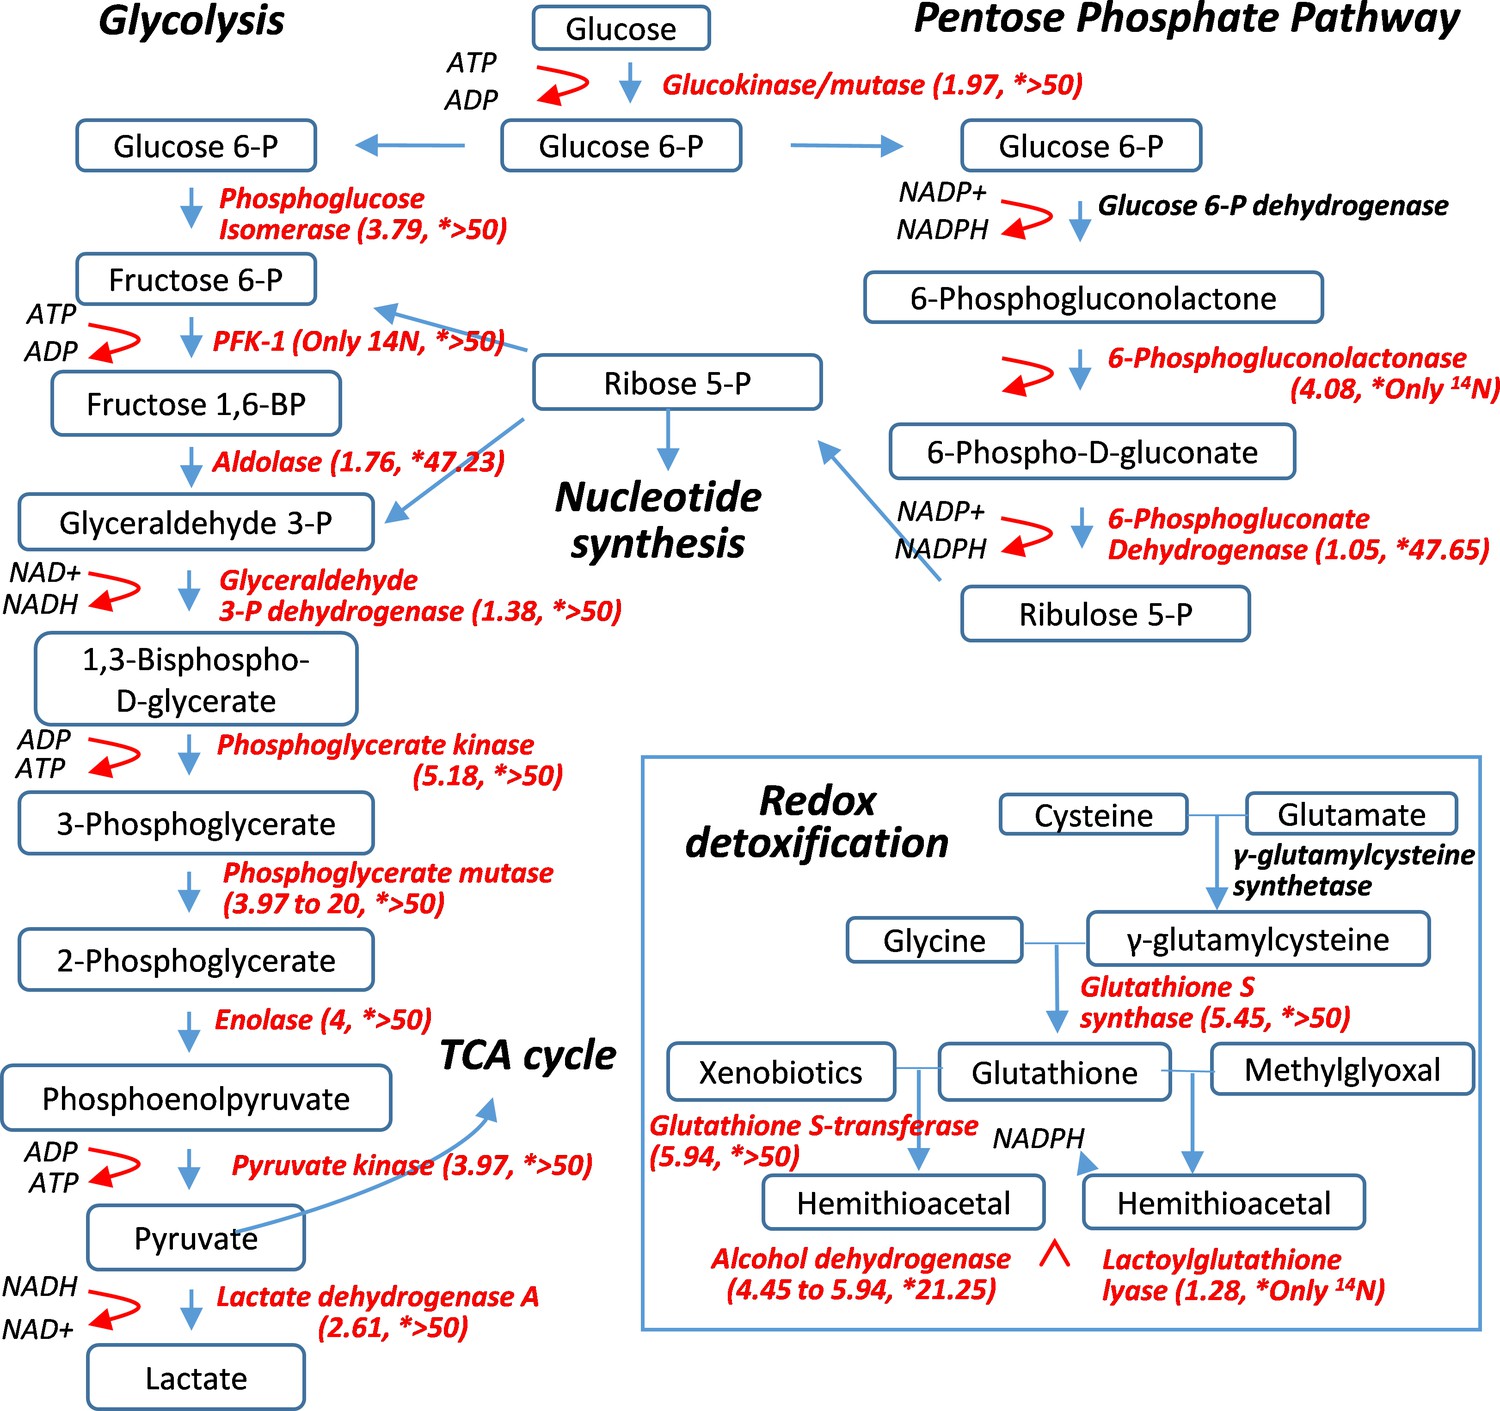
Pulse-labeling of the lenticular proteome showed the longevity of metabolic enzymes for redox and glycolysis reactions.
Enzymes for energy metabolism and oxidoreduction-detoxification were being measured for their 14N vs. 15N abundance in the lens. Marked in red font are proteins that had their 14N/15N ratios successfully measured (with their values in parenthesis; followed by a second set of ratios for their nucleus counterparts marked by asterisks).
Author response image 1
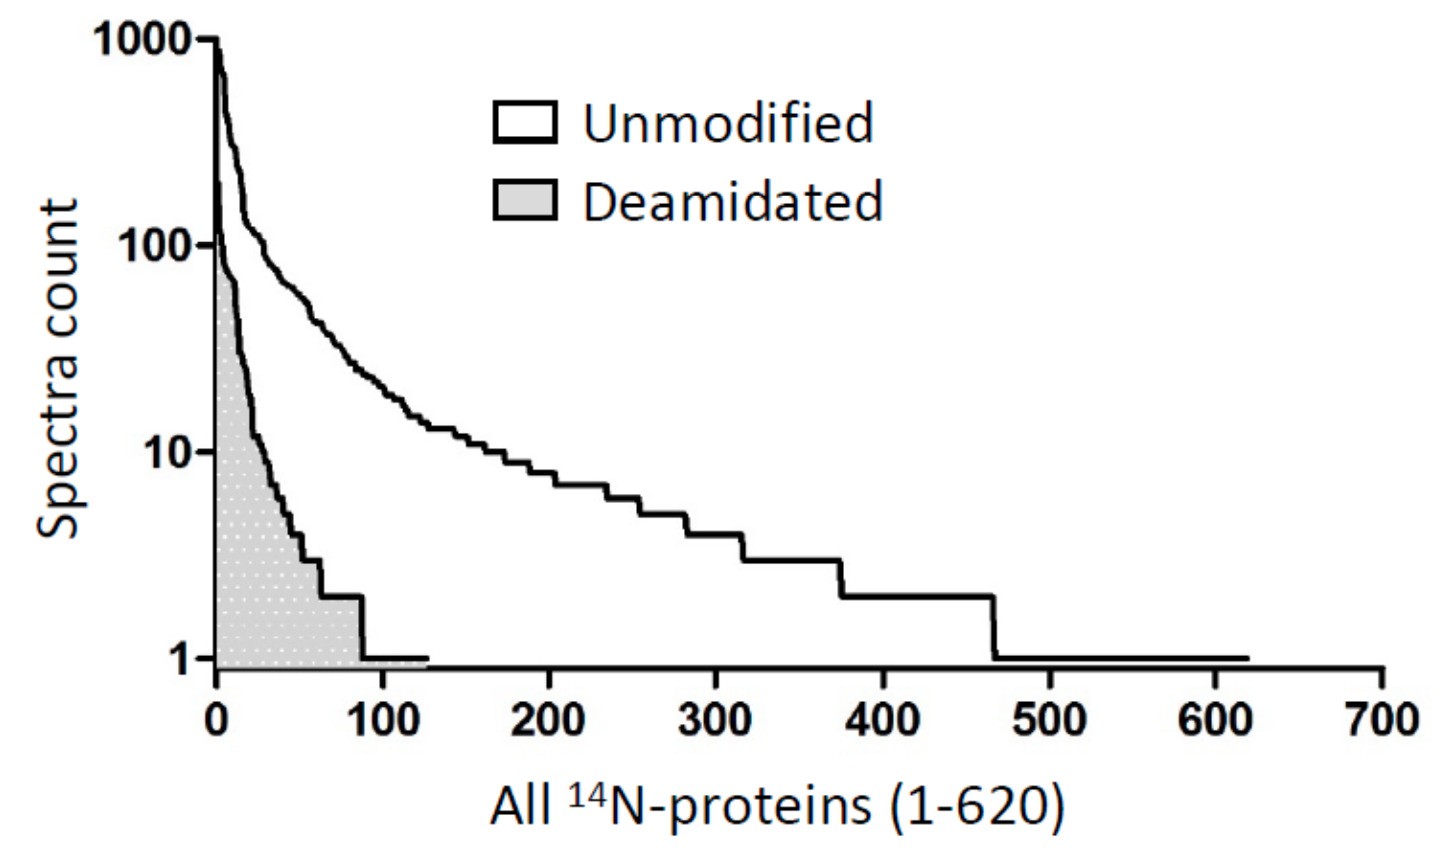
Among all ~600 lens 14N-proteins (x-axis), when calculated on the basis of peptide spectra (y-axis), about 10.2% peptides were deamidated (1560 vs. 13703 for deamidated and unmodified peptides).
Additional files
-
Supplementary file 1
A complete list of proteins identified by mass spectrometry.
Tables S1 to S5 show all proteins identified in whole lens, lens cortex, lens nucleus, sclera choroid and vitreoretinal respectively. The tables also include individual peptide and protein 14N/15N ratios, as well as relative total protein amount (calculated as MS spectral count).
- https://cdn.elifesciences.org/articles/50170/elife-50170-supp1-v2.xlsx
-
Transparent reporting form
- https://cdn.elifesciences.org/articles/50170/elife-50170-transrepform-v2.docx
Download links
A two-part list of links to download the article, or parts of the article, in various formats.
Downloads (link to download the article as PDF)
Open citations (links to open the citations from this article in various online reference manager services)
Cite this article (links to download the citations from this article in formats compatible with various reference manager tools)
Long-lived metabolic enzymes in the crystalline lens identified by pulse-labeling of mice and mass spectrometry
eLife 8:e50170.
https://doi.org/10.7554/eLife.50170


