Interplay of disordered and ordered regions of a human small heat shock protein yields an ensemble of ‘quasi-ordered’ states
- University of Washington, United States
Figures
Figure 1 with 1 supplement
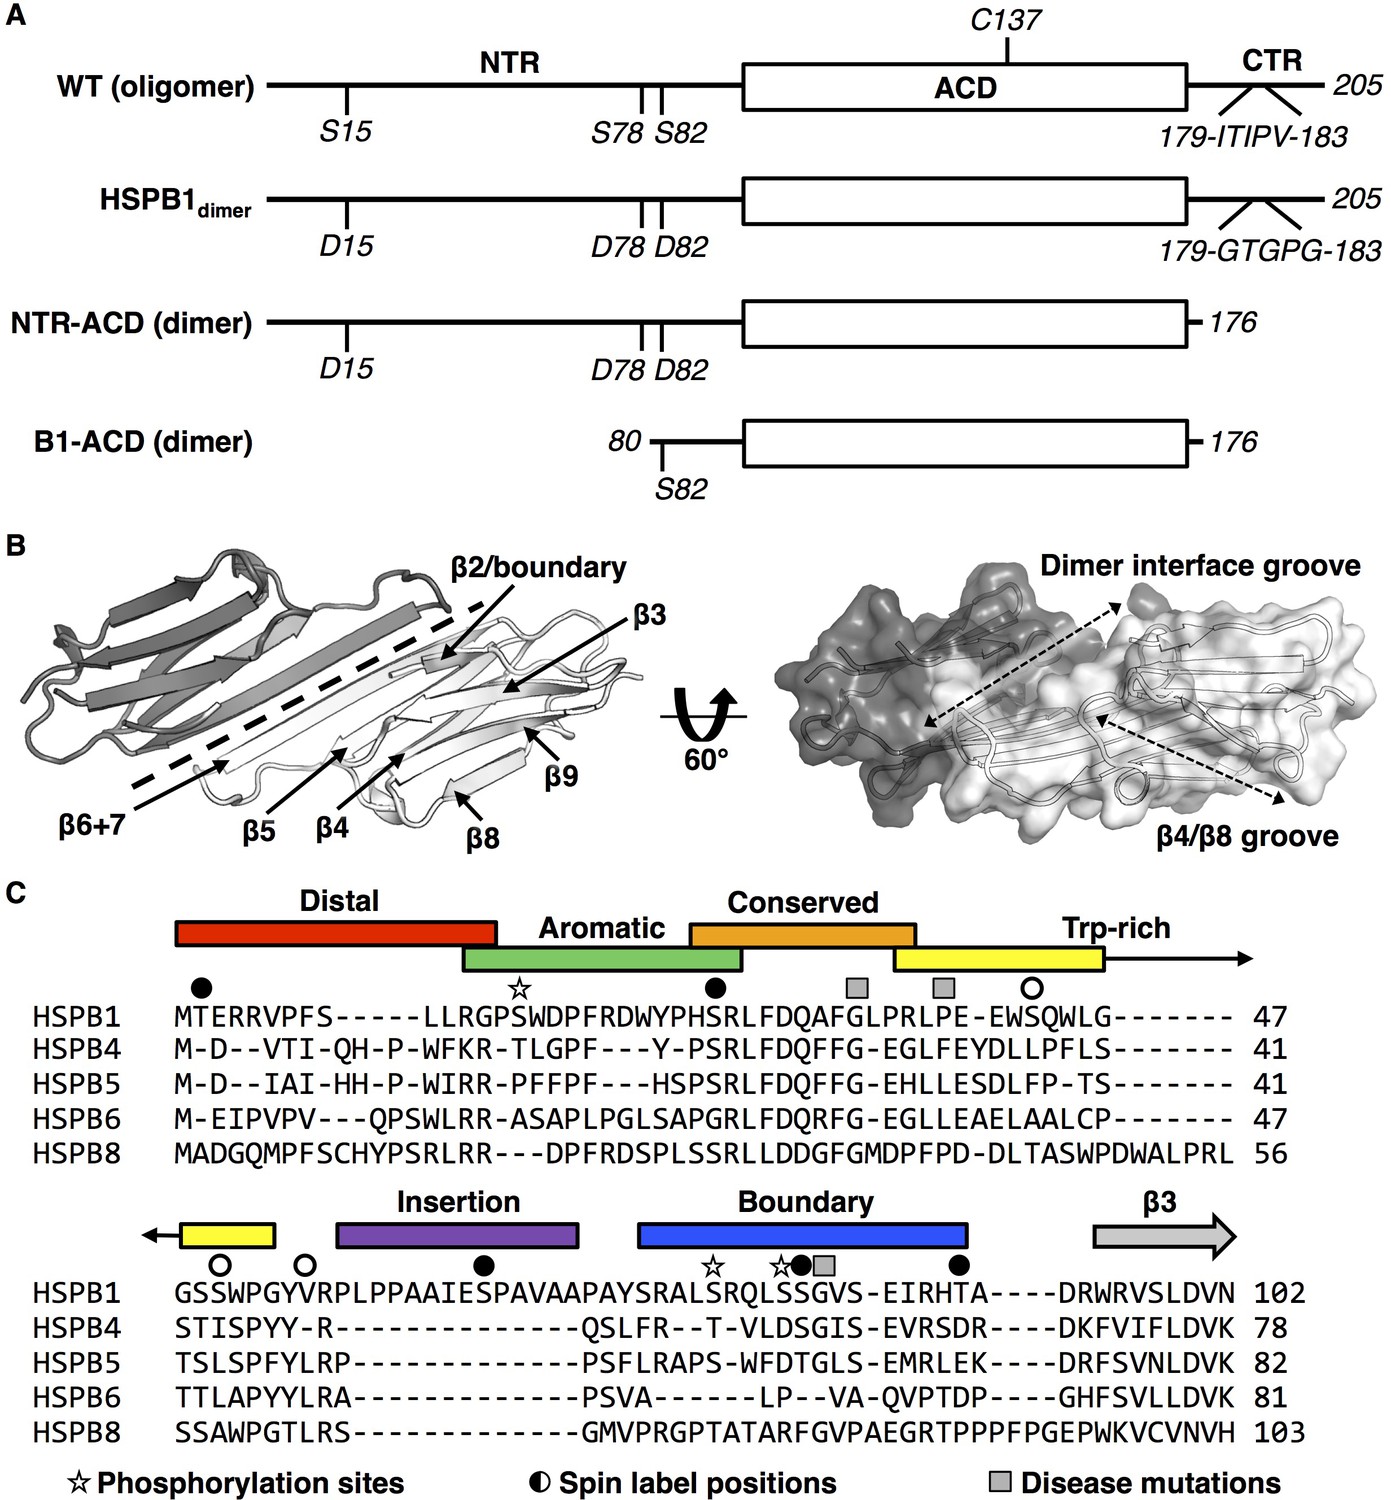
sHSP domain architecture and sequence alignment.
(A) All sHSPs are defined by a conserved α-crystallin domain (ACD), that is flanked by N-terminal and C-terminal regions (NTR and CTR, respectively). Constructs used in this study are shown and their quaternary structure (oligomer vs. dimer) is indicated. HSPB1 contains a single cysteine, located in the ACD, which was substituted with serine in NMR-PRE and HDXMS experiments across several constructs. Phosphorylation-mimicking mutations in the NTR along with mutation of the IXI motif in the CTR (to abrogate ACD-CTR interactions) yields a full-length dimer, used in HDXMS experiments here. The C-terminally truncated construct (NTR-ACD) was used predominantly for NMR assignments and PRE experiments. The N-terminally and C-terminally truncated B1-ACD construct was used for peptide-binding NMR experiments. (B) ACD homodimer structure (4MJH), with dotted line indicating axis of symmetry along which ACDs interact via β6+7 strands. Dotted arrows in the right panel indicate the axes of the dimer interface and β4/β8 grooves. (C) NTR alignment of better-characterized human sHSPs shows minimal sequence conservation aside from the ‘conserved’ region. The NTR sequence of HSPB1 was divided into six sub-regions for this study, which were probed in peptide form (with the exception of the highly hydrophobic insertion region). Sites of interest in this study are also indicated: 1) phosphorylation sites mutated to aspartate to mimic phosphorylation, 2) sites that were targeted for spin label attachment, and 3) three disease-associated mutations (G34R, P39L, and G84R).
Figure 1—figure supplement 1
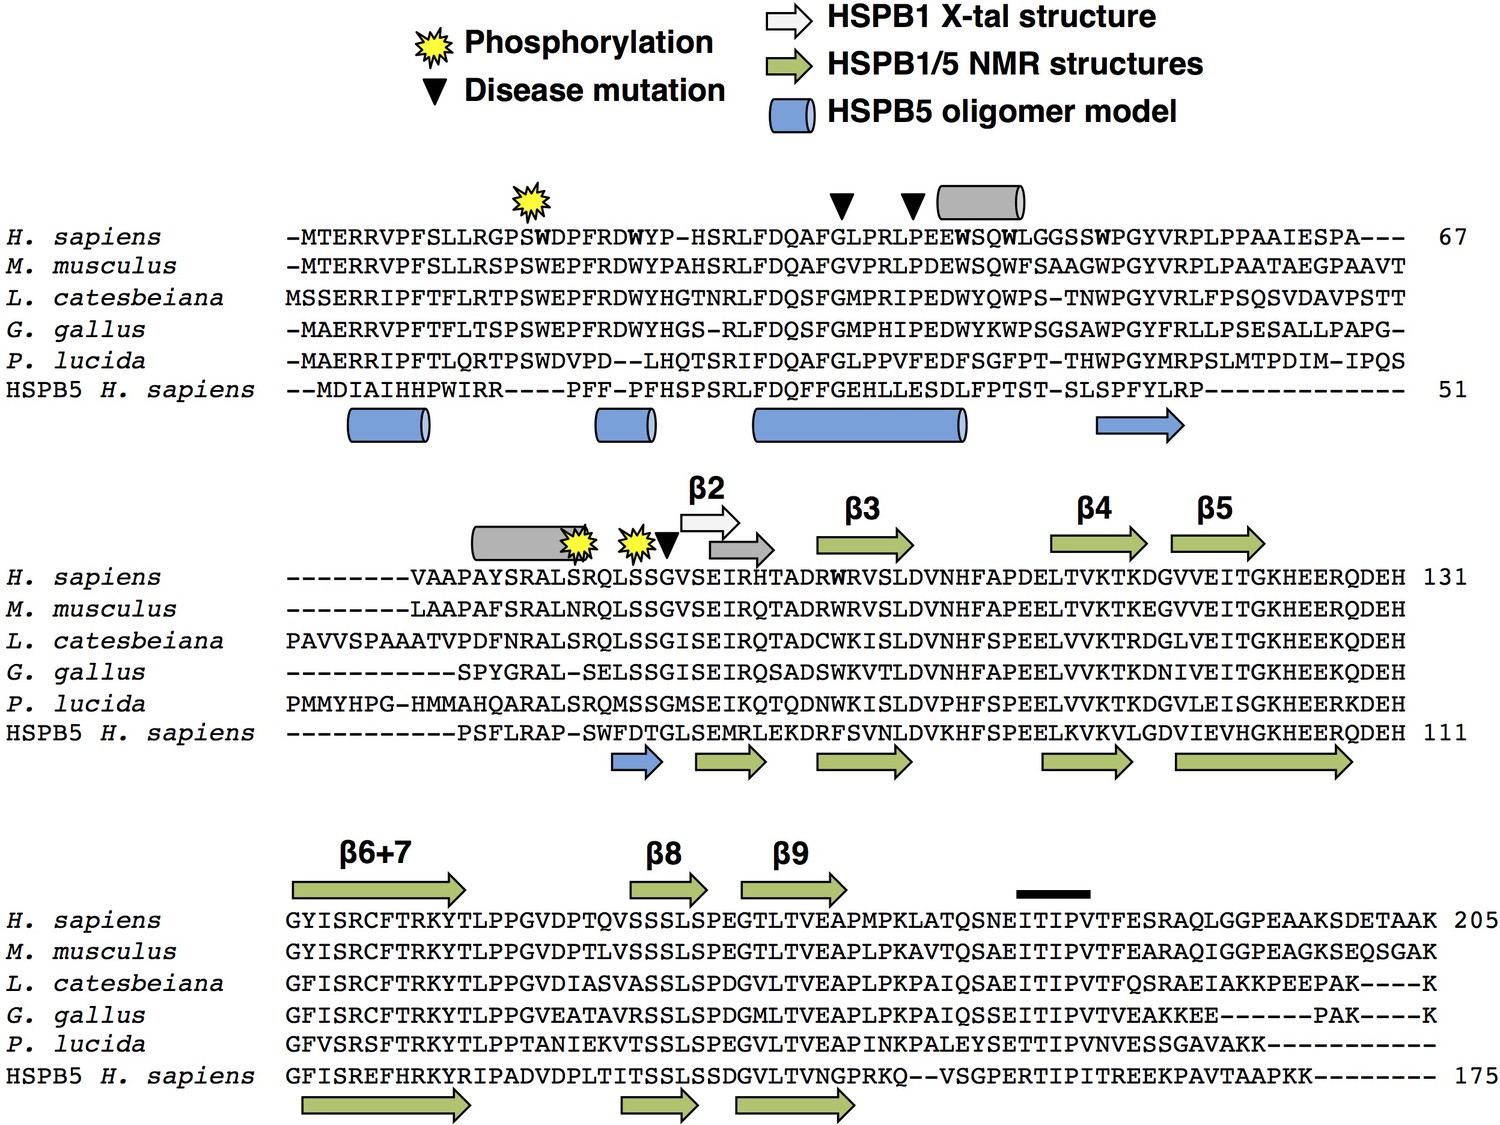
Sequence alignment of HSPB1 orthologs, residues of interest, and known and predicted secondary structure.
HSPB1 sequences from human, mouse, frog, chicken, and fish show considerable conservation throughout most of the NTR, in contrast to other sHSP types as seen in the human HSPB5 sequence at the bottom. Yellow stars indicate conserved phosphorylation sites (S15, S78, and S82), and triangles indicate disease-associated point mutations in the NTR examined in this study (G34R, P39L, and G84R). Gray helices and strands on top of the sequence are based on PSIPRED secondary structure prediction (McGuffin et al., 2000). The light gray β2 strand is based on the HSPB1 ACD-only crystal structure (PDB ID: 4MJH). The blue helices and strands below the sequence are based on secondary structure in the HSPB5 oligomeric model (PDB ID: 3J07). Green strands (below and above sequence) are based on HSPB1 and HSPB5 NMR ACD-only structures (PDB IDs: 2N3J and 2N0K). The black bar above the CTR indicates the IXI motif in HSPB1, which is actually a triple motif (ITIPV).
Figure 2 with 2 supplements
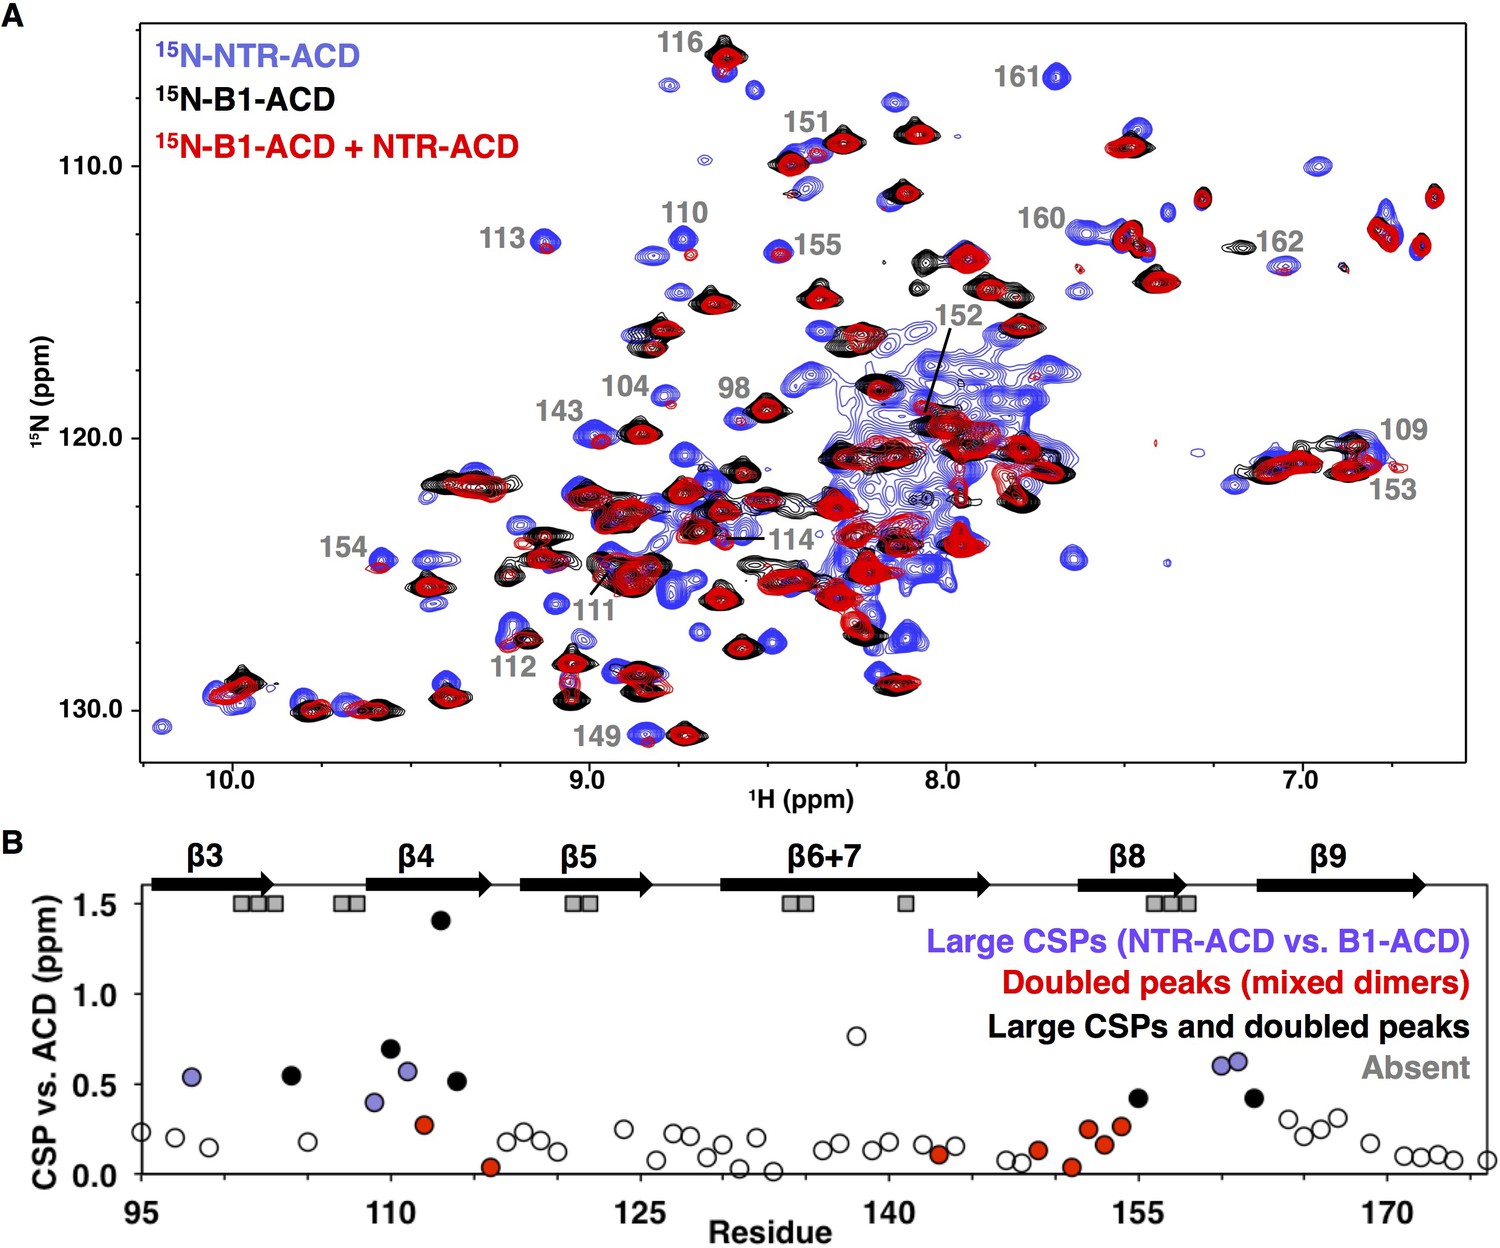
NMR analysis of NTR-ACD reveals changes in the ACD and increased heterogeneity when the NTR is present.
(A) Comparison of B1-ACD (black), NTR-ACD (blue), and a mixture of 15N-B1-ACD and unlabeled NTR-ACD (red) 1H-15N HSQC-TROSY spectra. (B) CSPs measured for NTR-ACD compared to B1-ACD. The following color-coding highlights regions of interest: blue, residues most perturbed in NTR-ACD compared to B1-ACD; red, residues that show NTR-ACD-like chemical shifts in the ACD mixing experiment; black, residues that show effects for both cases. These peaks are indicated in the spectrum. Gray squares correspond to residues in NTR-ACD whose resonances are missing and are presumably in substantially different chemical environments between B1-ACD and NTR-ACD.
Figure 2—figure supplement 1
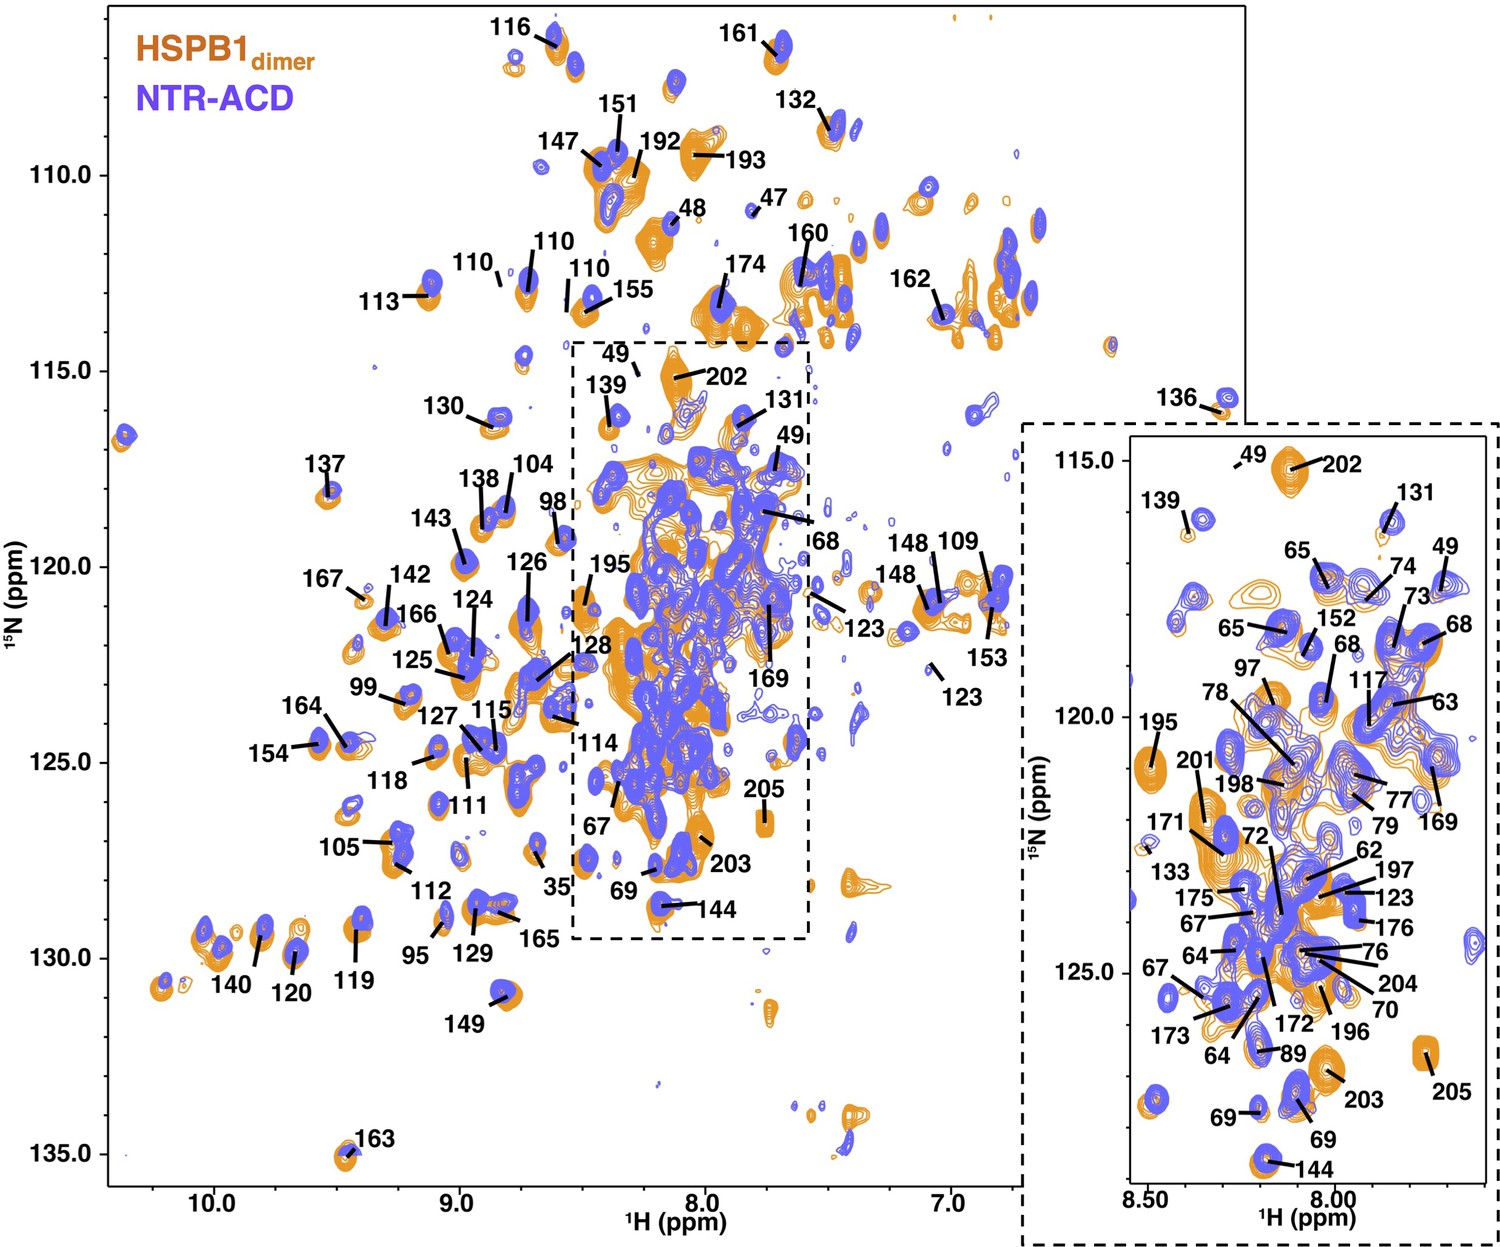
NMR spectra comparison of HSPB1dimer and NTR-ACD.
1H-15N HSQC-TROSY spectra of the two constructs, showing considerable overlap; strong peaks in the center of the spectrum correspond to disordered regions of the protein (NTR and CTR). Center peaks are omitted for clarity and can be seen in the zoomed panel, which is at a higher noise level to better separate strong peaks.
Figure 2—figure supplement 2
Perturbed residues in the mixed 15N-B1-ACD/NTR-ACD dimer spectrum.
Residues for which a distinct, new peak arises in the same position as the NTR-ACD spectrum are highlighted in red. These mainly cluster around the β4/β8 groove. Residues for which the peak is perturbed, but there is not a clear, new peak are highlighted in teal. These occur in and around the dimer interface.
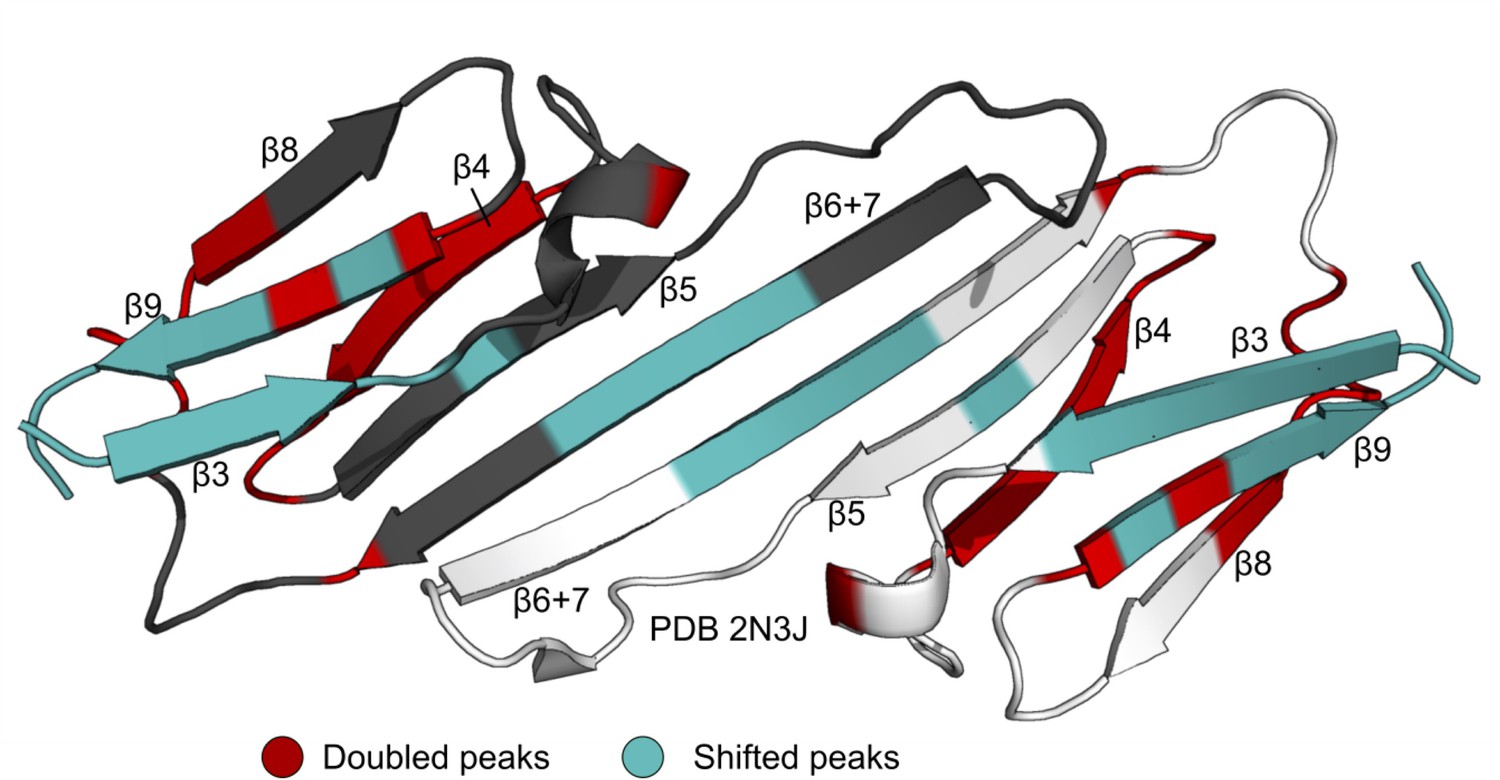
Figure 3
Summary of results from peptide-binding and PRE NMR experiments.
Regions of the ACD that are perturbed upon peptide binding or lose intensity in the presence of a spin label are highlighted on the HSPB1 primary structure (top) and NMR structure (PDB 2N3J, bottom). The peptide from the Trp-rich region did not cause significant perturbations, and the presence of a spin label at position 65 caused widespread, nonspecific intensity loss, so these were not included in the bottom panel.
Figure 4 with 1 supplement
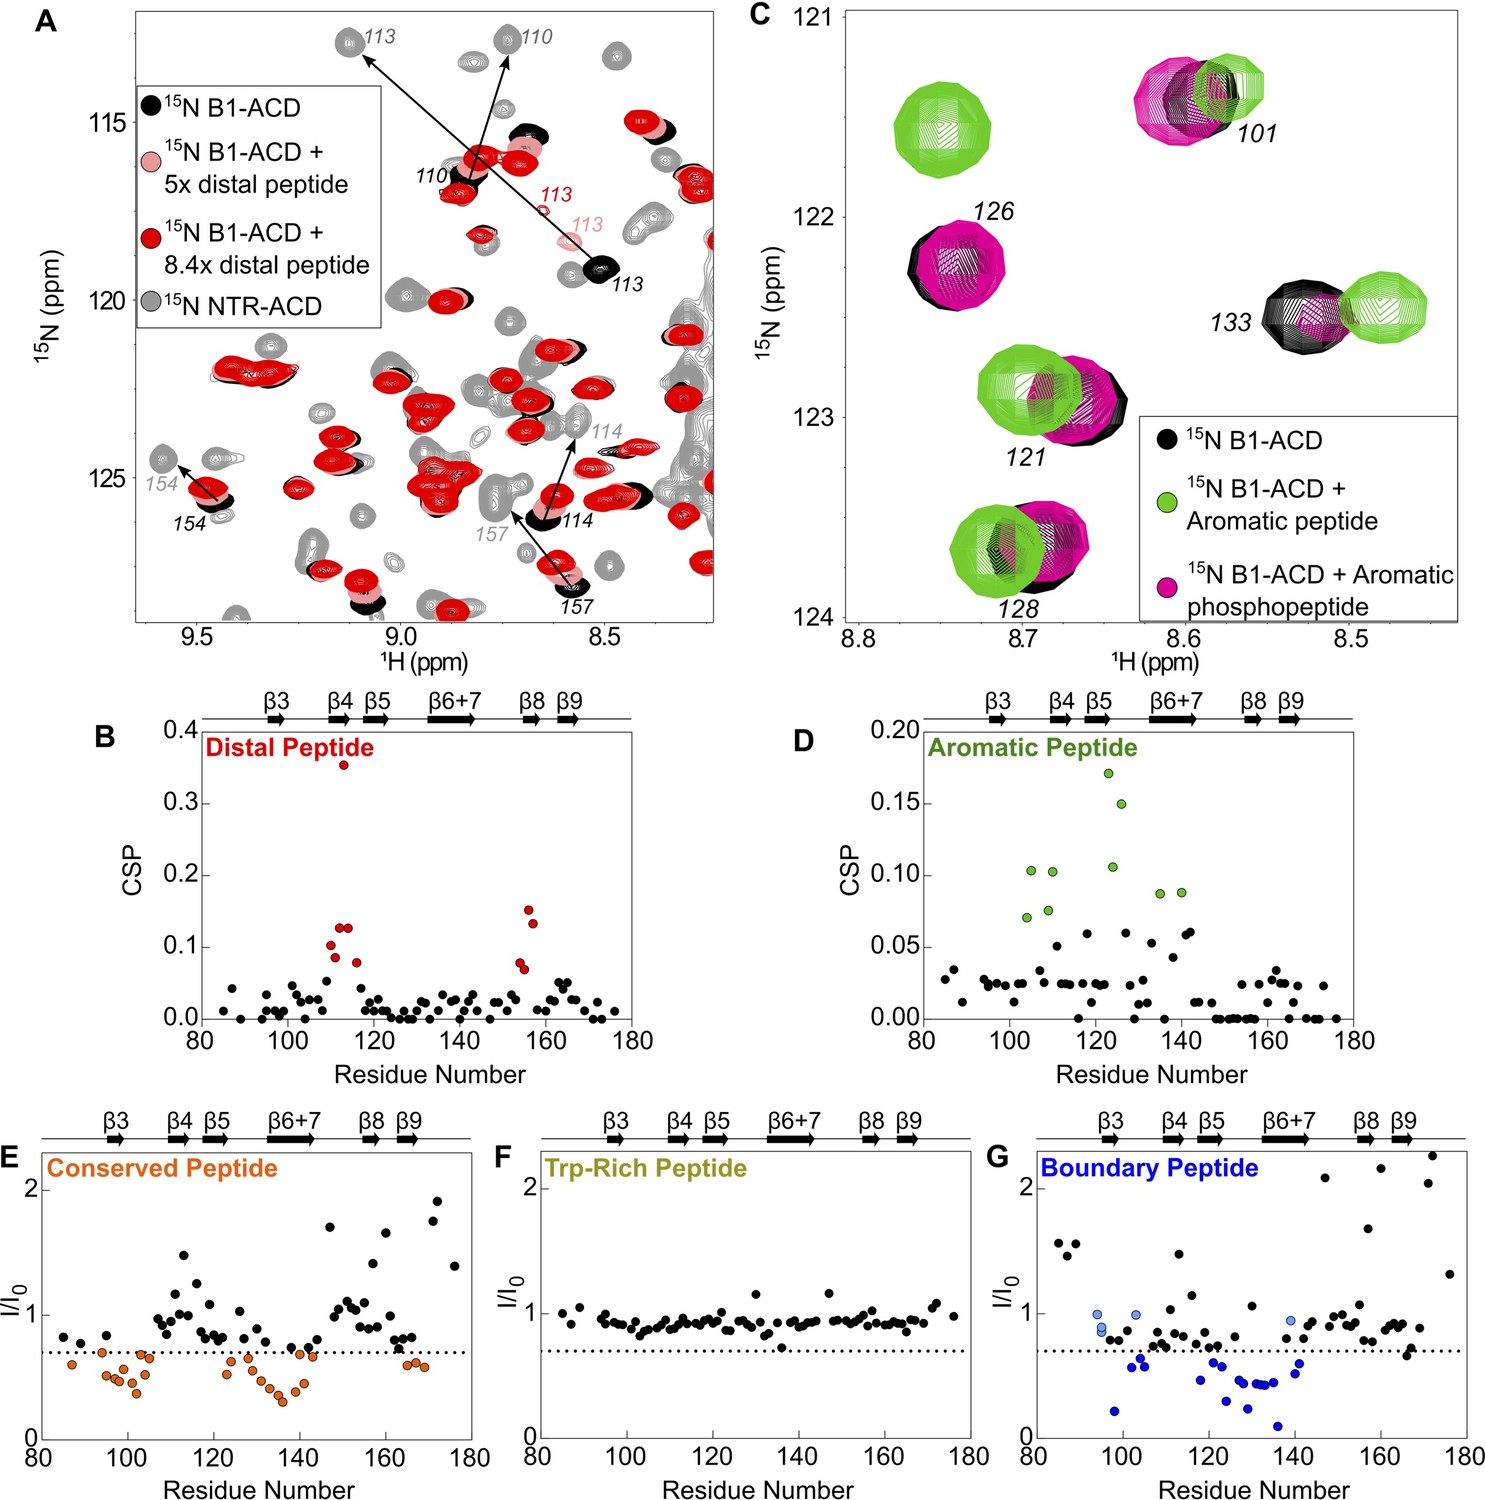
Perturbations of 15N-B1-ACD due to peptide binding.
(A) The distal peptide, consisting of HSPB1 residues 1–13, causes CSPs in the 15N-HSQC spectrum of B1-ACD (black). Peak shifts occur along a trajectory toward the peak positions of the same residues in the 15N-HSQC spectrum of NTR-ACD (gray, NTR-ACD; pink, five molar equivalents; red, 8.4 molar equivalents). (B) The strongest CSPs (red dots) map to residues in the β4/β8 groove. (C) The aromatic peptide (residues 12–27) causes CSPs in the spectrum of B1-ACD (green vs. black), but these are weakened when the peptide contains phosphoserine at site 15 (pink). (D) The CSPs map to residues in loops 3/4 and 5/6 and strand β6+7 (green dots). (E) The conserved peptide (residues 25–37) causes intensity loss in peaks in the 15N-HSQC spectrum of B1-ACD corresponding to strands β3, β6+7, and β9. Peaks that lose more than 30% of their original intensity are colored in orange. (F) The Trp-rich peptide (residues 37–53) does not cause significant CSPs or intensity loss. (G) The boundary peptide (residues 74–91) causes both CSPs and intensity loss. Peaks that lose over 30% of their initial intensity are colored dark blue, and peaks with CSPs > 0.05 ppm that do not lose 30% of their initial intensity are colored light blue.
Figure 4—figure supplement 1
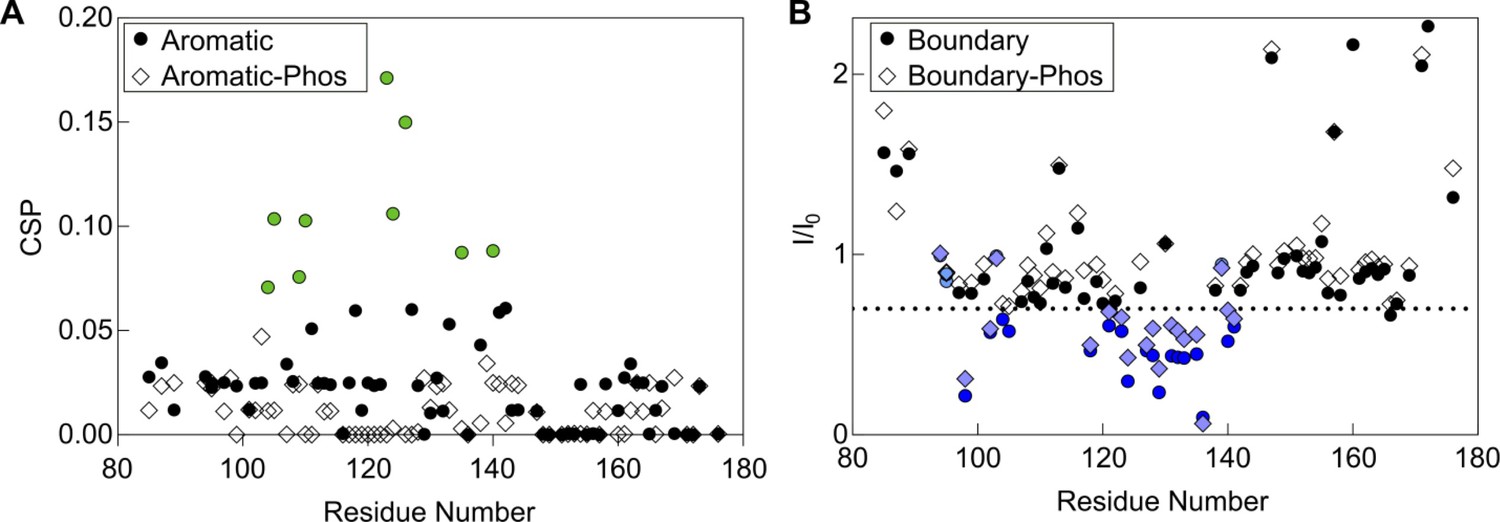
Effect of phosphorylation on peptide binding.
(A) CSPs in the aromatic peptide binding experiment with 15N-B1-ACD. A phosphorylated form of the aromatic peptide with phophoserine at position 15 does not cause strong CSPs (diamonds), indicating that phosphorylation disrupts binding of this peptide to the ACD. (B) NMR intensity loss in boundary region peptide binding experiment with B1-ACD. A peptide with phosphoserine at positions 78 and 82 caused similar perturbations to the non-phosphorylated peptide, indicating that phosphorylation does not have a direct effect on this interaction. Colored points lost >30% intensity, had CSPs over 0.5, or both.
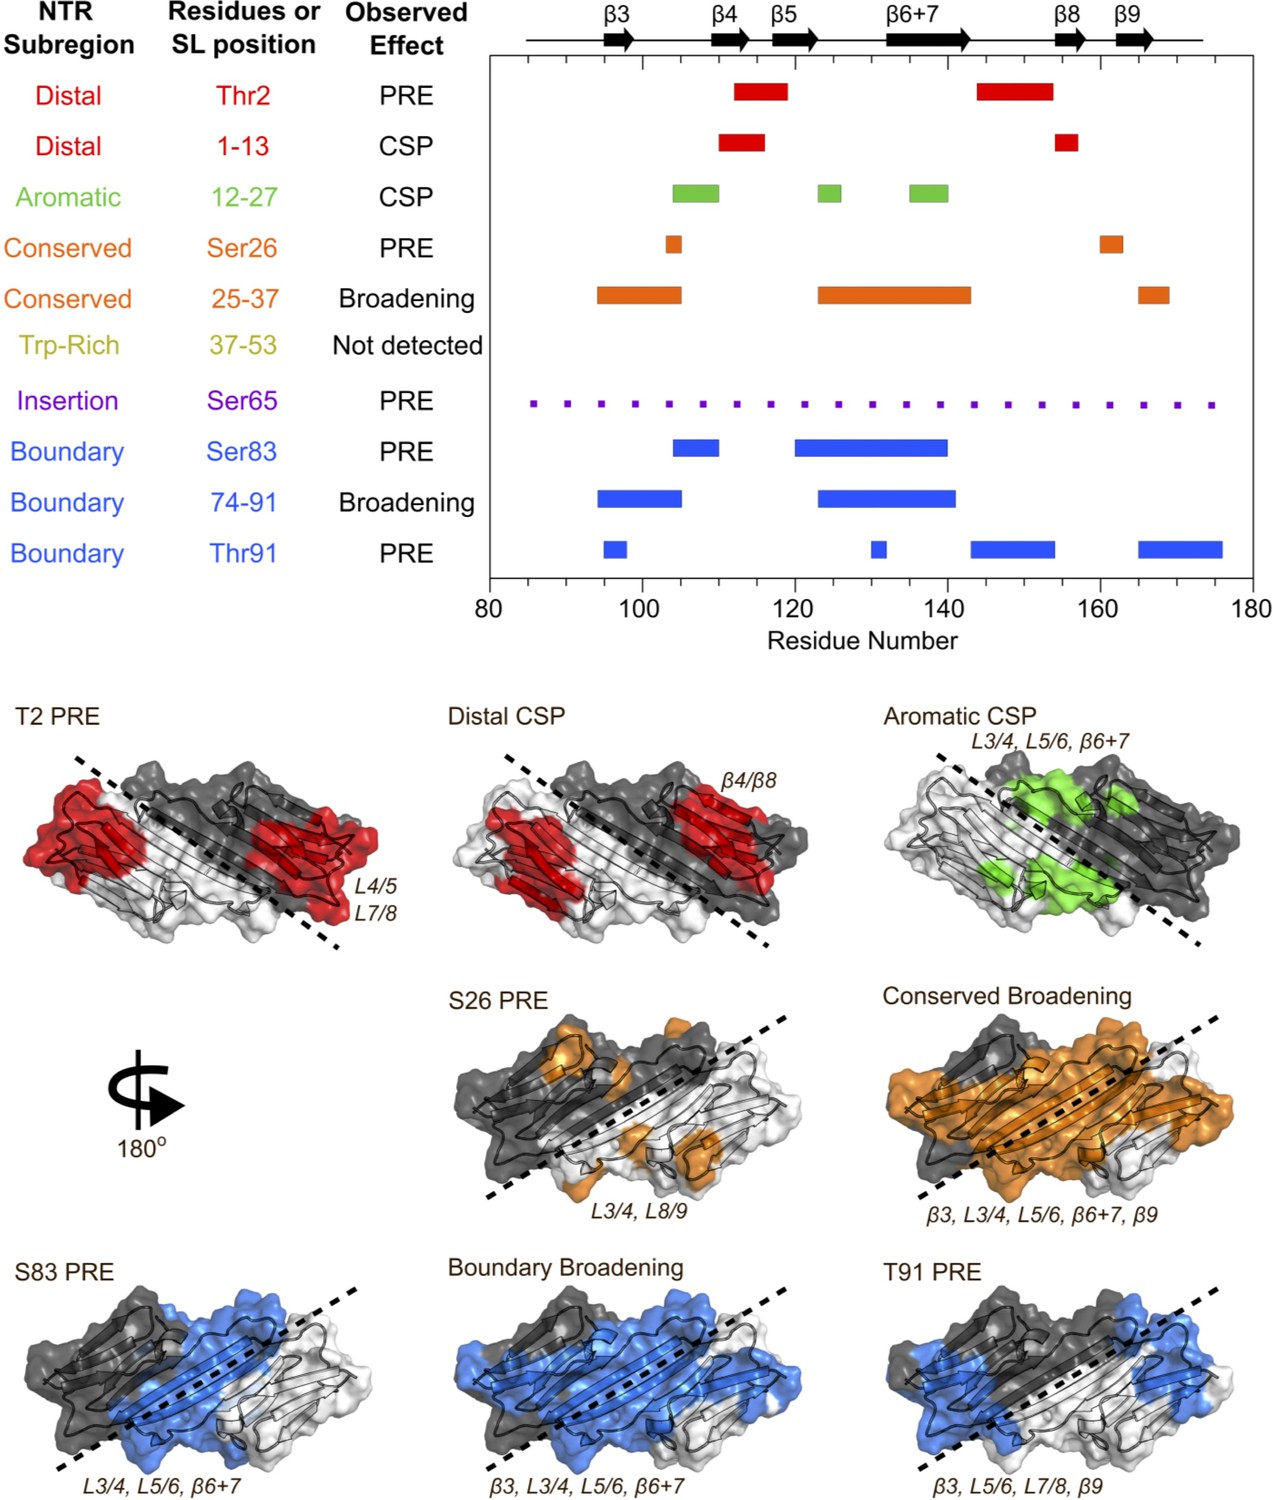
Figure 5

Paramagnetic relaxation enhancement NMR reveals contacts between NTR sites and residues in the ACD.
The spin label MTSL was conjugated at five positions in the NTR of 15N-NTR-ACD. Spectra were collected in the presence of the active spin label (paramagnetic) and after it had been quenched by ascorbate (diamagnetic). Error bars represent the range of two independent experiments. Peaks that lose more than 40% of their intensity are highlighted in color, and peaks that lose more than 70% are shown in lighter colors.
Figure 6
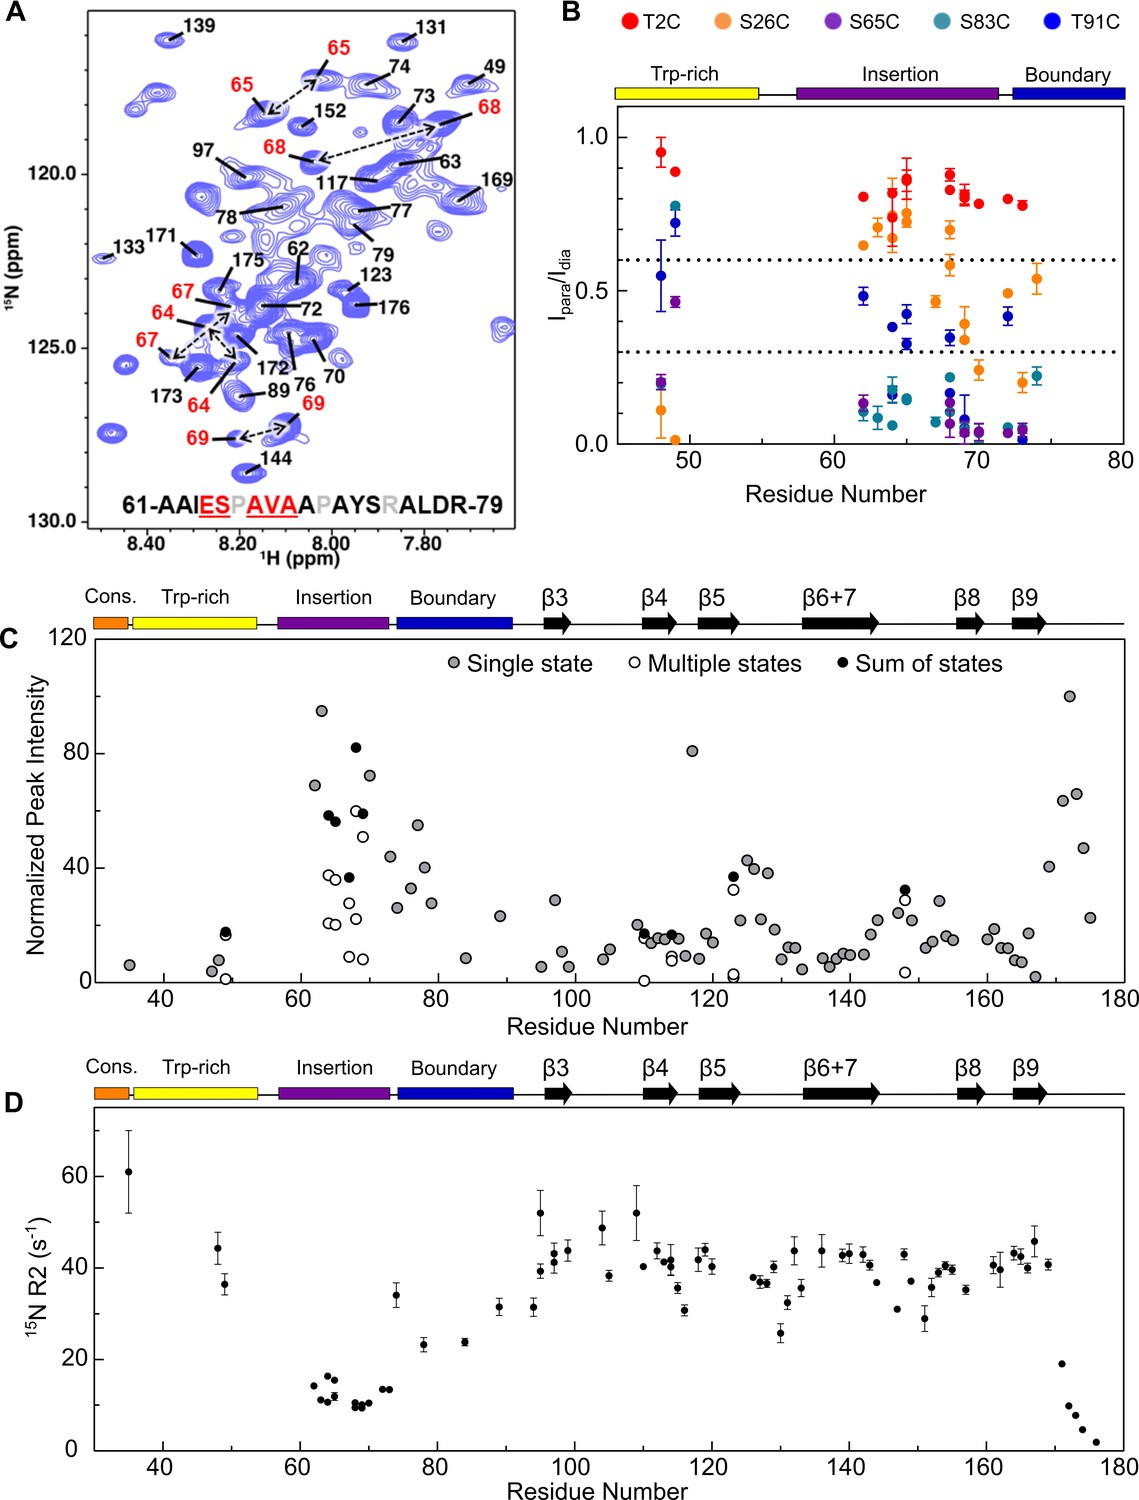
Assignment of NTR residues reveal disorder and heterogeneity.
(A) 1H-15N HSQC-TROSY spectrum of NTR-ACD, highlighting strong peaks in the center of the spectrum that correspond to disordered regions of the protein (NTR and CTR). For part of the NTR, pairs of peaks are assigned to the same residue indicating conformational heterogeneity (red in sequence and peak labels). (B) Summary of PRE effects from previously described spin label positions on assigned regions of the NTR. (C) Relative intensities of all non-overlapping peaks assigned in NTR-ACD, including sums of peaks corresponding to different conformations (most intense peak = 100). (D) 15N transverse relaxation rates (R2) of assigned residues in NTR-ACD.
Figure 7 with 2 supplements
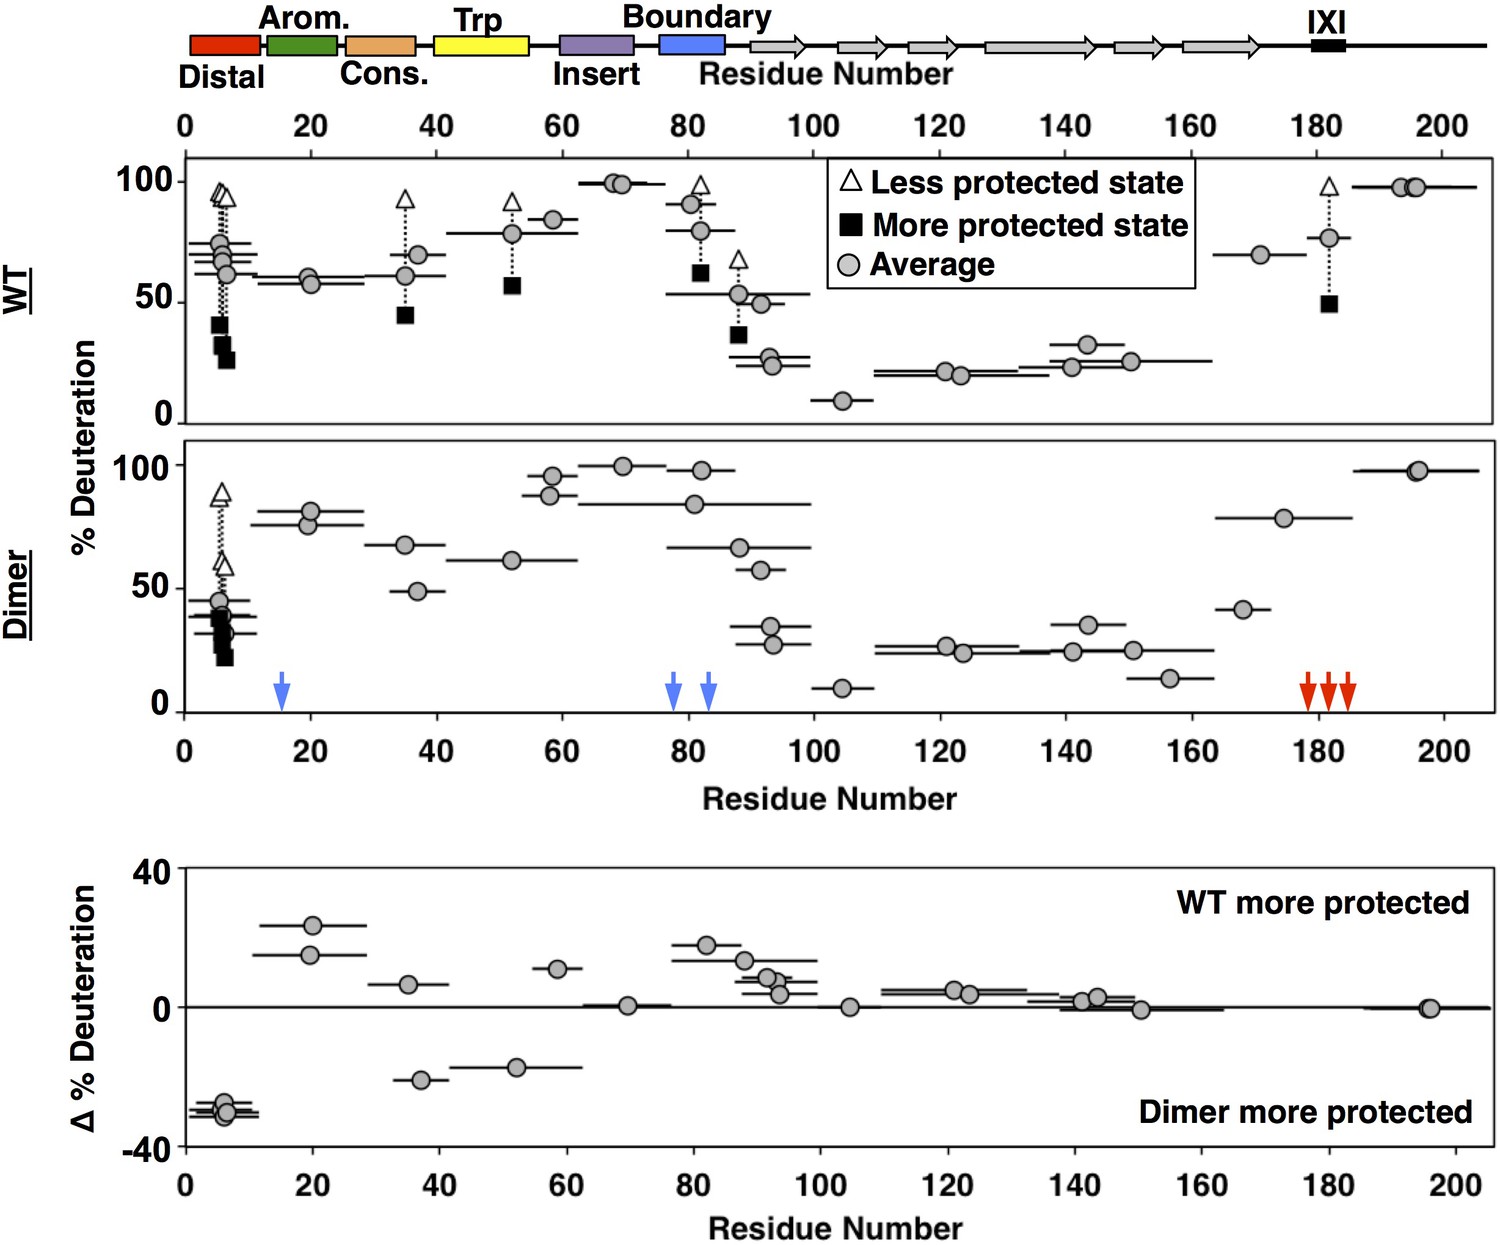
HDXMS analysis of WT oligomers and HSPB1dimer reveals changes in protection and heterogeneity in the NTR.
Representative peptides are indicated as horizontal bars. The midpoint of each peptide is represented by a gray circle showing the deuteration level of the peptide after 3 s (see Source Data one for full kinetic table). For peptides that show a bimodal distribution (different states), black squares and white triangles represent the more- and less-deuterated populations, and the gray circle represents the weighted average deuteration. Blue and red arrows indicate sites of mutation used to generate HSPB1dimer. The difference in deuteration level between WT and HSPB1dimer is shown for each peptide in the bottom plot. Although identical peptides for the start of the CTR cannot be compared due to the mutations introduced, the profile for the 164–185 peptide in HSPB1dimer is consistent with the high level of deuteration observed for peptides 164–178 and 179–185 in WT oligomers.
-
Figure 7—source data 1
HDXMS profiles for all forms of HSPB1.
The deconvoluted fractions of each population from bimodal distributions are shown in the first two columns for each mutant. The fractional deuterium uptake for each of these populations is shown in the next two columns, followed by a weighted average in the fifth column. All spectra were binomial fit using HX-Express (Guttman et al., 2013).
- https://doi.org/10.7554/eLife.50259.015
-
Figure 7—source data 2
Statistics for HDXMS experiments on all mutants.
Statistics listed are for C137S forms of the following mutants of HSPB1. Sequence coverage takes into account the lack of observed deuterium uptake in the first two residues of each peptide. Back-exchange is calculated as the % deuterium uptake of the fully deuterated sample divided by the theoretical maximum deuteration for each peptide (89%), excluding prolines and the first two residues.
- https://doi.org/10.7554/eLife.50259.016
Figure 7—figure supplement 1
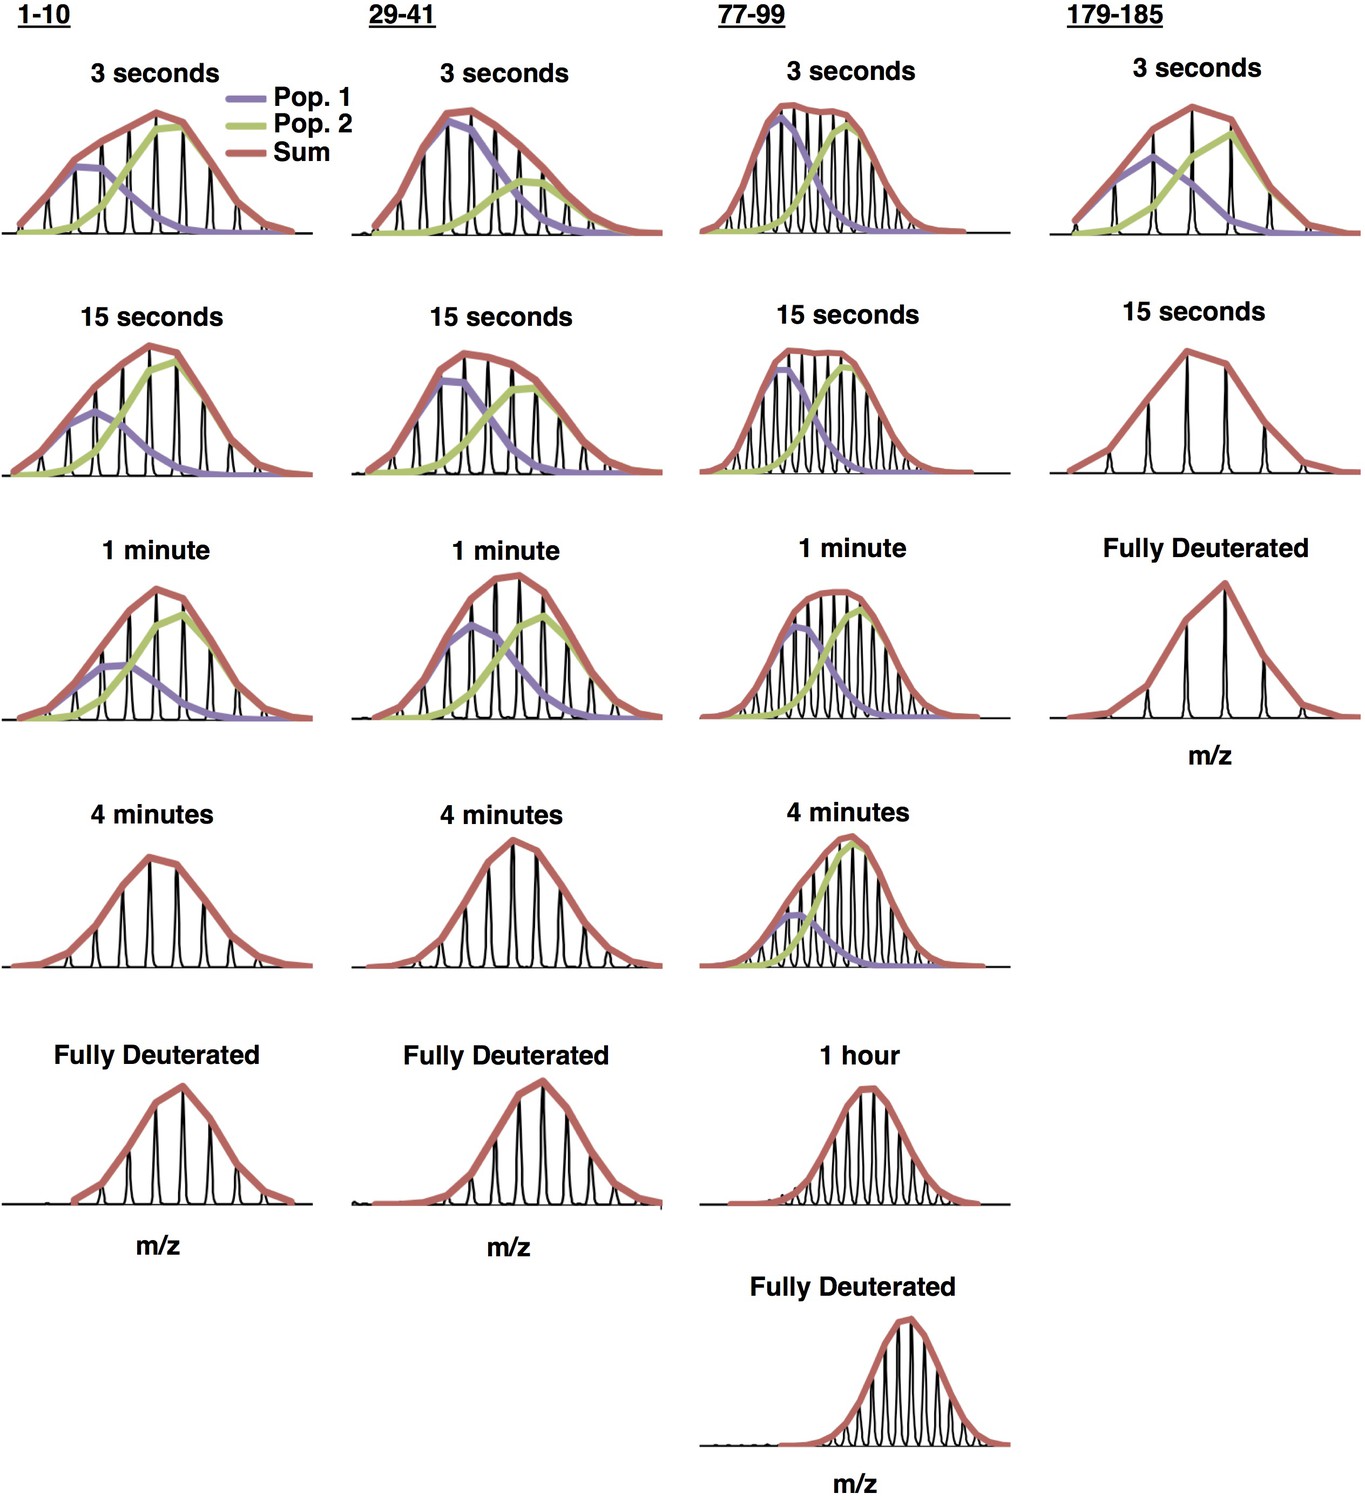
Example bimodal spectra for peptides 1–10, 29–41, 77–99, and 179–185 of C137S oligomers.
Multiple populations (bimodals) are observed in earlier timepoints for several regions of the protein. HX-Express (Guttman et al., 2013) was used to deconvolute the two populations into two binomial fits. The sum of the binomial fits are shown in red.
Figure 7—figure supplement 2
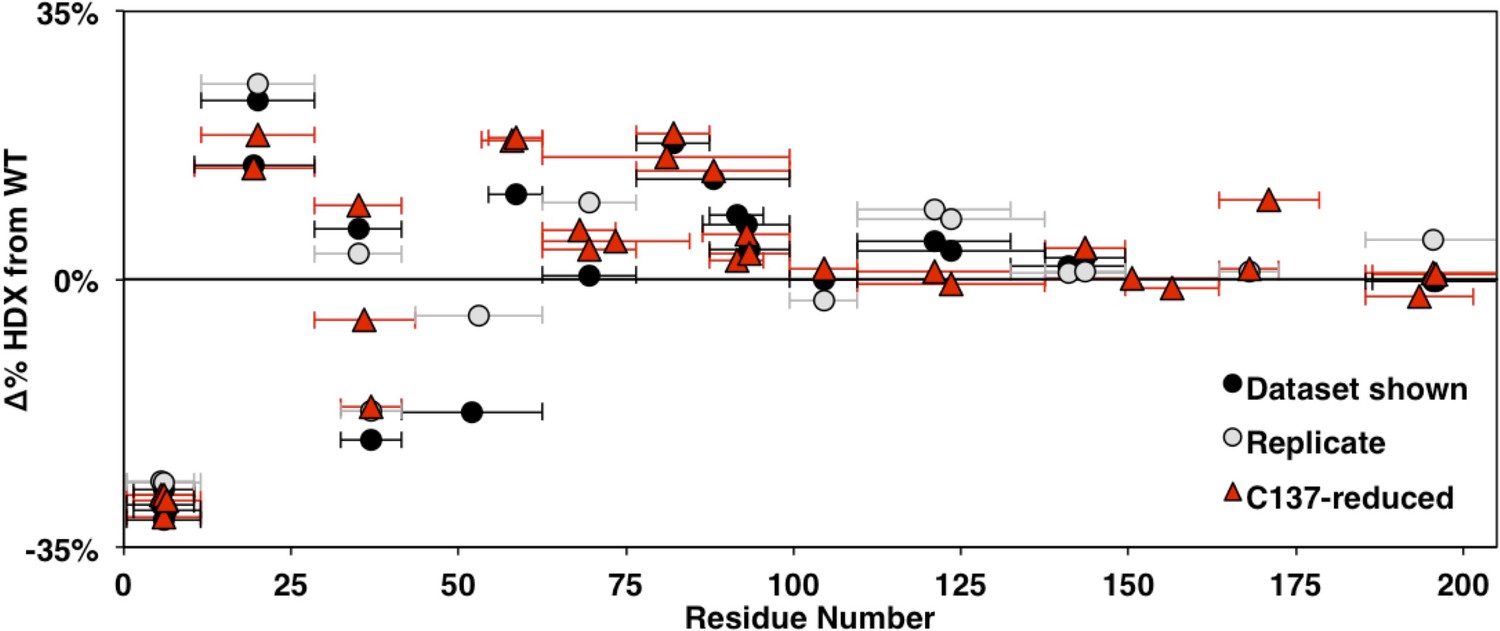
Comparison of changes in HDXMS between WT and HSPB1dimer across biological replicates at 3 s.
Identical constructs expressed, purified, and examined separately are shown in black and gray. The native C137-containing constructs with reducing agent are shown in red. Points in the upper half indicate decreased protection in HSPB1dimer and points in the lower half indicate increased protection relative to WT oligomers. Qualitatively similar patterns are observed throughout the NTR.
Figure 8 with 1 supplement
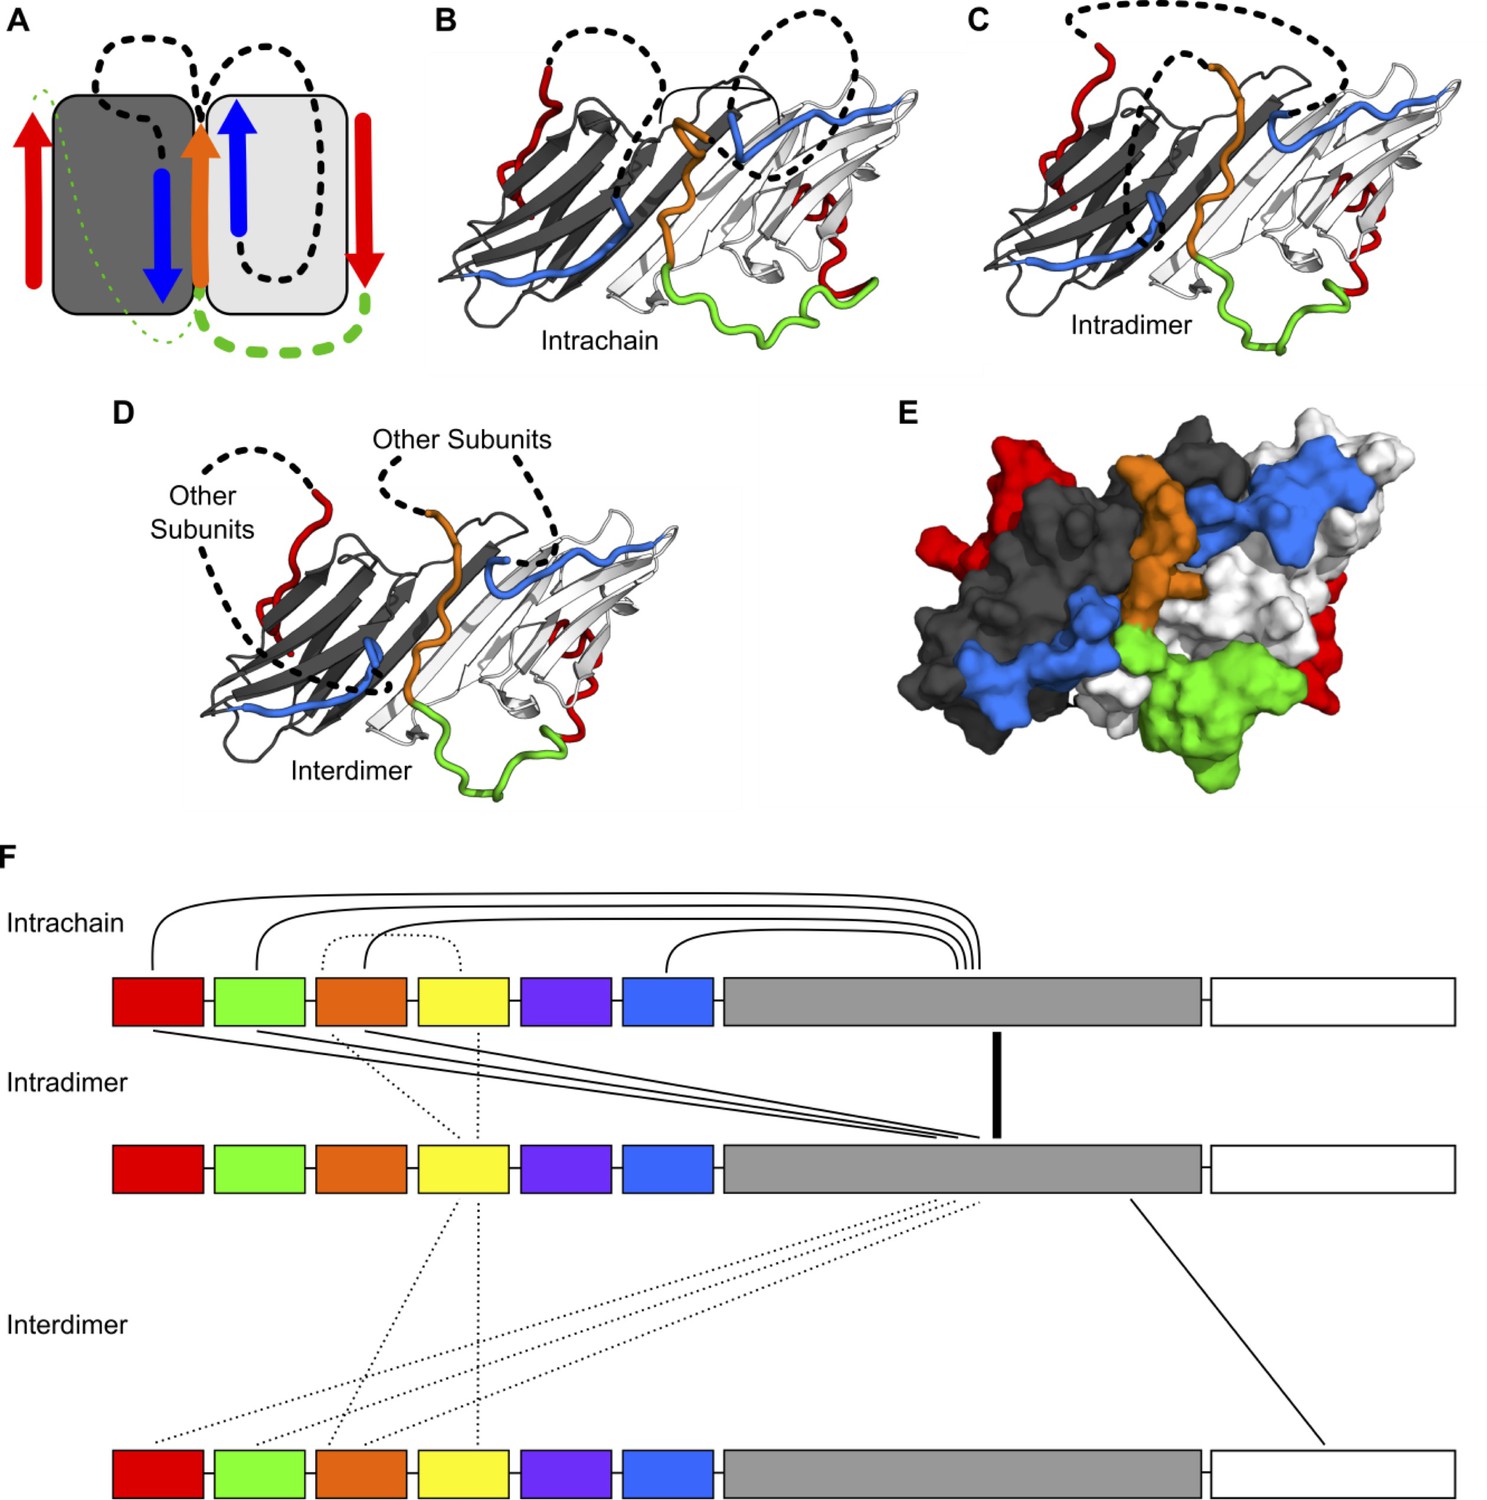
Modeling of NTR-ACD interactions.
(A) Cartoon showing the starting structure of the ACD with two copies of the distal motif (red arrows), one copy of the conserved motif (orange arrow), and two copies of β2 (blue arrows). The missing loops can be modeled with four potential connectivities. Either copy of the distal motif can be connected to the conserved motif (green lines), which can then be connected to either copy of β2 (black lines). Based on our NMR results, we believe it more likely that the conserved motif is connected to the distal motif oriented in the opposite direction (thicker green line), so we only include structures with this connection in this figure. (B) If the conserved motif is connected to the β2 strand oriented antiparallel to it, the contacts between the distal and aromatic regions and the ACD occur within the same polypeptide chain. (C) If the conserved motif is connected to the other β2 strand, the contacts occur between different chains but within the same dimer. (D) It is likely that within the context of a higher-order oligomer, similar contacts could occur between subunits that are not part of the same ACD dimer building block. (E) A surface representation of the model in panel C shows that the regions of the NTR included in our model make extensive contact with the ACD and match the perturbed regions highlighted in Figure 3. (F) The types of intra- and interchain contacts that are possible within HSPB1 dimers and higher-order oligomers are outlined. Solid lines represent interactions for which we have evidence from our NMR, HDXMS, and modeling data. Dotted lines represent hypothetical interactions for which we do not have direct evidence but which we believe are likely to occur.
Figure 8—figure supplement 1
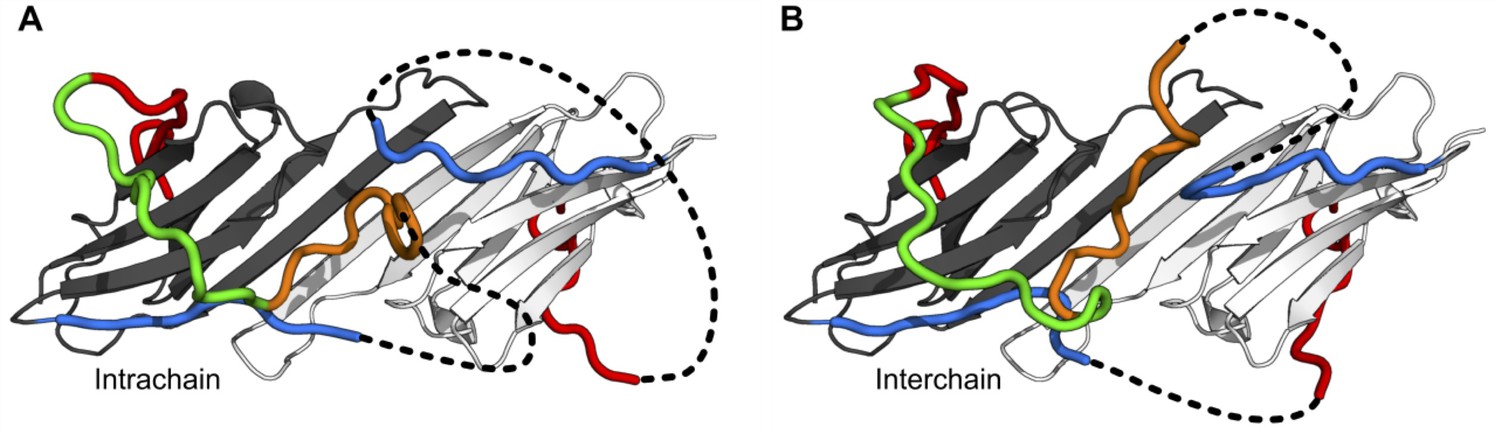
Models in which the conserved motif is connected to the distal motif oriented in the opposite direction.
While we believe this connectivity is less favored than the models shown in the main figure, we were able to generate physically realistic models. Depending on which copy of β2 the conserved motif is connected to, contacts between the distal and aromatic regions and the ACD can occur intrachain (A) or interchain (B).
Figure 9 with 1 supplement

Analysis of disease-associated HSPB1 NTR mutations G34R, G84R, and P39L.
(A) HDXMS analysis of each mutant. Representative peptides are indicated as horizontal bars. The midpoint of each peptide is represented by a gray circle showing the deuteration level of the peptide after 3 s (see Source Data one for full kinetic table). For peptides that show a bimodal distribution (different states), black squares and white triangles represent the more or less deuterated populations, and the gray circle represents the weighted average deuteration. Arrows indicate sites of mutation (G34R, G84R, and P39L). The deuteration difference from WT for each disease mutant is shown for each peptide in the bottom plot. (B) NMR intensity loss in G34R-modified conserved peptide binding experiment with ACD. ‘WT’ conserved peptide intensity ratios are shown as circles, and G34R peptide ratios as diamonds. Affected residues below the dotted line are colored orange. Fewer residues are affected by mutant peptide binding and to a lesser extent. (C) Analogous peptide binding experiment with Trp-rich peptide and P39L-modified peptide. In both cases, no notable intensity losses occur.
Figure 9—figure supplement 1
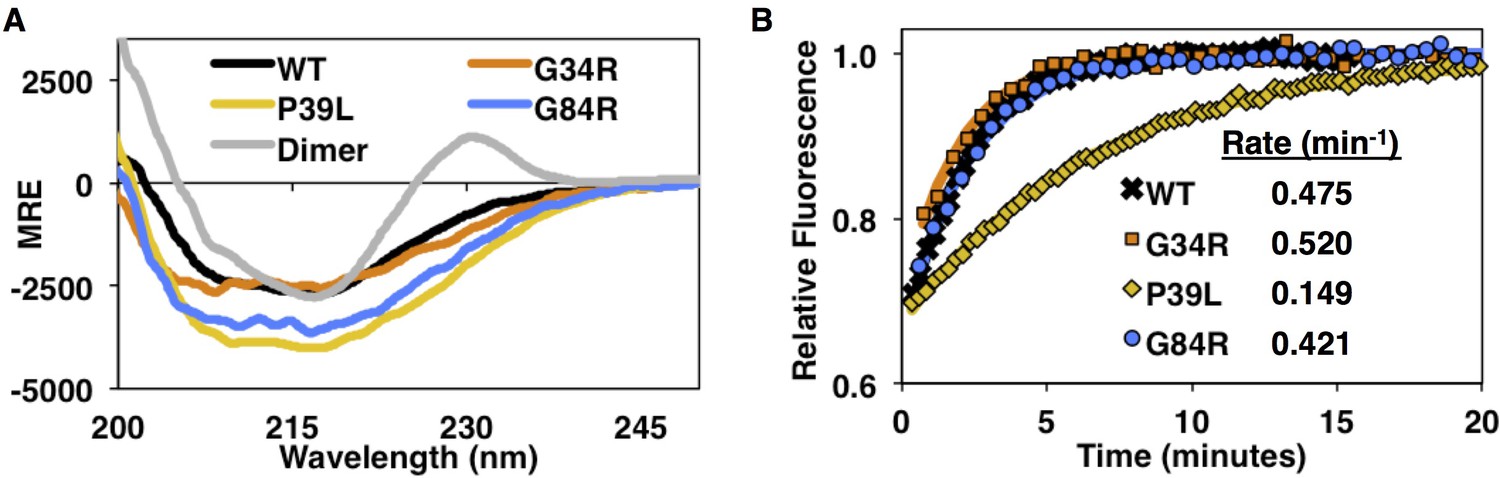
Circular dichroism spectra and subunit exchange kinetics of disease mutants.
(A) Far-UV CD spectra show overall similar secondary structure for WT, G34R, P39L, and G84R mutants, but P39L shows the strongest increase in ellipticity. The HSPB1dimer has a unique positive peak at 230 nm as previously reported (Baughman et al., 2018). (B) Fluorescence-based subunit exchange of mutant oligomers at 37°C. AlexaFluor-488 labeled oligomers (fluorescence quenched) are mixed with unlabeled oligomers. As subunits exchange among oligomers, fluorescence increases as quenching is released. Only P39L has a dramatic decrease in the subunit exchange rate.
Additional files
-
Transparent reporting form
- https://doi.org/10.7554/eLife.50259.021
Download links
A two-part list of links to download the article, or parts of the article, in various formats.
Downloads (link to download the article as PDF)
Open citations (links to open the citations from this article in various online reference manager services)
Cite this article (links to download the citations from this article in formats compatible with various reference manager tools)
Interplay of disordered and ordered regions of a human small heat shock protein yields an ensemble of ‘quasi-ordered’ states
eLife 8:e50259.
https://doi.org/10.7554/eLife.50259


