Cryo-EM structures of S-OPA1 reveal its interactions with membrane and changes upon nucleotide binding
- National Key Laboratory of Biomacromolecules, CAS Center for Excellence in Biomacromolecules, Institute of Biophysics, Chinese Academy of Sciences, China
- University of Chinese Academy of Sciences, China
- Center for Biological Imaging, Institute of Biophysics, Chinese Academy of Sciences, China
Figures
Figure 1 with 1 supplement
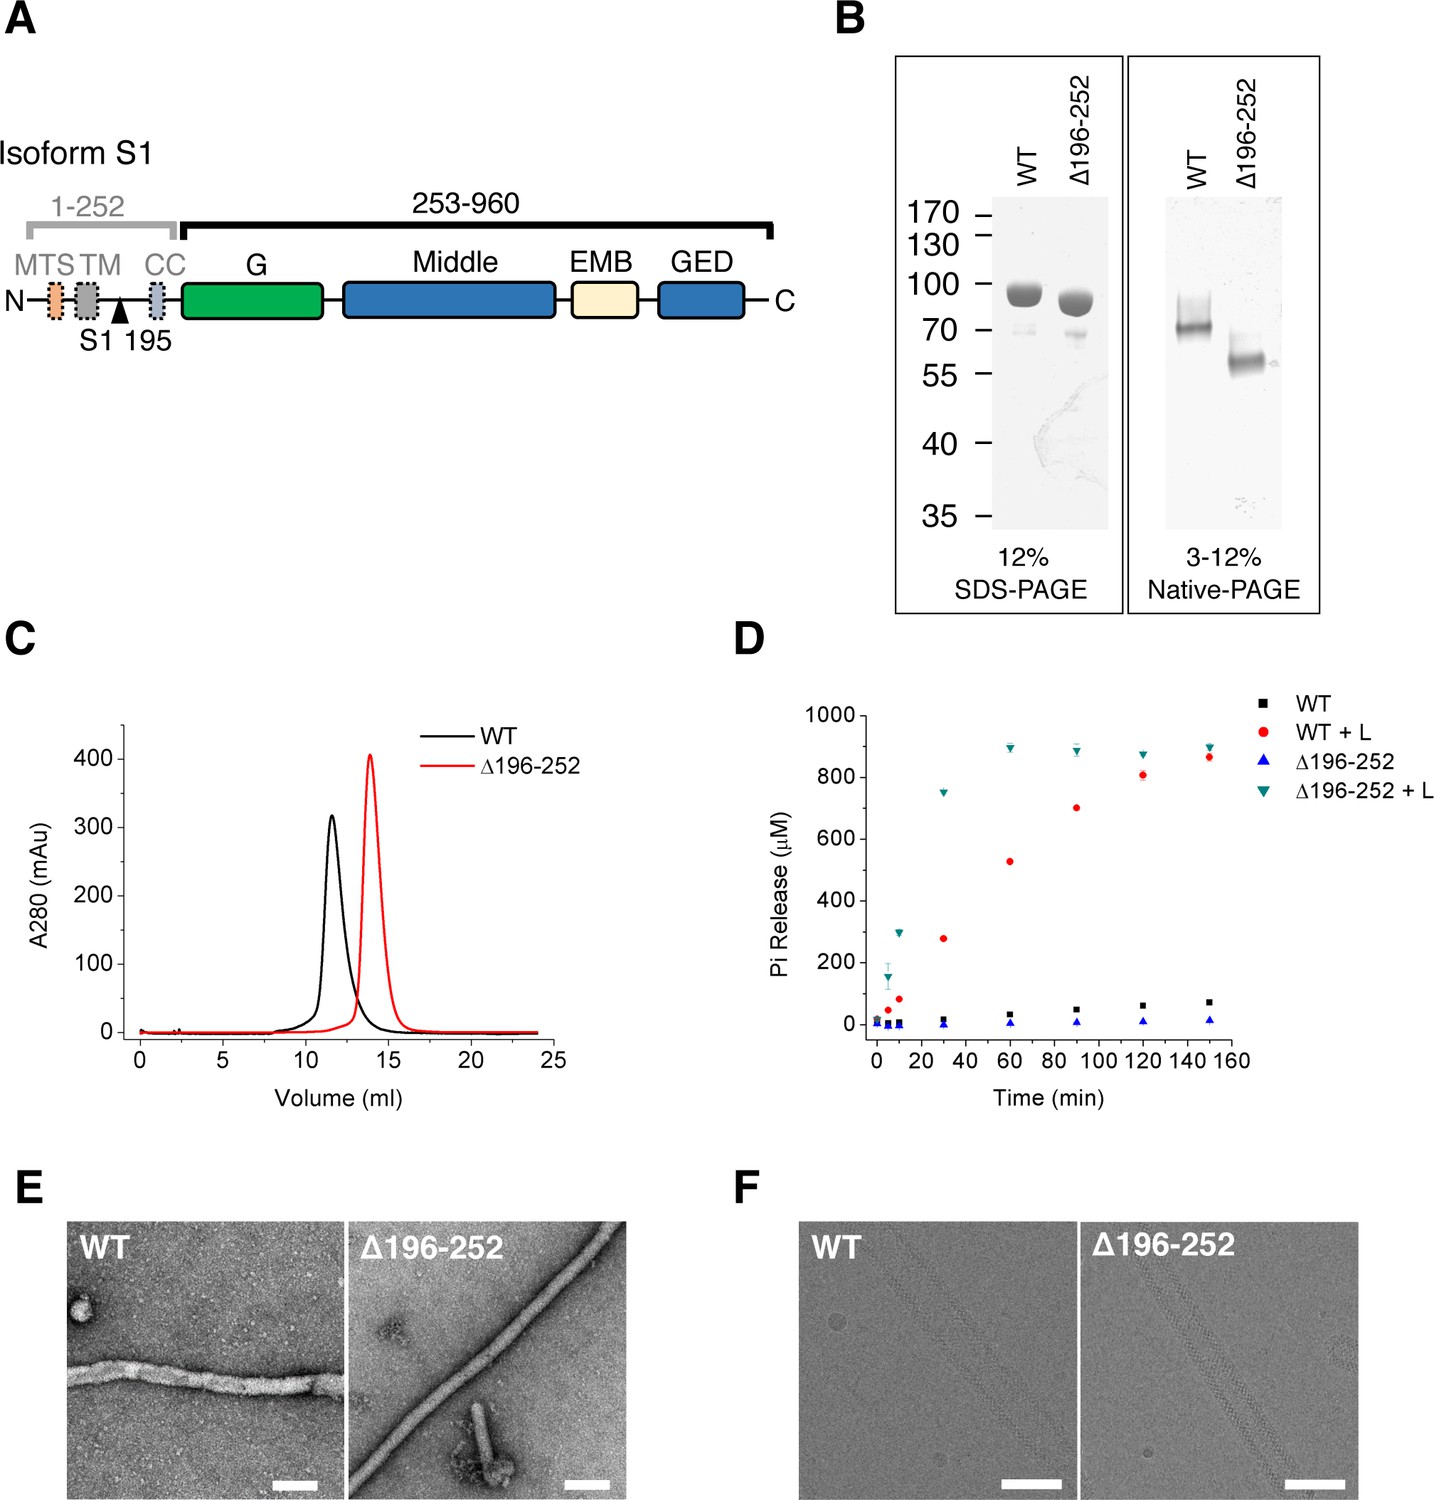
Purification and characterization of S-OPA1.
(A) Domain organization of OPA1. MTS, mitochondrial targeting sequence; TM, transmembrane region; CC, coiled-coil; G, G domain; Middle, middle domain; EMB, extended membrane binding domain; GED, GTPase effector domain. The proteolytic cleavage site S1 in isoform 1 at the 195th residue is indicated by black triangle. (B) SDS-PAGE and native PAGE of wild type S-OPA1 and its truncation form (Δ196-252). (C) Size exclusion chromatography of S-OPA1 using Superdex 200 10/300 GL column (GE Healthcare). (D) Basal and liposome-binding induced GTPase activity of S-OPA1 and Δ196-252. The total free phosphate was measured at each time point after adding GTP to 1 mM and data presented come from 3 independent experiments. See also Source data 1. (E) Negative stain electron micrographs of S-OPA1 coated tubes. Scale bar, 200 nm. (F) Cryo electron micrographs of S-OPA1 coated tubes. Scale bar, 100 nm.
Figure 1—figure supplement 1
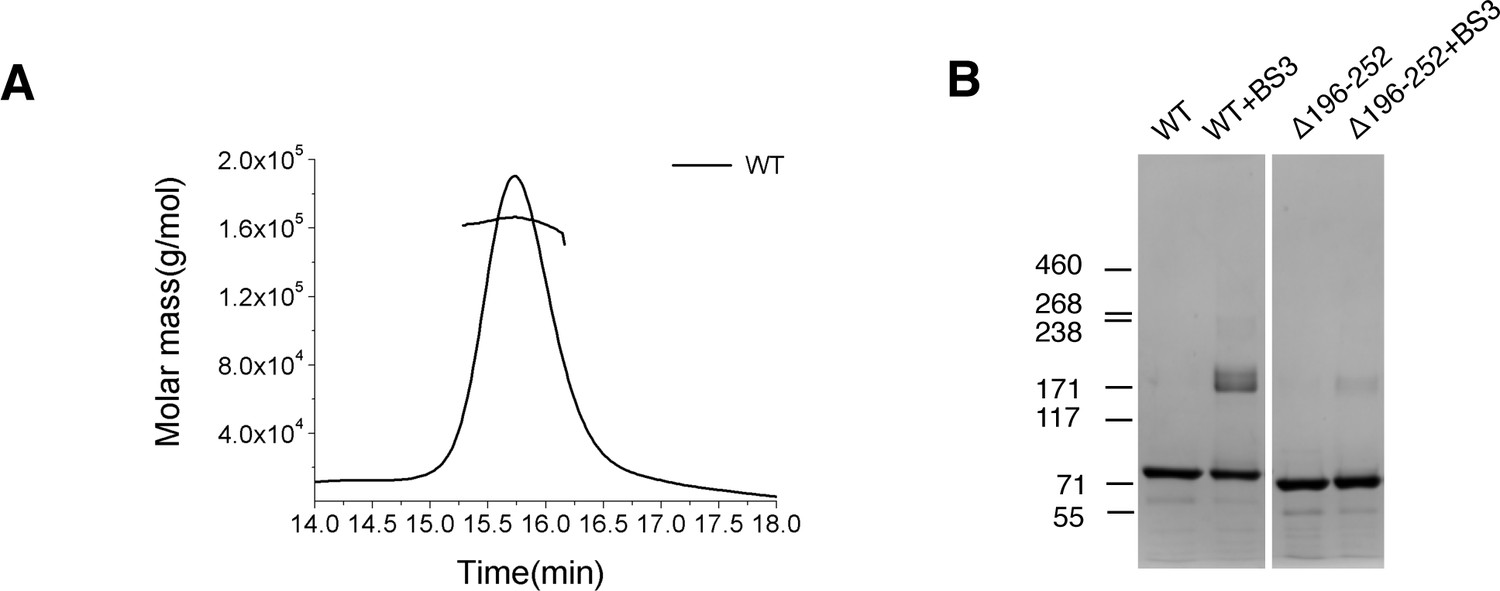
Characterization of S-OPA1.
(A) SEC-MALS (size exclusion chromatography coupled with multi angle light scattering) profile of full-length S-OPA1 (WT). The molecular weight of the oligomer was determined as 164 kDa while theoretical molecular weight of full-length S-OPA1 dimer is 178 kDa. (B) SDS-PAGE of the full-length S-OPA1 and the truncation form Δ196–252 with or without the chemical cross-linker BS3.
Figure 2 with 2 supplements
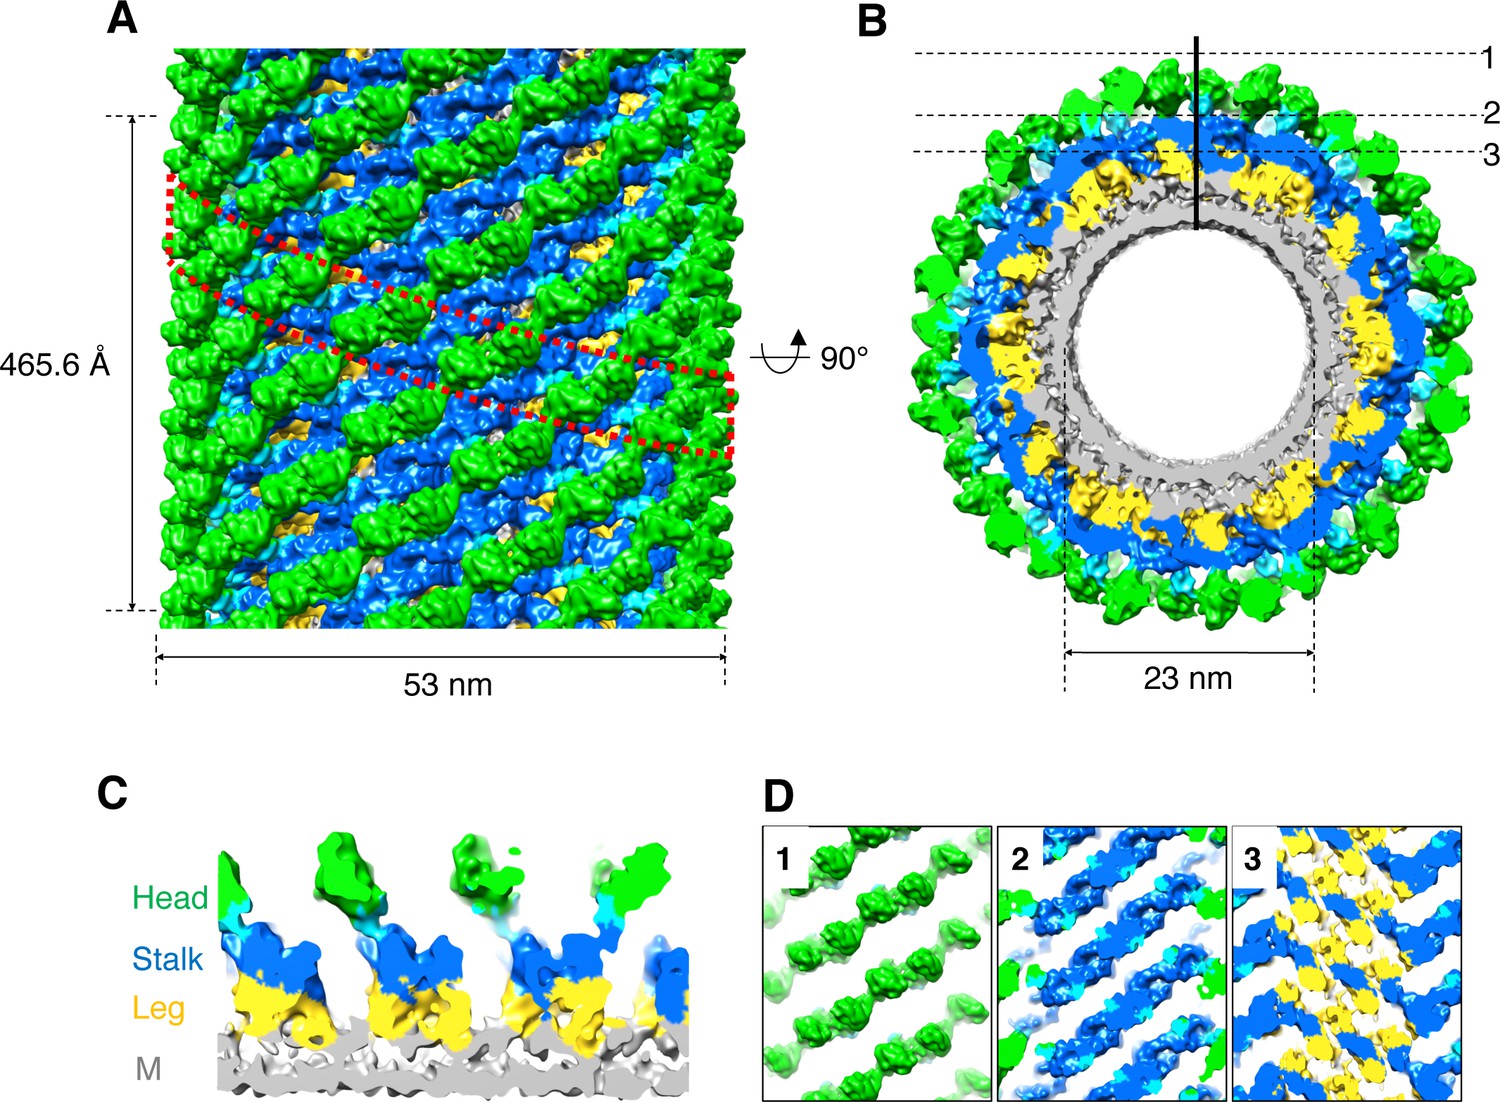
3D reconstruction of nucleotide-free S-OPA1 coated tube.
(A) Side view of cryo-EM map of S-OPA1 coated tube. Other than membrane, the map is subdivided and colored radially into three layers denoting ‘‘leg’’ (yellow), ‘‘stalk’’ (blue), and ‘‘head’’ (green and cyan). The outer diameter and pitch are labeled. A single helical rung is highlighted in red dashed box. (B) Radical cross-section of the tube. The inner diameter is labeled. Dashed black lines denote the planar sections that are rotated by 90° and shown in (D). (C) Cross-section of the tube along the solid vertical black line in (B). The leg, stalk, head, and membrane bilayer density are labeled and colored as in (A). (D) Corresponding cross sections of the tube along the dashed black lines in (B). The density color scheme is same as in (A).
Figure 2—figure supplement 1
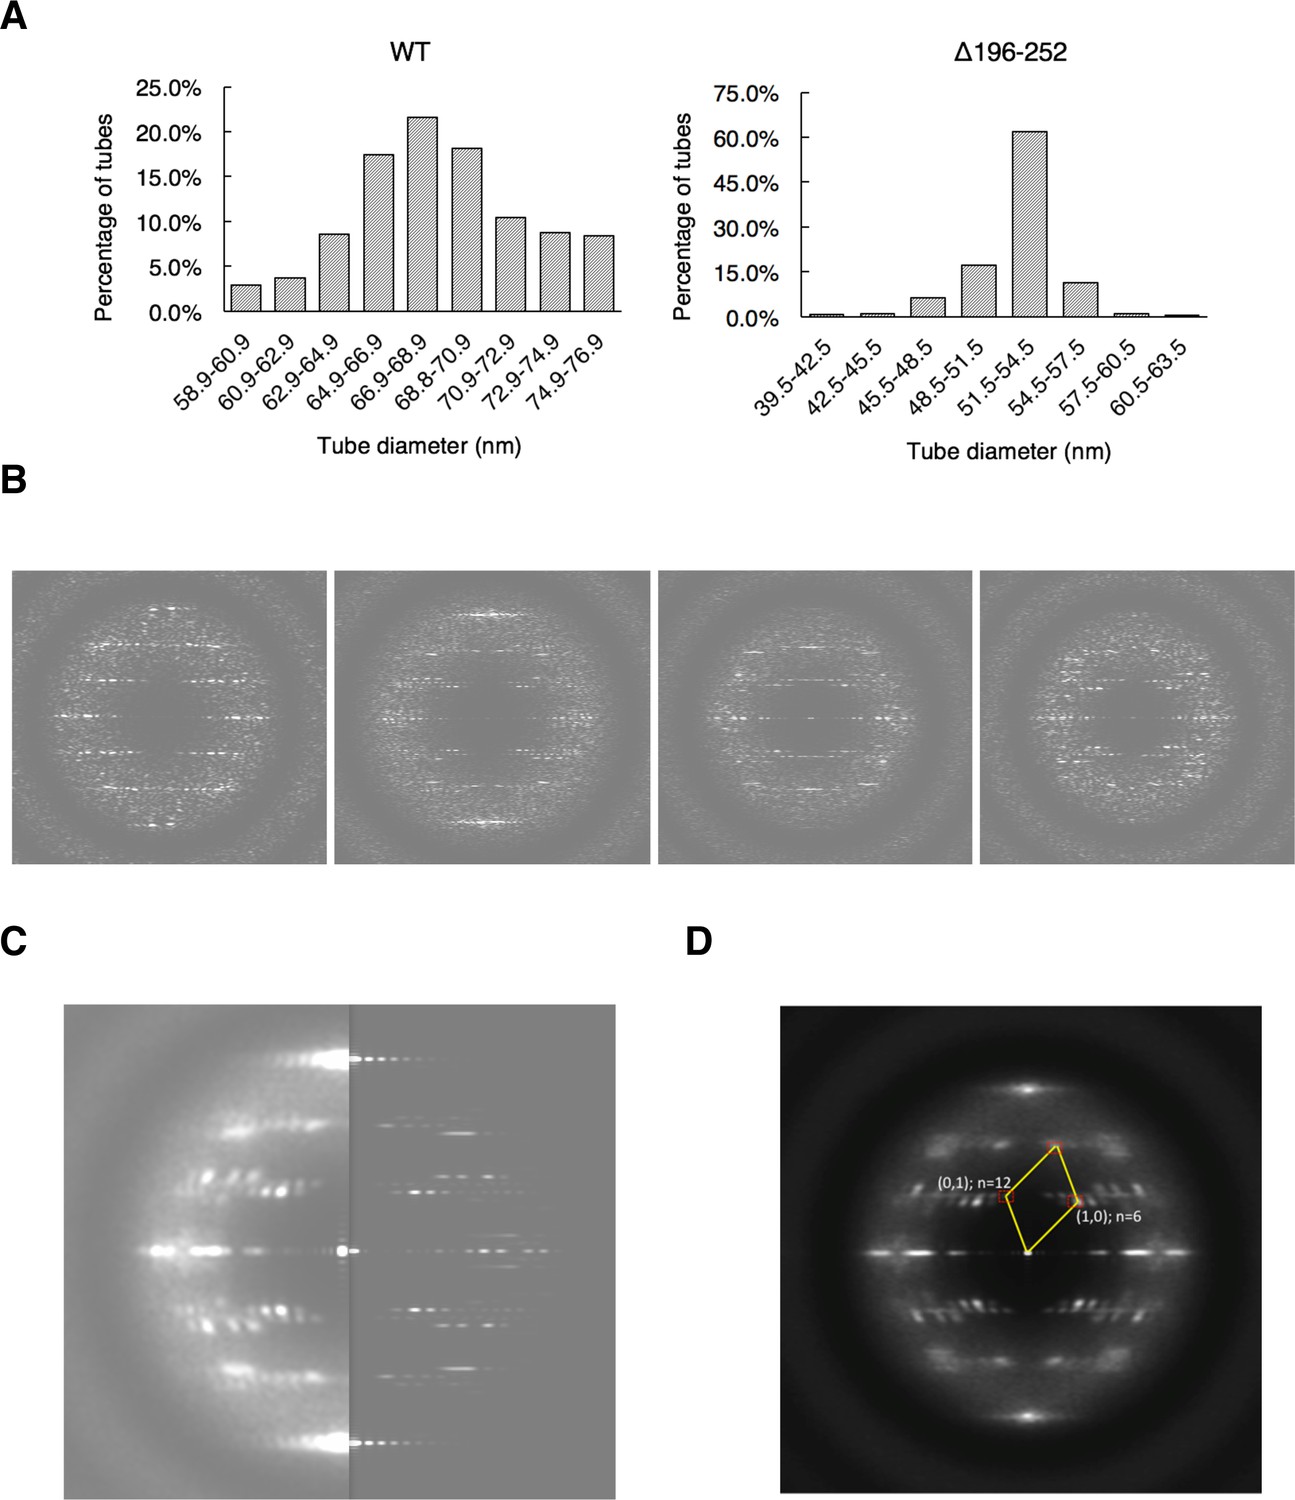
Image processing of S-OPA1 coated tubes.
(A) Diameter distributions of wild type and Δ196–252 coated tubes, respectively. (B) Different diffraction patterns of Δ196–252 coated tubes. (C) Diffraction patterns of the class averaged Δ196–252 coated tubes (left) and the projection of the reconstructed map (right). (D) Index of the layer lines of Δ196–252 coated tube.
Figure 2—figure supplement 2

Sub-tomogram averaging of S-OPA1 coated tubes at nucleotide-free state.
(A) The 3D averaged map of Δ196–252 coated tube viewed at different slicing positions. The bottom panel shows the cross section at the radical direction. The map is colored with the same scheme in Figure 2. The dashed lines denote the slicing positions in the above panels. The structural model derived from the helical reconstruction (Figure 3) is directly superimposed into the map and shown on the right panel. (B) The 3D averaged map of wild type S-OPA1 coated tube viewed with the same scheme in (A).
Figure 3 with 5 supplements
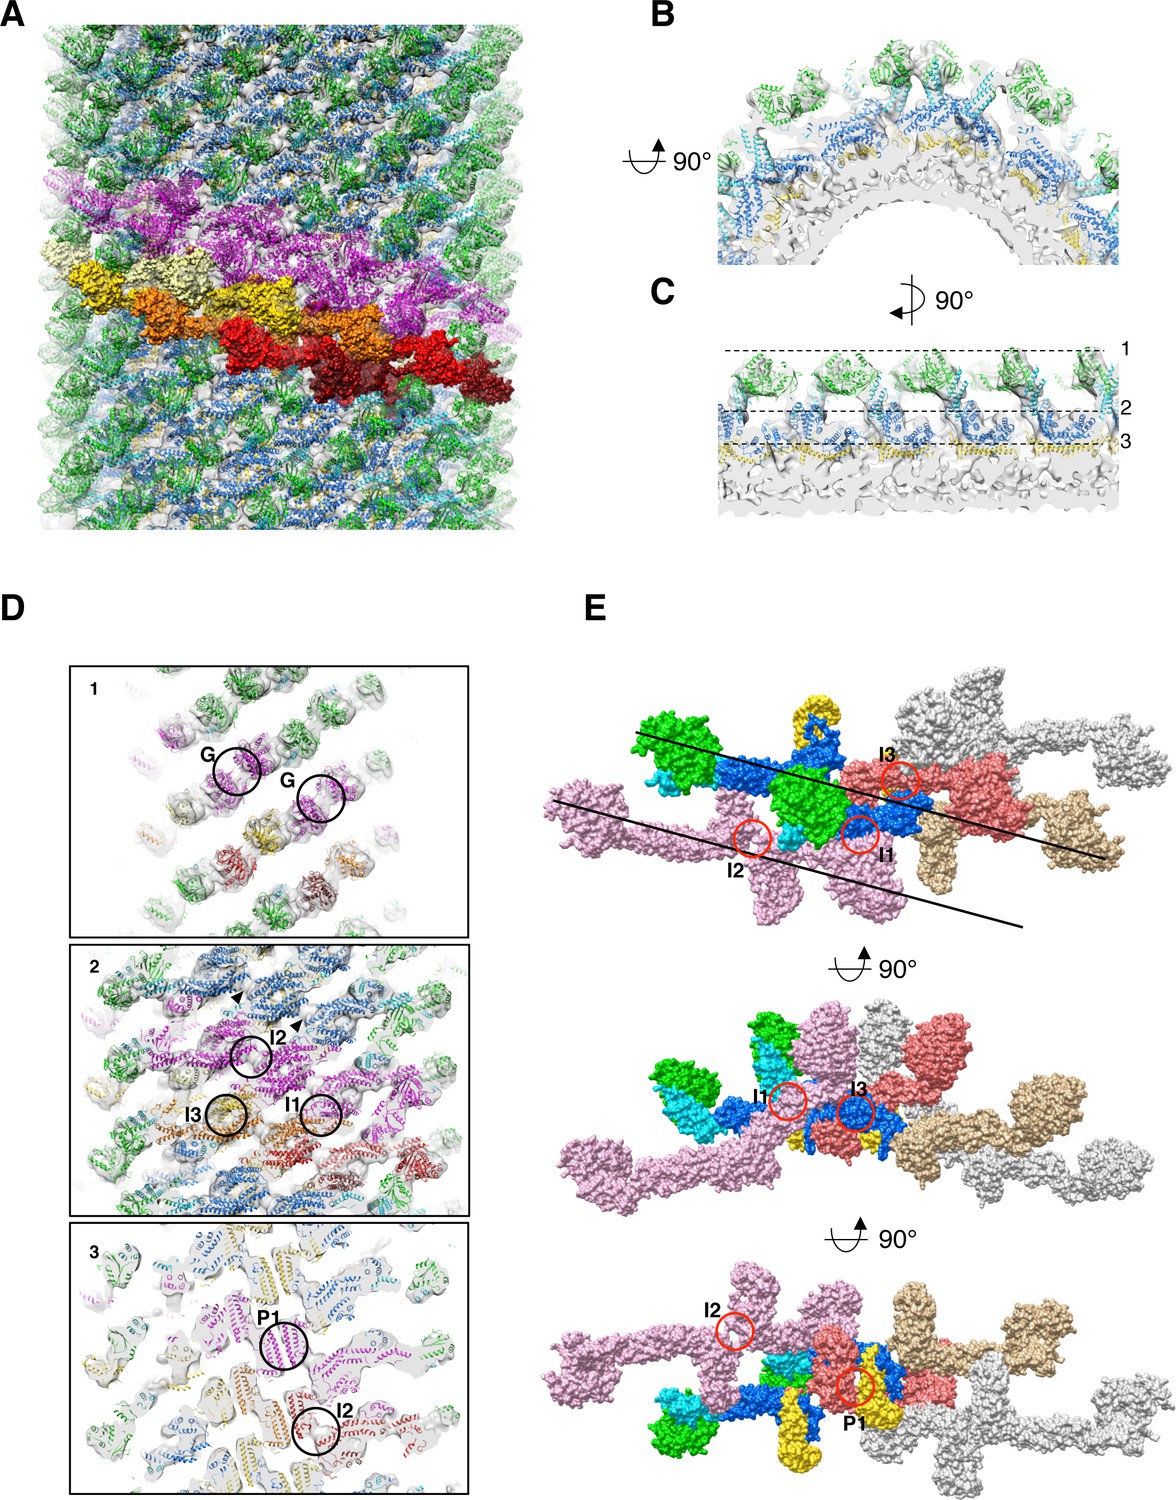
Docking of S-Mgm1 crystal structure into cryo-EM map of S-OPA1 coated tube at nucleotide-free state.
(A) Docking crystal structure into helical reconstructed cryo-EM map (transparent gray). G domain is colored in green, BSE domain in cyan, middle/GED stalk in blue, and paddle domain in yellow. The magenta colored models represent molecules in one helical rung of S-OPA1 assembly. And the building blocks of one helical rung, the dimers of S-OPA1, are shown in the surface representation with the color dark-red, red, gold, yellow and light-yellow, respectively. (B) Zoomed–in view of radical cross-section showing the fitness between structural model and the map. (C) Vertical cross section of the map that rotates 90° with respect to (B). Dashed black lines denote the positions of the cross sections in (D). (D) Cross sections of the tube showing the fitness between structural model and the map. Putative G dimer interface (G) is shown in panel 1. The stalk interaction interfaces-1,2 and 3 (I1, I2 and I3) are indicated in panel 2. And the paddle interaction interface P1 as well as interface-2 (I2) are indicated in panel 3. (E) Structural model of the left-handed S-OPA1 assembly on membrane at nucleotide-free state. The four interfaces (I1, I2, I3 and P1) for the stability of S-OPA1 assembly are indicated with red circles. The orientation of the helical rung is indicated with black lines.
Figure 3—figure supplement 1
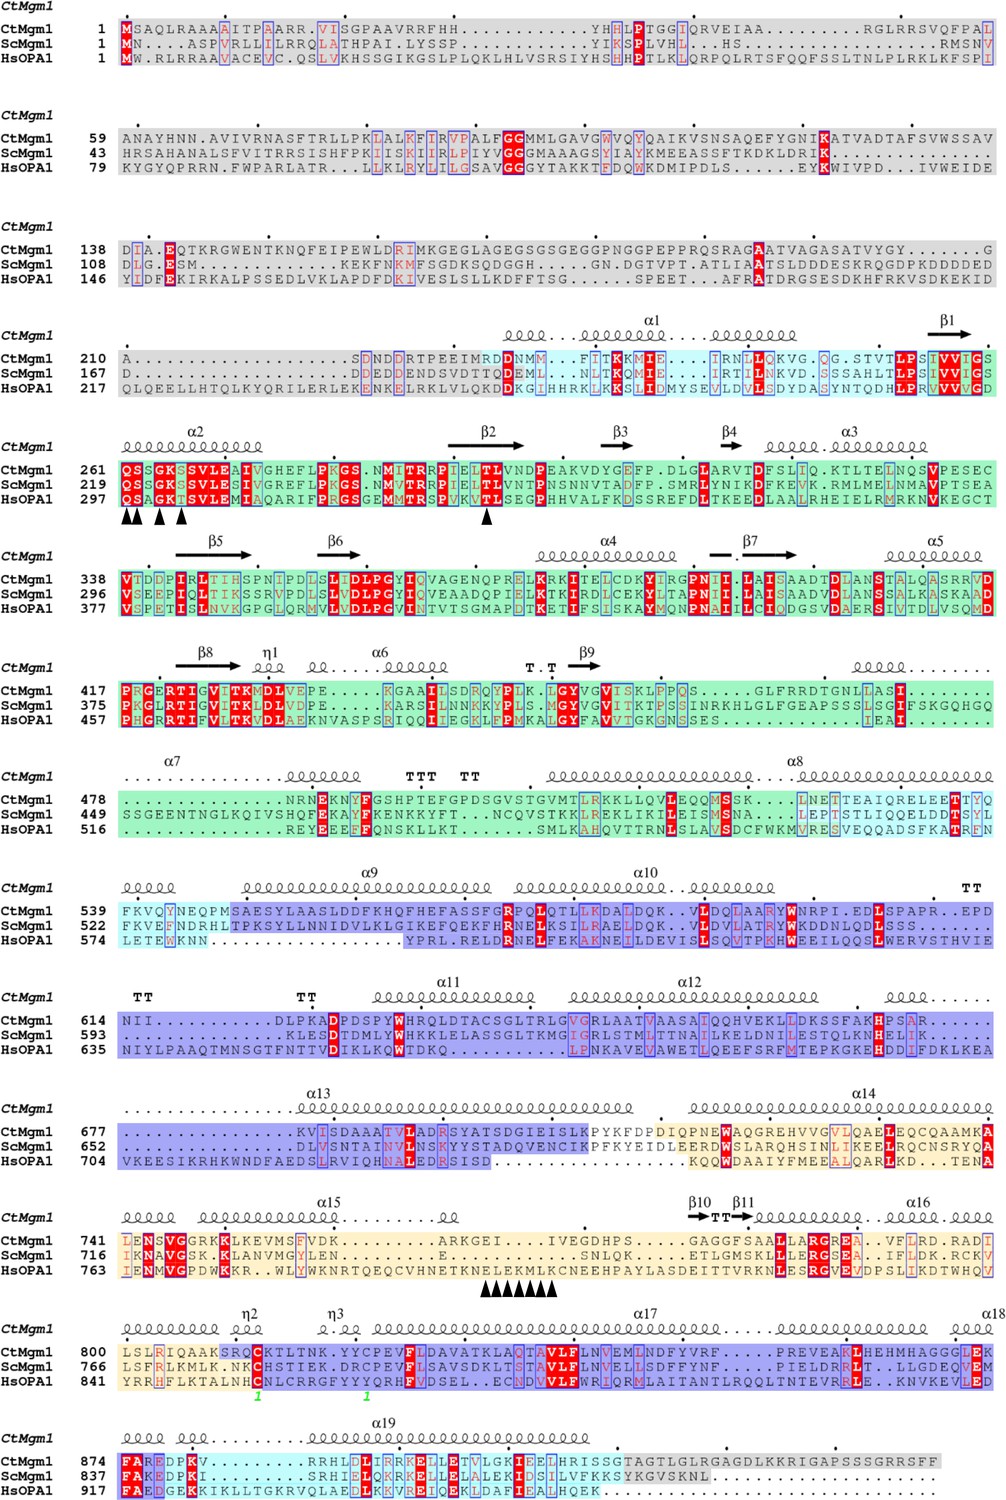
Sequence alignment of C. thermophilum Mgm1 (CtMgm1), S. cerevisiae Mgm1 (ScMgm1) and human OPA1 isoform 1 (HsOPA1).
The sequence of G domain is colored in green, BSE region in cyan, stalk region in violet, and the EMB domain/paddle domain in yellow. And the truncated regions for structural study are colored in gray. Secondary structure elements are indicated based on the crystal structure of CtMgm1 (PDB ID 6QL4). Helices are displayed as squiggles, β-strands are labeled as arrows, η refers to a 310-helix, TT refers to strict β-turns, TTT refers to strict α-turns. Residues labeled with black triangles are mutation sites preformed in this study. This sequence alignment was generated and annotated by ESPript 3.0 (Robert and Gouet, 2014).
Figure 3—figure supplement 2
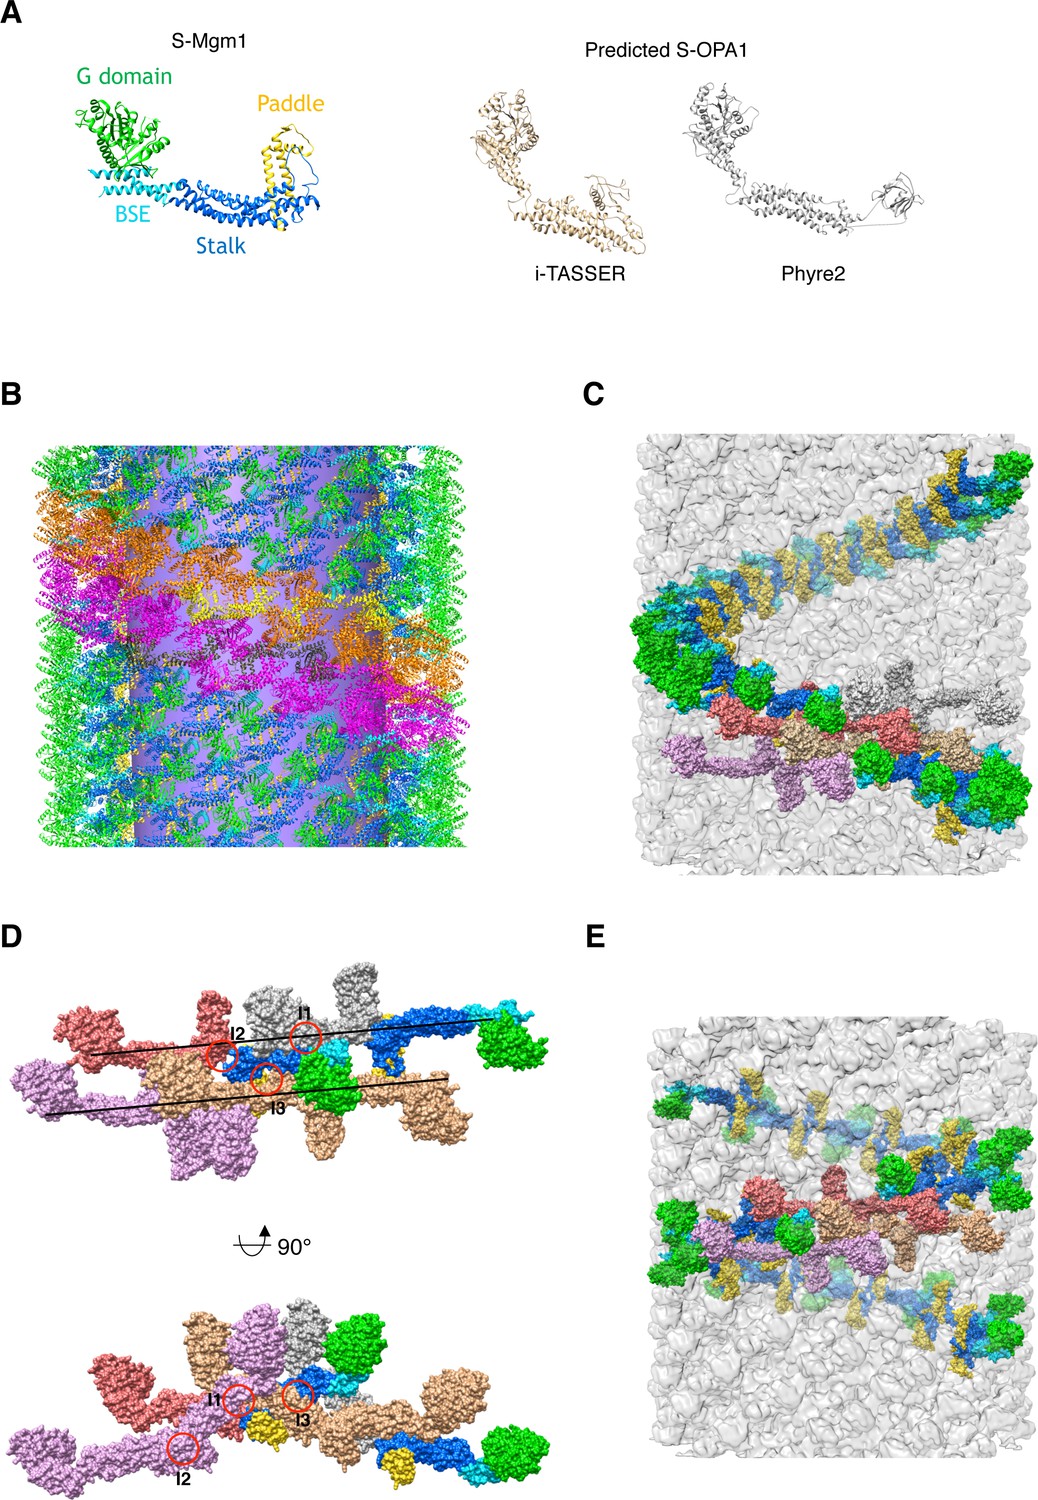
Structural model of S-OPA1 and its helical assembly.
(A) Crystal structure of C. thermophilum S-Mgm1 (Faelber et al., 2019) (PDB ID 6QL4) is colored with the same scheme as in Figure 3. Structures of S-OPA1 predicted by different softwares are shown on the right. (B) The structural model of S-OPA1 assembly on membrane at nucleotide-free state, showing the left-handed helical rung and the building blocks of S-OPA1 dimers (yellow and dark-gray). The tubular membrane is colored in violet. (C) Another view of the structural model of S-OPA1 assembly on membrane at nucleotide-free state, showing the left-handed helical rung. The building blocks of S-OPA1 dimers are shown in gray, pink, yellow and light-magenta. The cryo-EM map is shown in gray. (D) Alternative structural model of S-OPA1 assembly on membrane with a right-handed helical rung. The interfaces (I1, I2 and I3) are indicated with red circles. The orientation of the helical rung is indicated with black lines. (E) Corresponding right-handed assembly of S-OPA1 on a membrane tube. The building blocks of S-OPA1 dimers are shown in gray, pink, yellow and light-magenta. The cryo-EM map is shown in gray.
Figure 3—figure supplement 3
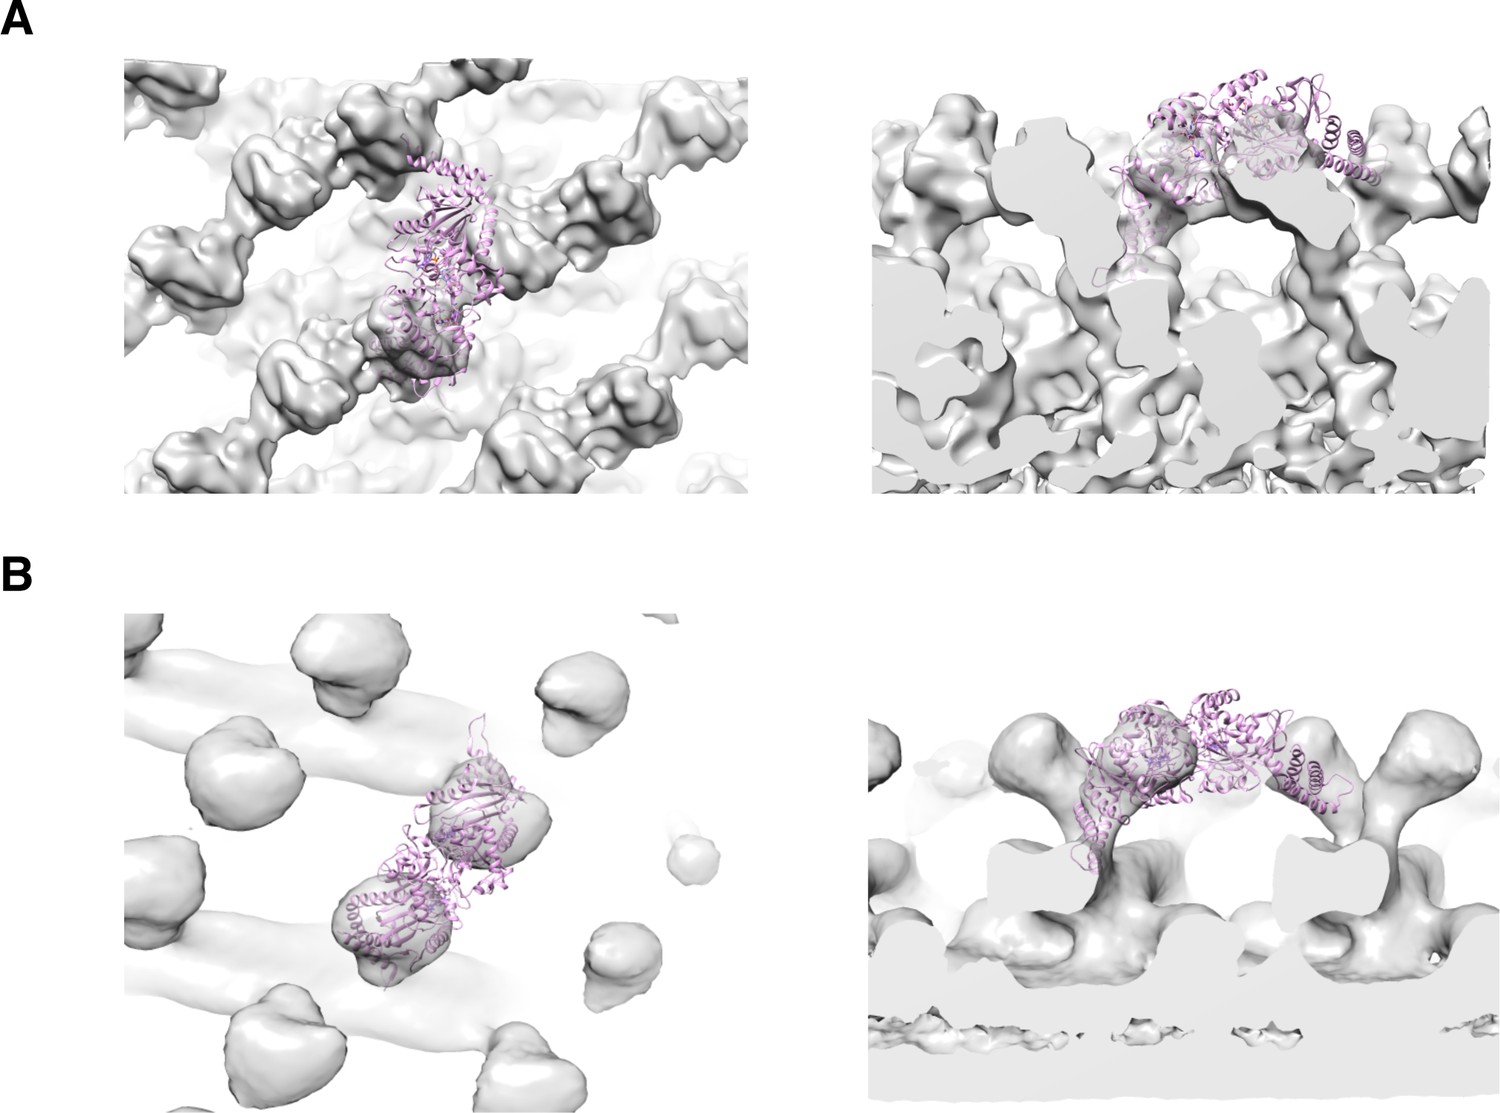
G domain dimerization interface analysis.
(A and B) Attempts of docking the crystal structure of the dimerized G domain (GGGDP.AlF4-, PDB ID 2X2E) into the head region of cryo-EM map at nucleotide free (A) and GTPγS binding states (B). Left, side view; right, vertical cross-section view.
Figure 3—figure supplement 4
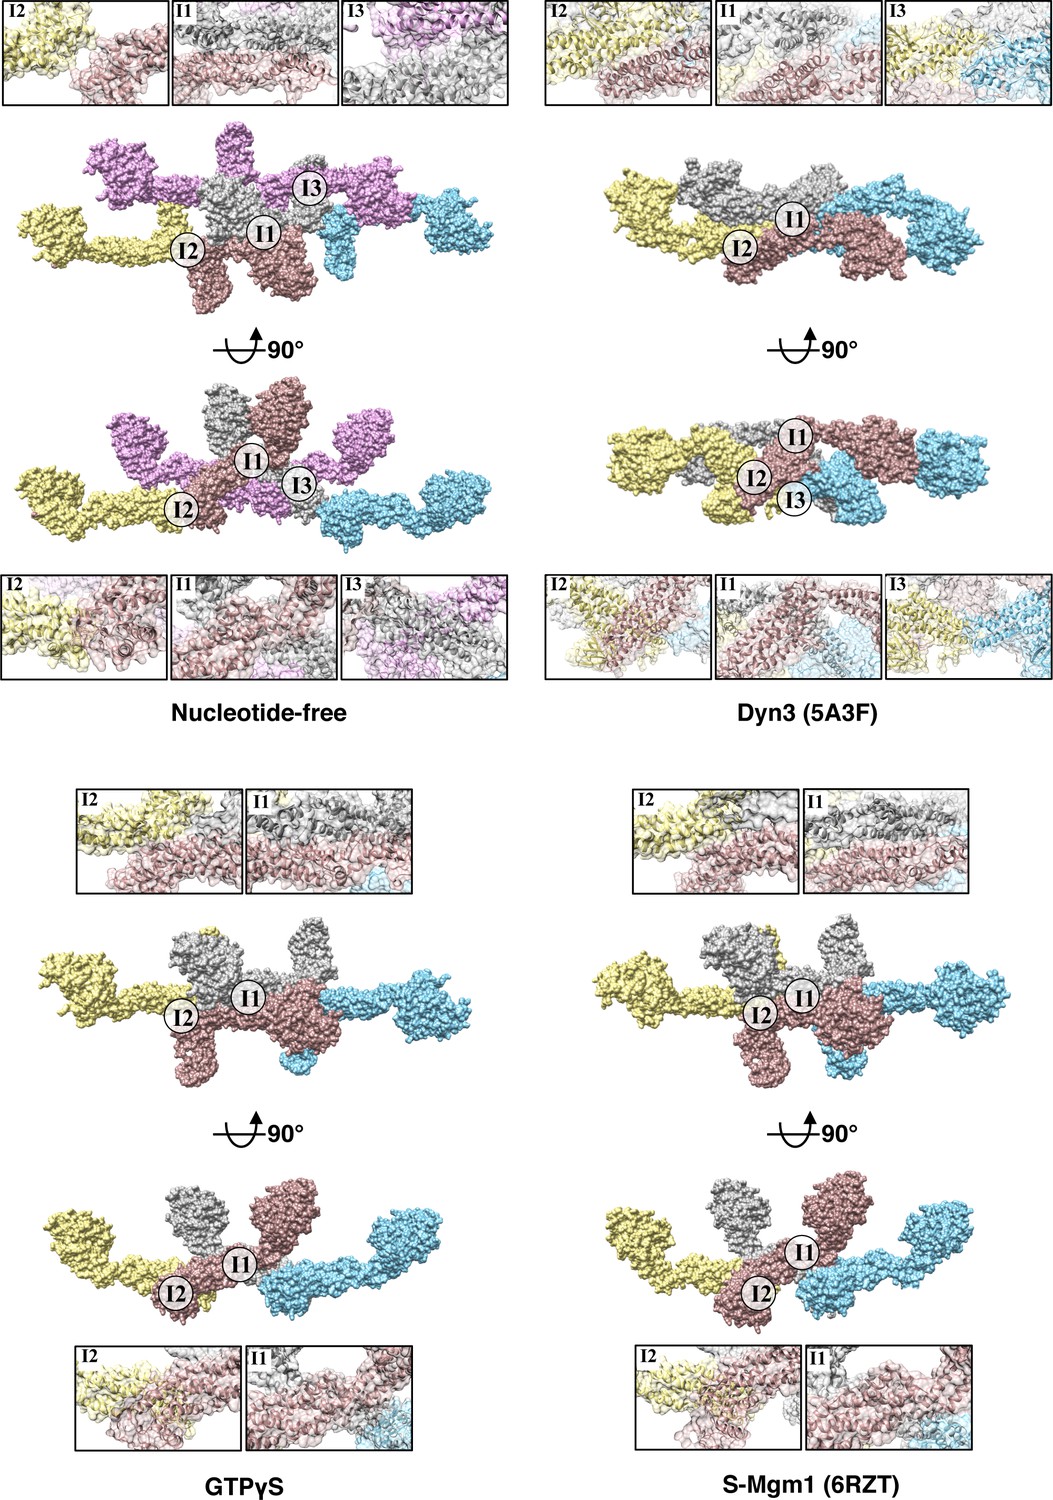
Interfaces comparison between different dynamin proteins.
Interfaces comparison among tetramers of S-OPA1 at nucleotide-free state, GTPγS binding state, Dyn3 at nucleotide-free state (PDB ID 5A3F) and S-Mgm1 at nucleotide-free state (PDB ID 6RZU). I1, interface-1. I2, interface-2. I3, interface-3.
Figure 3—figure supplement 5
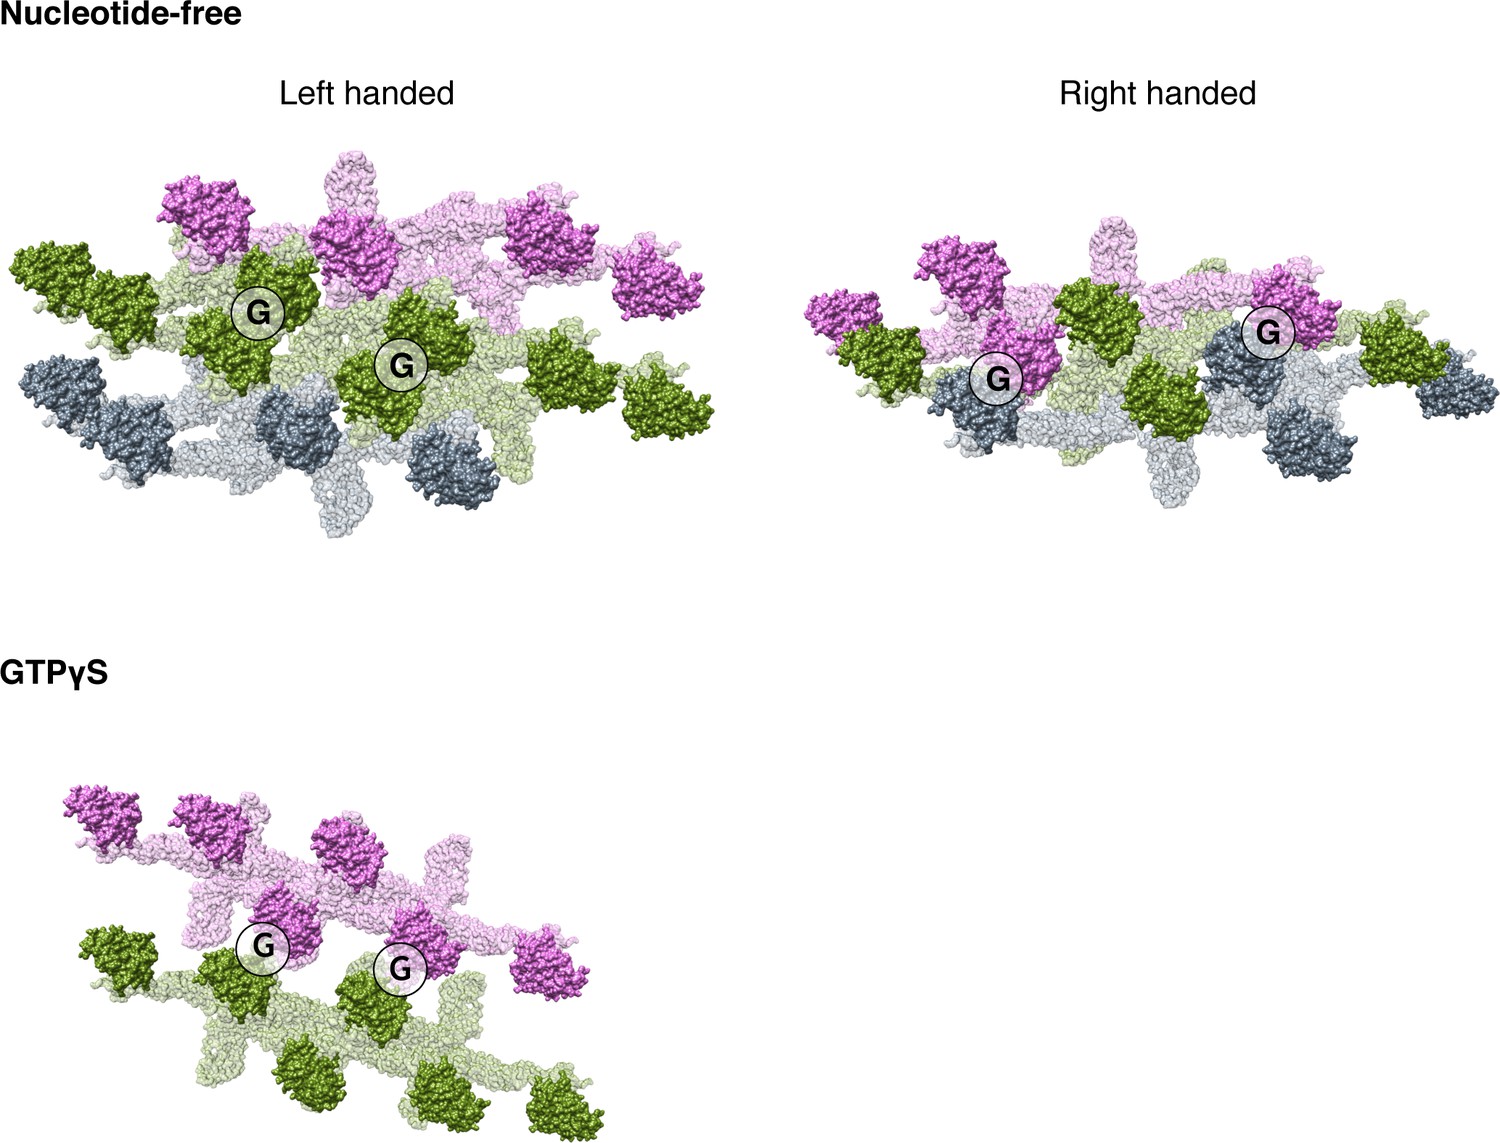
Potential G dimers in different nucleotide binding states.
Molecules in the same helical rung are colored in the same color. Potential G dimer interfaces are labeled with black circles. For nucleotide-free state, both left handed and right handed assembly model are depicted.
Figure 4

Mutants in EMB domain of S-OPA1 and their impact on tubulation activity.
(A) Sedimentation of wild type S-OPA1 and its EMB domain mutants with or without cardiolipin containing liposomes (n = 3). S, supernatant; P, pellet; *, p<0.01; **, p<0.001. (B) Basal and liposome binding induced GTPase activity of wild type S-OPA1 and its EMB domain mutants. L, liposome. The total free phosphate was measured at each time point and data presented come from 3 independent experiments. See also Source data 1. (C) Tubulation activity of wild type S-OPA1 and its EMB domain mutants examined by negative stain electron microscopy. Scale bar, 500 nm.
Figure 5 with 2 supplements
Tubulation activity of S-OPA1 is independent with its GTPase activity but depends on GTP binding.
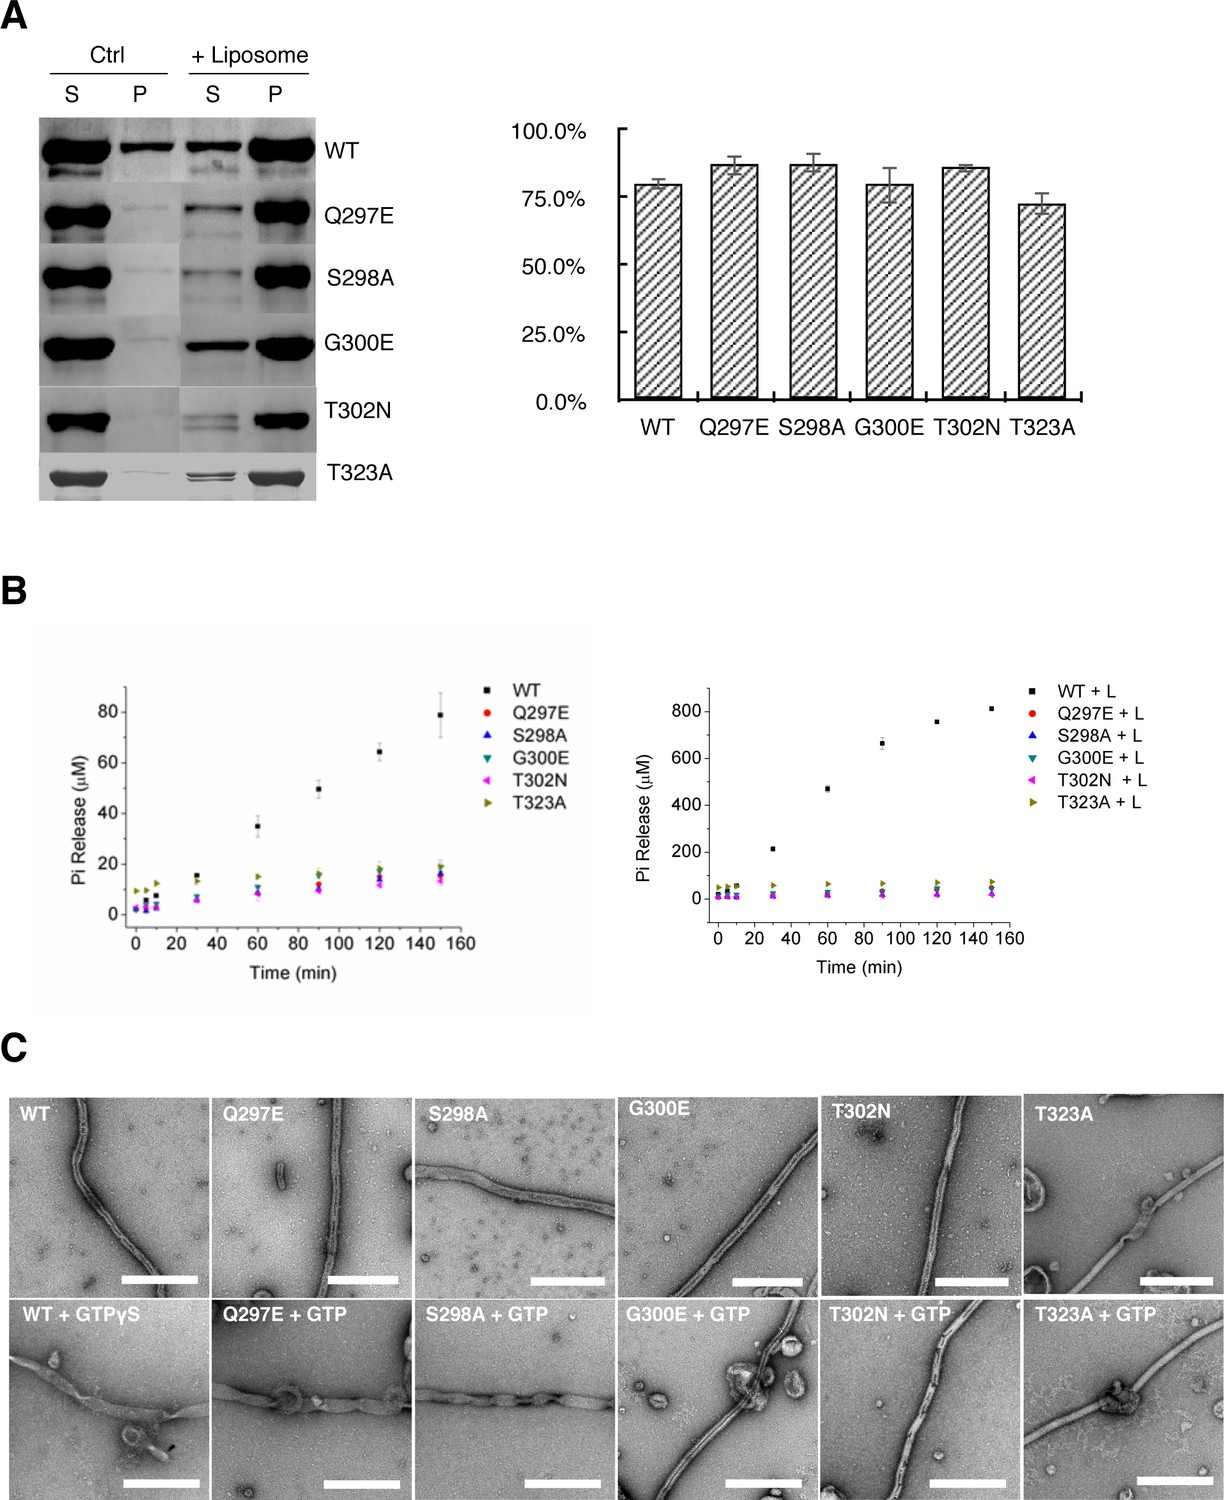
(A) Sedimentation of wild type S-OPA1 and its G domain mutants with or without cardiolipin containing liposomes (n = 3). S, supernatant; P, pellet; *, p<0.01; **, p<0.001. (B) Basel (left panel) and liposome binding induced (right panel) GTPase activity of wild-type S-OPA1 and its G domain mutants. L, liposome. The total free phosphate was measured at each time point and data presented result from 3 independent experiments. See also Source data 1. (C) Tubulation activity of wild type S-OPA1 and G domain mutants without (top) or with 1 mM GTP (bottom) examined by negative stain electron microscopy. Scale bar, 500 nm.
Figure 5—figure supplement 1
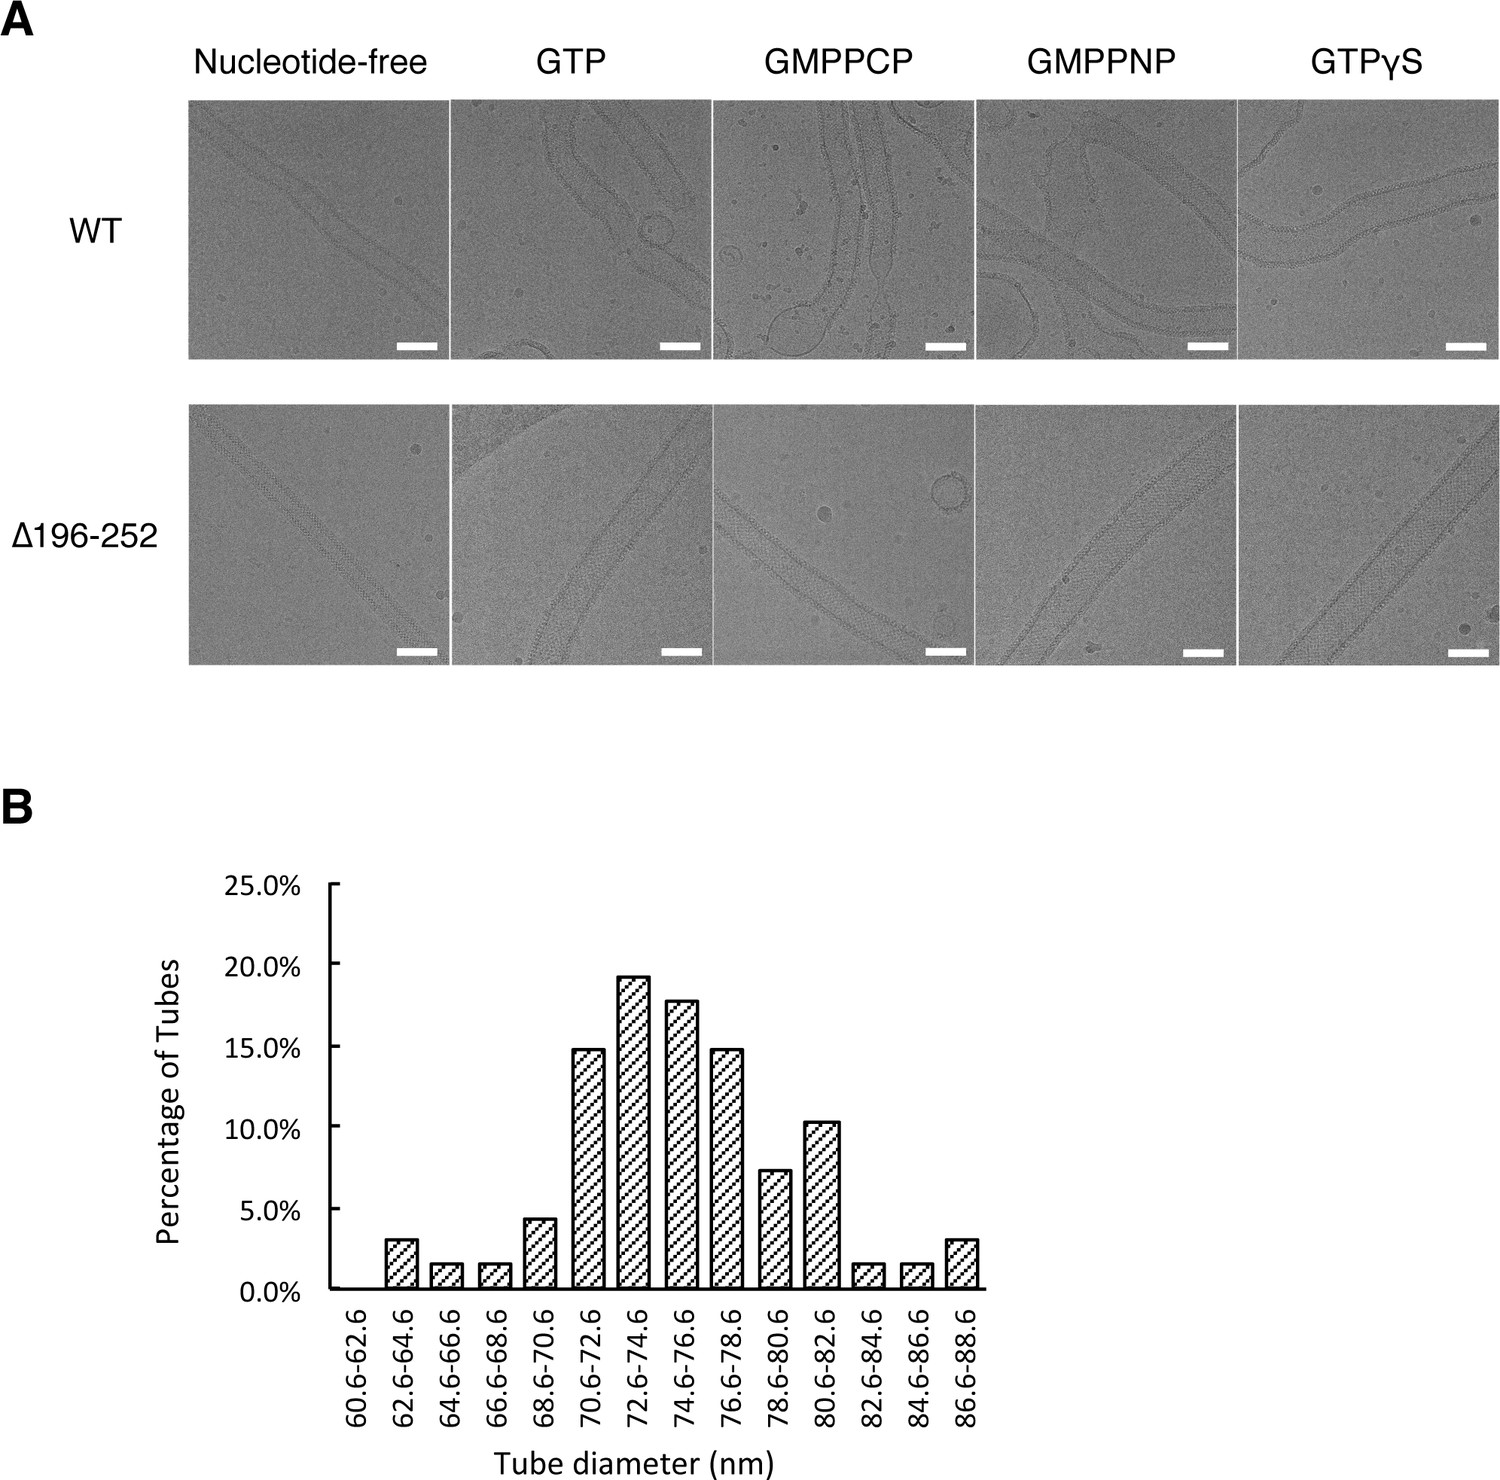
Cryo-EM analysis of S-OPA1 coated tubes after incubation with different nucleotides.
(A) Cryo-EM images of wild type S-OPA1 (WT) and truncated S-OPA1 (∆196–252) coated tubes at nucleotide-free state and after adding GTP, GMPPCP, GMPPNP or GTPγS. Scale bar, 100 nm. (B) Diameter distribution of the expanded S-OPA1 coated tubes after adding GTPγS.
Figure 5—figure supplement 2
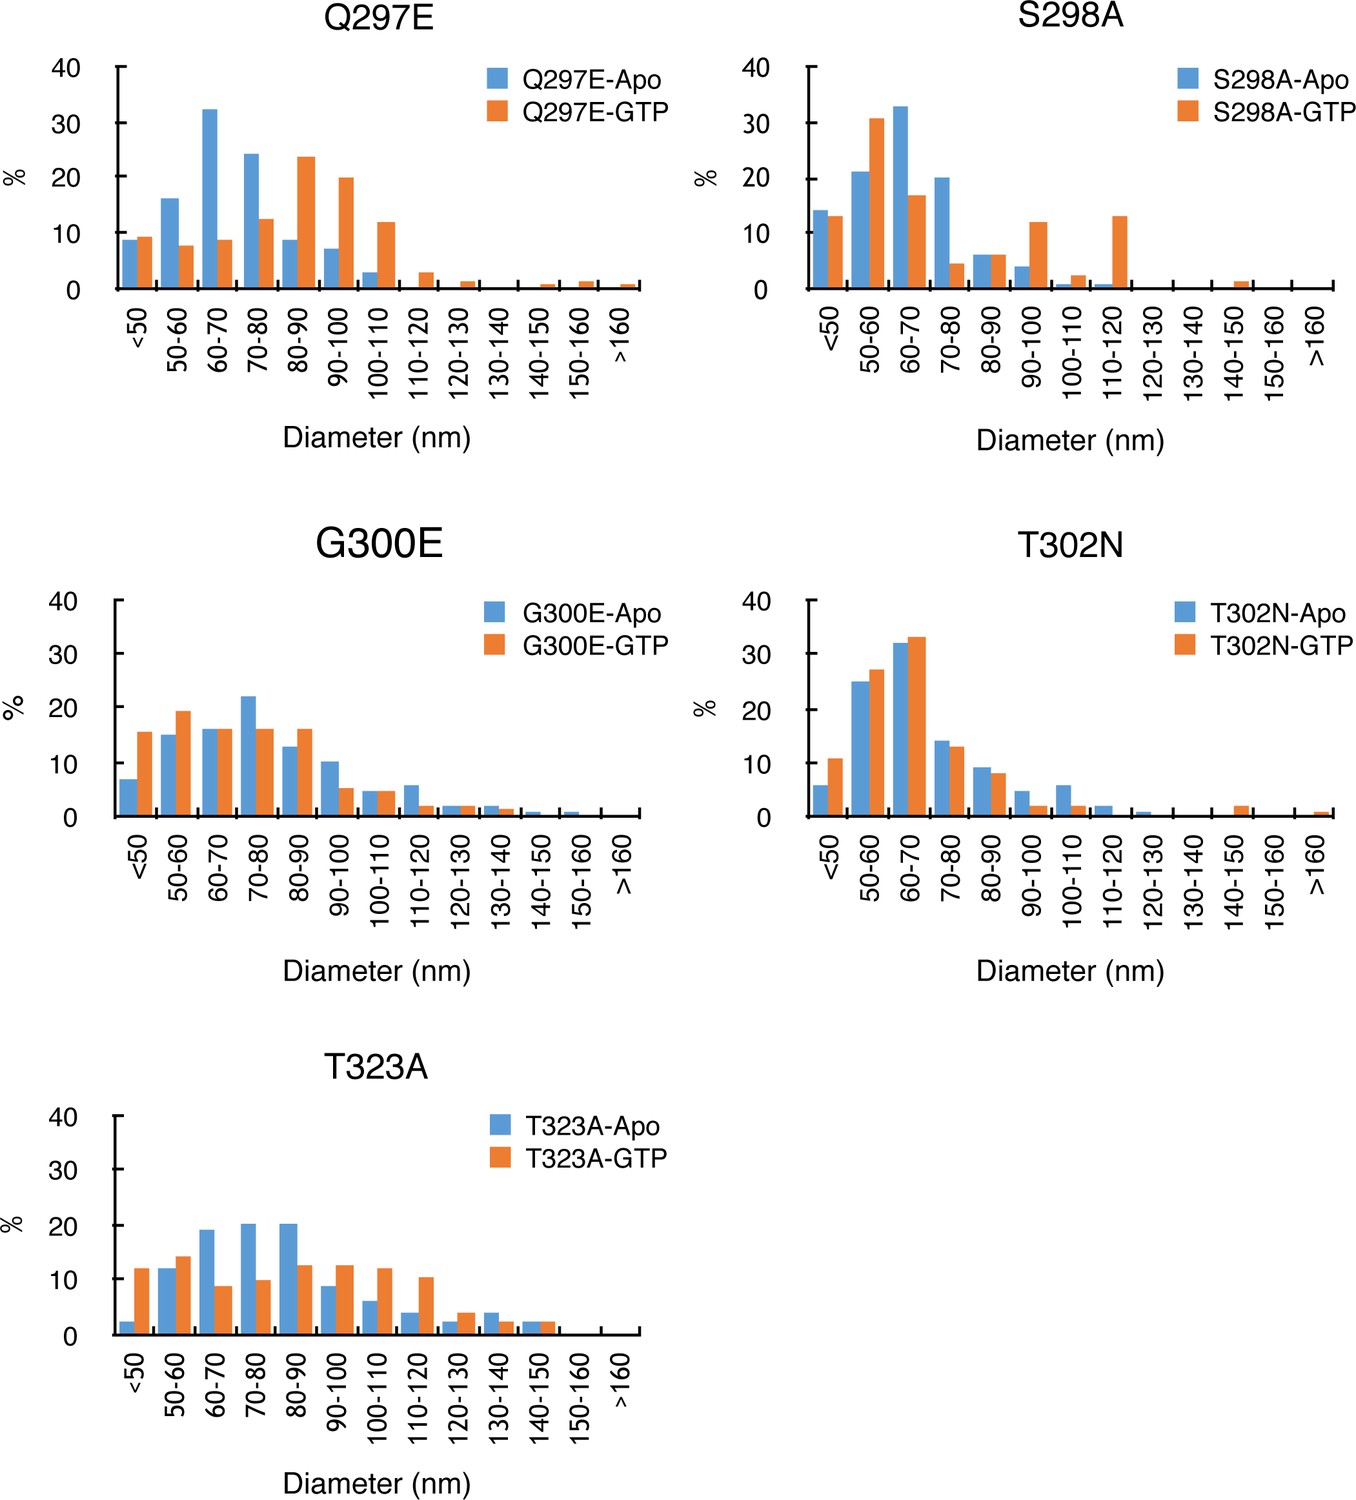
Diameter distributions of S-OPA1 G domain mutants coated tubes with GTP or without (Apo).
Tube diameter was manually measured and more than 60 micrographs were taken for each mutant. Number of tubes within a certain diameter range was counted and is shown as a percentage. The averaged diameters of Q297E tubes before and after adding GTP are 72 ± 13 nm and 87 ± 19 nm. For S298A tubes, the averaged diameters are 69 ± 15 nm and 77 ± 24 nm, respectively. For G300E, 82 ± 22 nm and 78 ± 23 nm, respectively. For T302N, 73 ± 18 nm and 71 ± 22 nm, respectively. For T323A, 84 ± 22 nm and 89 ± 24 nm, respectively.
Figure 6 with 1 supplement
Sub-tomogram averaging of S-OPA1 coated tube at GTPγS binding state.
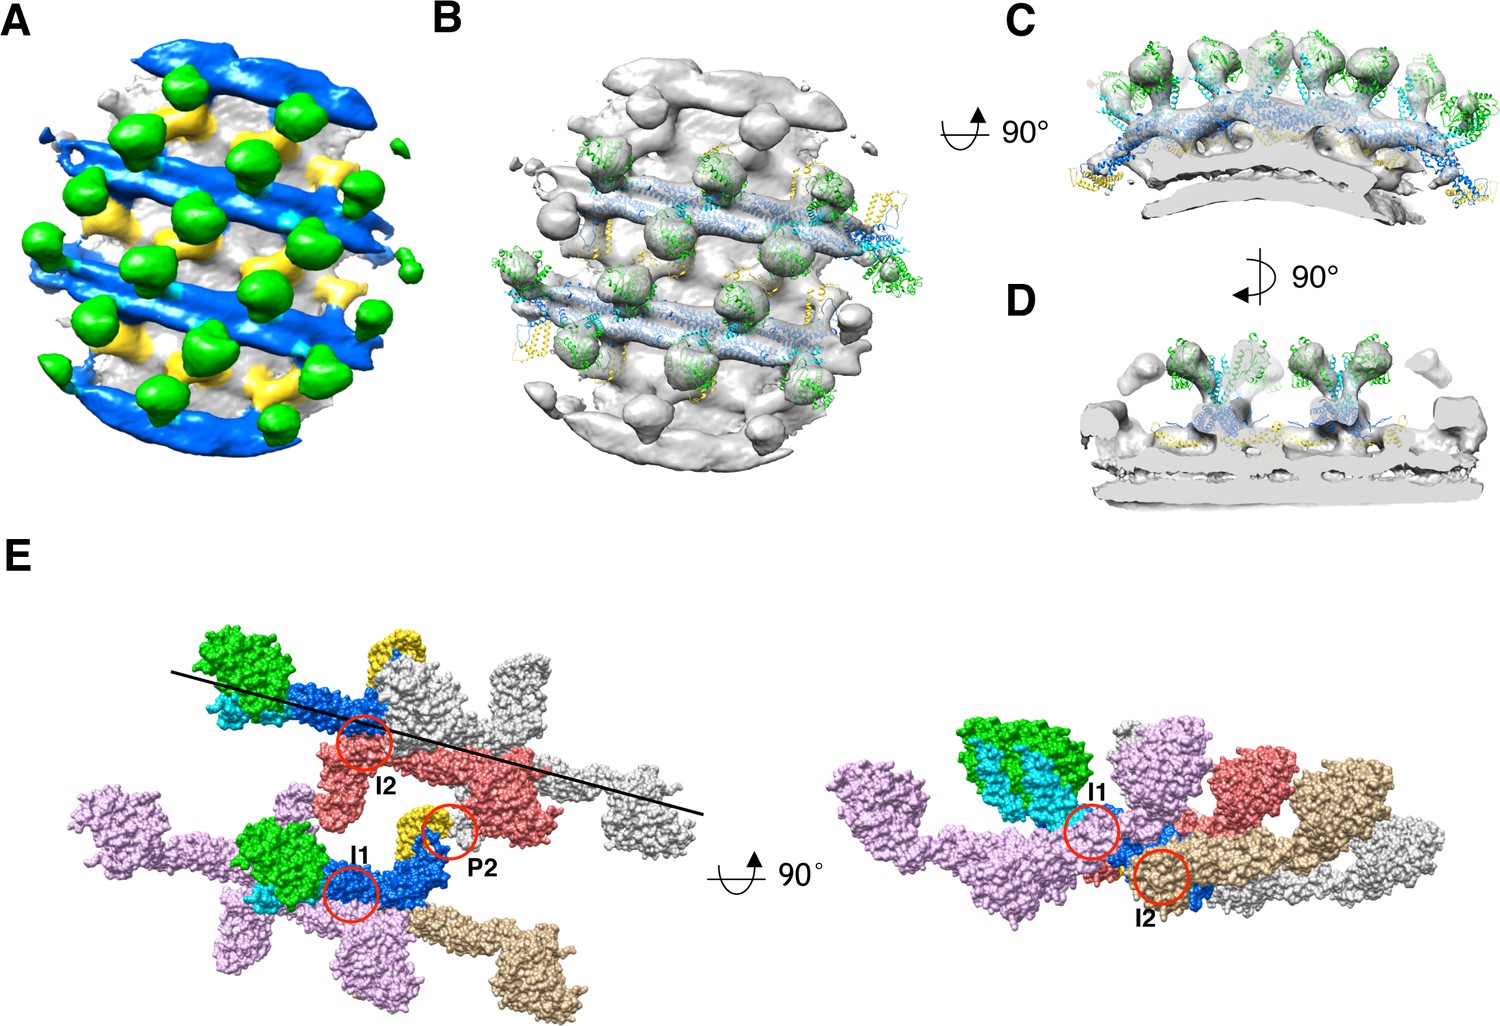
(A) Side view of cryo-EM map of S-OPA1 coated tube after adding GTPγS. The map is subdivided into three layers and colored with the same scheme in Figure 2. (B) Docking of S-Mgm1 crystal structure into the map. Domains are colored as the same scheme in Figure 3. (C) Cross section view of the map that is horizontally rotated 90° from (B). (D) Cross section view of the map that is vertically rotated 90° from (C). (E) Structural model of S-OPA1 assembly on membrane at GTPγS binding state. The three interfaces (I1, I2 and P2) for the stability of S-OPA1 assembly are indicated with red circles. The orientation of the helical rung is indicated with the black line.
Figure 6—figure supplement 1
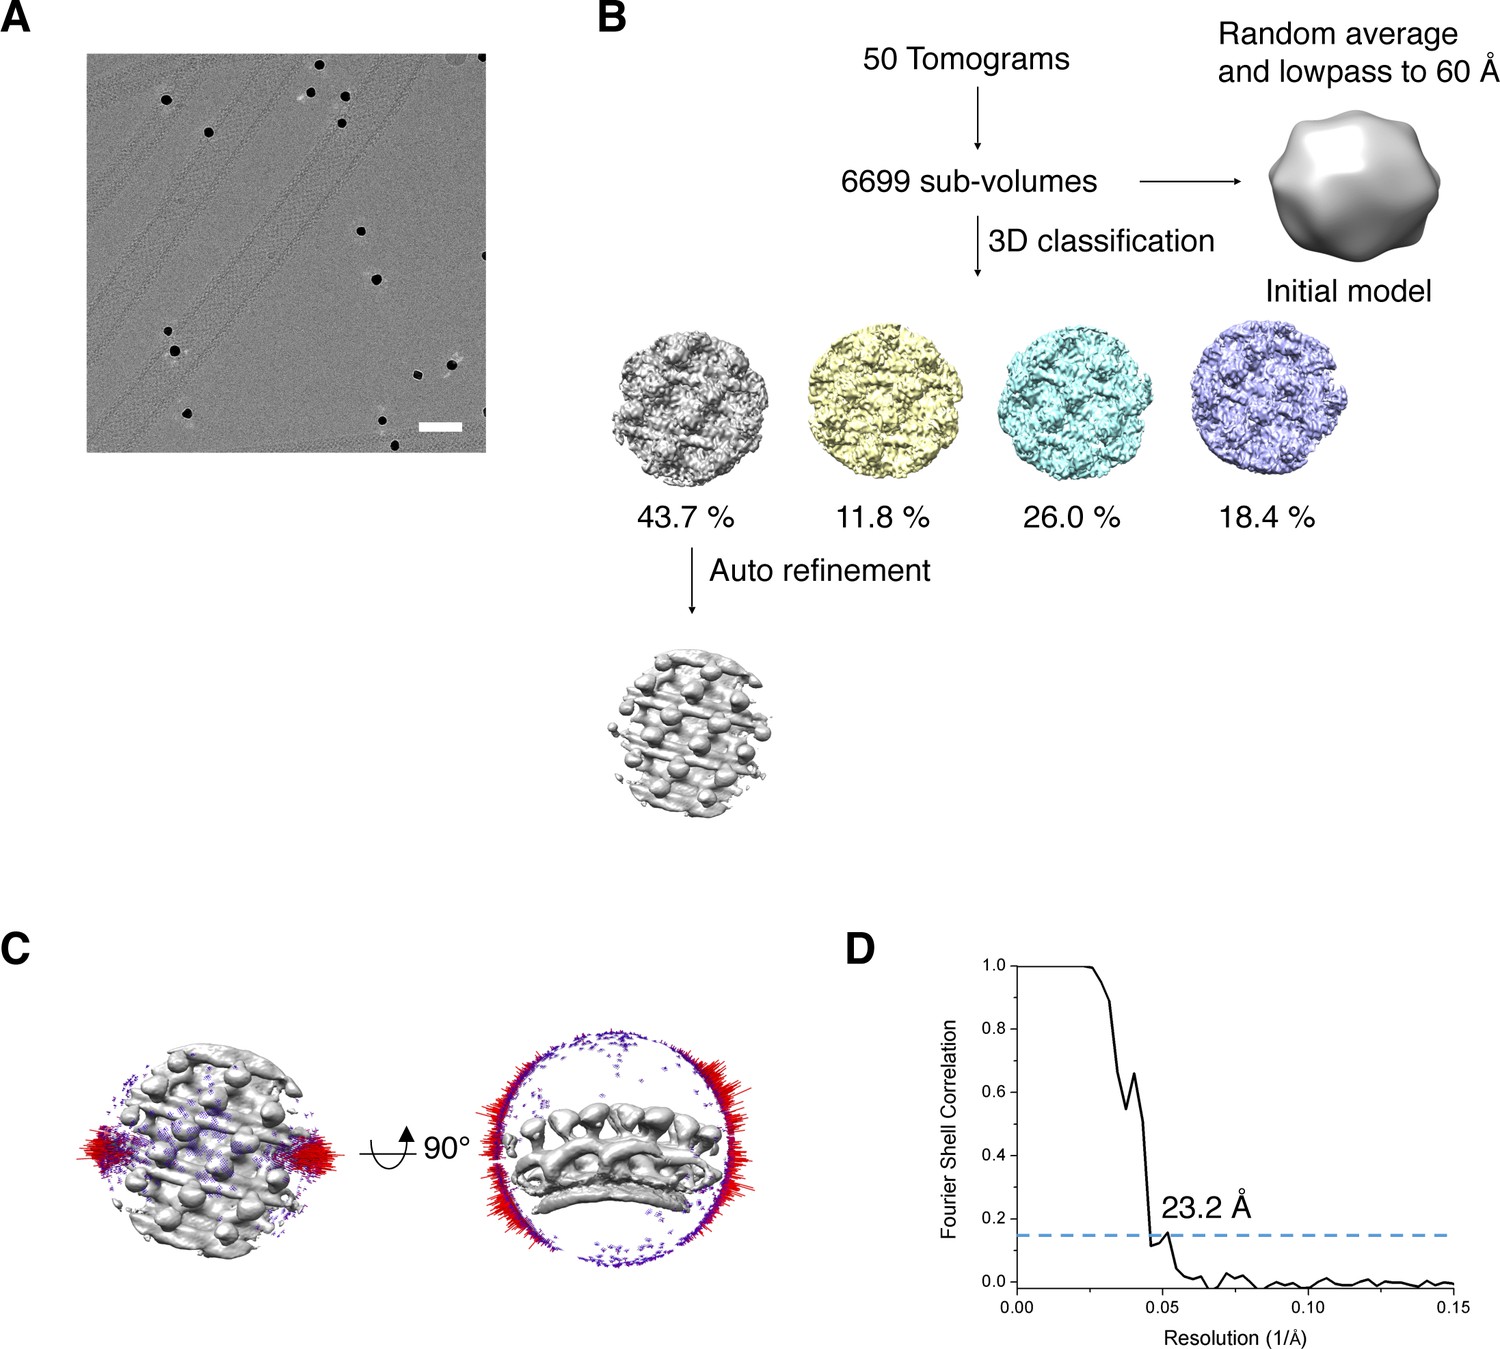
Cryo-electron tomographic image processing of S-OPA1 coated tubes after adding GTPγS.
(A) The 0° tilt cryo-EM image of the expanded tubes after adding GTPγS. (B) Flow chart of sub-tomogram averaging procedure. (C) Angular distribution of sub-tomograms used in the final averaging. (D) The gold standard FSC (Fourier Shell Correlation) curve and the estimated resolution at the threshold of 0.143.
Figure 7 with 1 supplement
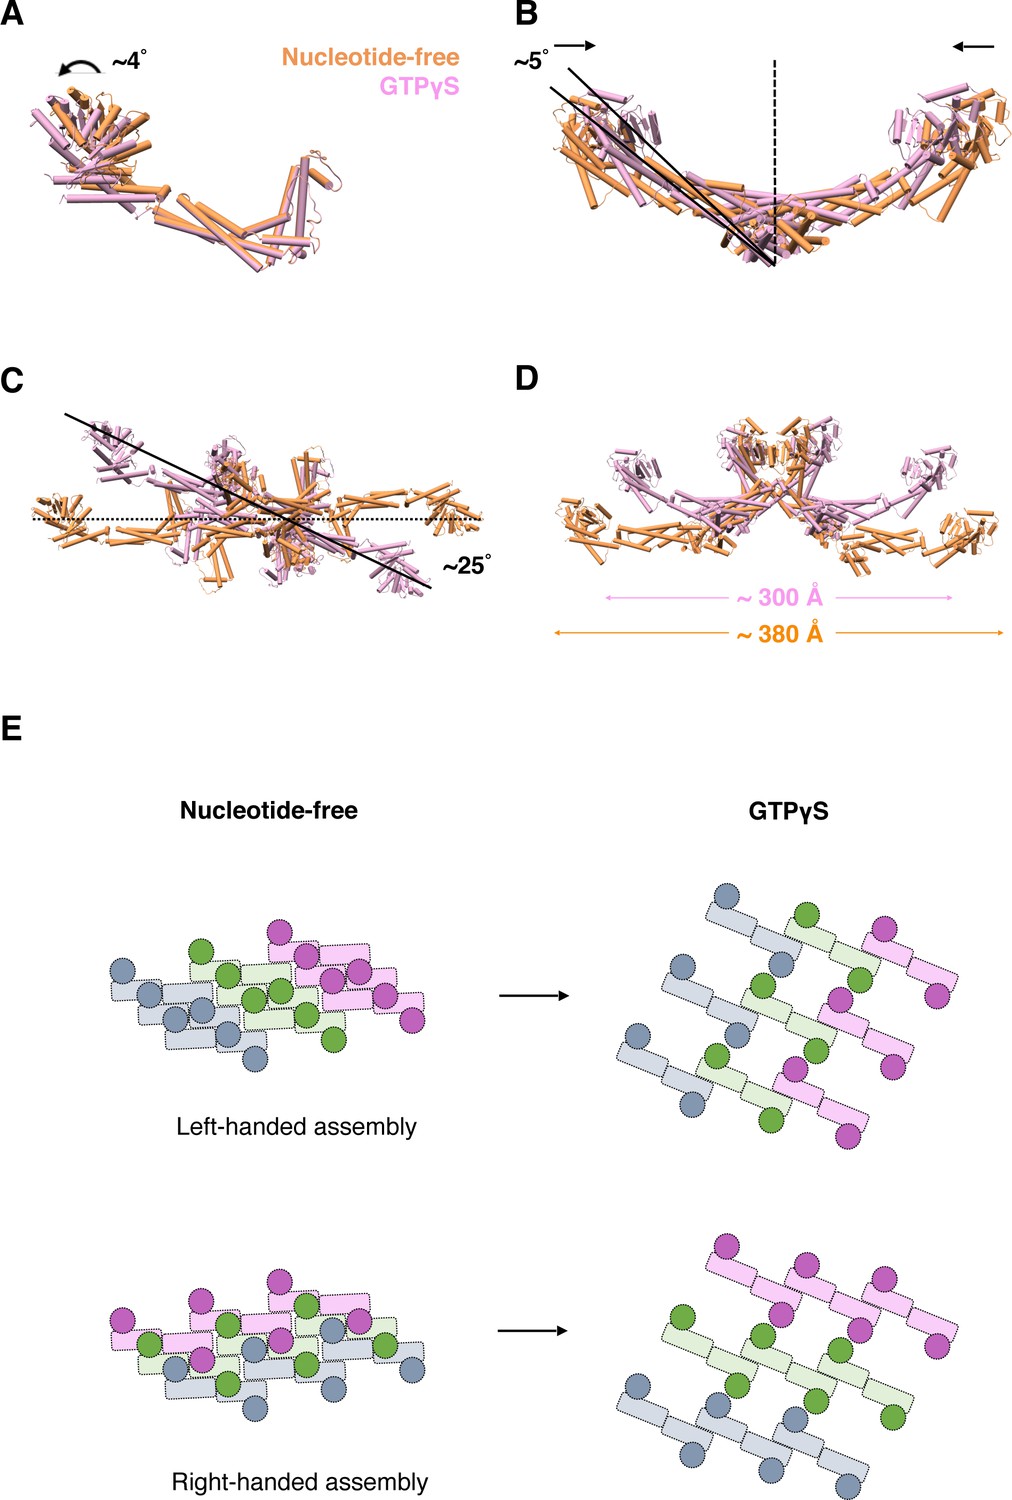
Conformational change of S-OPA1 and its assembly after GTPγS binding.
(A) Conformational change of S-OPA1 monomer after GTPγS binding. Black arrows indicate the direction of the conformational change. (B) Conformational change of S-OPA1 dimer after GTPγS binding. (C) Conformational change of S-OPA1 tetramer after GTPγS binding. Angle change of the helical rung orientation is indicated. (D) Change of distance between two distal G domains within a single S-OPA1 tetramer. (E) Schemes of the helical assemblies of S-OPA1 on membrane at nucleotide-free and GTPγS binding states. The G domain is shown as a filled circle and the stalk region is shown as a filled rectangle. For nucleotide-free state, the S-OPA1 molecules locating in the same rung are colored same.
Figure 7—figure supplement 1
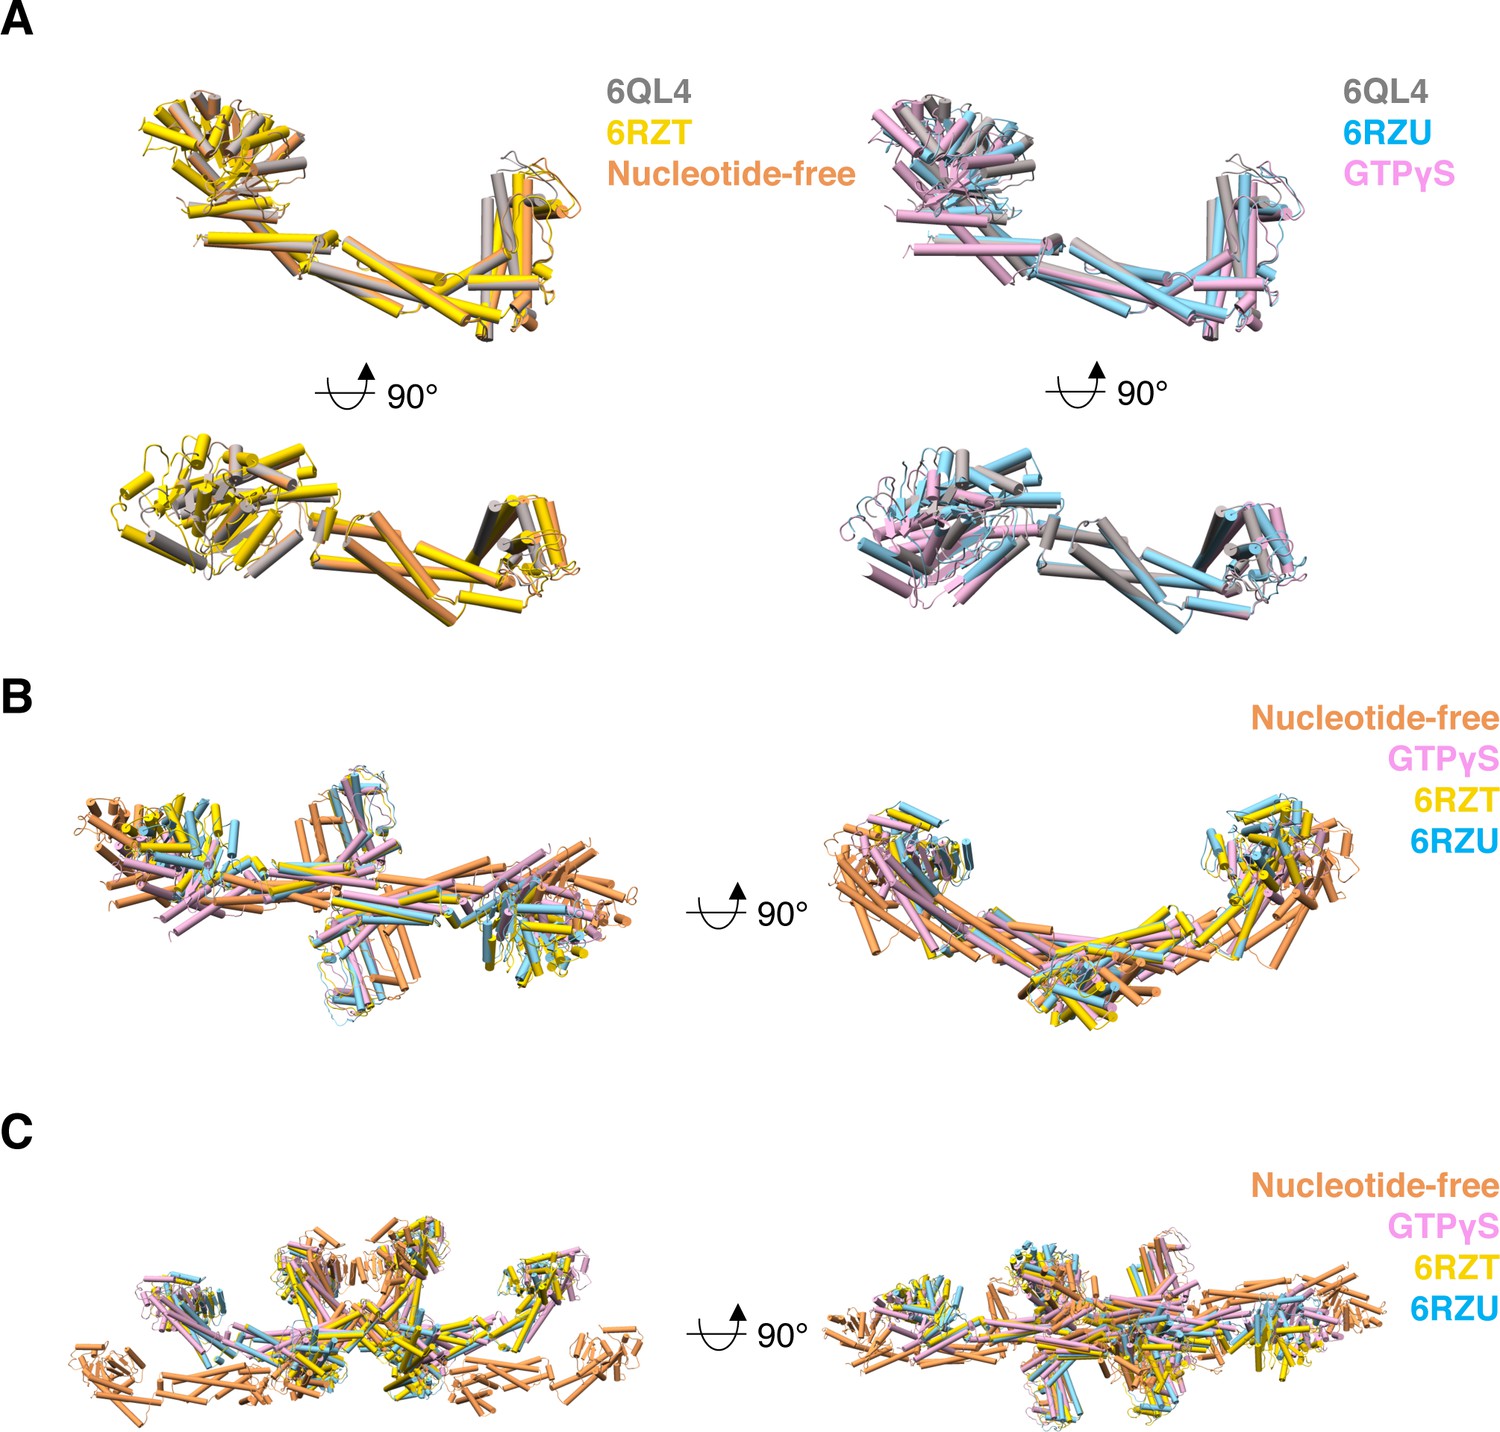
Comparison between S-OPA1 and C. thermophilum S-Mgm1 models in two different nucleotide binding states.
(A) Structural comparison between S-OPA1 and S-Mgm1 monomers. The crystal structure of S-Mgm1 (PDB ID 6QL4) is colored gray. The structural models of S-OPA1 at nucleotide-free and GTPγS binding states are colored orange and pink, respectively. The structural models of S-Mgm1 at nucleotide-free (PDB ID 6RZT) and GTPγS binding states (PDB ID 6RZU) are colored yellow and cyan, respectively. (B) Structural comparison between S-OPA1 and S-Mgm1 dimers with the same color scheme in (A). (C) Structural comparison between S-OPA1 and S-Mgm1 tetramers with the same color scheme in (A).
Videos
Video 1
Structure of S-OPA1 coated tube at nucleotide-free state.
Tables
Key resources table
| Reagent type (species) or resource | Designation | Source or reference | Identifiers | Additional information |
|---|---|---|---|---|
| Chemical compound, drug | Palmitoyl-2-oleoyl-sn-glycero-3-phosphocholine (POPC) | Avanti Polar Lipids | Cat#: 850375 | |
| Chemical compound, drug | 1-palmitoyl-2-oleoyl-sn-glycero-3-phosphoethanolamine (POPE) | Avanti Polar Lipids | Cat#: 850725 | |
| Chemical compound, drug | L-α-lysophosphatidylinositol (PI) | Avanti Polar Lipids | Cat#: 840042 | |
| Chemical compound, drug | 1',3'-bis[1,2-dioleoyl-sn-glycero-3-phospho]-sn-glycerol (cardiolipin) | Avanti Polar Lipids | Cat#: 840012 | |
| Chemical compound, drug | Guanosine 5'-triphosphate sodium salt hydrate (GTP) | Sigma-Aldrich | Cat#: G8877 | |
| Chemical compound, drug | Guanosine 5'-diphosphate sodium salt (GDP) | Sigma-Aldrich | Cat#: G7127 | |
| Chemical compound, drug | Guanosine 5'-[γ-thio] triphosphate tetralithium salt (GTPgammaS) | Sigma-Aldrich | Cat#: G8634 | |
| Chemical compound, drug | Guanosine 5'-[β,γ-imido] triphosphate trisodium salt hydrate (GMPPNP) | Sigma-Aldrich | Cat#: G0635 | |
| Chemical compound, drug | β,γ-Methyleneguanosine 5'- triphosphate sodium salt (GMPPCP) | Sigma-Aldrich | Cat#: M3509 | |
| Chemical compound, drug | Bis (sulfosuccinimidyl) suberate (BS3) | Thermo Fisher Scientific | Cat#: 21580 | |
| Software, algorithm | IMOD | IMOD(https://bio3d.colorado.edu/imod/) | RRID:WB-STRAIN:WBStrain00027352 | Version 4.9 |
| Software, algorithm | RELION | RELION(https://www3.mrc-lmb.cam.ac.uk/relion/index.php?title=Main_Page ) | RRID:SCR_016274 | Version 1.4 |
| Software, algorithm | SPIDER | SPIDER(https://spider.wadsworth.org/spider_doc/spider/docs/spider.html) | Version 24.08 | |
| Software, algorithm | EMAN | EMAN(https://blake. bcm.edu/emanwiki/EMAN2) | RRID:SCR_016867 | Version 2.3.1 |
| Software, algorithm | SerialEM | Serial(http://bio3d.colorado.edu/SerialEM/) | RRID:SCR_017293 | Version 3.7 |
| Software, algorithm | Chimera | Chimera(http://plato.cgl.ucsf.edu/chimera/) | RRID:SCR_004097 | Version 1.14 |
| Software, algorithm | IHRSR | IHRSR(https://www.ncbi.nlm.nih.gov/pmc/articles/PMC3245864/) | Edward H. Egelman, University of Virginia,Virginia, USA | |
| Software, algorithm | AuTom | AuTom(https://www. sciencedirect.com/science/article/pii/S1047847717301284) | Renmin Han, King Abdullah University of Science and Technology, Thuwal, Saudi Arabia | |
| Software, algorithm | GCTF | GCTF(https://www.mrc-lmb.cam.ac.uk/kzhang/Gctf/) | RRID:SCR_016500 | Version 1.06 |
| Software, algorithm | MotionCor2 | MotionCor2(https://emcore.ucsf.edu/cryoem-software) | RRID:SCR_016499 | |
| Software, algorithm | CTFFIND | CTFFIND( http://grigoriefflab.janelia.org/ctffind4) | RRID:SCR_016732 |
Additional files
-
Source data 1
Raw data of enzymatic assays of S-OPA1 and its mutants as well as detailed data processing.
- https://cdn.elifesciences.org/articles/50294/elife-50294-data1-v2.xlsx
-
Supplementary file 1
Enzymatic Km and Kcat of S-OPA1 and its mutants.
The raw data come from three independent experiments.
- https://cdn.elifesciences.org/articles/50294/elife-50294-supp1-v2.docx
-
Supplementary file 2
Disease related mutants of S-OPA1.
Data was obtained from UniProt (https://www.uniprot.org).
- https://cdn.elifesciences.org/articles/50294/elife-50294-supp2-v2.docx
-
Transparent reporting form
- https://cdn.elifesciences.org/articles/50294/elife-50294-transrepform-v2.docx
Download links
A two-part list of links to download the article, or parts of the article, in various formats.
Downloads (link to download the article as PDF)
Open citations (links to open the citations from this article in various online reference manager services)
Cite this article (links to download the citations from this article in formats compatible with various reference manager tools)
Cryo-EM structures of S-OPA1 reveal its interactions with membrane and changes upon nucleotide binding
eLife 9:e50294.
https://doi.org/10.7554/eLife.50294


