Single cell transcriptome atlas of the Drosophila larval brain
- University of Fribourg, Switzerland
- University of Bern, Switzerland
Figures
Figure 1 with 2 supplements
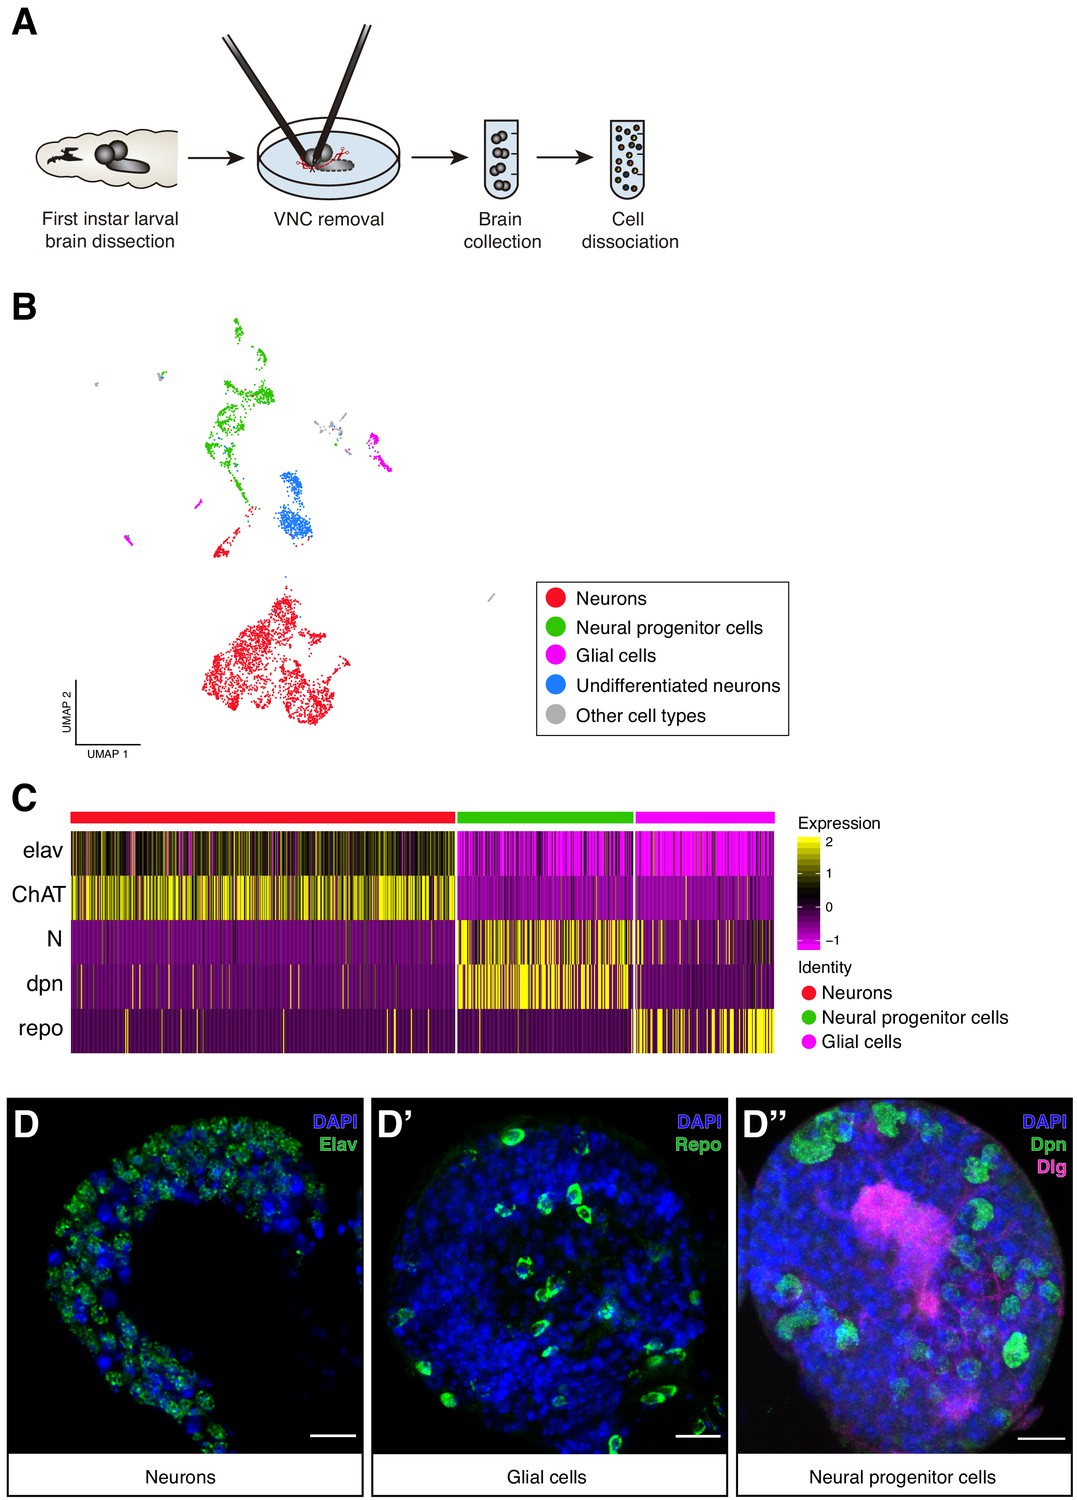
Cellular composition of the Larval brain by Single-Cell RNA-Seq.
(A) Experimental procedure. Drosophila late first instar larval brains/ventral nerve cords (VNC) were dissected and the VNCs were removed. Brains were collected and dissociated into a suspension of single cells. (B) Cell atlas of the larval brain reveals five main cell-types: neurons, NPCs, glial cells, UNs and other cell-types, represented in a Seurat UMAP plot. Groups are color coded. (C) Cell-types are recognized based on the expression of previously characterized marker-genes. A simplified heatmap illustrates this process: a subgroup of cholinergic neurons expresses the pan-neuronal marker elav and ChAT, a protein that catalyzes the biosynthesis of the neurotransmitter acetylcholine; NPCs are recognized by the expression of Notch and dpn and glial cells by repo expression. (D–D’’) Validation of the markers used to identify the different cell-types within the larval brain by immunostainings. The images display one lobe of the larval brain. Nuclei were labeled with DAPI and cellular borders with Dlg (disc large). Scale bar: 10 µm.
-
Figure 1—source data 1
Clusters properties.
Tables containing the top 10 differentially expressed genes across clusters, number of cells per cluster and the main literature in which the annotation processes were based on.
- https://cdn.elifesciences.org/articles/50354/elife-50354-fig1-data1-v2.xlsx
Figure 1—figure supplement 1
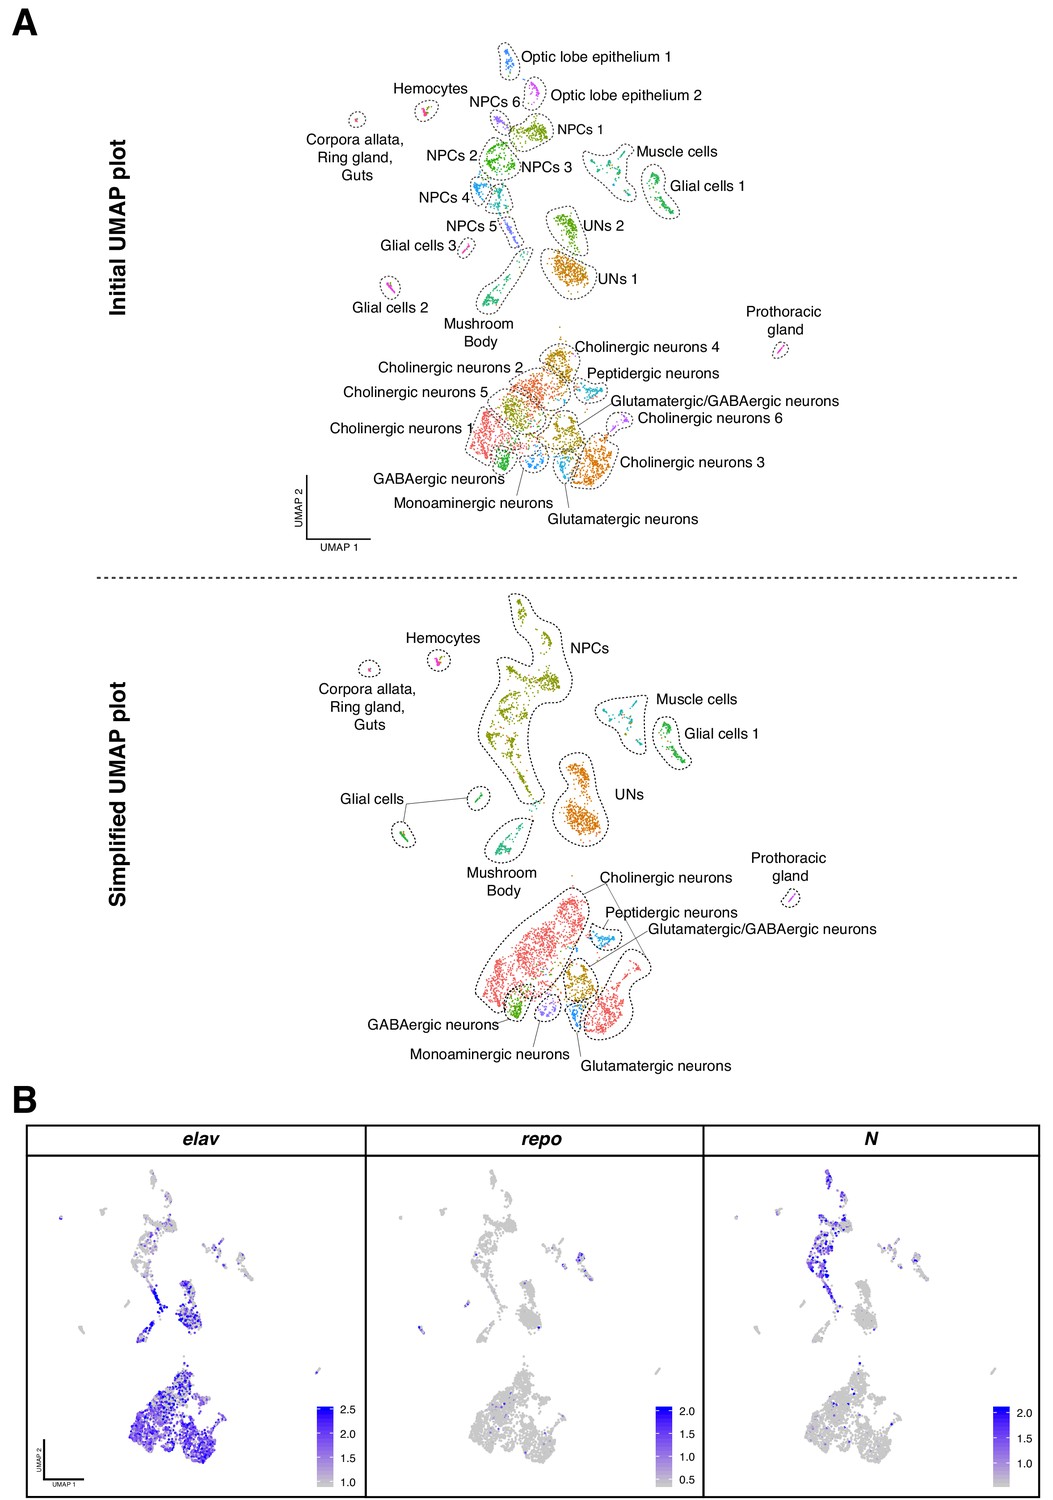
Cell-type catalogue of the Larval brain.
(A) Dimensional reduction, UMAP plot, of the total of cells considered for the analysis. Initially, 29 clusters were manually annotated (upper panel). Due to the similar expression profiles between different cell groups, clusters were combined to generate a simplified UMAP plot with 15 clusters of cells (lower panel). (B) The main cell-types identified are physically separated in the UMAP plot representation. Marker genes are used to confer cell identities: Elav for neurons, Notch for NPCs and repo for glial cells. Gene expression levels are color coded. NPCs: neural progenitor cells, UNs: undifferentiated neurons.
Figure 1—figure supplement 2
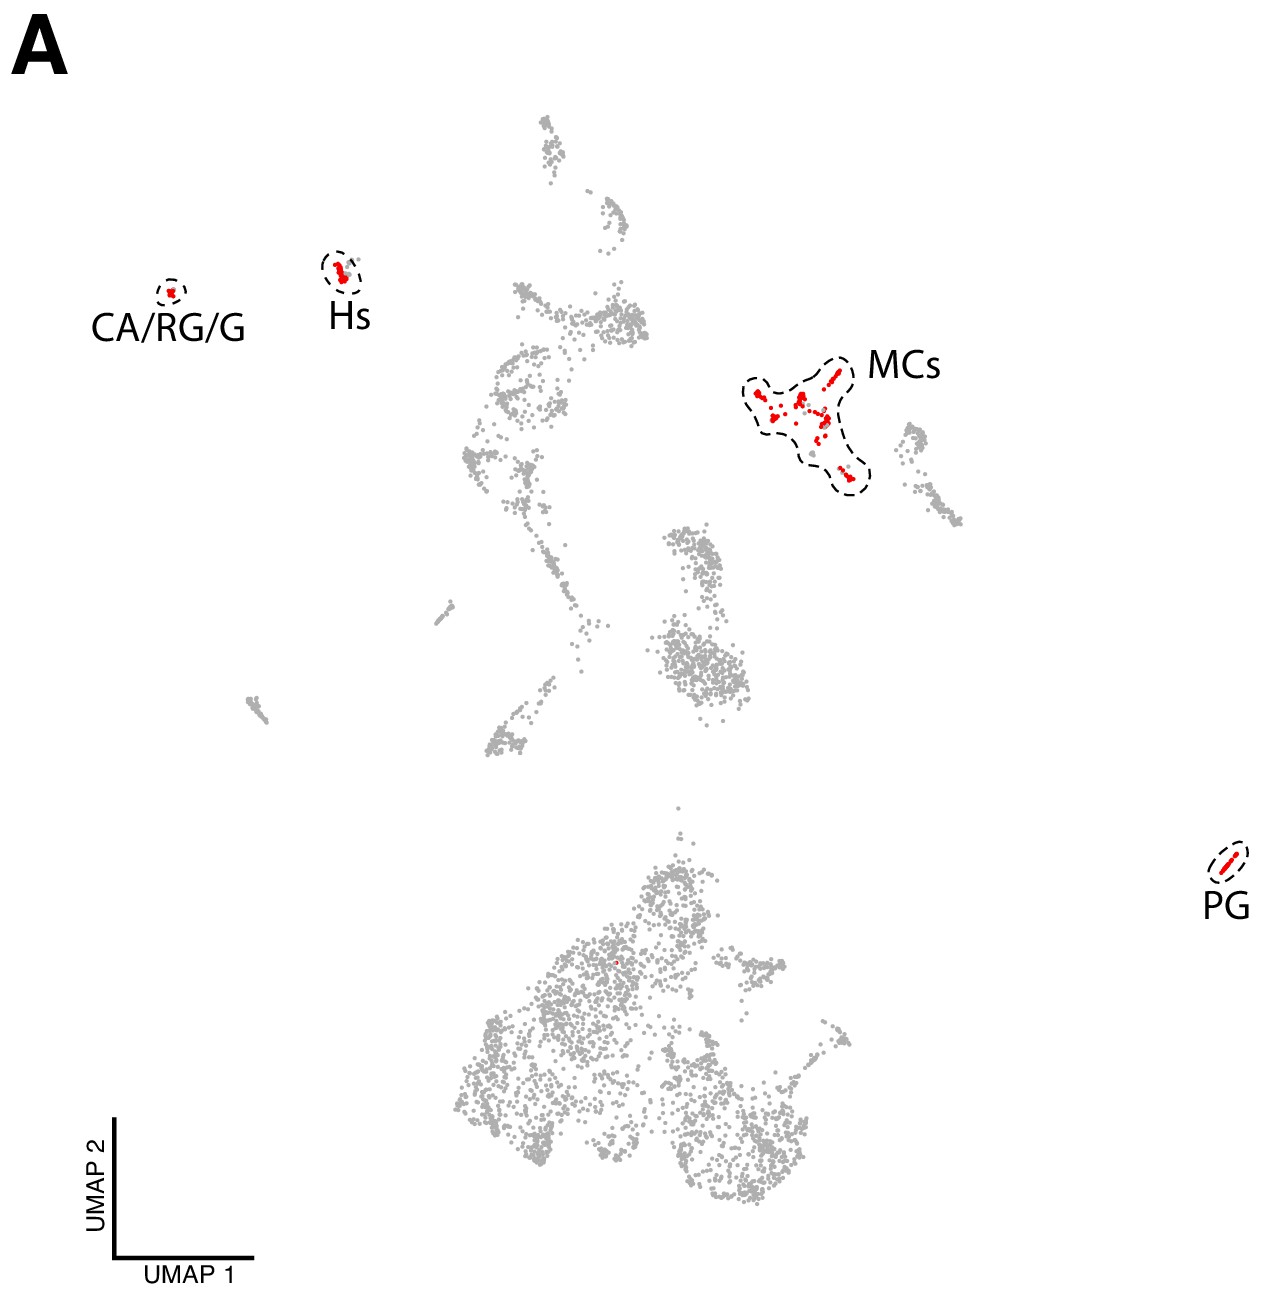
Non-neural cell-types identified in the dataset.
(A) Non-neural cells can be distinguished from the total number of cells. These cells are considered to be ‘contaminations’ and arise from reminiscent tissue attached to the brain during and after dissection: lymph gland, hemocytes, corpora allata, ring gland, gut and muscle (red cells). PG, prothoracic gland; CA/RG/G, corpora allata, ring gland and guts; Hs, hemocytes and MCs, muscular cells.
Figure 2 with 2 supplements
Identification of neural progenitor cell populations.
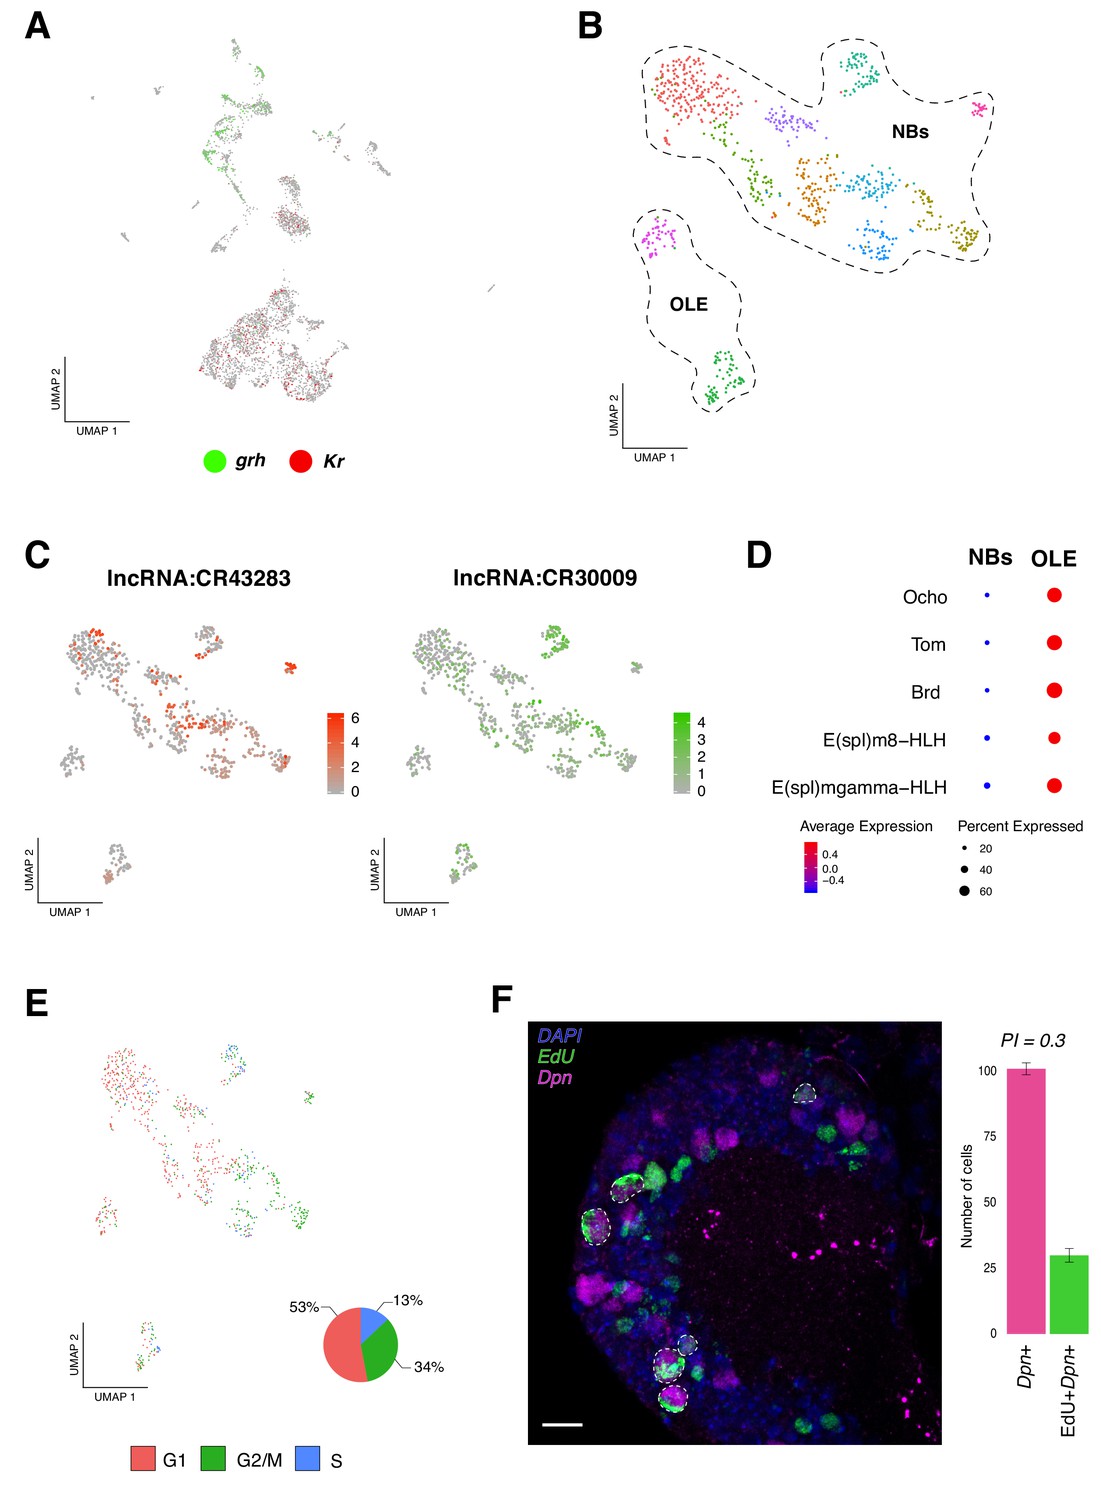
(A) Expression-pattern of genes from the temporal cascade distinguish population of cells. Two dimensions UMAP plot labeling genes from the temporal cascade. Grh, grainy head in green and Kr, Kruppel in red. Grh is broadly expressed in the recently born neuroprogenitors, while Kr is expressed in mature cells. (B) Re-analysis of the neurogenic populations by sub-clustering the original NPCs population, plotted in a Seurat UMAP plot, identifies 11 sub-populations of cells. NPCs are further divided into neuroblasts and optic lobe epithelium (OLE). (C) lncRNAs are present in NPCs expression profile. Color coded UMAP plot showing the abundance of long non-coding RNAs (lncRNAs). The scale represents gene expression levels. (D) OLE can be distinguished from the remaining neuroblasts based on the expression of characterized marker genes. Dot size corresponds to the percentage of cells expressing a particular gene, while color intensity represents gene expression levels. (E) Cell-cycle scores can be estimated transcriptionally. UMAP plot showing the different NPCs color coded based on cell-cycle phases. The pie graph illustrates the percentage of NPCs in each phase, G1, G2M and S. (F) EdU incorporation and NPCs proliferation. Immunostaining of the larval brain illustrating Dpn+ proliferating NPCs at 16 hr ALH. Proliferation index (PI) was calculated as the ratio between Dpn+EdU+ NPCs and Dpn+ NPCs. Error bars represent standard error. N = 5. Nuclei were labeled with DAPI. Scale bar: 20 µm.
Figure 2—figure supplement 1
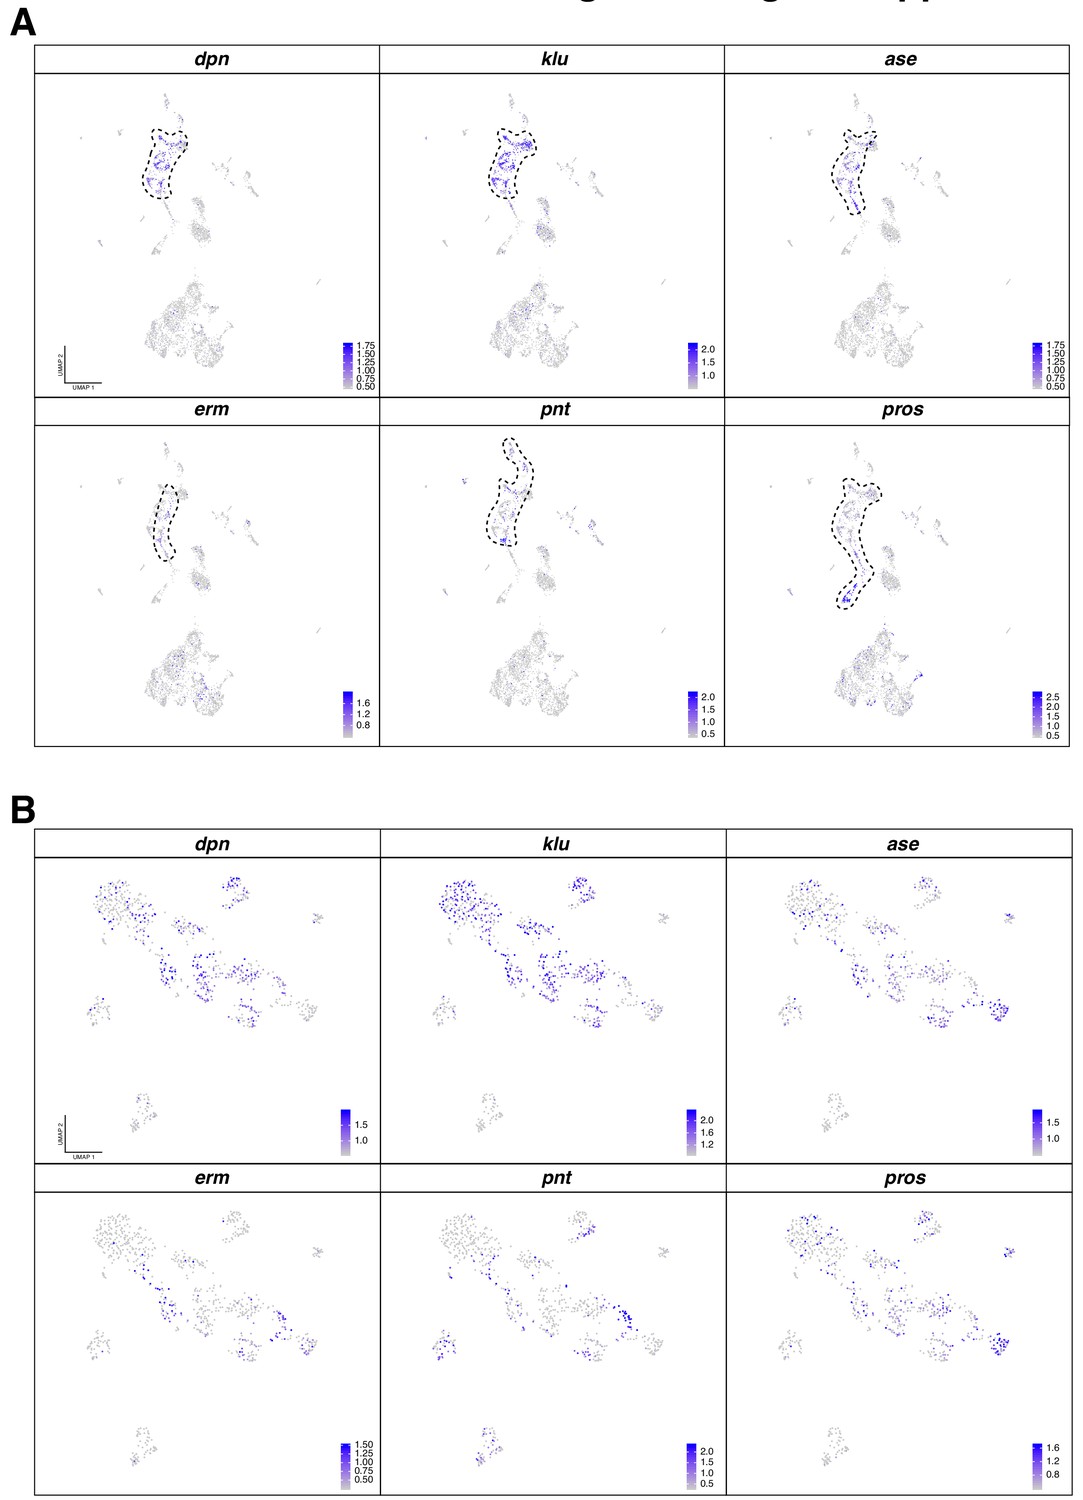
Marker genes for the identification of neural progenitor cell populations.
(A) Two dimensions UMAP plot labeling neurogenic marker genes: dpn, klu, ase, erm, pnt and pros. Localization of the neurogenic population in the original dataset is outlined with a dash line. (B) The original NPCs were sub-clustering, re-analyzed and represented in UMAP plots, indicating the expression of neurogenic marker genes: dpn, klu, ase, erm, pnt and pros. Gene expression level is color coded.
Figure 2—figure supplement 2
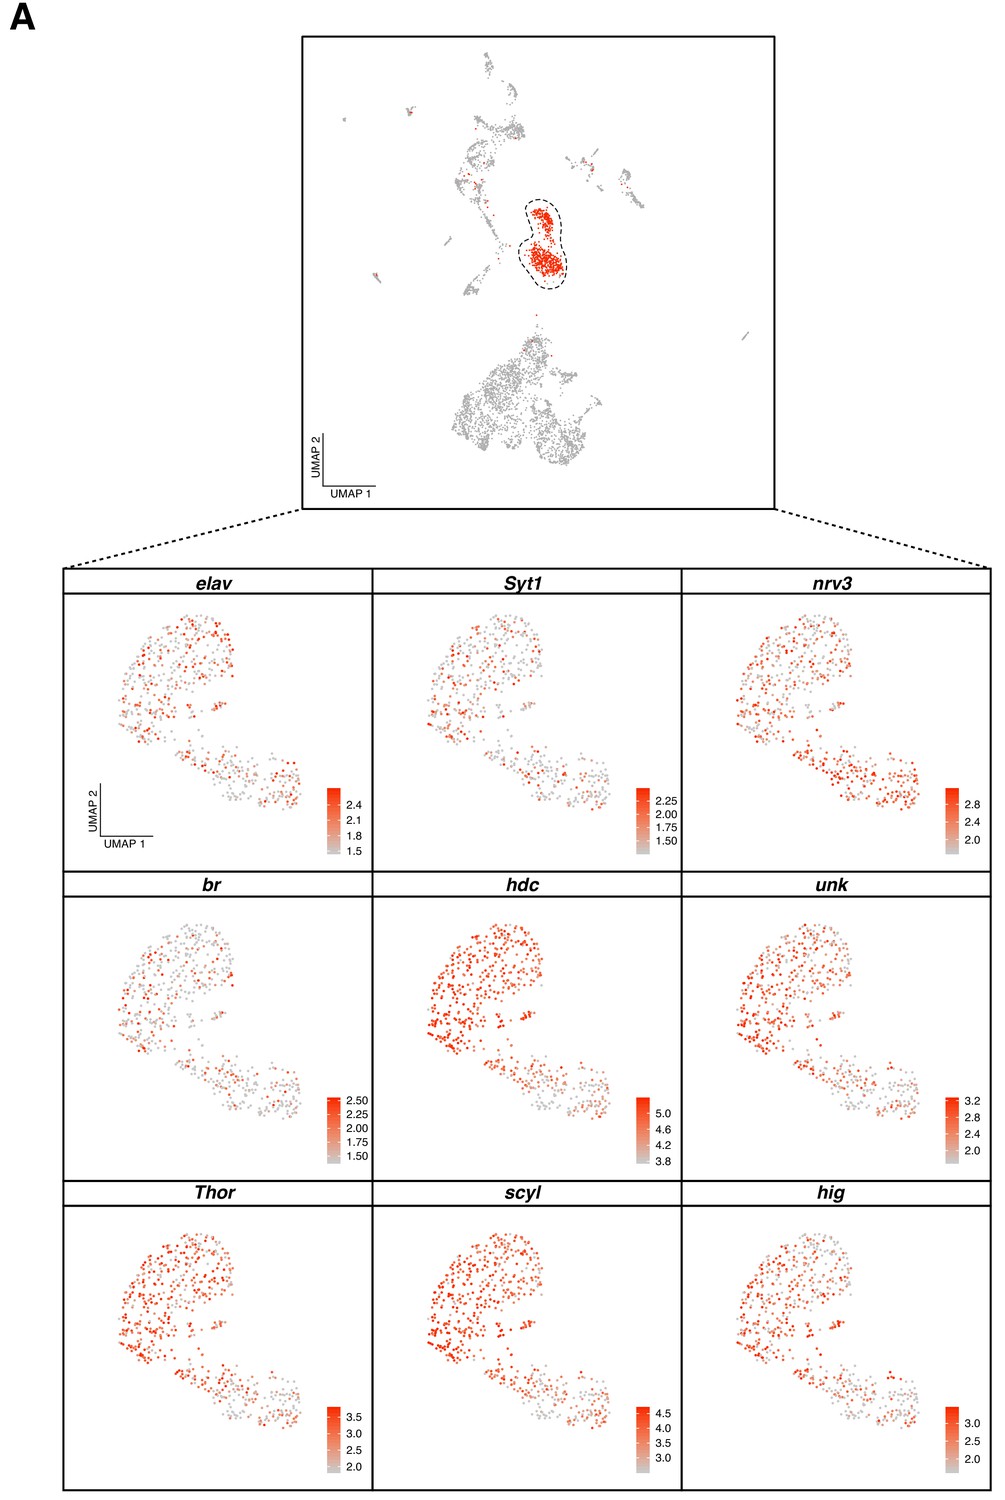
Identifying undifferentiated neurons in the larval brain.
(A) On top, UMAP plot showing the localization of the undifferentiated neurons (UNs) in the original representation. Bottom, zoom into the UNs displaying the expression of neuronal marker genes: elav, Syt1, nrv3, and other upregulated genes: br, hdc, unk, Thor, scyl and hig. Gene expression level is color coded.
Figure 3 with 2 supplements
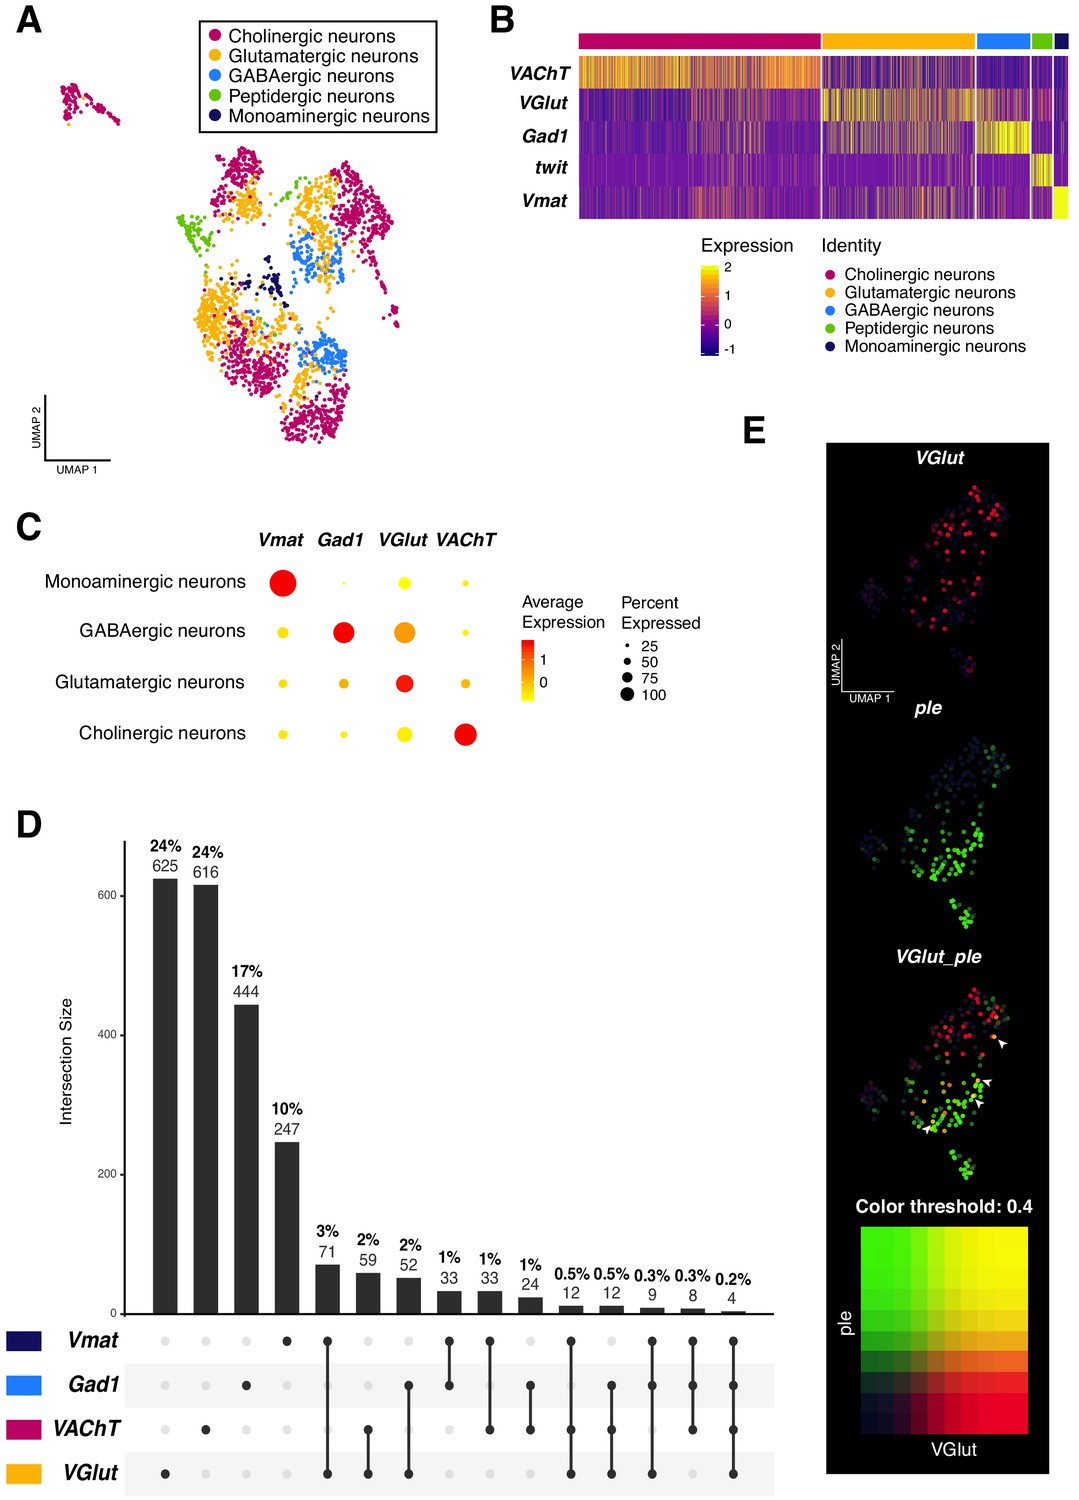
Neurotransmitter expression and co-expression in the larval neuronal population.
(A) Neurons are classified based on the expression of neurotransmitters. Seurat UMAP plot showing the distribution of the five main neuronal cell-types. (B) Simplified heatmap, representing neuronal subpopulations. Genes displayed are the main markers analyzed to identify neuronal cell-identities. The x axis represents individual cells, each line corresponds to one neuron. Gene expression levels are color coded. (C) Neurotransmitters are co-expressed in a subset of neurons. Dot size corresponds to the percentage of cells expressing a particular gene, while color intensity represents gene expression levels. (D) UpSet plot (Conway et al., 2017) illustrating the co-expression of neurotransmitters. Light and bold numbers represent number of cells and percentages of cells, respectively. The percentages were calculated based on positive cells for a particular neurotransmitter or a combination of them, in comparison to the total of neurons from the dataset. (E) Co-expression analysis based on the simultaneous expression of ple and VGlut. Blend UMAP plot showing only ple positive cells. Cells co-expressing ple and VGlut are shown in yellow. Threshold: 0,4.
Figure 3—figure supplement 1
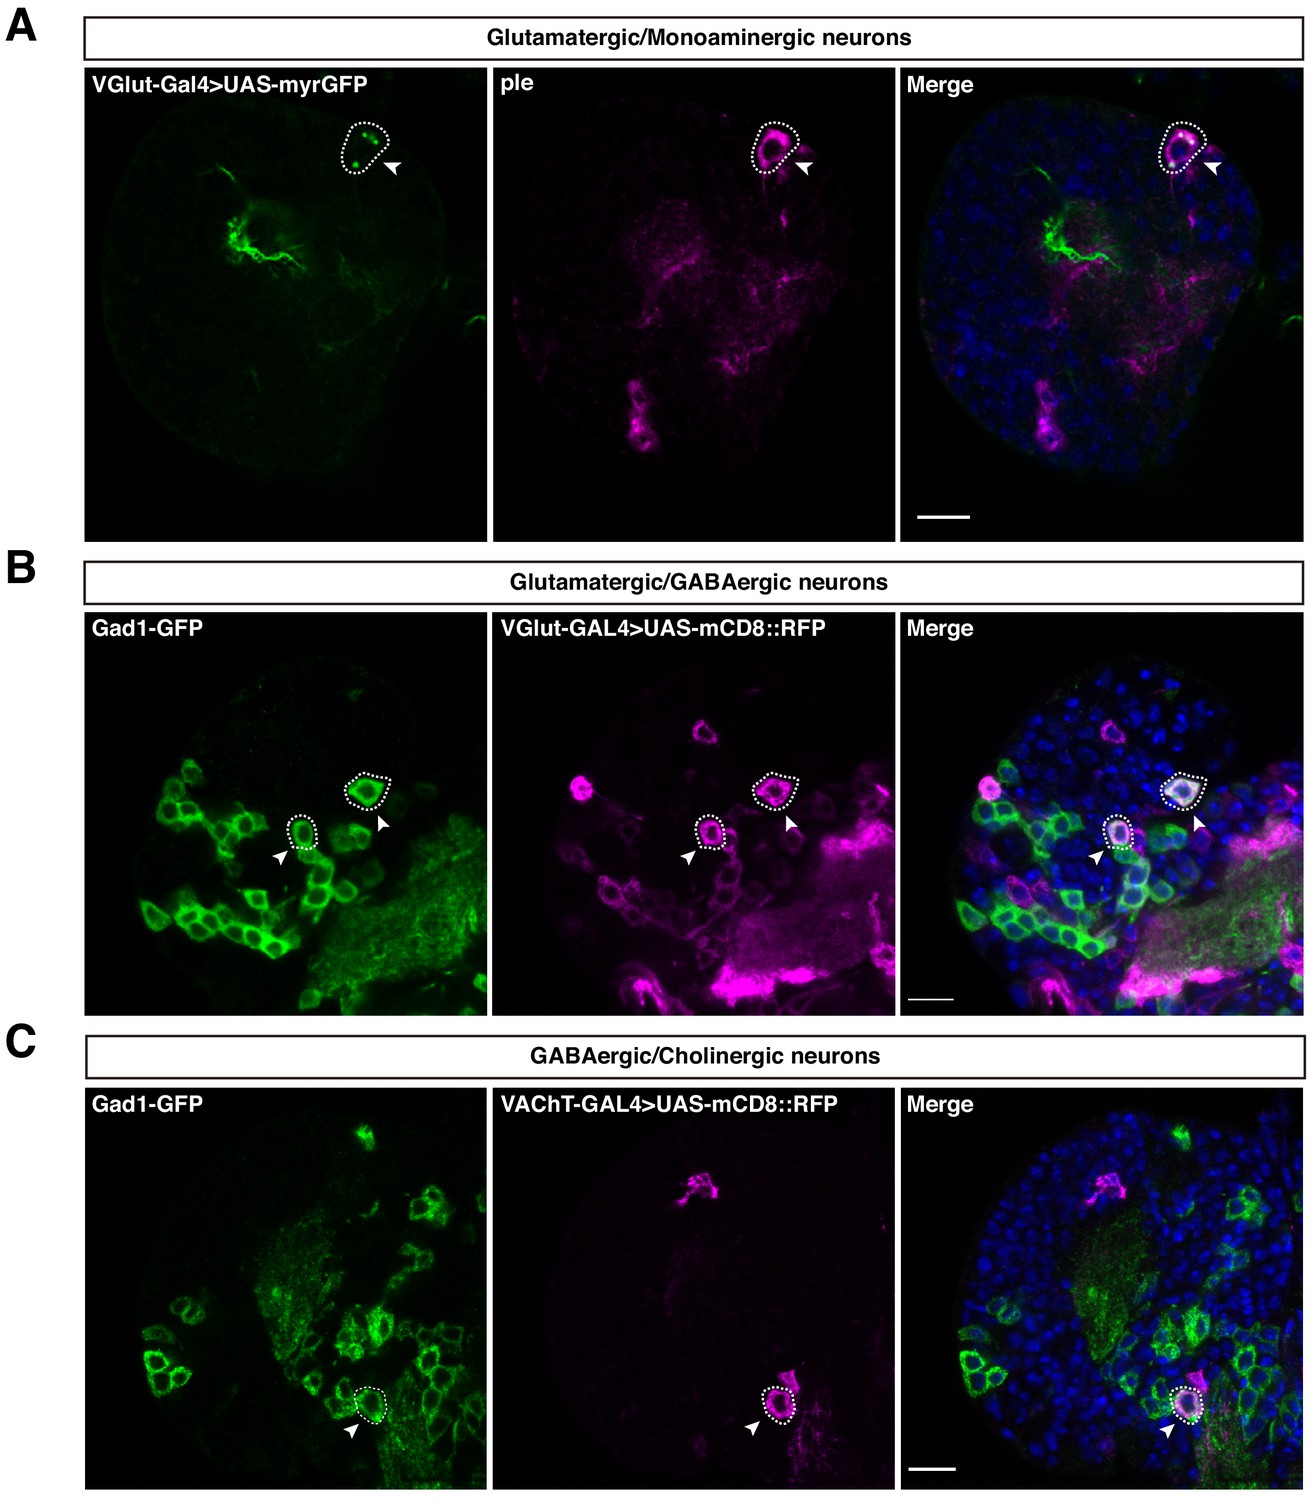
Neurotransmitter co-expression in the larval brain.
(A) Neurotransmitters are co-expressed with monoamines. VGlut and ple overlapping. (B–C) Neurotransmitters co-expression. Subsets of Glutamatergic/GABAergic neurons and GABAergic/Cholinergic neurons. Neurons with the overlap of interest are circled with a dashed-line and pointed with arrows. Nuclei were labeled with DAPI. Scale bar: 10 µm.
Figure 3—figure supplement 2

Monoaminergic neurons analysis.
(A) Re-clustering analysis of monoaminergic neurons revealed an enrichment of Dopaminergic neurons. UMAP plot indicating the expression of dopaminergic marker genes: Vmat, ple and Ddc, against other aminergic markers: Tbh, Tdc2 and SerT. (B) The remaining aminergic neurons can be identified in different clusters in the original UMAP plot, validating the co-expression between neurotransmitters. Gene expression levels are color coded.
Figure 4
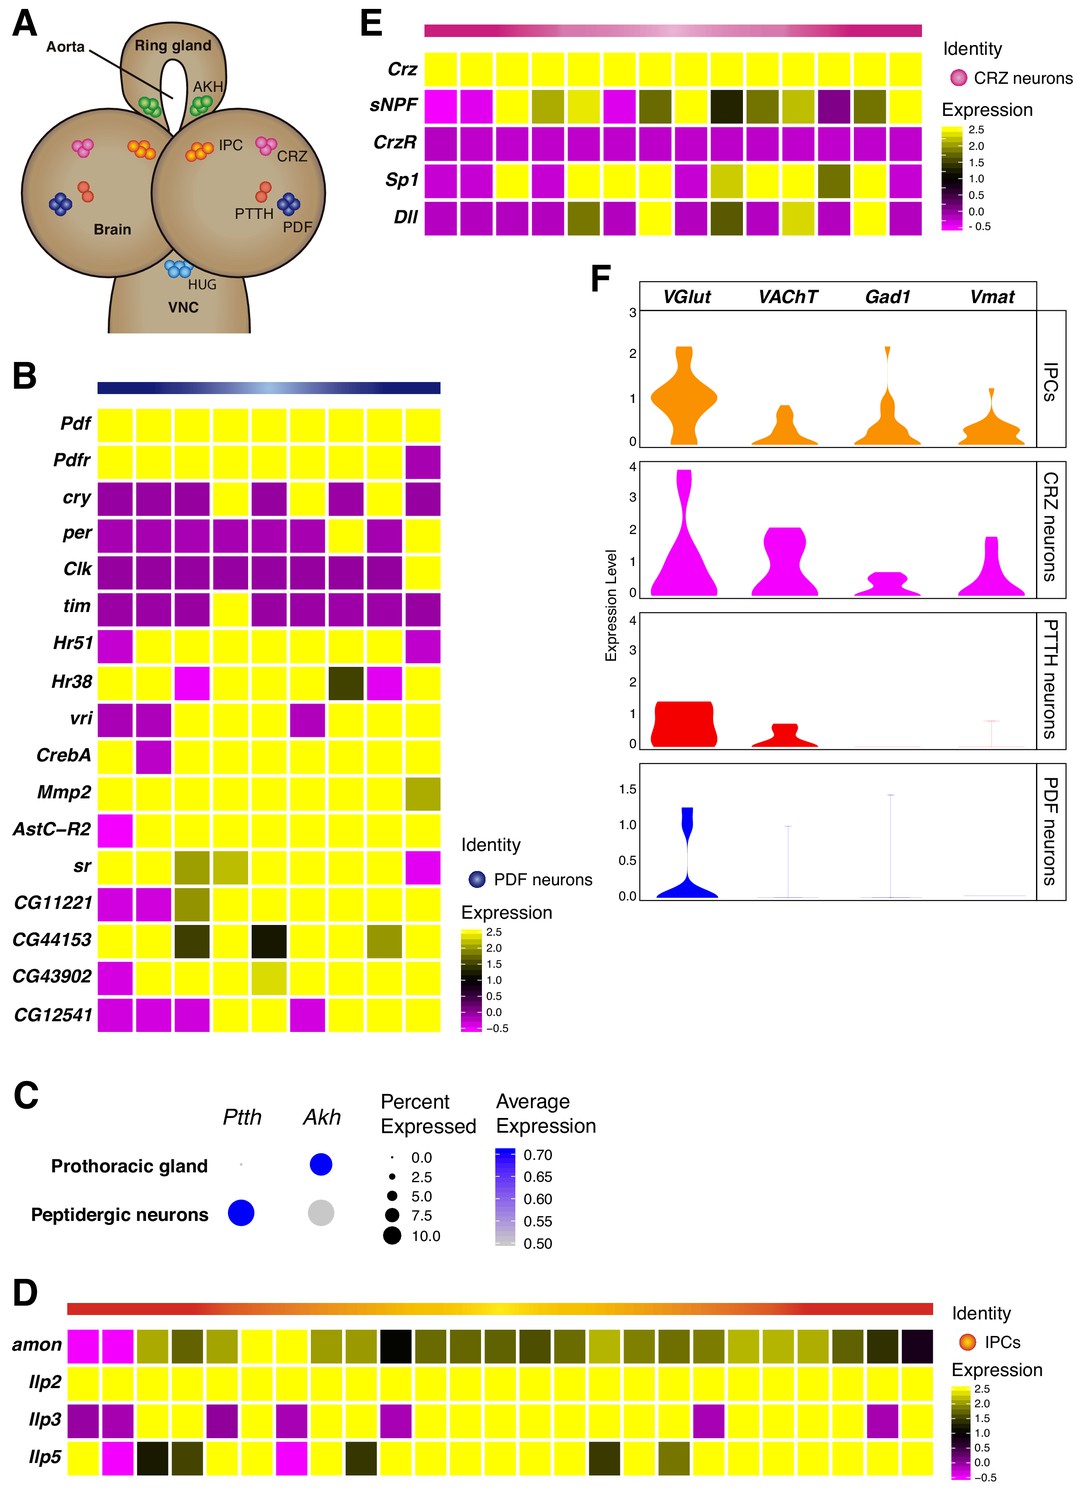
Neurosecretory cells distribution in the larval brain.
(A) Schematic representation of some neurosecretory cells present in the larval brain and the ring gland. VNC, ventral nerve cord. (B, D, E) Heatmaps showing gene expression profiles of PDF neurons, IPCs and CRZ neurons. In each case, only Pdf, Ilp2 and Crz highly positive cells were considered, respectively. White vertical lines separate individual cells, each column represents one cell. Gene expression levels are color coded. (C) Dot plot showing the presence of PTTH and Akh neurons, in peptidergic neurons and prothoracic gland, respectively. Dot size represents percentage of cells expressing a particular gene, while color intensity represents gene expression levels. (F) Neurosecretory cells express one or multiple neurotransmitters. Violin plot illustrating co-expression of neurotransmitters and neuropeptides. Violin plots represent the probability density of the data integrated with kernel density estimation. Wider sections of the violin plots represent a higher probability of cells with the indicated gene expression level, while skinnier sections represent lower probabilities.
Figure 5
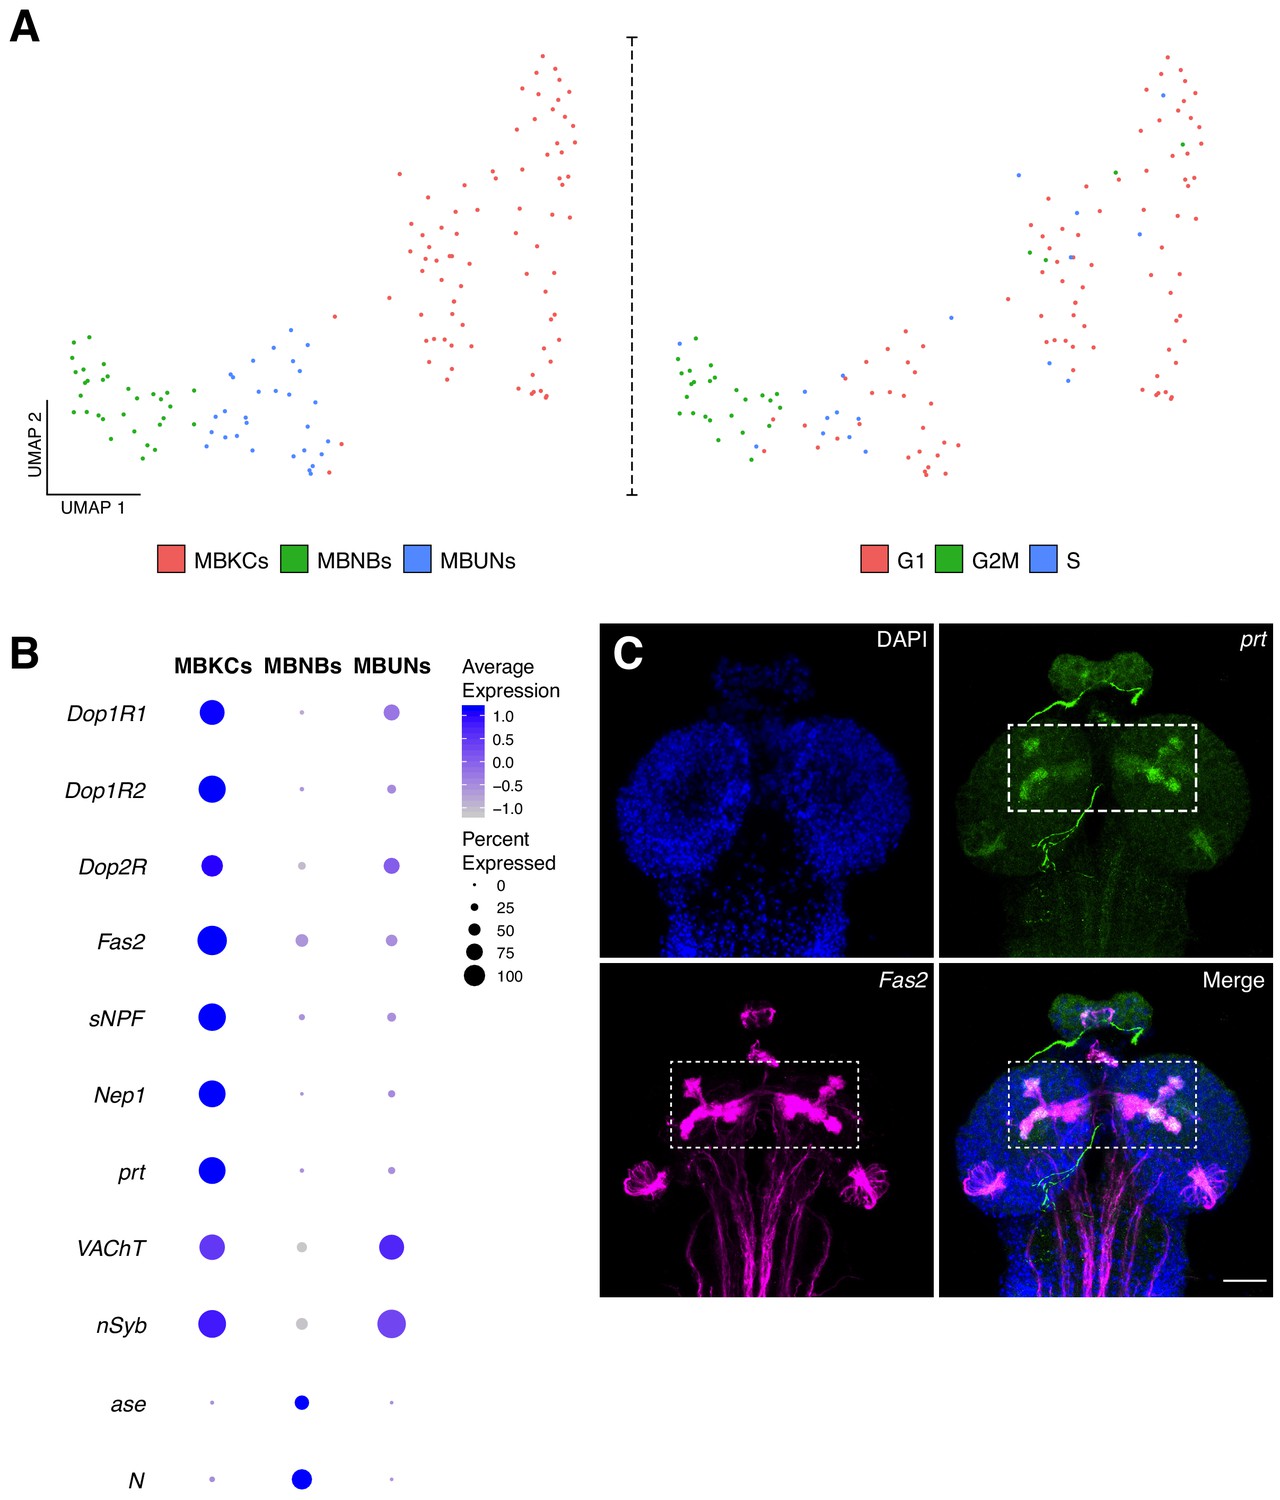
Characterization of the mushroom body cellular composition.
(A) Identification of three main cell types among the mushroom body cluster of cells. Left panel: Re-clustering of the MB cluster led to three different cell populations: MBNBs, MB neuroblasts; MBUNs, MB undifferentiated neurons and MBKCs; MB Kenyon cells. Right panel: cell cycle analysis of the MB population further confirms previously mentioned cell-types. S, S phase; G1, G1 phase and G2M, G2/mitosis phases of the cell cycle. (B) The different cell types express distinct genes and validates their classification. Dot plot representation of the main markers found for each MB subpopulation. Dot size corresponds to percentage of cells expressing a particular gene, while color intensity represents gene expression levels. (C) Validation of marker genes found for the MBKCs. Immunostaining showing the distribution of prt in the larval brain MB. The MB was labeled with Fas2 and nuclei with DAPI. In the merge condition, prt antibody colocalizes with Fas2, indicating their co-expression in the MB. Scale bar: 100 µm.
Figure 6
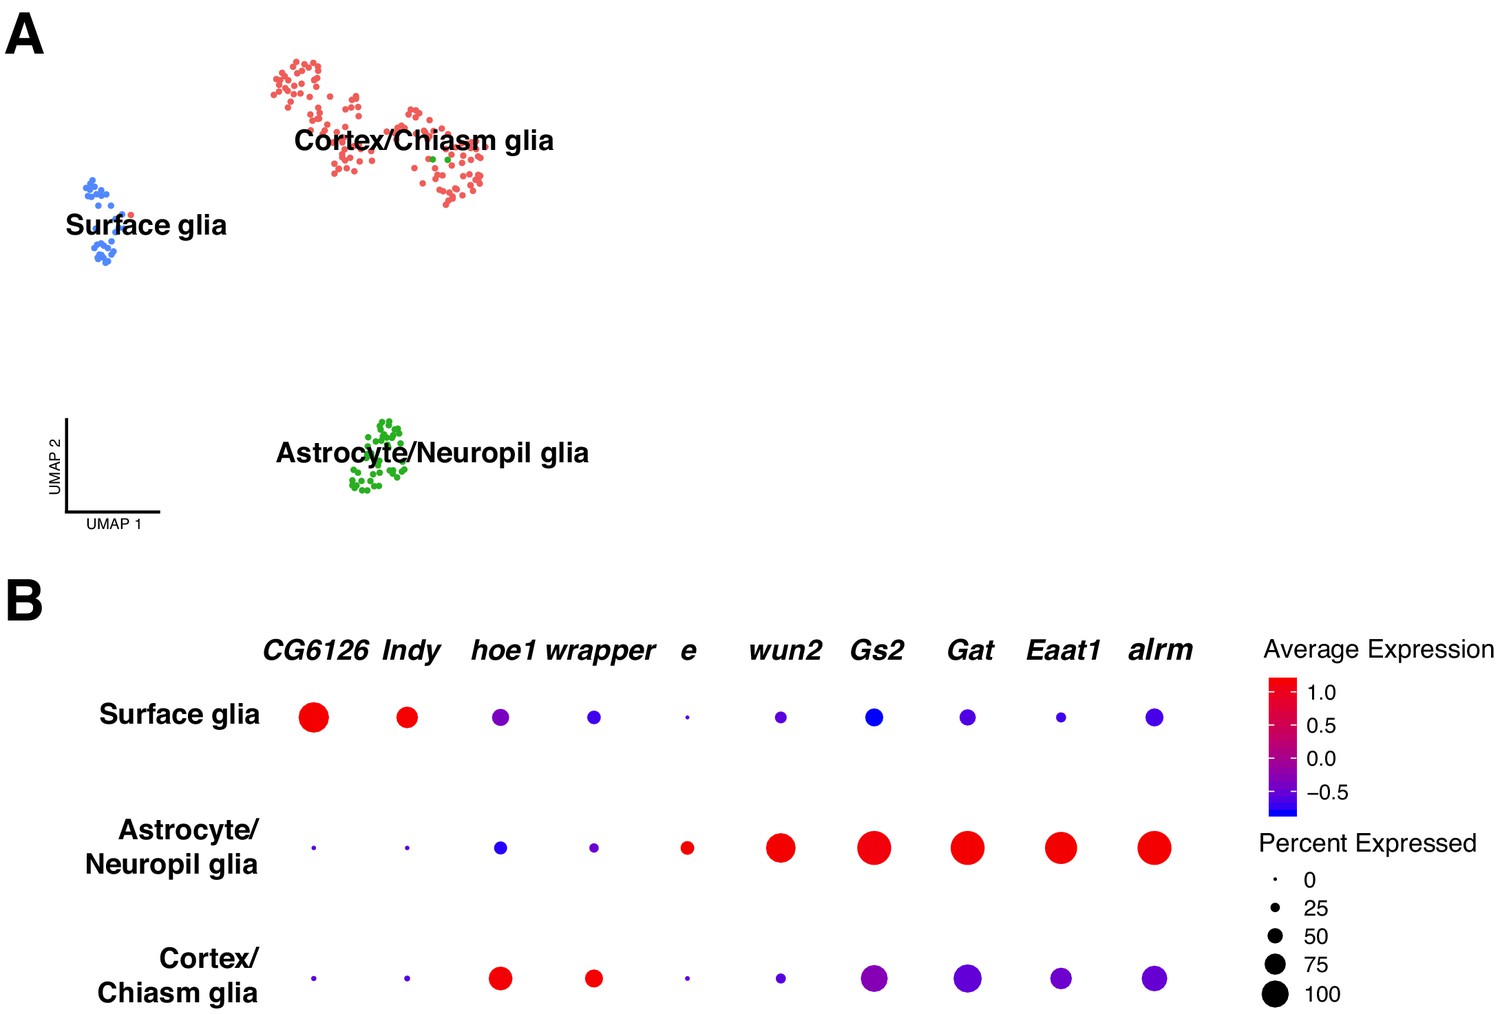
Classification of glial cell-types.
(A) Analysis on the glial cell population revealed different glial cell types. After sub-clustering of the initially identified glial cells, three main clusters were identified: surface glia, astrocyte/neuropil glia and chiasm/cortex glia. (B) Each particular glial cell type possesses a particular expression profile. The differentially expressed genes are represented in a dot plot, where dot size corresponds to the percentage of cells expressing a particular gene and color to gene expression intensity levels. Red: high expression, blue: low expression.
Figure 7 with 3 supplements

Effects of starvation on the cellular composition of the larval brain.
(A) Starvation reveals sensitive cell types. Overlapping UMAP plots for the normal and starved condition, evidence the overall similarity among cell atlases, with few exceptions. (B) Integration across conditions recapitulates the principal cell types largely described in the previous sections. (C) A closer look to the Neurons X reveals its composition. Different neurotransmitters seemed to be equally expressed in the cells of Neurons X cluster. (D) UNs 1 and UNs 2 shared common features. The dot plot representation illustrates some of the marker genes for this particular cell type and the effect of starvation on their expression levels. Dot size corresponds to percentage of cells expressing a particular gene, while color intensity represents gene expression levels.
-
Figure 7—source data 1
Clusters composition.
Table containing the number of cells per cluster per condition.
- https://cdn.elifesciences.org/articles/50354/elife-50354-fig7-data1-v2.xlsx
Figure 7—figure supplement 1
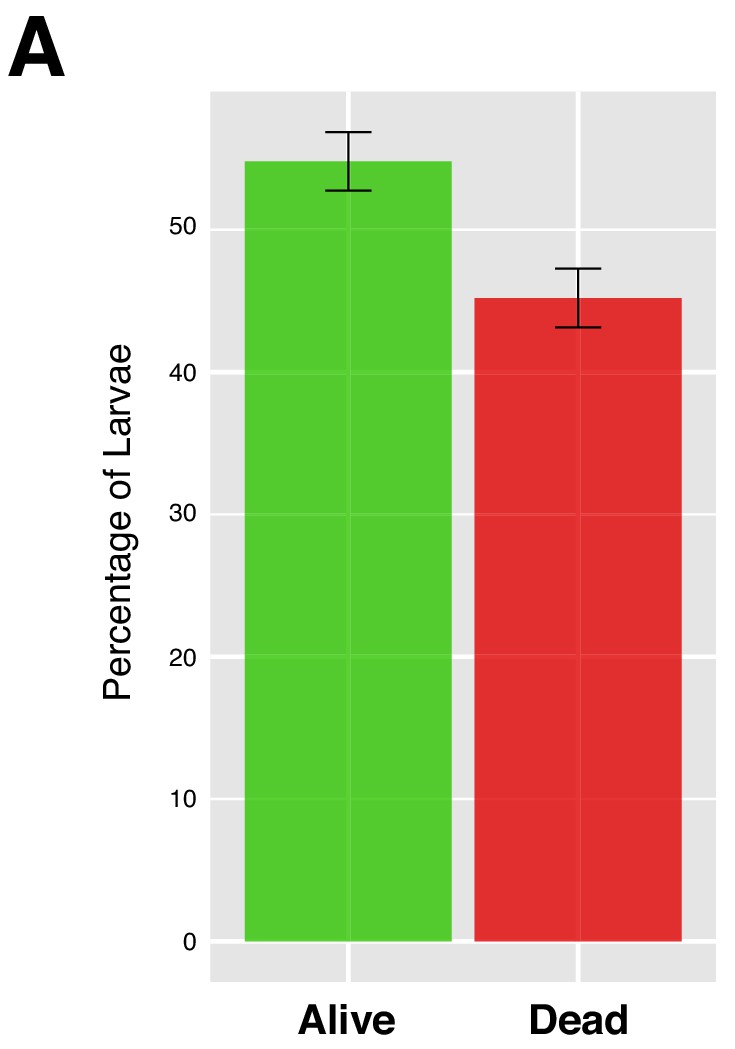
Starvation and survival rate.
(A) Upon 4 hr of starvation, the population of first instar larvae was reduced to approximately 45% of the initial number. Error bars represent standard error. N = 5.
Figure 7—figure supplement 2

Undifferentiated neurons are significantly decreased in cell number during nutrient restriction.
(A) UNs were quantified based on the combination of high and low expression levels of hdc and elav, respectively. (B) UNs cells were quantified prior and after starvation. Upon nutrient restriction, the number of UNs was drastically reduced. Error bars represent standard error. Student’s t test, *p<0,0001. N = 5.
Figure 7—figure supplement 3
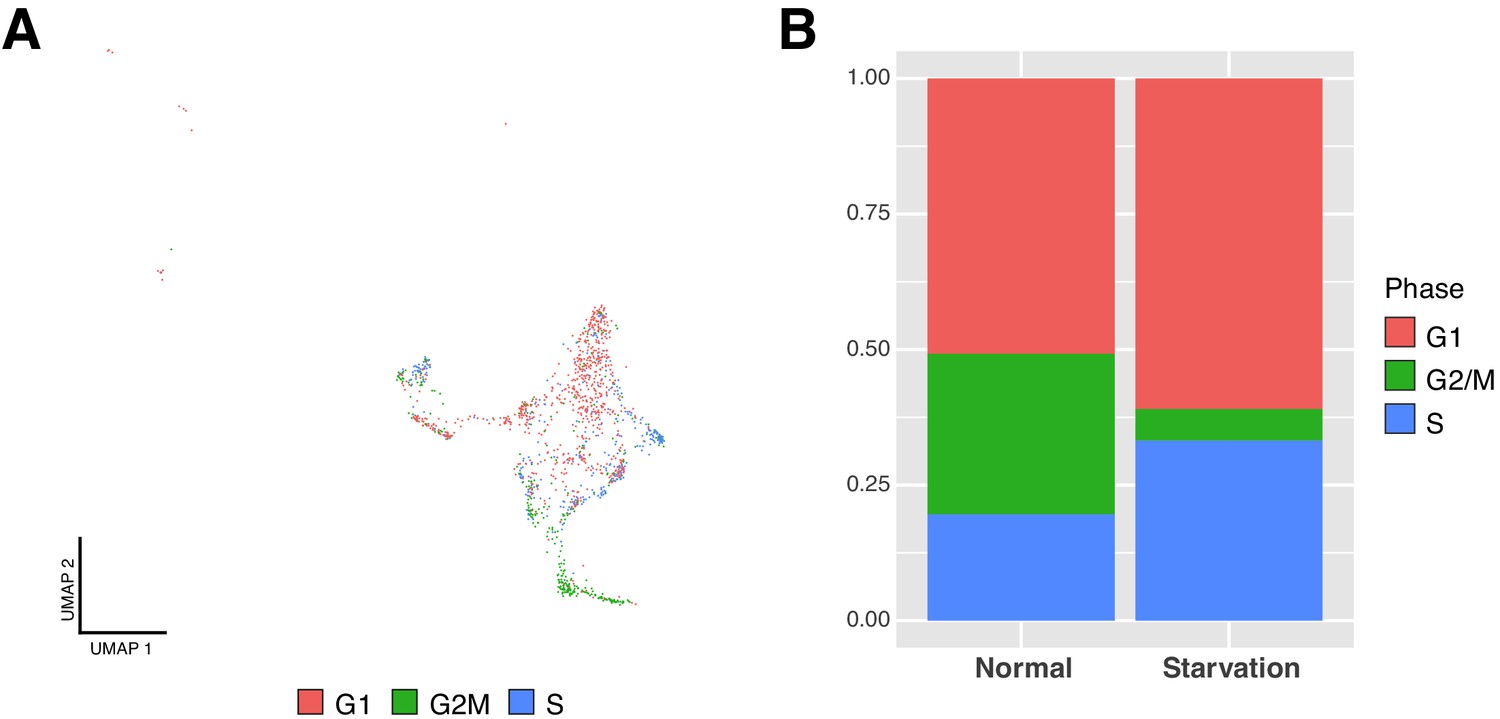
Neuroprogenitor cells fail to exit quiescence upon starvation.
(A) Homogeneity in cell cycle phases across the different cells populating the NPCs clusters. G1, G1 phase; G2M, G2/Mitosis phases; S, S phase. (B) Cell-cycle scores are affected after 4 hr of starvation. Less mitotic NPCs could indicate a lower activation rate.
Figure 8 with 1 supplement
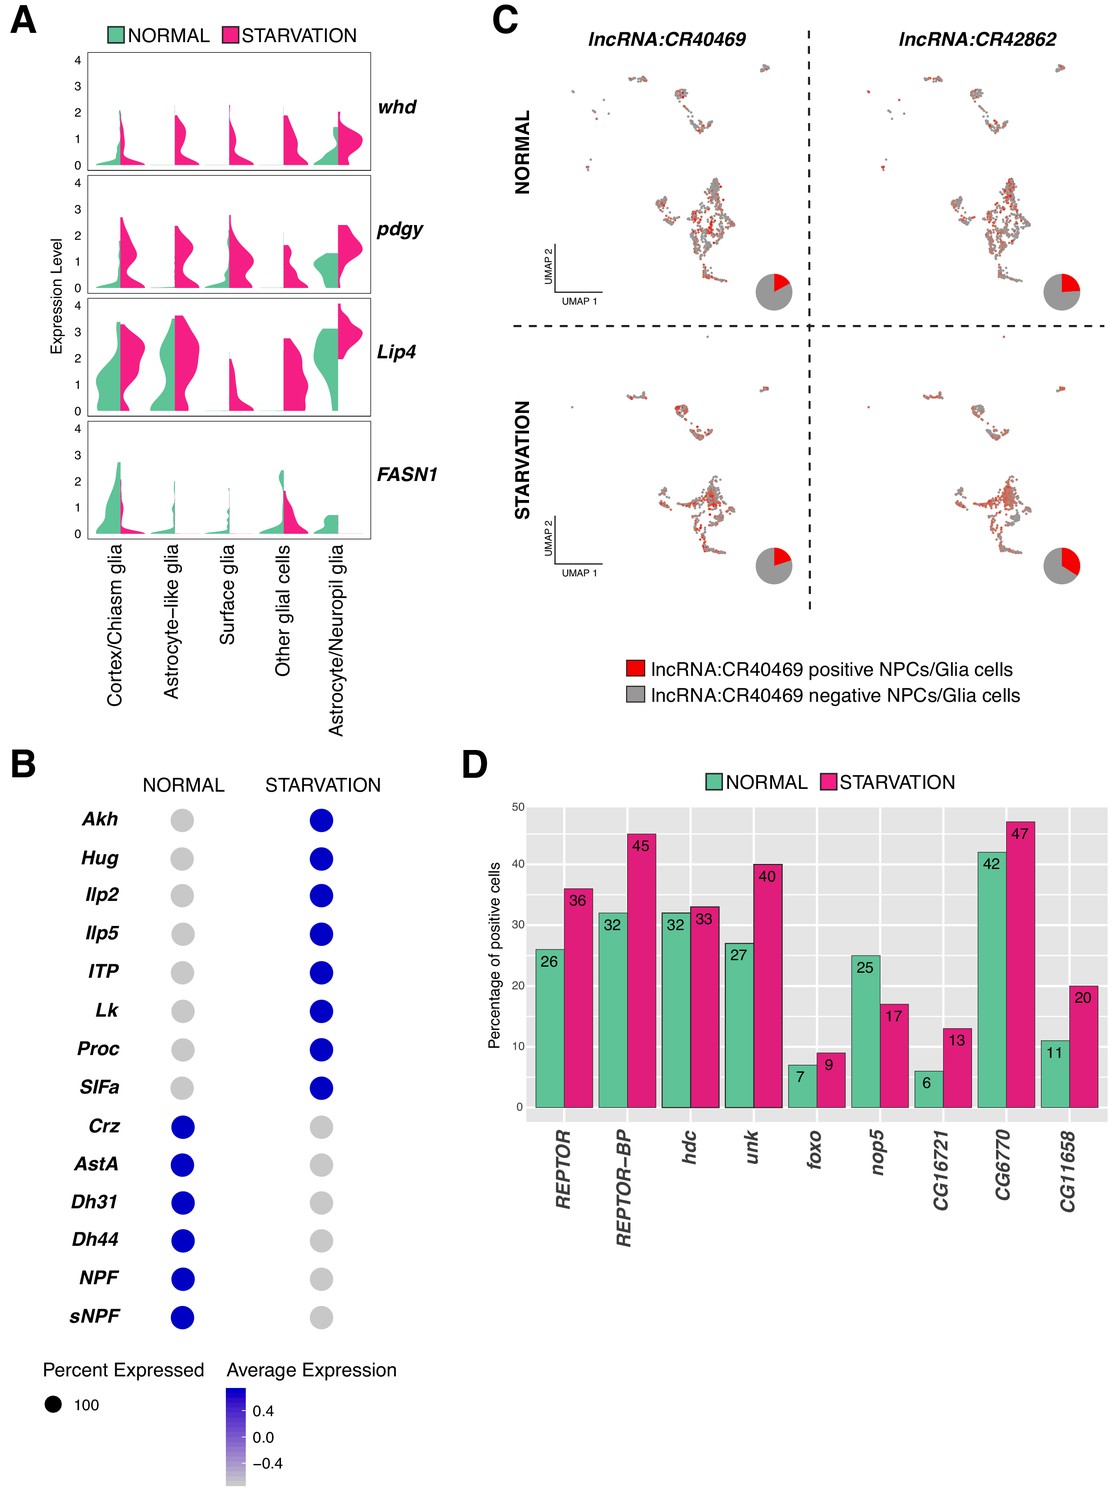
Variation in gene expression upon starvation.
(A) Genes involved in fat acid metabolism are up and downregulated upon starvation in glial cells. Composed violin plot showing changes in gene expression across experimental conditions. Violin plots represent the probability density of the data integrated with kernel density estimation. Wider sections represent higher probability of cells with the indicated gene expression level, while skinnier sections represent lower probability. Each violin plot is split by condition, half corresponds to the normal condition and half to starved condition. Conditions are color coded. (B) Neuropeptides respond differently to nutrient restriction, some of them were upregulated and some others downregulated. Blue indicates high expression, while gray indicates low expression. (C) lncRNAs are also affected by starvation. lncRNA:CR40469 and lncRNA:CR42862 positive cells vary after nutrient restriction. In red, cells expressing a particular lncRNA; in gray, remaining cells. Pie graphs represent the percentage of lncRNA positive cells in the total of NPCs and glial cells. (D) Genes downstream of REPTOR/REPTOR-BP complex are affected upon starvation. Barplot showing changes in the number of cells expressing a particular gene, upon TORC1 downregulation due to starvation. Experimental conditions are color coded.
Figure 8—figure supplement 1
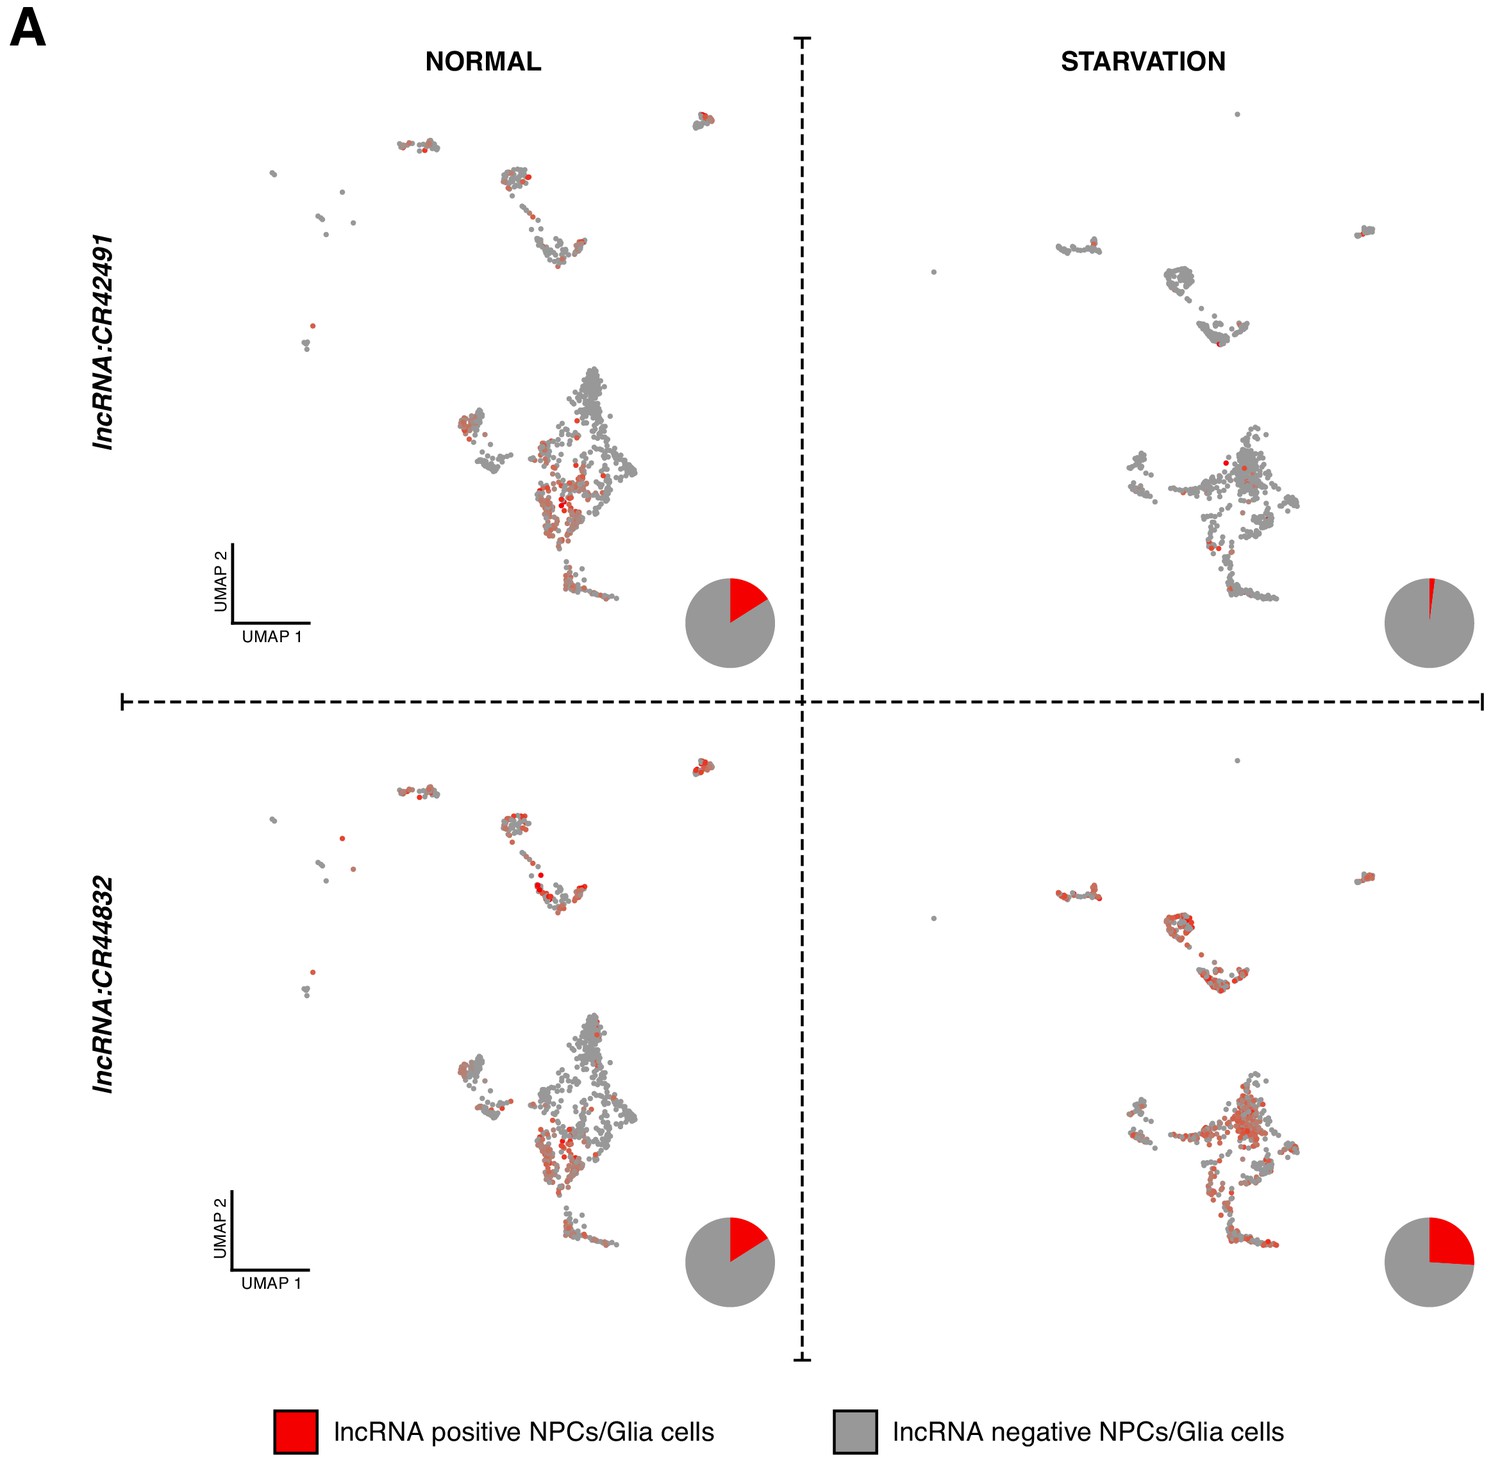
lncRNAs are sensitive to effects of starvation.
(A) Comparison in the expression of lncRNAs before and after starvation, displayed in Seurat UMAP plot. In red, cells expressing a particular lncRNA and in gray, remaining cells. Pie graphs represent the percentage of lncRNA positive cells versus the total of NPCs and glial cells.
Tables
Key resources table
| Reagent type (species) or resource | Designation | Source or reference | Identifiers | Additional information |
|---|---|---|---|---|
| Antibody | Anti-GFP (Chicken polyclonal) | Abcam | Cat# ab13970, RRID:AB_300798 | IF(1:1000) |
| Antibody | Anti-GFP (Rabbit polyclonal) | Thermo Fischer | Cat# A-6455, RRID:AB_221570 | IF(1:1000) |
| Antibody | Anti-Dpn (Guinea pig polyclonal) | Spéder and Brand, 2014 | IF(1:5000) | |
| Antibody | Anti-Dlg (Mouse monoclonal) | Iowa H.B. | Cat# 4F3, RRID:AB_528203 | IF(1:100) |
| Antibody | Anti-Fas2 (Mouse monoclonal) | Iowa H.B. | Cat# 1D4, RRID:AB_528235 | IF(1:20) |
| Antibody | Anti-hdc (Mouse monoclonal) | Iowa H.B. | Cat# U33, RRID:AB_10659722 | IF(1:5) |
| Antibody | Anti-repo (Mouse monoclonal) | Iowa H.B. | Cat# 8D12, RRID:AB_528448 | IF(1:20) |
| Antibody | Anti-prt (Rabbit polyclonal) | David E. Krantz | IF(1:300) | |
| Antibody | Anti-Tyrosine Hydroxylase (Rabbit polyclonal) | Millipore | Cat# AB152, RRID:AB_390204 | IF(1:100) |
| Antibody | Anti-Elav (Rat monoclonal) | Iowa H.B. | Cat# 7E8A10 | IF(3:100) |
| Antibody | Anti-DsRed (Rabbit polyclonal) | Takara Bio | Cat# 632496, RRID:AB_10013483 | IF(1:1000) |
| Antibody | Anti-Rabbit Alexa 647 (Goat polyclonal) | Molecular Probes | Cat# A-21244, RRID: AB_2535812 | IF(1:200) |
| Antibody | Anti-Rabbit Alexa 488 (Goat polyclonal) | Molecular Probes | Cat# A-11008, RRID: AB_143165 | IF(1:200) |
| Antibody | Anti-Mouse Alexa 647 (Goat polyclonal) | Molecular Probes | Cat# A-21235, RRID: AB_2535804 | IF(1:200) |
| Antibody | Anti-Guinea pig Alexa 488 (Goat polyclonal) | Molecular Probes | Cat# A-11073, RRID: AB_2534117 | IF(1:200) |
| Antibody | Anti-Chicken Alexa 488 (Goat polyclonal) | Molecular Probes | Cat# A-11039, RRID: AB_2534096 | IF(1:200) |
| Antibody | Anti-Rat Alexa 647 (Goat polyclonal) | Molecular Probes | Cat# A-21247, RRID: AB_141778 | IF(1:200) |
| Antibody | Anti-Guinea pig Alexa 647 (Goat polyclonal) | Molecular Probes | Cat# A-21450, RRID: AB_2535867 | IF(1:200) |
| Genetic reagent (D. melanogaster) | VGlut-Gal4 | BDSC | RRID: BDSC_24635 | |
| Genetic reagent (D. melanogaster) | UAS-myrGFP | BDSC | RRID: BDSC_32198 | |
| Genetic reagent (D. melanogaster) | Gad1-GFP | BDSC | RRID: BDSC_59304 | |
| Genetic reagent (D. melanogaster) | VAChT-Gal4 | BDSC | RRID: BDSC_39078 | |
| Genetic reagent (D. melanogaster) | UAS-mCD8::RFP | BDSC | RRID: BDSC_32219 |
Additional files
-
Source data 1
List of differentially expressed genes across different feeding conditions.
Table displaying the average log-fold change values for the list of differentially expressed genes among clusters and conditions.
- https://cdn.elifesciences.org/articles/50354/elife-50354-data1-v2.xlsx
-
Supplementary file 1
Sequencing metrics.
Table displaying sequencing details for each of the biological replicates and aggregated datasets.
- https://cdn.elifesciences.org/articles/50354/elife-50354-supp1-v2.xlsx
-
Supplementary file 2
Differentially expressed genes across different feeding conditions.
Scatter plots illustrating the differentially expressed genes per cluster and per condition. Dark blue: a tendency line. Light-dashed line: FC=±1.
- https://cdn.elifesciences.org/articles/50354/elife-50354-supp2-v2.pdf
-
Supplementary file 3
Data dimensionality.
Elbow plots analyzed to select the real dimensionality of the datasets. In red and pointed with an arrow, the number of PCs selected for downstream processing.
- https://cdn.elifesciences.org/articles/50354/elife-50354-supp3-v2.pdf
-
Transparent reporting form
- https://cdn.elifesciences.org/articles/50354/elife-50354-transrepform-v2.pdf
Download links
A two-part list of links to download the article, or parts of the article, in various formats.
Downloads (link to download the article as PDF)
Open citations (links to open the citations from this article in various online reference manager services)
Cite this article (links to download the citations from this article in formats compatible with various reference manager tools)
Single cell transcriptome atlas of the Drosophila larval brain
eLife 8:e50354.
https://doi.org/10.7554/eLife.50354


