PPM1H phosphatase counteracts LRRK2 signaling by selectively dephosphorylating Rab proteins
- University of Dundee, United Kingdom
- Stanford University School of Medicine, United States
Figures
Figure 1
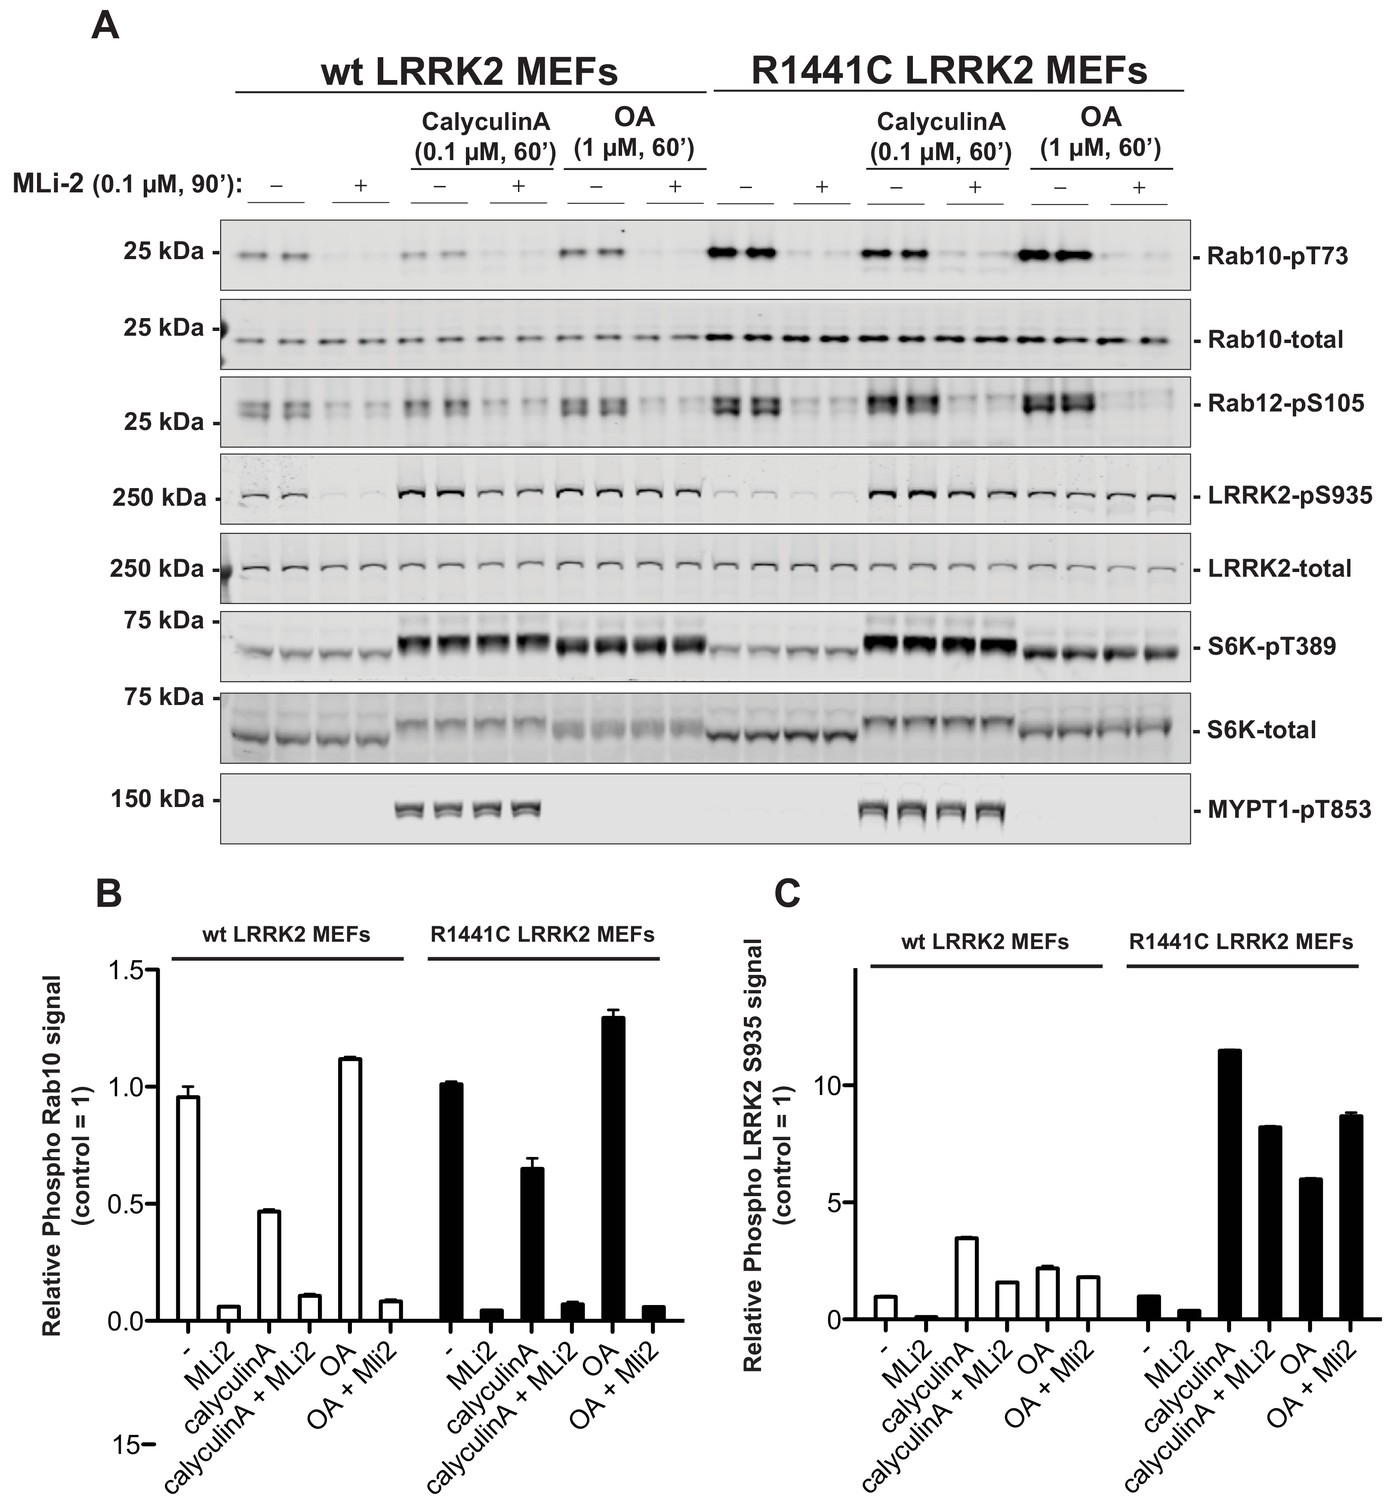
PP1 or PP2A phosphatases do not dephosphorylate Rab proteins.
Littermate-matched wild-type and R1441C LRRK2 MEF cells were pre-treated with or without 100 nM MLi-2 for 90 min before administration of either 100 nM Calyculin A or 1 µM Okadaic Acid for further 60 min. Floating and adhering cells were lysed, and 10 µg of whole cell extract subjected to quantitative immunoblot analysis with the indicated antibodies (all at 1 µg/ml). Each lane represents cell extract obtained from a different dish of cells (two replicates per condition). (A) The membranes were developed using the LI-COR Odyssey CLx Western Blot imaging system. (B and C) Immunoblots were quantified for phospho-Thr73 Rab10/total Rab10 ratio (B) and phospho-Ser935 LRRK2/total LRRK2 ratio (C) using the Image Studio software. Data are presented relative to the phosphorylation ratio observed in cells treated with no MLi-2 and no phosphatase inhibitor, as mean ± SD.
Figure 2 with 3 supplements
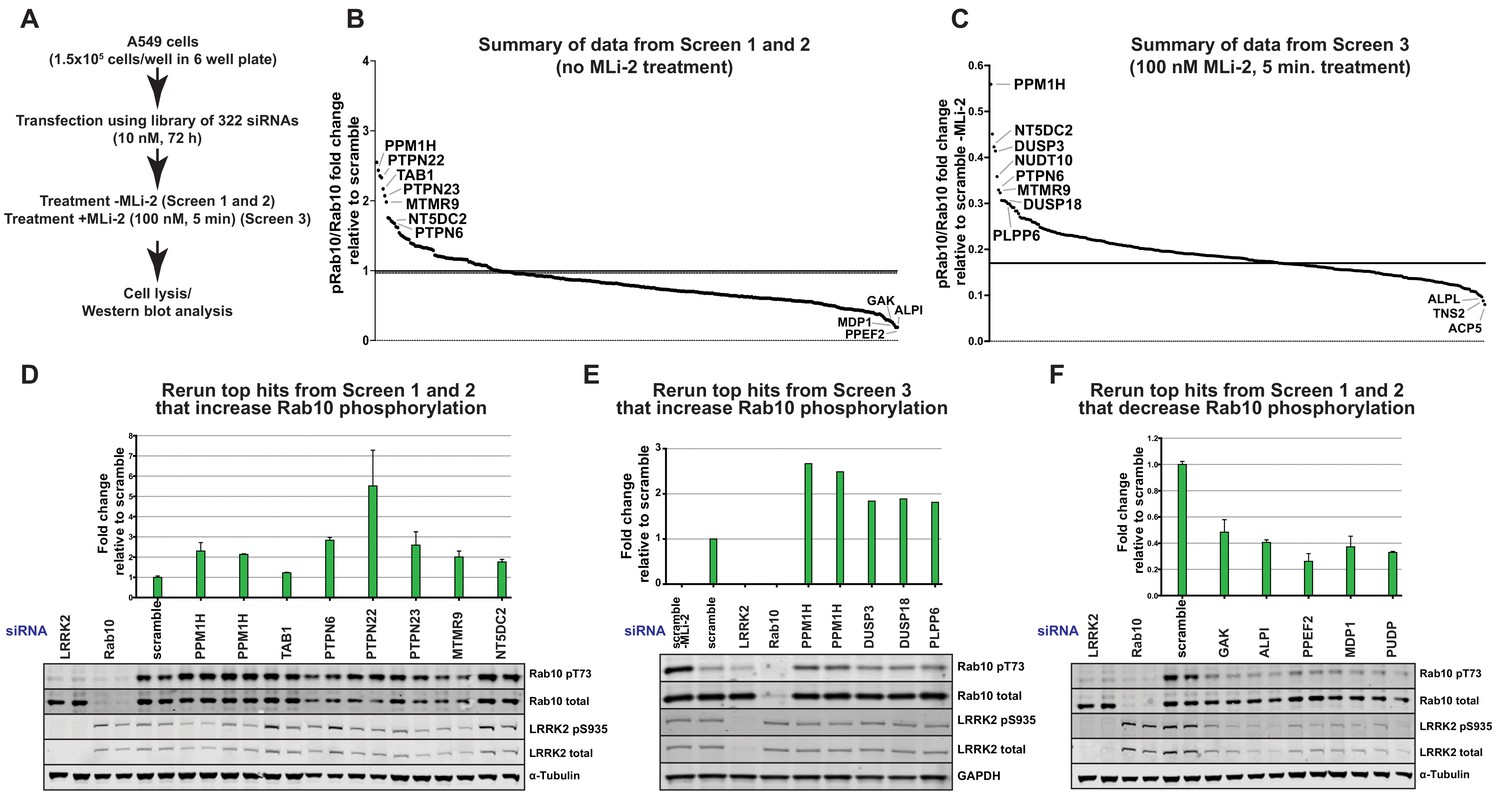
siRNA screens to identify phosphatases that regulate Rab10 phosphorylation.
(A) Workflow of siRNA knockdown screens employed in this study. Human A549 cells were transfected with siRNA pools (Dharmacon) for 72 hr targeting 264 phosphatase catalytic subunits (189 protein phosphatases, 26 halo acid dehalogenase phosphatases, 18 chloroperoxidases, five nucleoside-diphosphate-linked moiety-X phosphatases and seven carbohydrate phosphatases) as well as 56 characterized regulatory subunits. The list of phosphatase components targeted, and oligonucleotide sequences utilized is provided in Supplementary file 1. Cells were lysed and immunoblotted for total LRRK2, LRRK2 pS935, total Rab10, and Rab10 pT73 and immunoblots developed using the LI-COR Odyssey CLx Western Blot imaging system. The ratio of phospho-Thr73 Rab10/total Rab10 in each sample was quantified using the Image Studio software. (B) Summary of results from Screen 1 and 2 (without MLi-2 pretreatment). Calculated ratio of phosphorylated Rab10 and total Rab10 relative to the scrambled siRNA control, ranked from highest increase in Rab10 phosphorylation to the strongest decrease (mean of the two replicates, SD values not shown on the chart, numerical data provided in Supplementary file 1). (C) As in (B), summary of results from Screen 3 (in which cells were treated for 5 min with 100 nM MLi-2 treatment prior to cell lysis), ratio calculated relative to scrambled siRNA control without MLi-2 treatment. (D) Human A549 cells were transfected with siRNA for 72 hr with the indicated top hits from screen 1 and 2 that increased Rab10 phosphorylation. Cells were then lysed and immunoblotted with the indicated antibodies, analyzed as described above. Data are presented relative to the ratio of Rab10 phosphorylation/total Rab10 observed in cells treated with scrambled siRNA as mean ± SD. (E) As in (D) except the key hits that increased Rab10 phosphorylation in Screen three were reanalyzed. Cells were also treated with 100 nM MLi-2 prior to cell lysis. (F) As in (D) except the key hits that decreased Rab10 phosphorylation in Screen 1 to 3 were reanalyzed.
Figure 2—figure supplement 1
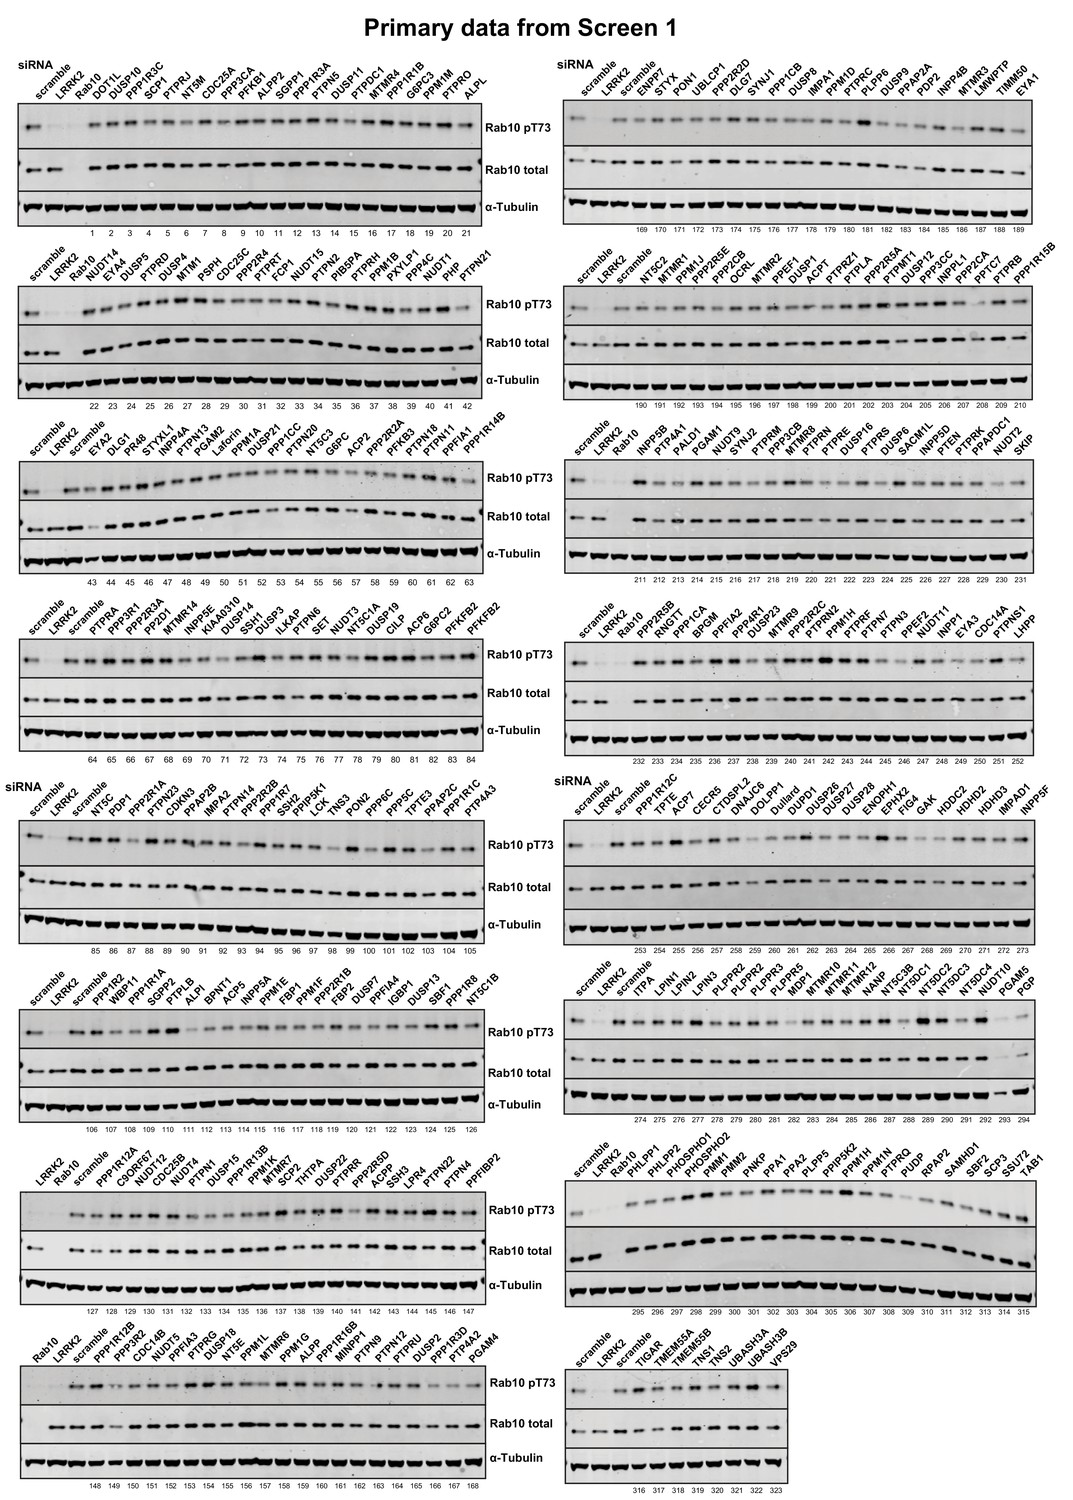
Primary data from siRNA Screen 1 Human A549 cells were transfected with the indicated siRNA pools (Dharmacon) for 72 hr.
Cells were lysed and immunoblotted for the indicated antibodies and immunoblots developed using the LI-COR Odyssey CLx Western Blot imaging system. The numbering system corresponds to that employed in Supplementary file 1. The intensities were quantified and are presented as pRab10/Total Rab10 ratio relative to scrambled siRNA control in Supplementary file 1.
Figure 2—figure supplement 2
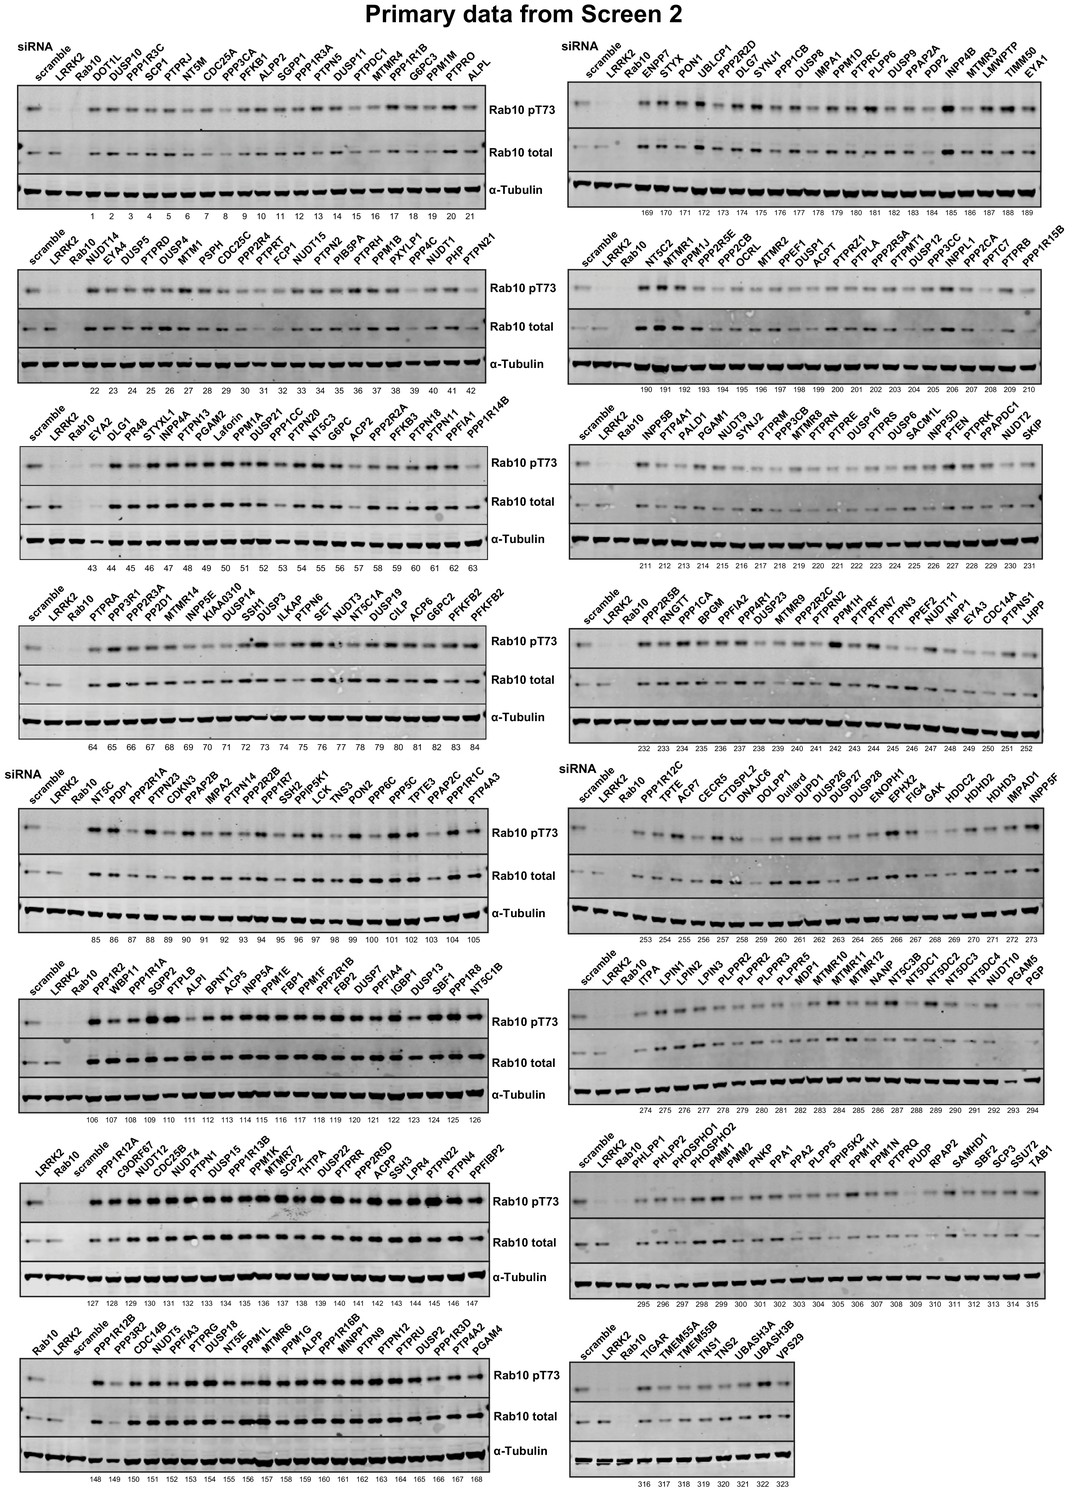
Primary data from siRNA Screen 2 Human A549 cells were transfected with the indicated siRNA pools (Dharmacon) for 72 hr.
Cells were lysed and immunoblotted for the indicated antibodies and immunoblots developed using the LI-COR Odyssey CLx Western Blot imaging system. The numbering system corresponds to that employed in Supplementary file 1. The intensities were quantified and are presented as pRab10/Total Rab 10 ratio relative to scrambled siRNA control in Supplementary file 1.
Figure 2—figure supplement 3
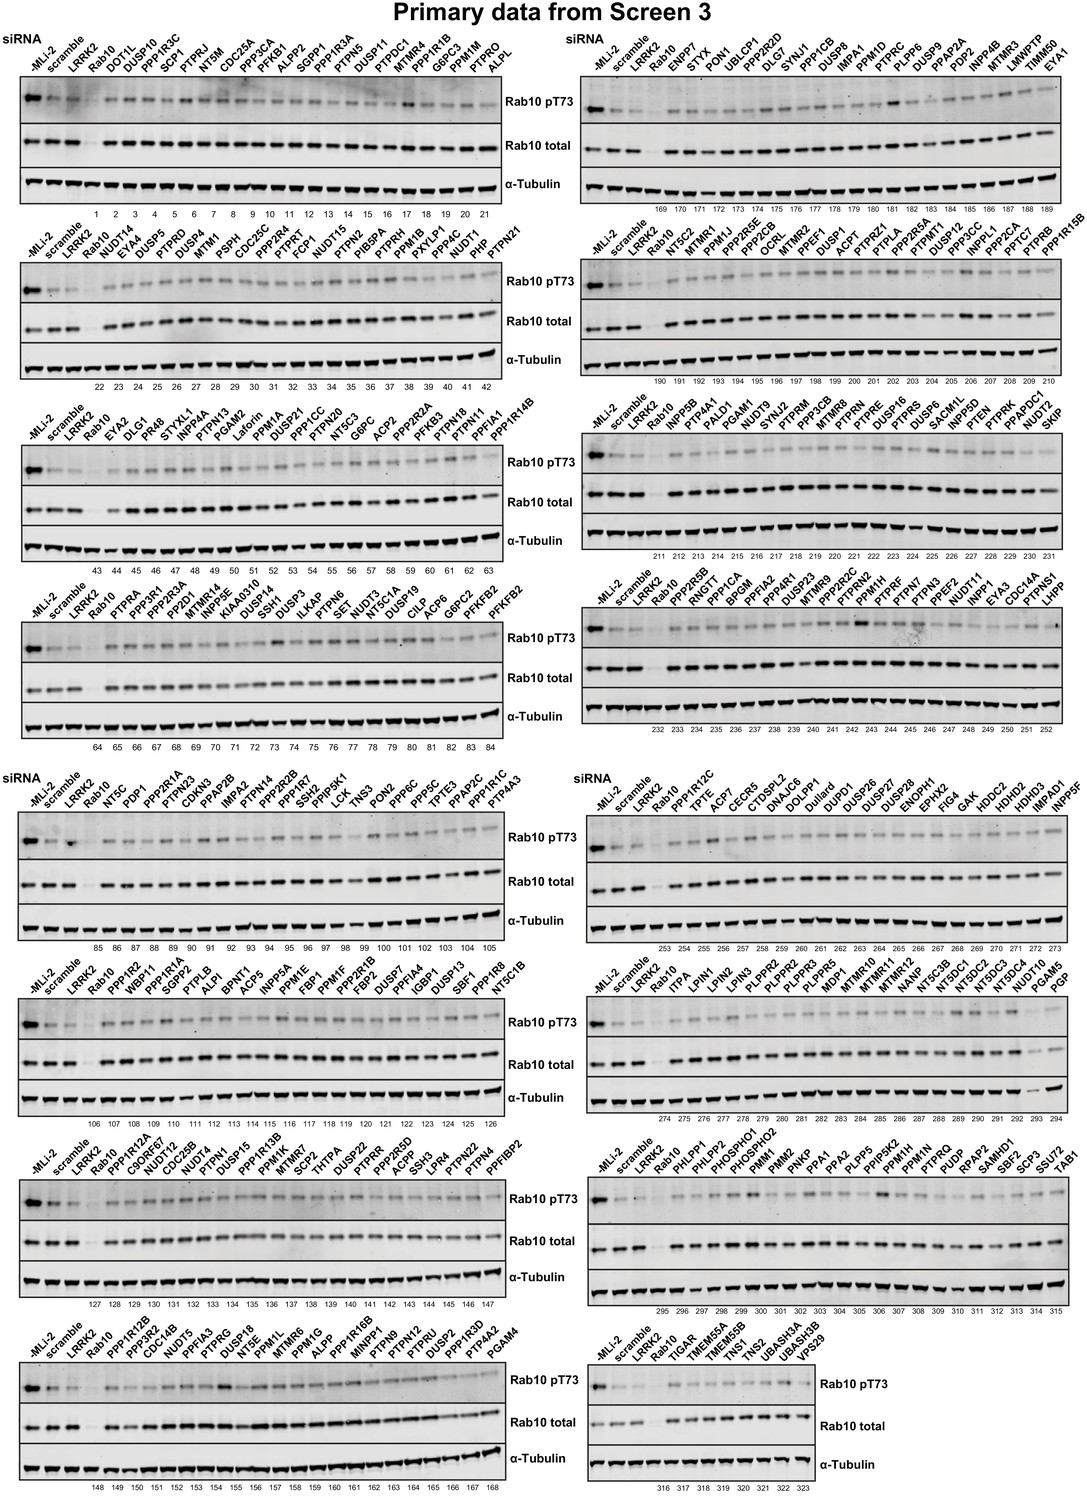
Primary data from siRNA Screen 3 Human A549 cells were transfected with the indicated siRNA pools (Dharmacon) for 72 hr.
Cells were treated for 5 min with 100 nM MLi-2, lysed and immunoblotted for the indicated antibodies and immunoblots developed using the LI-COR Odyssey CLx Western Blot imaging system. The numbering system corresponds to that employed in Supplementary file 1. The intensities were quantified and are presented as pRab10/Total Rab10 ratio relative to scrambled siRNA control without MLi-2 treatment in Supplementary file 1.
Figure 3 with 2 supplements
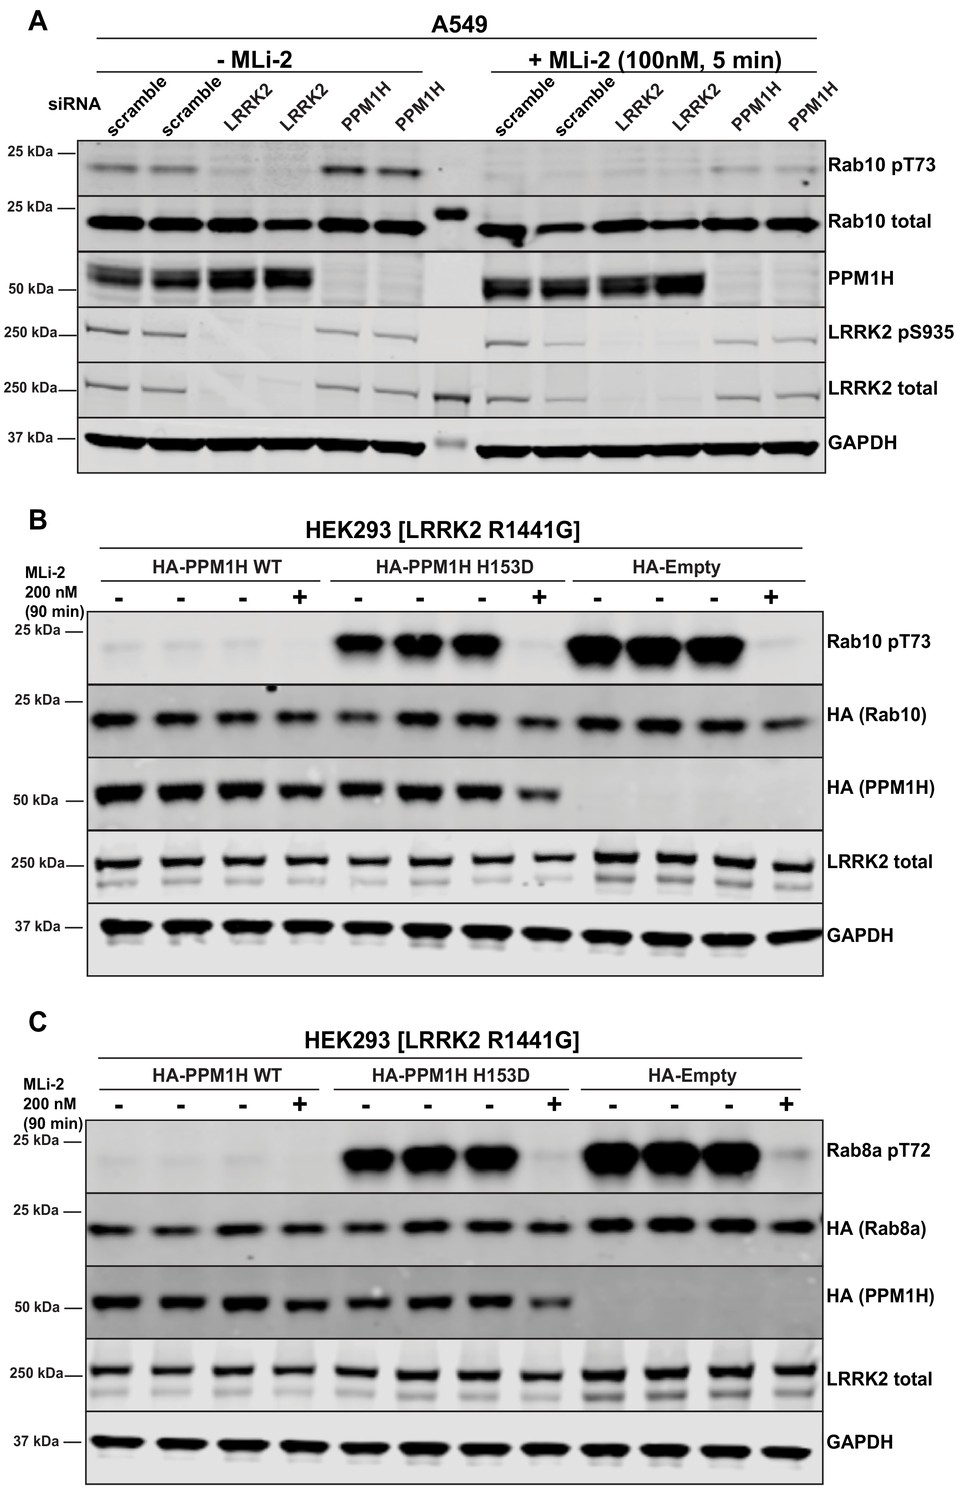
Further analysis of siRNA screen phosphatase hits.
(A) Human A549 cells were transfected with the indicated siRNA pools (Dharmacon) for 72 hr. Cells were treated as indicated ±100 nM MLi-2 for 5 min prior to lysis and 10 µg of whole cell extract subjected to quantitative LI-COR immunoblot analysis with the indicated antibodies (all at 1 µg/ml). Each lane represents cell extract obtained from a different dish of cells (two replicates per condition). (B and C) HEK293 cells were transiently transfected with constructs expressing the indicated components. 24 hr post-transfection, cells were treated with ±200 nM MLi-2 for 90 min and then lysed. 10 µg whole cell lysate was subjected to immunoblot analysis with the indicated antibodies at 1 µg/mL concentration and membranes analyzed as in (A). Each lane represents cell extract obtained from a different dish of cells (three replicates per condition without MLi-2 treatment, one replicate per condition with MLi-2 treatment).
Figure 3—figure supplement 1

PPM1H dephosphorylates multiple LRRK2 phosphorylated Rab proteins.
(A–H) HEK293 cells were transiently transfected with constructs expressing the indicated components. 24 hr post-transfection, cells were treated ±200 nM MLi-2 for 90 min and then lysed. 10 µg whole cell lysate was subjected to LI-COR immunoblot analysis with the indicated antibodies at 1 µg/mL concentration. Each lane represents cell extract obtained from a different dish of cells.
Figure 3—figure supplement 2
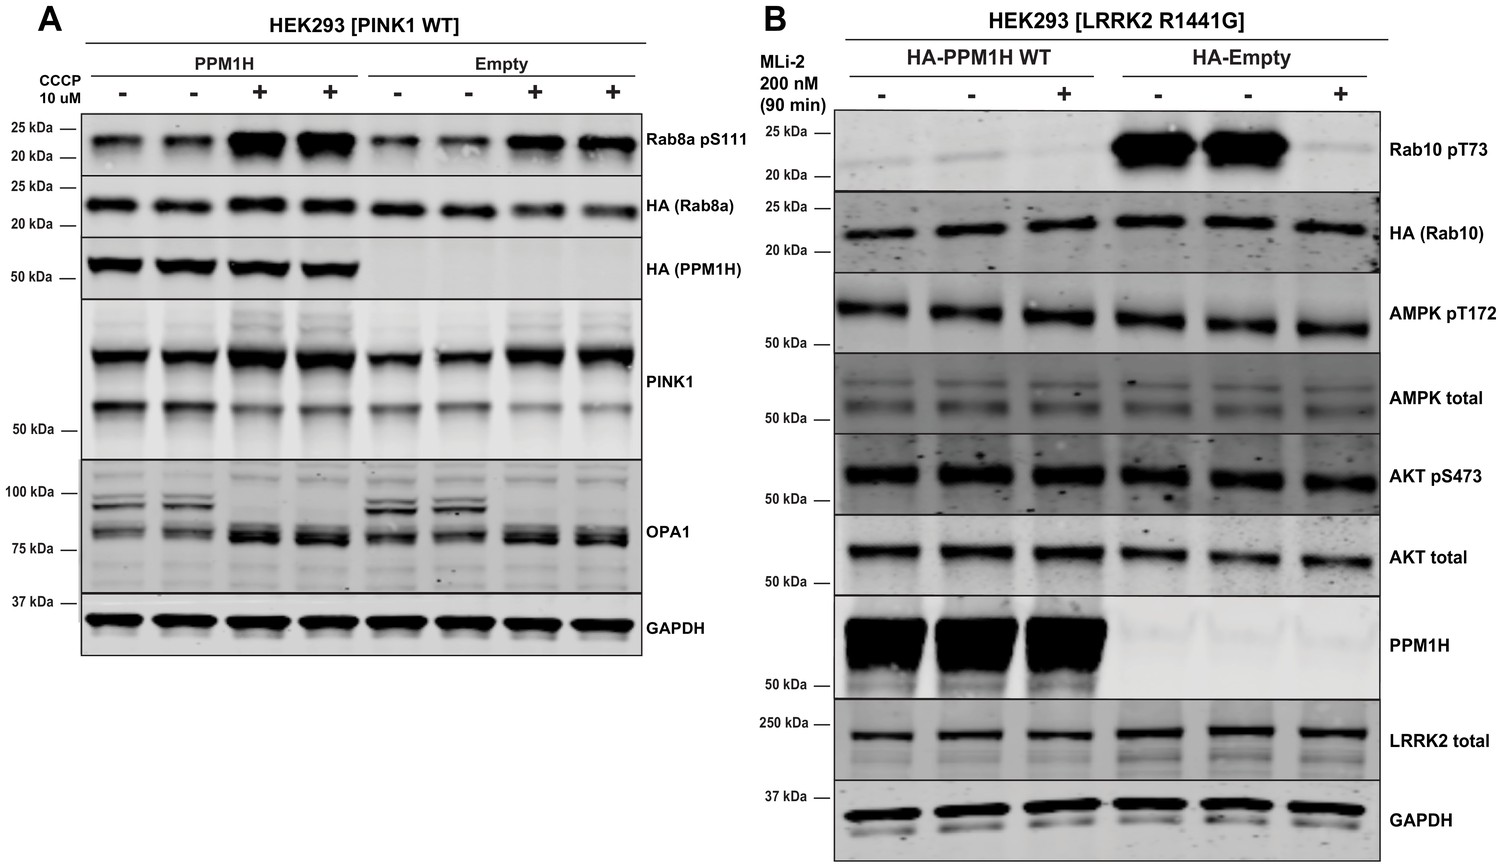
PPM1H does not dephosphorylate Ser111 of Rab8A or key phosphorylation sites of AMPK and Akt signaling pathways.
(A) HEK293 cells were transiently transfected with constructs expressing the indicated components. 24 hr post-transfection, cells were treated ±10 µM CCCP (Carbonyl cyanide m-chlorophenyl hydrazine) for 3 hr to induce activation of the PINK1 kinase and trigger Rab8A phosphorylation at Ser111 (Lai et al., 2015). (B) As in (A) except cells were immunoblotted with the indicated antibodies that recognize key phosphorylation sites of AMPK and Akt signaling pathways.
Figure 4
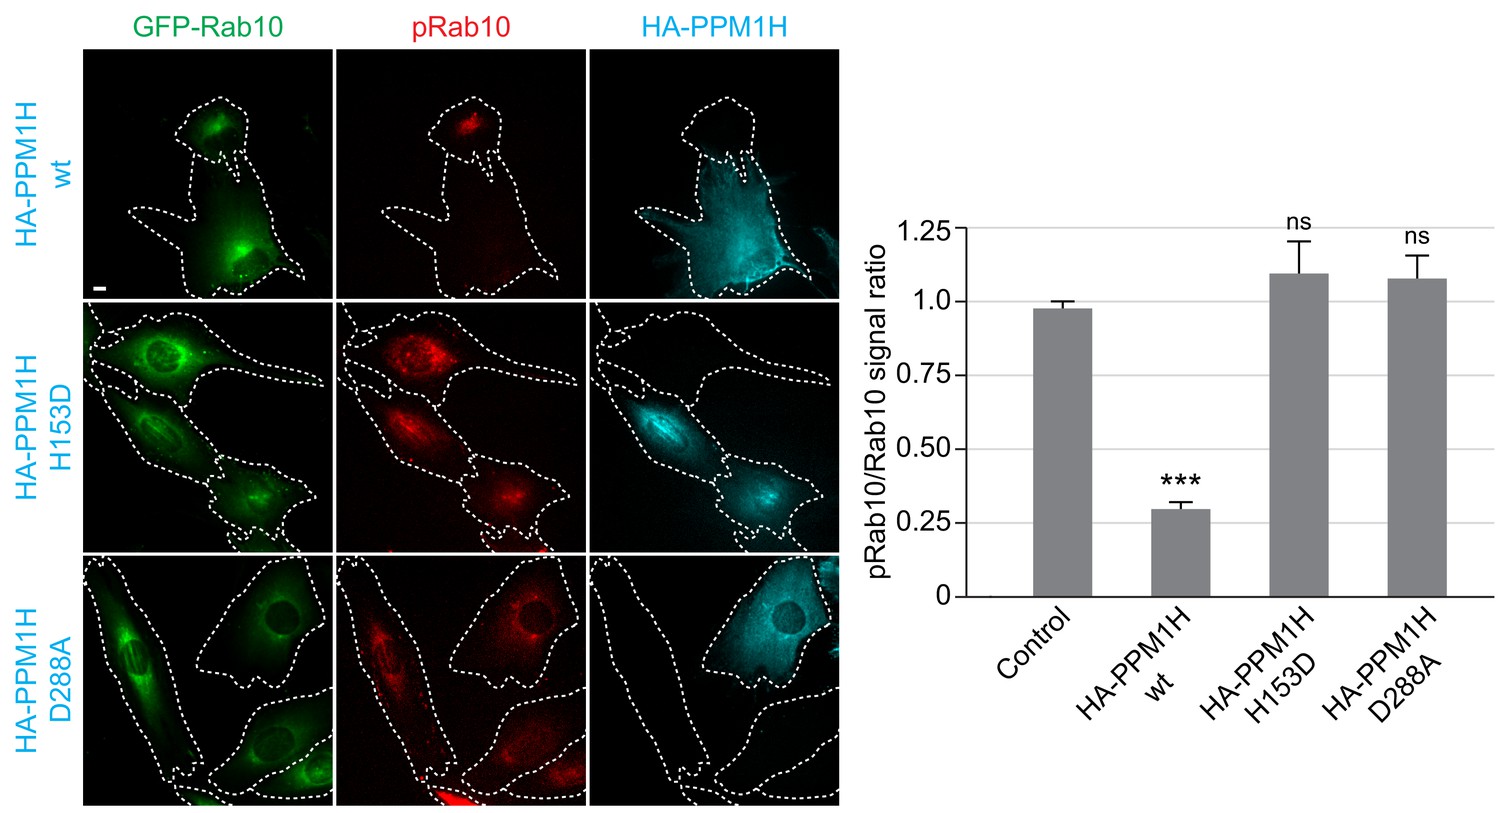
HA-PPM1H expression decreases phospho-Rab10 levels in MEF cells.
Wild-type MEF cells stably expressing GFP-Rab10 (green) were transiently transfected with plasmids encoding HA-PPM1H wild-type, HA-PPM1H H153D, or HA-PPM1H D288A as indicated at left. After 24 hr the cells were subsequently fixed and stained with mouse anti-HA antibody (shown in blue) and rabbit anti-phospho-Rab10 antibody (shown in red). Scale bar, 10 µm. Data were quantified by determining the ratio of phospho-Rab10 to GFP-Rab10 signal and normalizing these values to the ratio in cells not expressing PPM1H. For each condition, at least 20 cells were analyzed. ***, p<0.001.
Figure 5 with 1 supplement
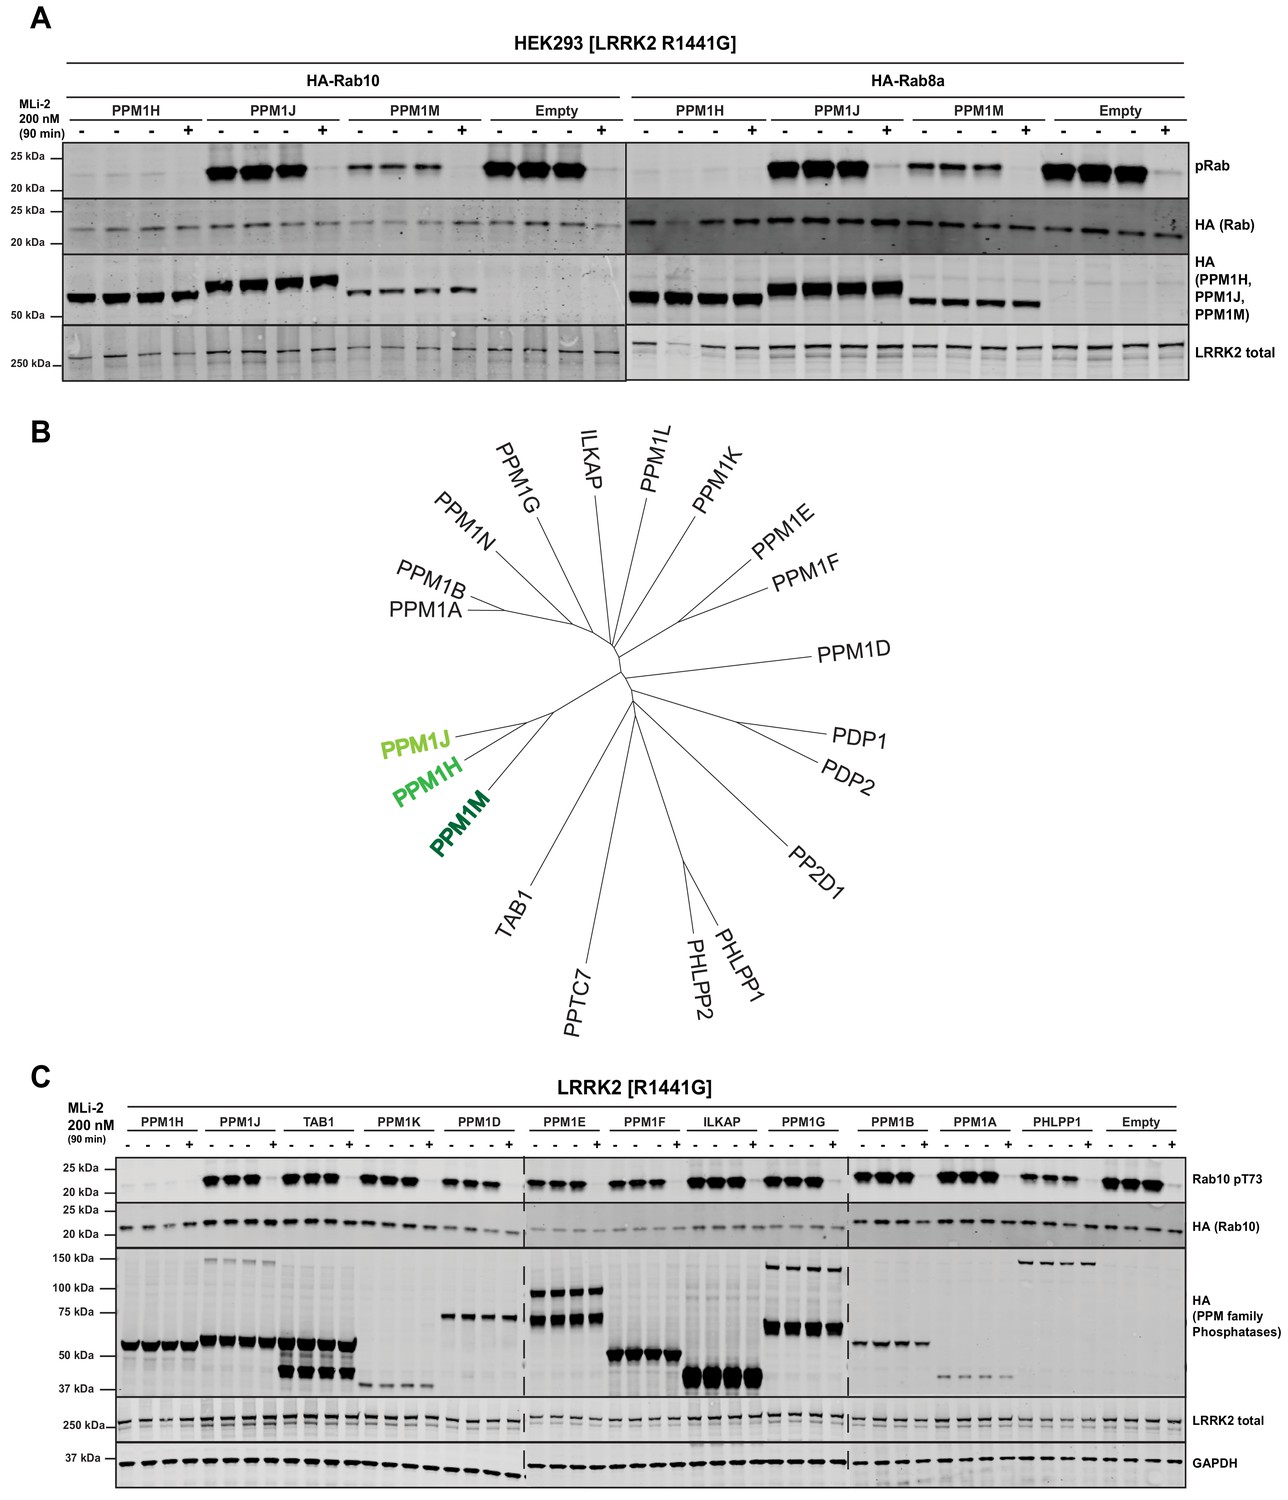
PPM1M, but not other PPM family members tested dephosphorylate Rab10.
(A) HEK293 cells were transiently transfected with the indicated constructs including wild-type PPM1H subfamily phosphatases (PPM1H, PPM1M and PPM1J). 24 hr post-transfection, cells were treated with ±200 nM MLi-2 for 90 min and then lysed. 10 µg whole cell lysate was subjected to immunoblot analysis with the indicated antibodies at 1 µg/mL concentration and membranes analyzed using the OdysseyClx Western Blot imaging system. Each lane represents cell extract obtained from a different dish of cells (three replicates per condition without MLi-2 treatment, one replicate per condition with MLi-2 treatment). (B) Phylogenetic tree of the 20 PPM family members generated using the MEGA7 software (Kumar et al., 2016). (C) As In (A) except that HEK293 cells were transiently transfected with constructs expressing the indicated PPM family members.
Figure 5—figure supplement 1

HEK293 cells were transiently transfected with the indicated constructs.
24 hr post-transfection, cells were treated with ±200 nM MLi-2 for 90 min and then lysed. 10 µg of whole cell lysate were subjected to immunoblot analysis with the indicated antibodies at 1 µg/mL concentration and membranes analyzed using OdysseyClx Western Blot imaging system. Each lane represents cell extract obtained from a different dish of cells.
Figure 6
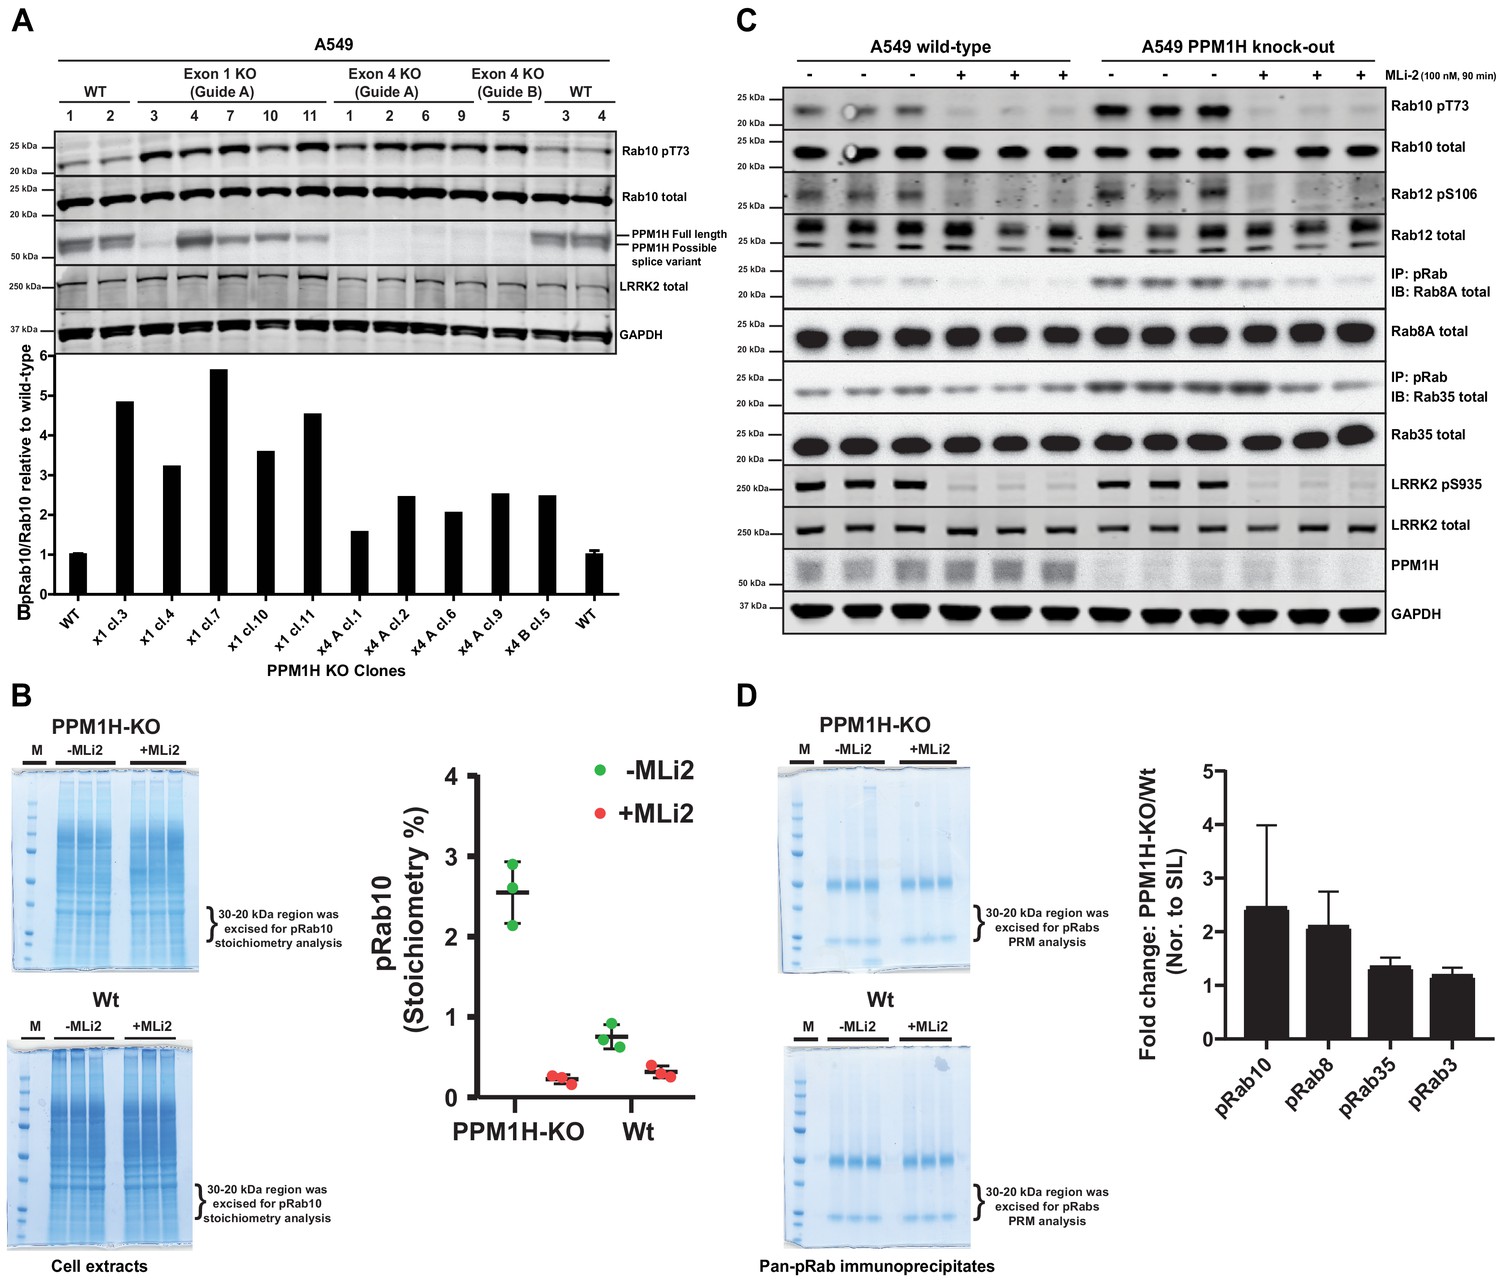
CRISPR knock-out of full length PPM1H isoform enhances Rab protein phosphorylation.
(A) Four independent wild-type (WT 1, WT 2, WT 3, WT 4) and ten independent CRISPR/Cas9 PPM1H knock-out A549 cells (using three different sets of guide RNAs) that had all been through in parallel, single-cell sorting and expansion procedures were analyzed. 20 µg whole cell lysate was subjected to immunoblot analysis with the indicated antibodies at 1 µg/mL concentration and membranes analyzed using the OdysseyClx Western Blot imaging system. The ratio of phospho-Thr73 Rab10/total Rab10 was quantified using Image Studio software and data presented relative to the phosphorylation ratio observed in wild-type cells. (B) 50 μg of cell lysate from three wild-type and three PPM1H knock-out clones, treated ±MLi-2 (100 nM, 90 min) was resolved on a 4–12% Bis-Tris gradient gel. Following colloidal Coomassie staining, the lane encompassing 30 to 20 kDa region was excised and subjected to in-gel digestion using trypsin. The digest was spiked with an equimolar ratio of 10 fmol heavy synthetic phosphorylated Rab10 Thr73 (FHpTITTSYYR) and non-phosphorylated Rab10 Thr73 (FHTITTSYYR) peptides and analyzed on a QE-HFX mass spectrometer in PRM mode. The raw data were processed using Skyline software suite and the light/heavy ratios for both phosphorylated and non-phosphorylated Thr73 peptides were used in determining the pRab10 (FHpTITTSYYR) stoichiometry. The stoichiometry of pRab10 for each sample is indicated and error bars represent the mean with SD (n = 3 in each condition). (C) Immunoprecipitation using the pan-phospho-specific pRab8 antibody was performed using 2 mg cell lysate from three wild-type and three PPM1H knock-out clones, treated - ± MLi-2 (100 nM, 90 min). Immunoprecipitates were analyzed by immunoblotting with indicated antibodies. Rab10 pT73 and Rab12 pS106 phosphorylation was assessed in whole cell lysates. (D) The pRab8 antibody immunoprecipitates from PPM1H-knock-out±MLi2 and wild-type ±MLi2 was resolved on a 4–12% Bis-Tris gradient gel. Following colloidal Coomassie staining, the lane encompassing the 30 to 20 kDa region was excised and subjected to In-gel digestion using trypsin and spiked with an equimolar ratio of 50 fmol heavy synthetic pRab10, pRab8, pRab3, pRab35, pRab1 and pRab43 phosphopeptides along with 25 fmol of ‘Pierce Peptide Retention Time Calibration Mixture’ peptides. Sample were analyzed on QE-HFX mass spectrometer using PRM mode. The raw data were processed using Skyline software suite and the light/heavy ratios of phosphorylated Rab proteins were determined; the fold change between wild-type and knock-out cells is plotted with error bars representing the mean ± SD (n = 3 in each condition). The raw data is included in Supplementary file 2.
Figure 7
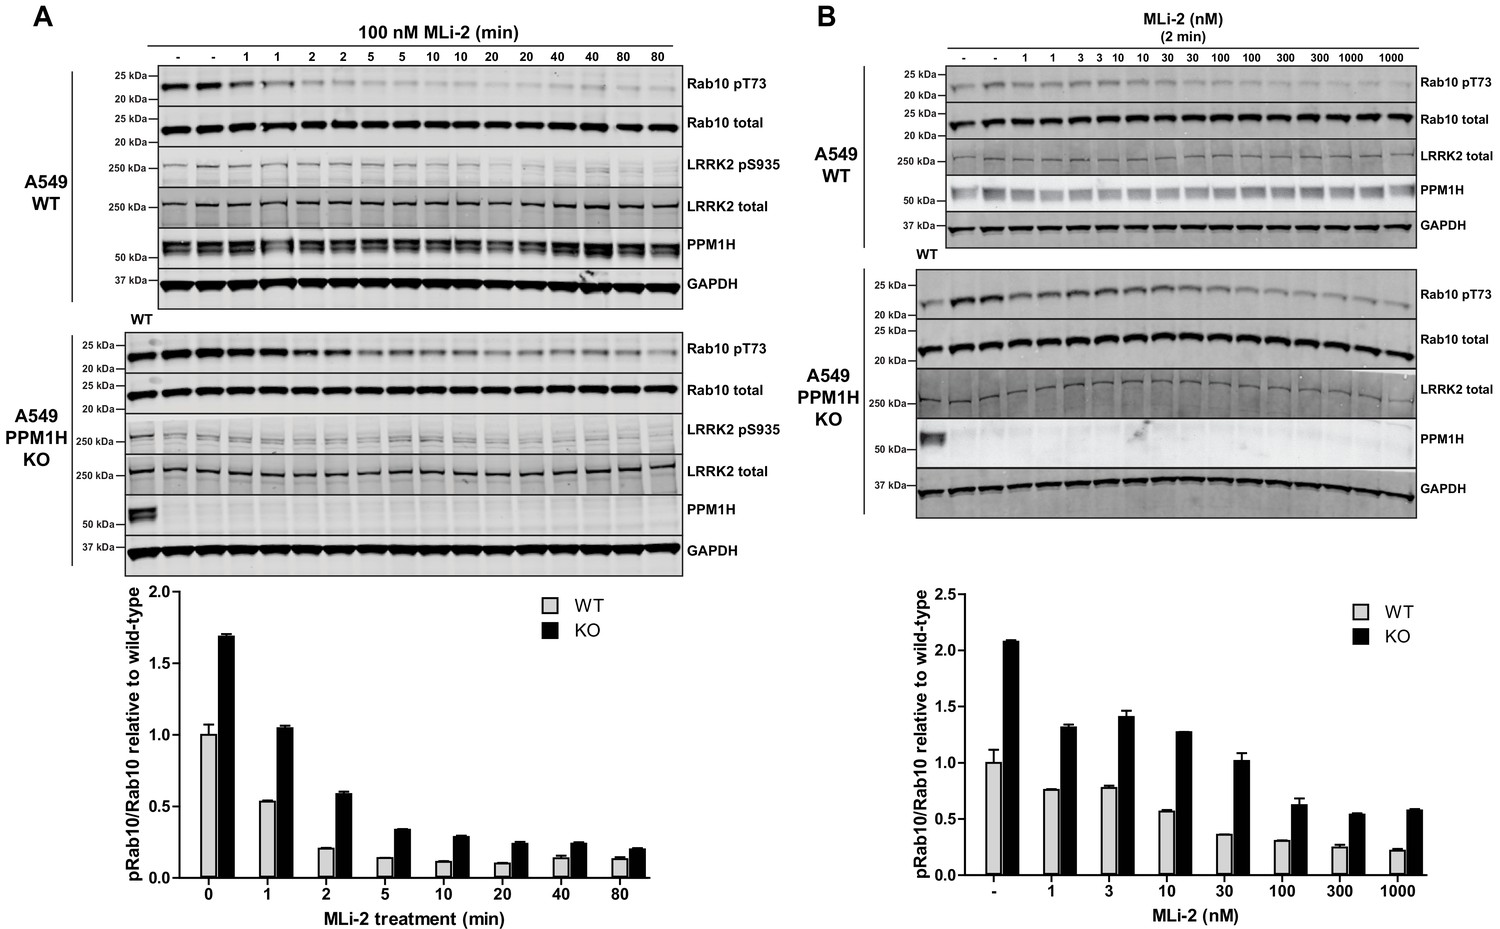
MLi-2 inhibitor time-course and dose-response in wild-type and PPM1H knock-out A549 cells.
(A) Wild-type and PPM1H knock-out A549 cells were treated ±100 nM MLi-2 inhibitor for the indicated times prior to cell lysis. 20 µg whole cell lysate was subjected to immunoblot analysis with the indicated antibodies at 1 µg/mL concentration and membranes analyzed using the OdysseyClx Western Blot imaging system. The ratio of phospho-Thr73 Rab10/total Rab10 was quantified using Image Studio software and data presented relative to the phosphorylation ratio observed in wild-type cells. Each lane represents cell extract obtained from a different dish of cells (two replicates per time-point). (B) Wild-type and PPM1H knock-out A549 cells were treated with indicated concentrations of MLi-2 inhibitor for 2 min. Rab10 phosphorylation was assessed and quantified as in (A).
Figure 8 with 6 supplements
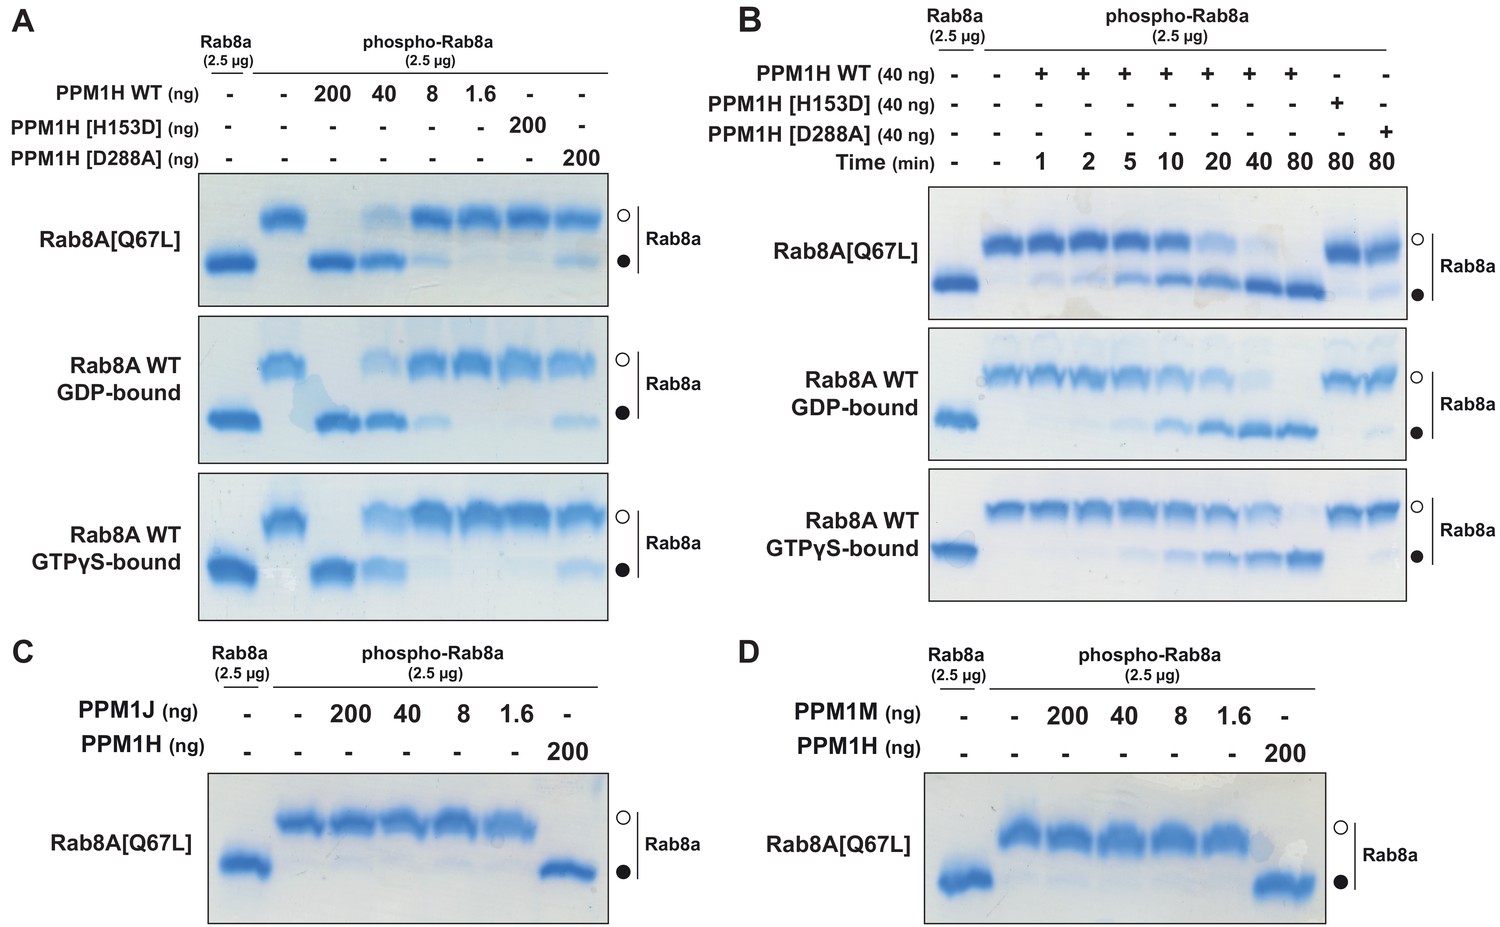
PPM1H dephosphorylates Rab8A in vitro.
(A) The indicated amounts of recombinant wild-type and mutant PPM1H (with a His-Sumo N-terminal tag, expressed in E. coli) were incubated in vitro with 2.5 µg pT72 phosphorylated Rab8A[1–181, Q67L-GTP bound conformation], 2.5 µg of Rab8A[1–181 wild-type, GDP-bound] or 2.5 µg of Rab8A[1–181 wild-type, GTP-bound] for 30 min in the presence of 10 mM MgCl2 in 40 mM HEPES pH 7.0 buffer. Reactions were terminated by addition of SDS Sample Buffer and analyzed by Phos-tag gel electrophoresis that separates phosphorylated and dephosphorylated Rab8A. The gel was stained with Instant Blue Coomassie. Bands corresponding to phosphorylated and non-phosphorylated Rab10 are marked with open (○) and closed (●) circles, respectively. (B) As in (A) except that a time-course assay was performed using 2.5 µg pT72 phosphorylated Rab8A[1–181, Q67L-GTP bound conformation], 2.5 µg of Rab8A[1–181 wild-type, GDP-bound] or 2.5 µg of Rab8A[1–181 wild-type, GTP-bound] and 40 ng wild-type or mutant PPM1H for the indicated times. (C) As in (A) except that PPM1J was assessed. (D) As in (A) except and PPM1M was assessed.
Figure 8—figure supplement 1
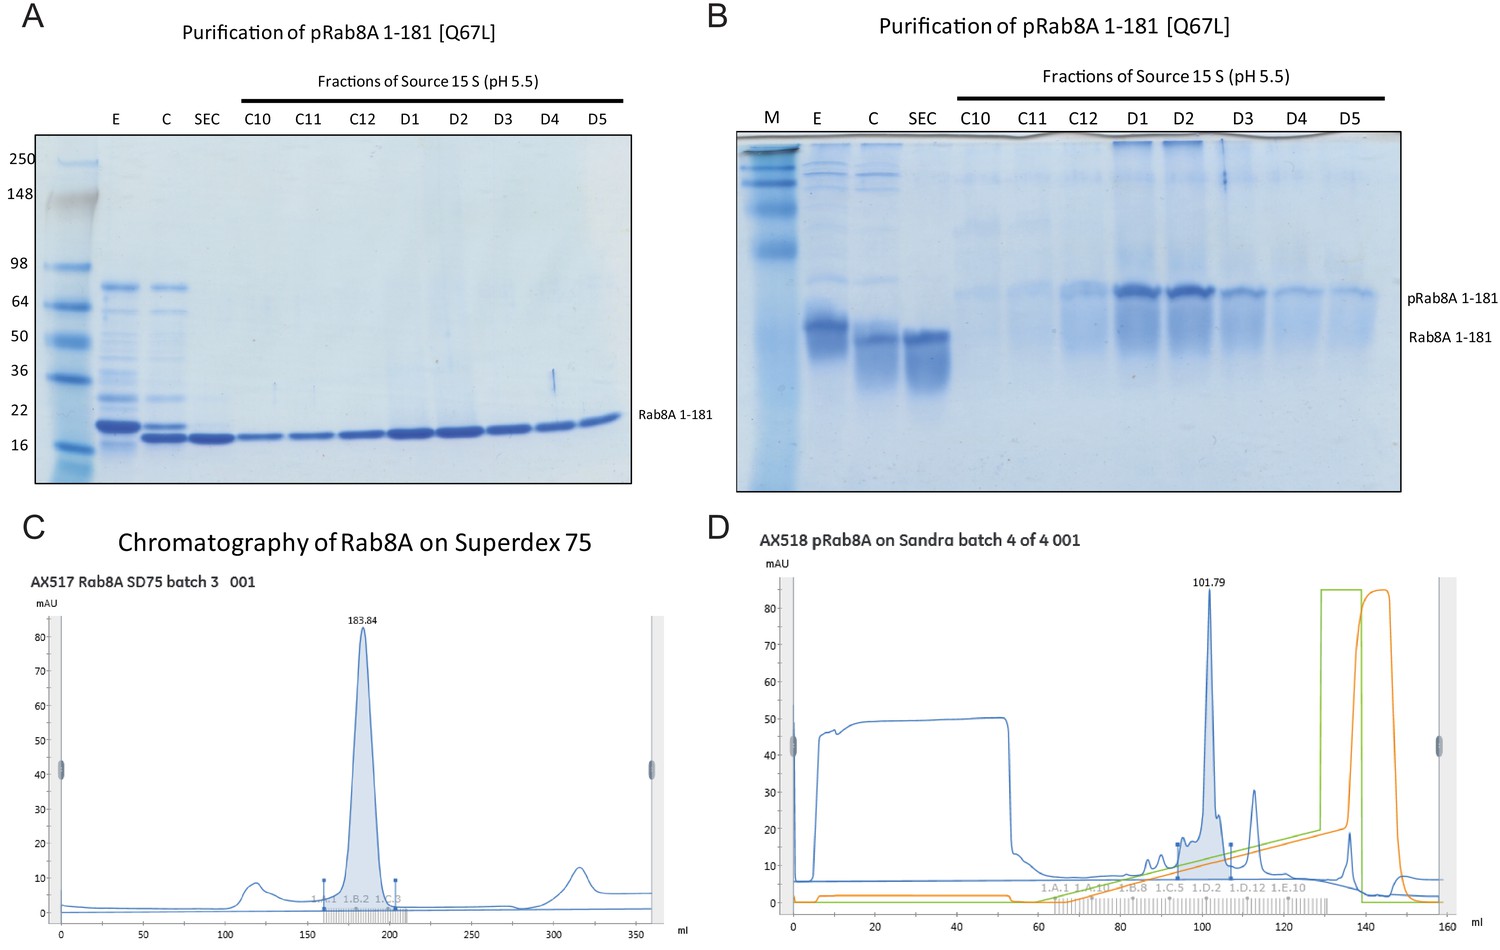
Purification and characterization of Thr72 phosphorylated Rab8A[1–181, Q67L].
(A) Coomassie stained 4–20% gradient SDS polyacrylamide gel electrophoresis analysis of the purification of pRab8A 1–181 [Q67L]. Lane M = See Blue Plus Marker (Invitrogen); Lane E = His-Rab8A eluted from Ni-agarose. Lane C = Rab8A cleaved with Thrombin, dialyzed and depleted on Ni-agarose; Lane SEC = monomeric Rab8A after size exclusion chromatography; C10 – D5 = fractions of a 10 ml Source S column containing phospho-Rab8A 1–181 [[Q67L]. (B) Coomassie stained 12% Phos-tag SDS polyacrylamide gel electrophoresis analysis of the purification of pRab8A 1–181 [Q67L]. Lane M = See Blue Plus Marker (Invitrogen); Lane E = His-Rab8A eluted from Ni-agarose. Lane C = Rab8A cleaved with Thrombin, dialyzed and depleted on Ni-agarose; Lane SEC = monomeric Rab8A after size exclusion chromatography; C10 – D5 = fractions of a 10 ml Source S column containing phospho-Rab8A 1–181 [[Q67L]. (C) Chromatogram (UV280 nm) of Rab8A 1–181, separated on a Superdex 75 XK 26/60 column. Equipment: Äkta Pure. Evaluation Software: Unicorn 7.1. Monomeric Rab8A eluted at 183.84 ± 10 ml. (D) Chromatogram (UV280nm) of Rab8A 1–181, separated on a Source 15 S HR10/10 column. Equipment: Äkta Pure. Evaluation Software: Unicorn 7.1. Phosphorylated Rab8A eluted at 101.79 ± 10 ml.
Figure 8—figure supplement 2

Mass spectrometry characterization of Thr72 phosphorylated Rab8A[1–181, Q67L].
(A) 2 µg of Rab8A 1-181 [Q67L] and pRab8A 1-181 [Q67L] in technical triplicates was loaded on a 4-12% Bis-Tris gradient gel. Following colloidal Coomassie staining, the lane encompassing the 21 kDa region was excised and subjected to In-gel digestion using trypsin and analyzed on a QE – HFX mass spectrometer. (B) and (C). The mass spectrometry raw data from Rab8A [1-181, Q67L] and pRab8A 1-181 [Q67L] samples were searched using MaxQuant pipeline. The phosphopeptide FRpTITTAYR, unmodified peptide TITAYR intensities and pRab8A 1-181 [Q67L] and Rab8A 1-181 [Q67L] protein LFQ intensities as shown in table (C) were used to determine the FRpTITTAYR phosphorylation stoichiometry. To enable accurate phosphosite stoichiometry to be calculated both the modified and unmodified Thr72 peptides were excluded in determining the protein LFQ intensities. The phosphorylation stoichiometry in pRab8A 1-181 [Q67L] was found to be ~94% and for Rab8A 1-181 [Q67L] was found to be <0.07% which is shown as separated scatter plot (B); the error bars represent the mean with 95% CI. (D) Representative annotated MS/MS spectrum of a Thr72, FRpTITTAYR (m/z 457.88587; Z=3) identified in pRab8A 1-181[Q67L]. The m/z 485.19, z=1 of a b3 ion indicated with dotted lines confirms the phosphosite localization of the phosphopeptide FRpTITTAYR. (E) Representative annotated MS/MS spectrum of an unmodified peptide, TITAYR (m/z 494.75793; z=2) identified in Rab8A 1-181 [Q67L].
Figure 8—figure supplement 3
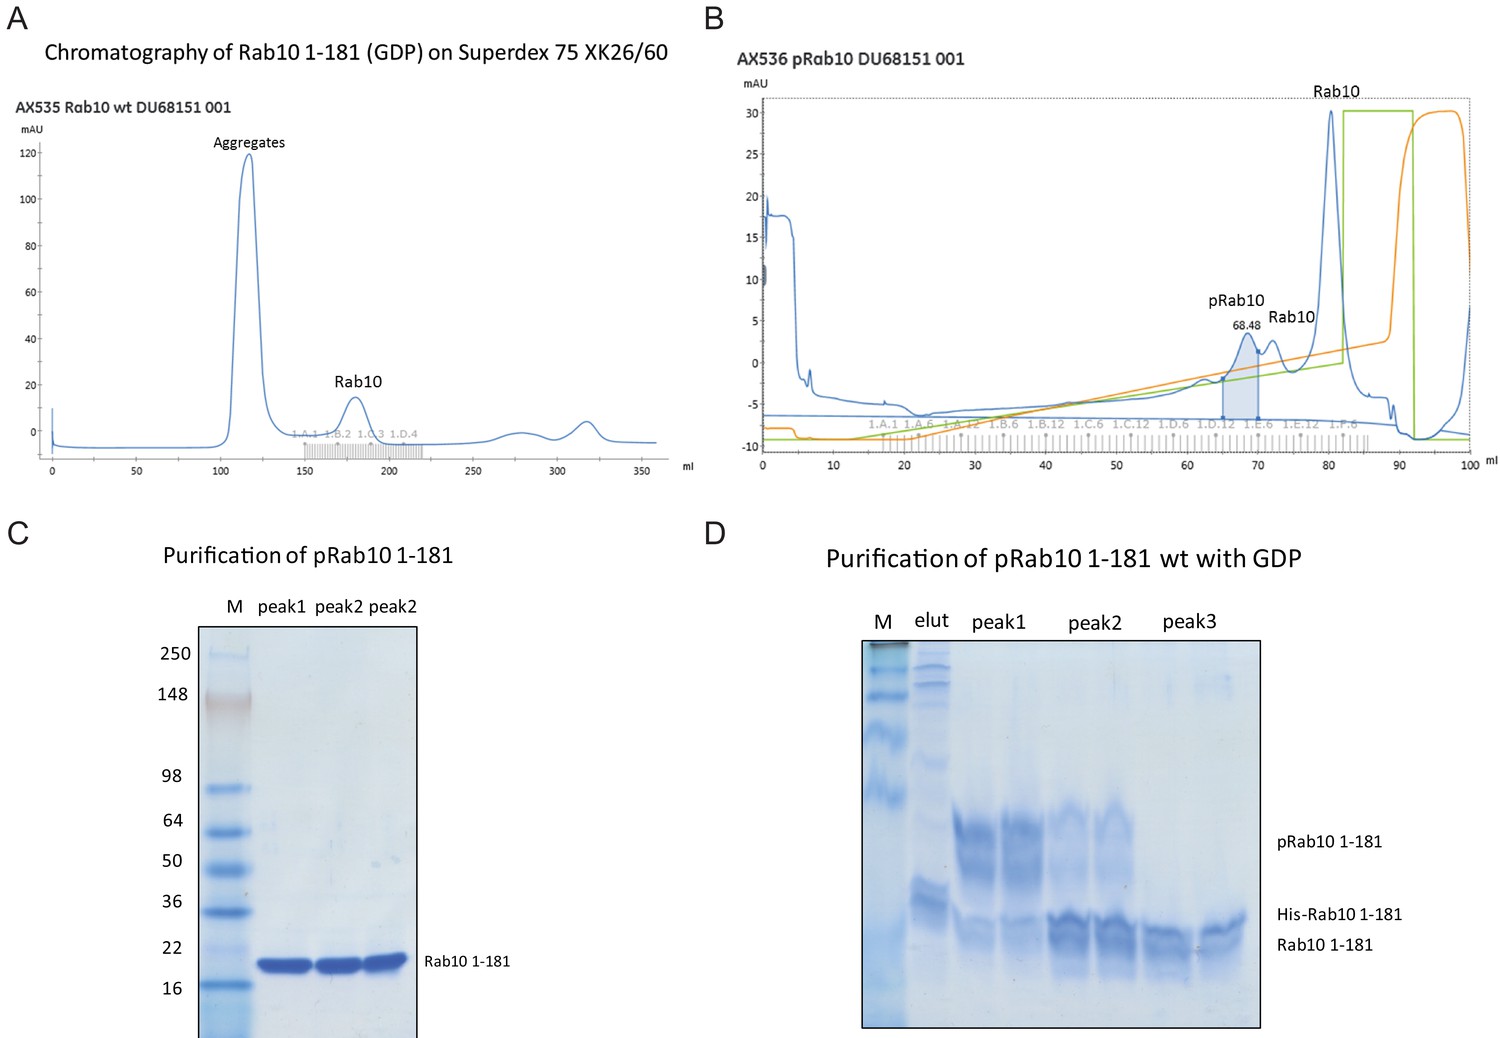
Purification and characterization of Thr73 phosphorylated Rab10[1-181].
(A) Chromatogram (UV280nm) of Rab10 1-181, separated on a Superdex 75 XK 26/60 column to obtain monomeric protein. Equipment: Äkta Pure. Evaluation Software: Unicorn 7.1. Monomeric Rab10 eluted at 180.03 ± 10 ml. (B) Chromatogram (UV280nm) of phosphorylated Rab10 1-181 (wild-type, wt with GDP), separated on a Source 15 S HR10/10 column. Equipment: Äkta Pure. Evaluation Software: Unicorn 7.1. Phospho-Rab10 eluted at 68.48 ± 2 ml. (C) Coomassie stained 4-20% gradient SDS polyacrylamide gel electrophoresis analysis of the purification of phospho-Rab10 1-181 (wt in GDP). Lane M = See-Blue Plus Marker (Invitrogen); peak1 = first peak from a 10 ml Source S column containing phospho-Rab10 1-181. Peak2 = second peak from a 10 ml Source S column containing Rab10. Peak3 = third peak, containing Rab10. (D) Coomassie stained 12% Phos-tag SDS polyacrylamide gel electrophoresis analysis of the purification of pRab10 1-181 (with GDP). Lane M = See-Blue Plus Marker (Invitrogen); Lane elut = His-Rab10 eluted from Ni-agarose; peak1 = first peak from a 10 ml Source S column containing phospho-Rab10 1-181. Peak2 = second peak from a 10 ml Source S column containing mostly Rab10. peak3 = third and major peak of the Source S column (unphosphorylated Rab10).
Figure 8—figure supplement 4
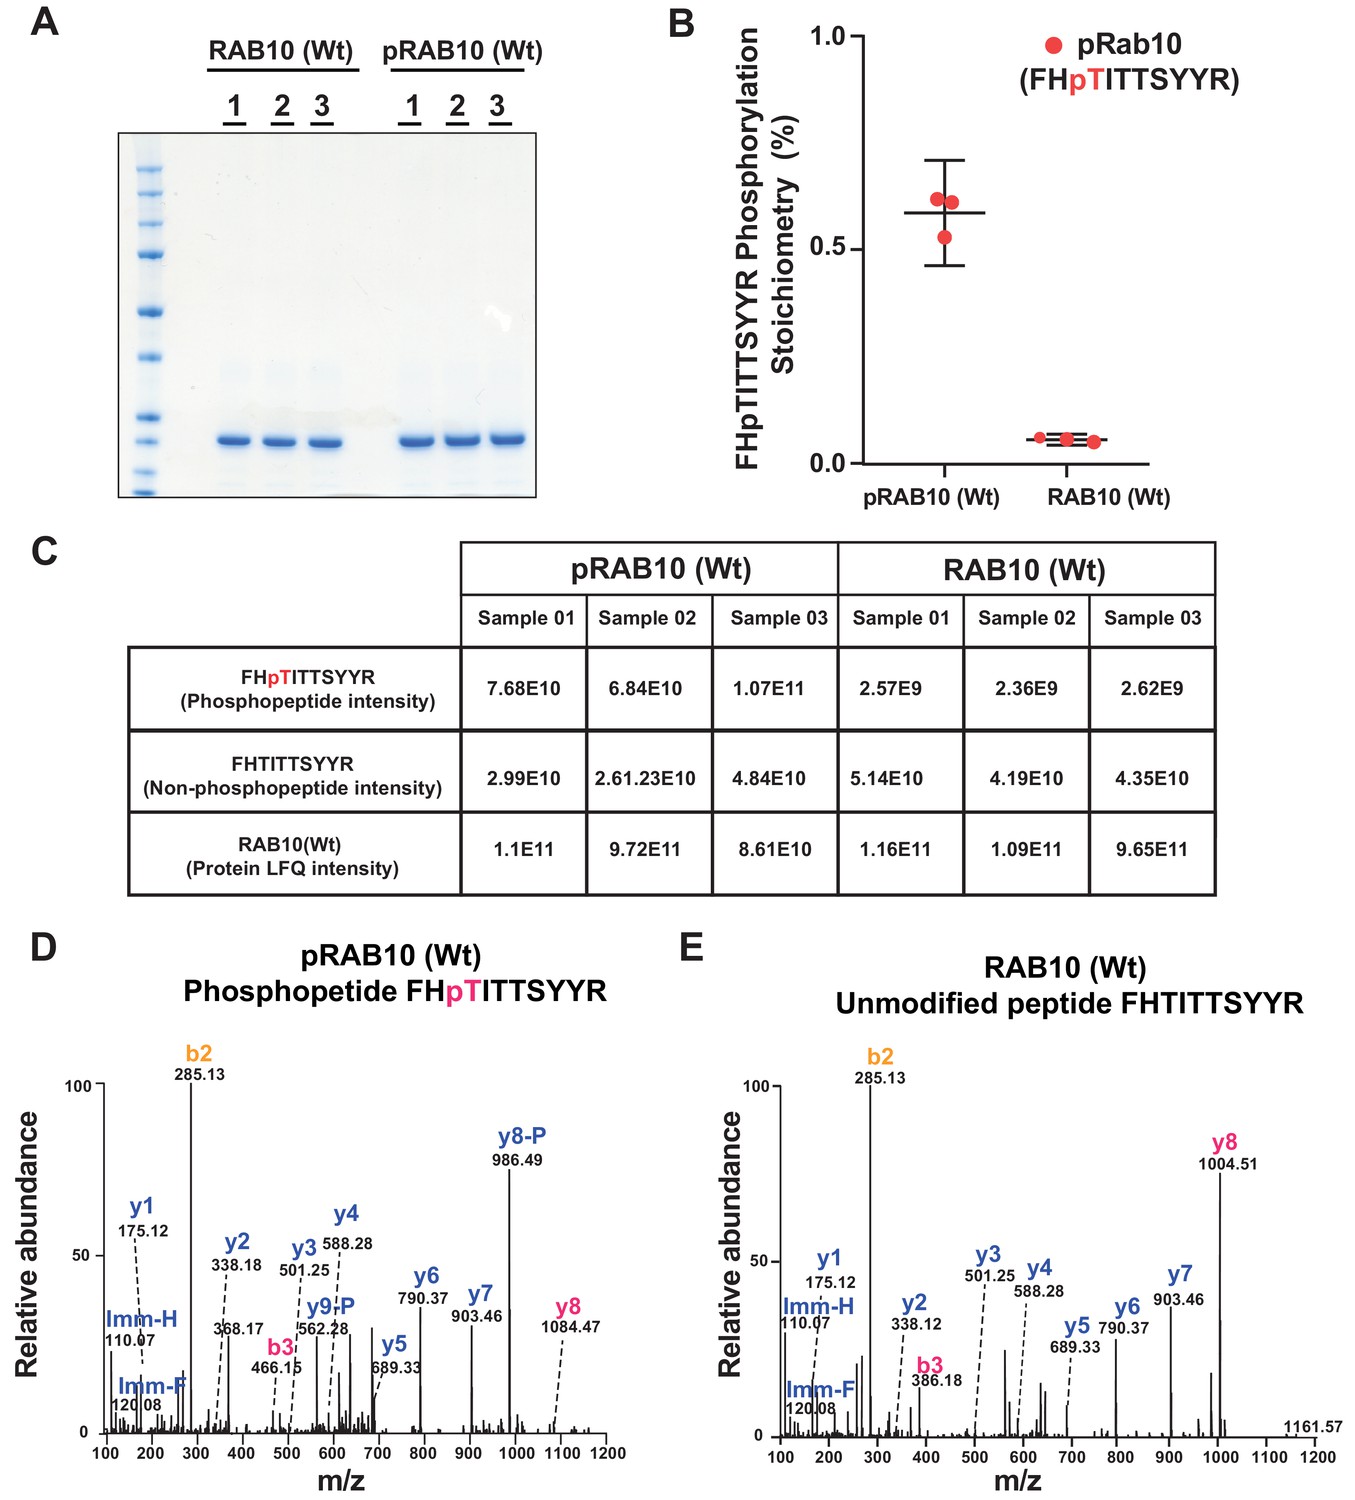
Mass spectrometry characterization of Thr73 phosphorylated Rab10[1–181, Wt].
(A) 2 µg of Rab10 [Wt] and pRab10 [Wt] in technical triplicates was loaded on a 4-12% Bis-Tris gradient gel. Following colloidal Coomassie staining, the lane encompassing 25 kDa region was excised and subjected to In-gel digestion using trypsin and analyzed on QE – HFX mass spectrometer. (B) and (C). The mass spectrometry raw data from Rab10 [Wt] and pRab10 [Wt] samples were searched using MaxQuant pipeline. The Phosphopeptide FHpTITTSYYR, unmodified peptide FHTITTSYYR intensities and Rab10 [Wt] and pRab10 [Wt] protein LFQ intensities as shown in table (C) were used to determine the FHpTITTSYYR, phosphorylation stoichiometry. To enable accurate phosphosite stoichiometry to be calculated both the modified and unmodified Thr73 peptides were excluded in determining the protein LFQ intensities. The phosphorylation stoichiometry in pRab10 [Wt] was found to be ~60% and in Rab10 [Wt] was found to be <5% which is shown as a separated scatter plot (B), the error bars represent the mean with 95% CI. (D) Representative annotated MS/MS spectrum of a Thr73, FHpTITTSYYR (m/z 684.80389; Z=2) identified in pRab10 [Wt]. The m/z 466.15, z=1 of a b3 ion and m/z 1084.47, z=1 of y8 ions indicated with dotted lines confirms the phosphosite localization of the Phosphopeptide FHpTITTSYYR. (E) Representative annotated MS/MS spectrum of an unmodified peptide, FHTITTSYYR (m/z 644.82023; z=2) identified in Rab10 [Wt].
Figure 8—figure supplement 5
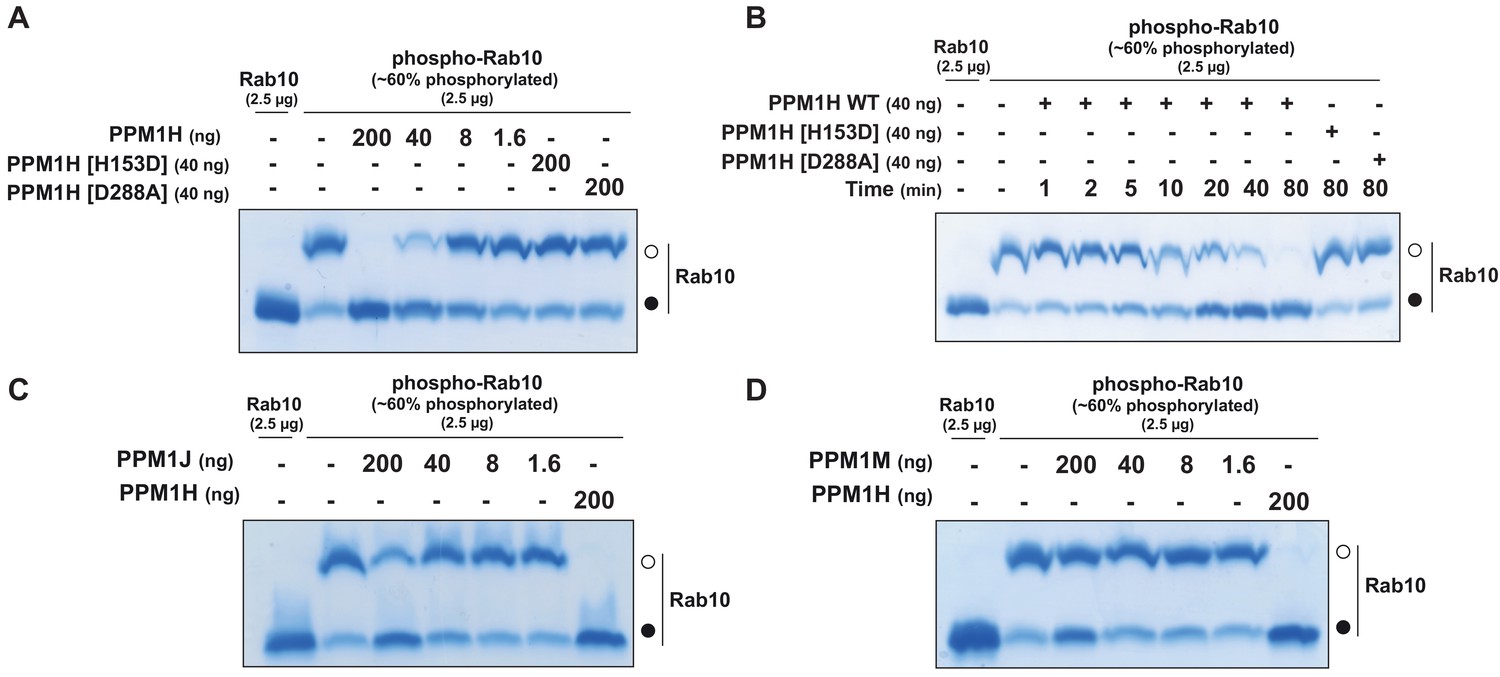
PPM1H dephosphorylates Rab10 in vitro.
(A) The indicated amounts of recombinant wild-type and mutant PPM1H (with a His-Sumo N-terminal tag, expressed in E. coli) were incubated in vitro with 2.5 µg pT73 ~60% phosphorylated Rab10[1–181, GDP bound] for 30 min in the presence of 10 mM MgCl2 in 40 mM HEPES pH 7.0 buffer. Reactions were terminated by addition of SDS Sample Buffer and analyzed by phos-tag gel electrophoresis that separates phosphorylated and dephosphorylated Rab10. Gel was stained with Instant Blue Coomassie. Bands corresponding to phosphorylated and non-phosphorylated Rab10 are marked with open (○) and closed (●) circles respectively. (B) As in (A) except that a time-course assay was performed using 2.5 µg pT73 phosphorylated Rab10[1–181, GDP bound] and 40 ng wild-type or mutant PPM1H for the indicated times. (C) As in (A) except that PPM1J was assessed. (D) As in (A) except and PPM1M was assessed.
Figure 8—figure supplement 6
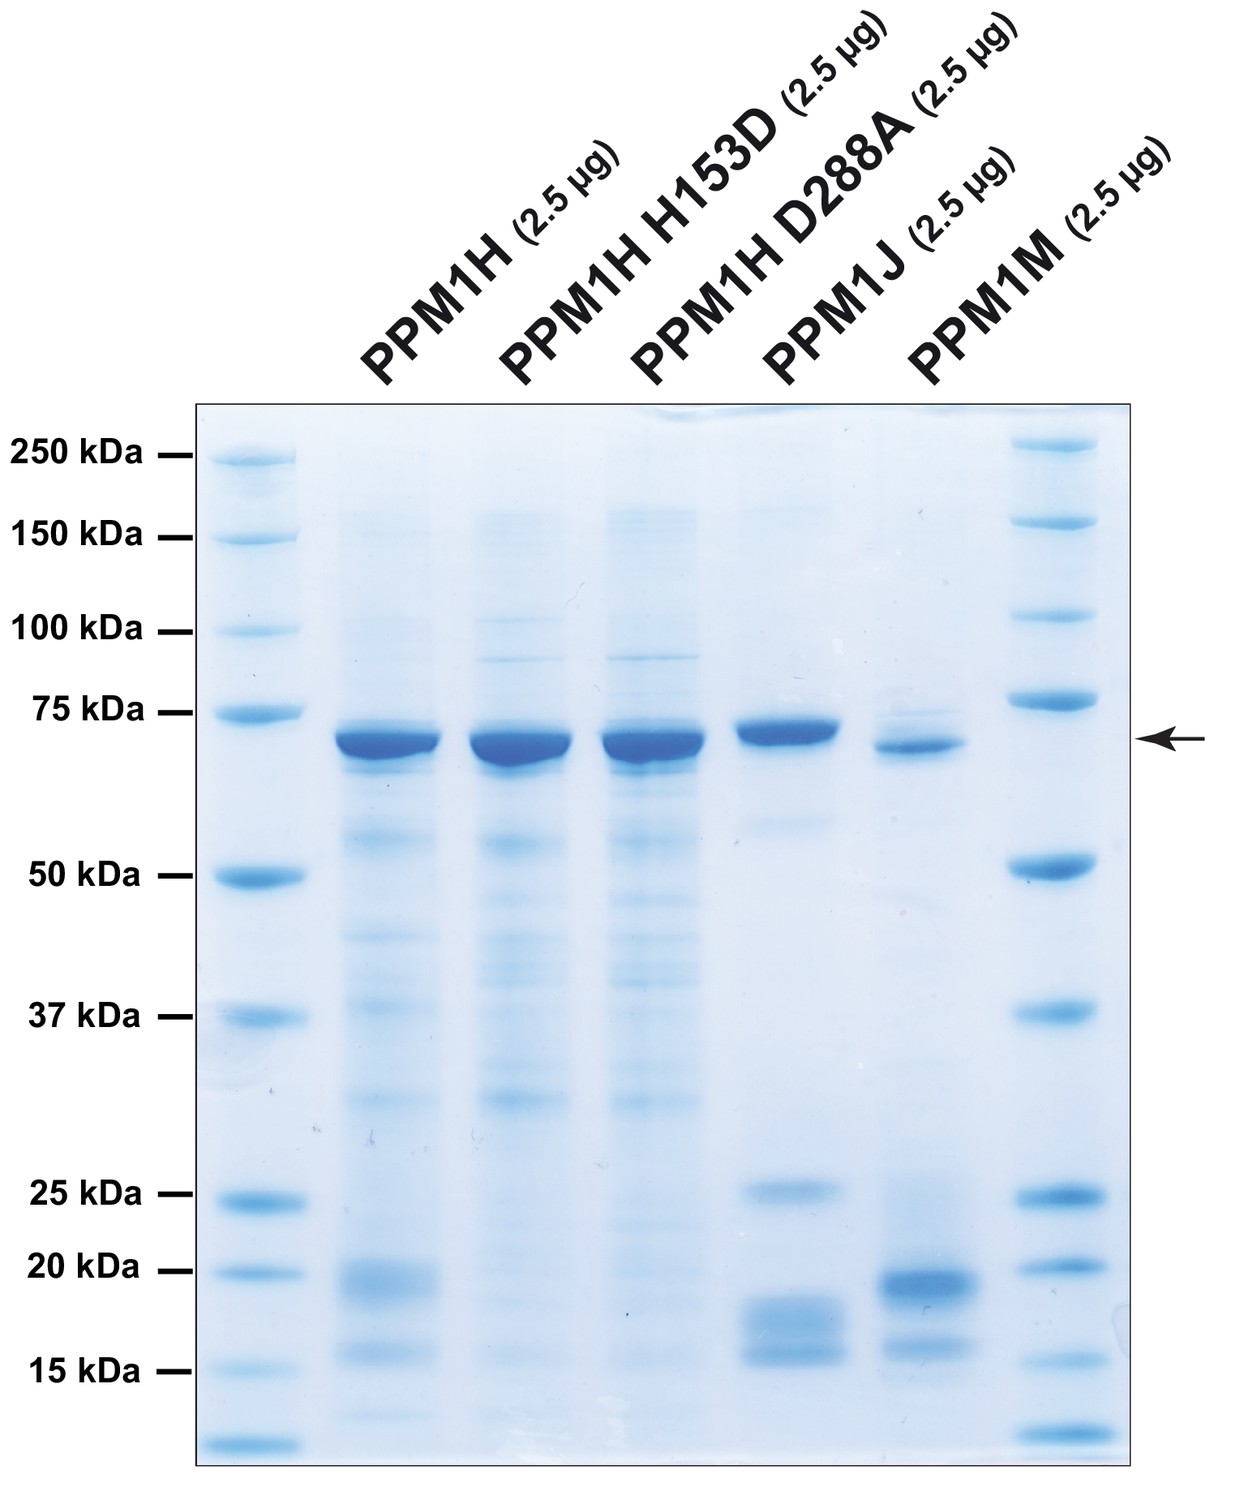
Coomassie stained 4-20% gradient SDS polyacrylamide gel electrophoresis analysis of 2.5 µg of purified recombinant phosphatases.
PPM1H, PPM1H H153D, PPM1H D288A, PPM1J and PPM1M (all with His-Sumo N-terminal tag, expressed in E. coli).
Figure 9 with 2 supplements
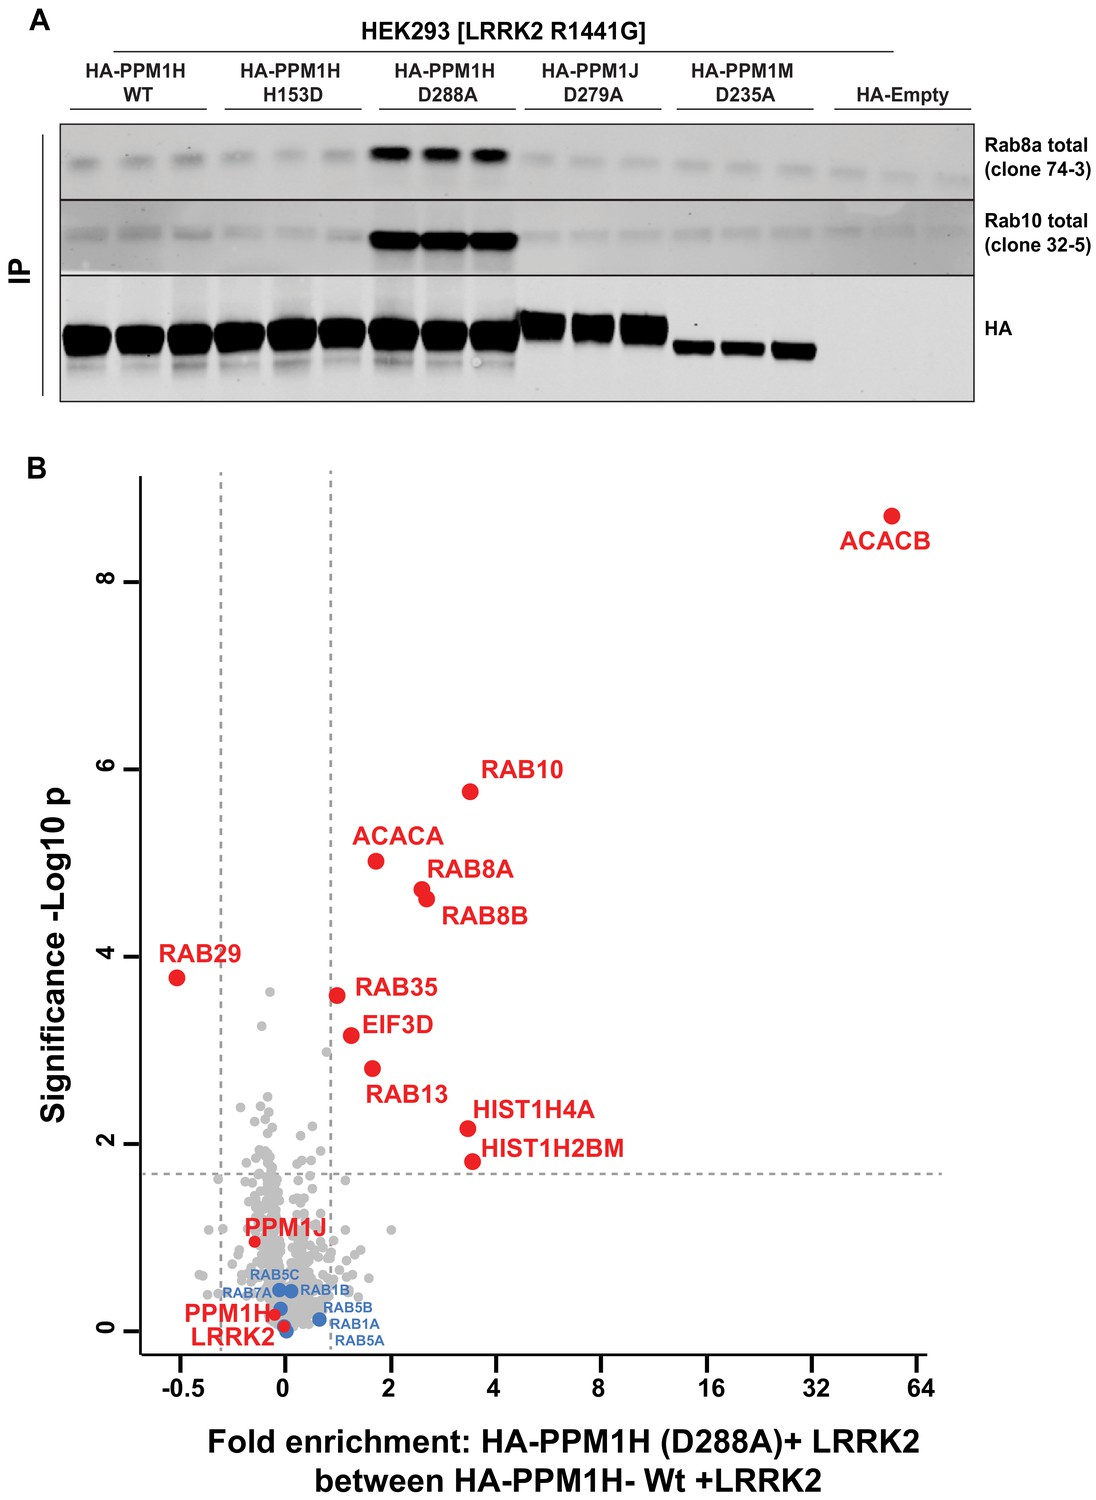
Identification of a substrate trapping mutant of PPM1H that forms a stable interaction with endogenous LRRK2 phosphorylated Rab8A and Rab10.
(A) HEK293 cells were transiently transfected with constructs expressing Flag-LRRK2[R1441G] and either wild-type HA-PPM1H or the PPM1H[D288A] mutant, as well as the corresponding mutants of the closely related PPM1J[D279A] and PPM1M[D235A]. 24 hr post-transfection cells were lysed and subjected to a HA-immunoprecipitation and analyzed by immunoblotting with the indicated antibodies (1 µg/ml). Membranes were developed using Odyssey CLx Western Blot imaging. Each lane represents cell extract obtained from a different dish of cells (three replicates per condition). (B) HEK293 cells were transiently transfected with constructs expressing Flag-LRRK2[R1441G] and either wild-type HA-PPM1H or the HA-PPM1H[D288A] mutant, lysed and subjected to a HA-immunoprecipitation and total immunoprecipitates were subjected to ‘on-bead’ digestion using trypsin following multiplexed TMT labeling the samples were pooled and fractionated into four fractions and analyzed on an Orbitrap Fusion Lumos Tribrid mass spectrometer in MS3 mode. The raw data was processed using MaxQuant pipeline and protein groups were further processed using Perseus software suite. The x-axis of the volcano plot represents the differential enrichment between HA-PPM1H[D288A]+LRRK2[R1441G] and wild-type HA-PPM1H+LRRK2[R1441G] and the y-axis represents the permutation-based false discovery rate corrected significance of a two tailed t-test. The differential enriched protein groups are highlighted in red filled circles along with the protein groups that are not changing are highlighted in blue with their gene names. The list of protein groups is included in Supplementary file 3.
Figure 9—figure supplement 1
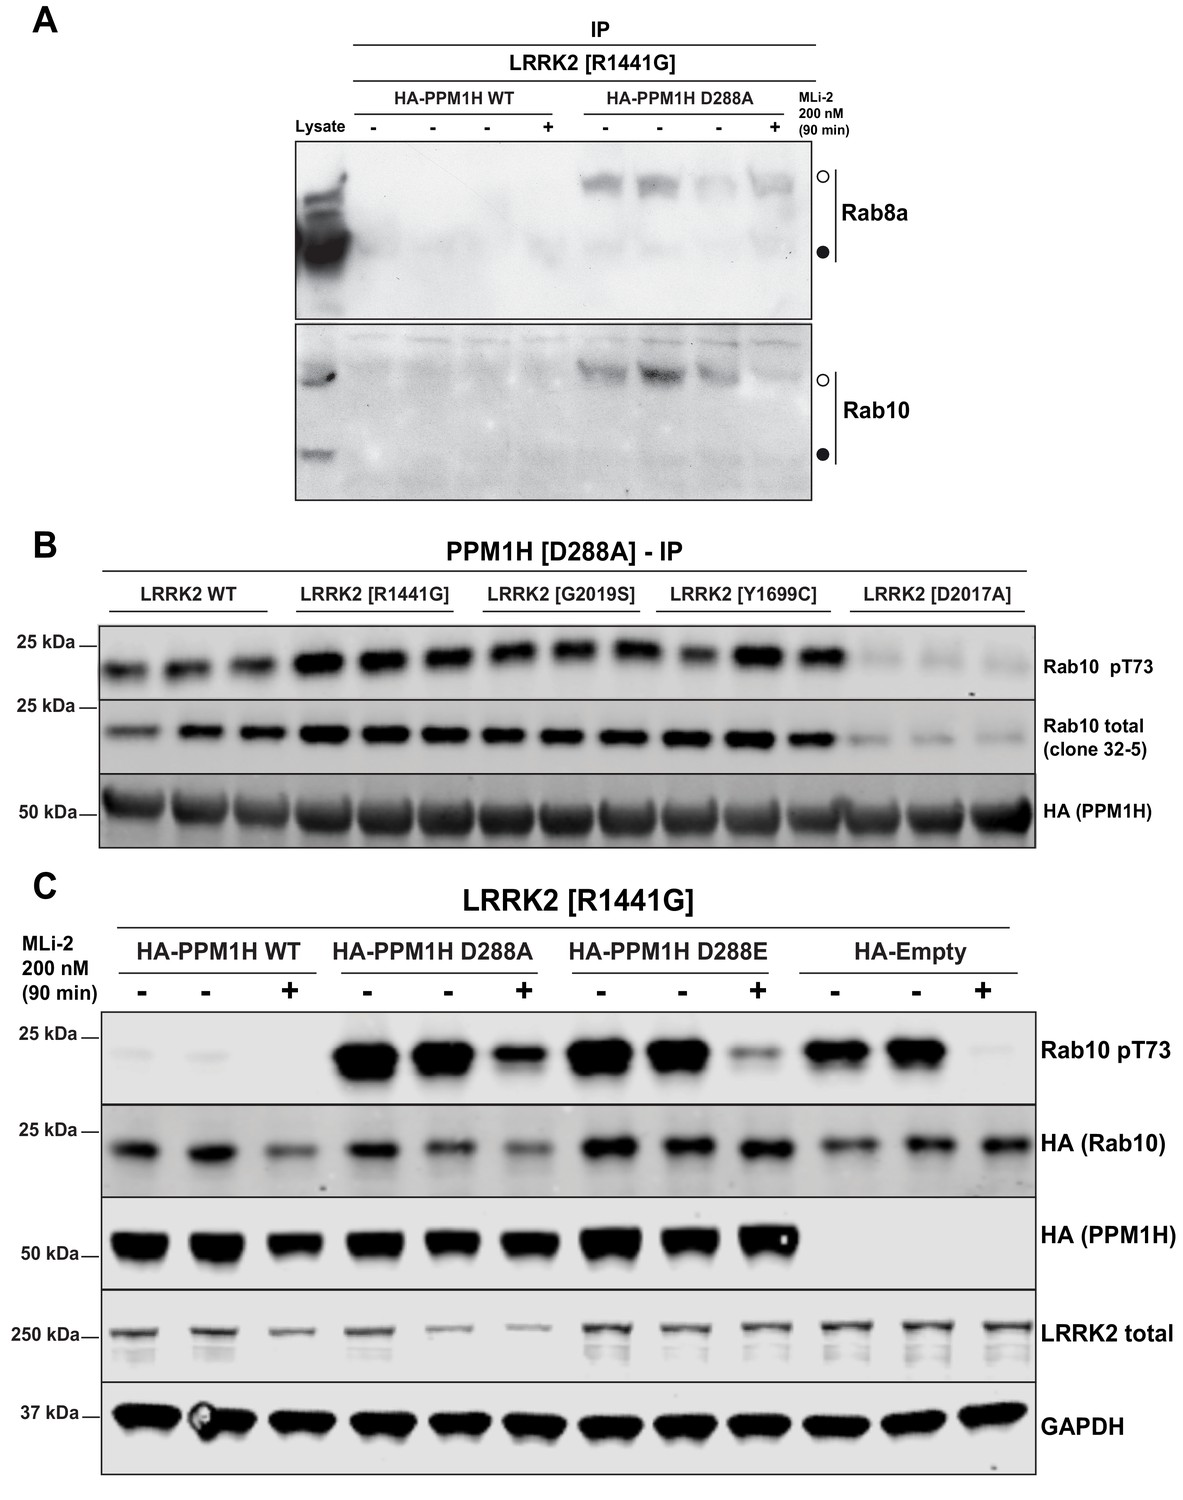
PPM1H[D288A] substrate trapping mutant stably interacts with LRRK2 phosphorylated Rab10 protecting it from dephosphorylation.
(A) HEK293 cells were transiently transfected with constructs expressing Flag-LRRK2[R1441G] and either wild-type HA-PPM1H or substrate trapping HA-PPM1H[D288A] mutant. 24 hr post-transfection, cells were treated with ±200 nM MLi-2 for 90 min lysed and subjected to a HA-immunoprecipitation and analyzed by Phos-tag immunoblotting with the indicated antibodies (1 µg/ml). Each lane represents cell extract obtained from a different dish of cells (three replicates per condition without MLi-2 treatment, one replicate per condition with MLi-2 treatment). Membranes were developed using ECL. (B) HEK293 cells were transiently transfected with constructs expressing PPM1H[D288A] with either wild-type or indicated pathogenic or catalytically inactive LRRK2. 24 hr post-transfection, cells were lysed and analyzed by immunoblotting with the indicated antibodies (1 µg/ml). Membranes were developed using Odyssey CLx Western Blot imaging. Each lane represents biological replicates (three replicates per condition). (C) As in (B) except that HEK293 cells were transiently transfected with constructs expressing Flag-LRRK2[R1441G] and either wild-type HA-PPM1H or indicated HA-PPM1H mutants or empty HA-vector for no phosphatase control. 24 hr post-transfection cells were treated ±200 nM MLi-2 prior to cell lysis for 90 min.
Figure 9—figure supplement 2
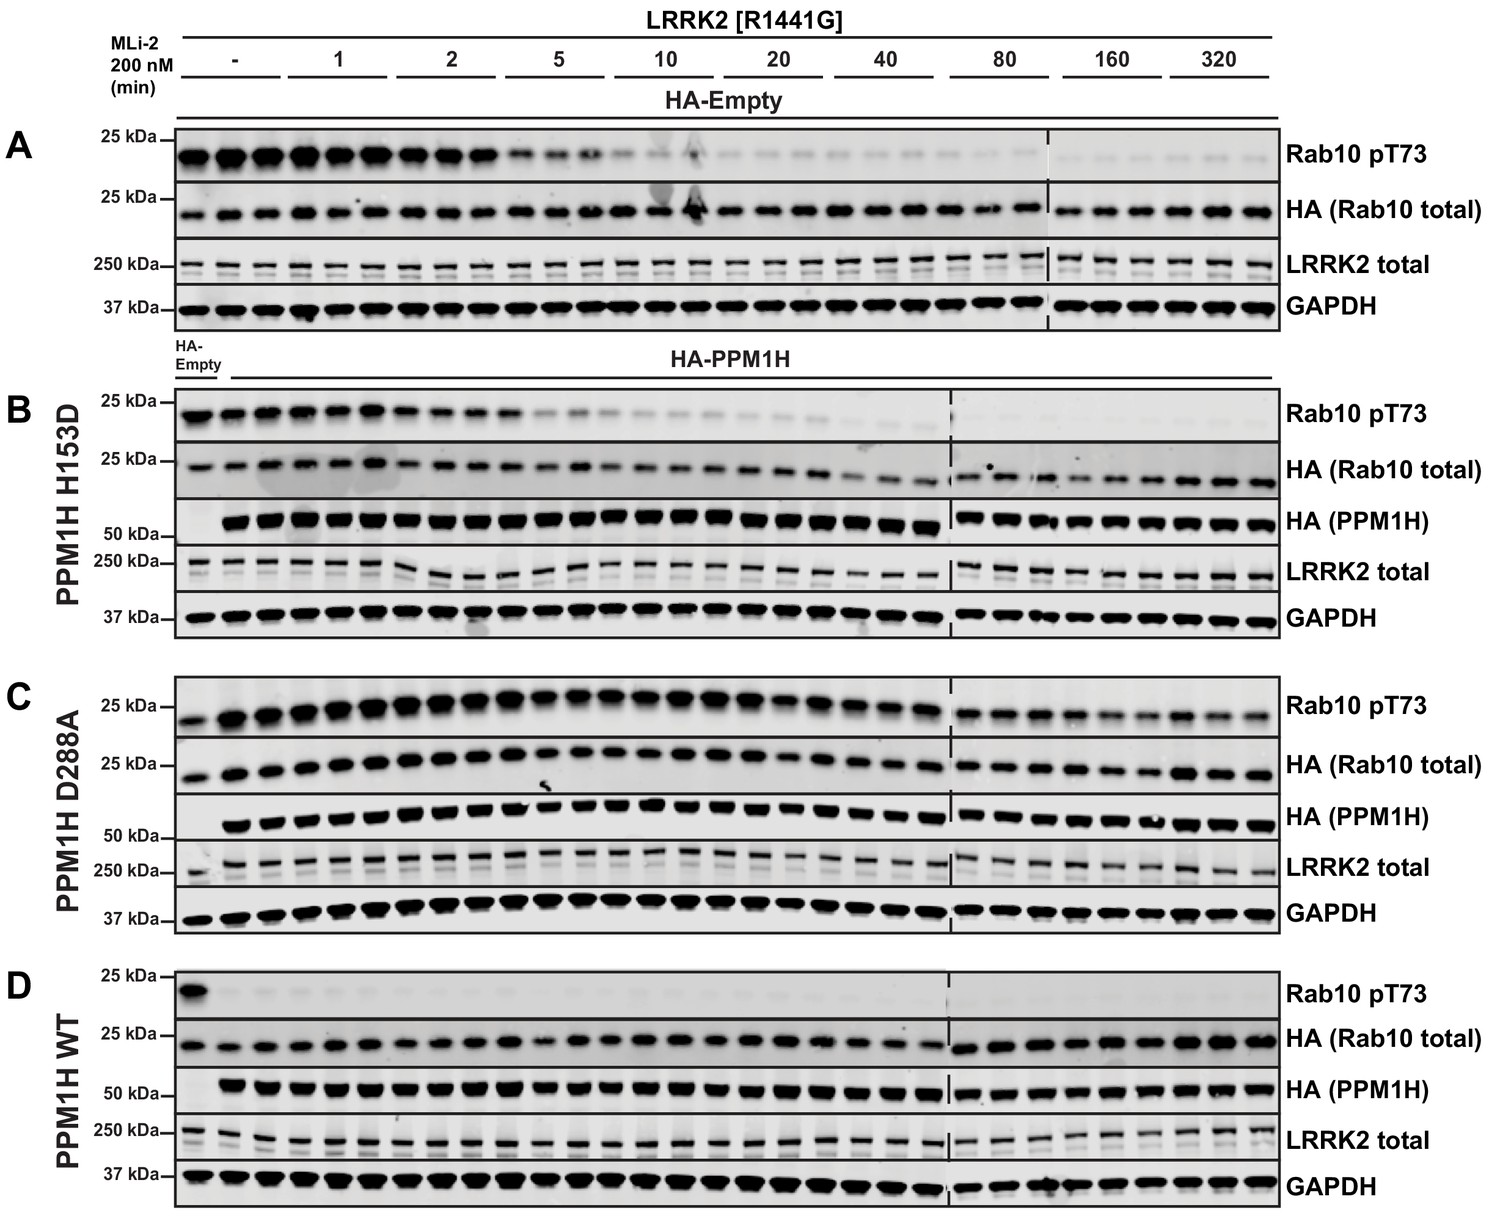
PPM1H[D288A] substrate trapping mutant blocks dephosphorylation of overexpressed Rab10 HEK293 cells were transiently transfected with LRRK2[R1441G] and constructs expressing empty HA-vector (no phosphatase control).
(A), catalytically inactive PPM1H[H153D] (B), substrate trapping PPM1H[D288A] (C) or wild-type PPM1H (D). 24 hr post-transfection, cells were treated with ±200 nM MLi-2 for the time-points indicated, lysed and analyzed by immunoblotting with the indicated antibodies (1 µg/ml). Membranes were developed using Odyssey CLx Western Blot imaging. Each lane represents biological replicates (three replicates per condition).
Figure 10 with 1 supplement
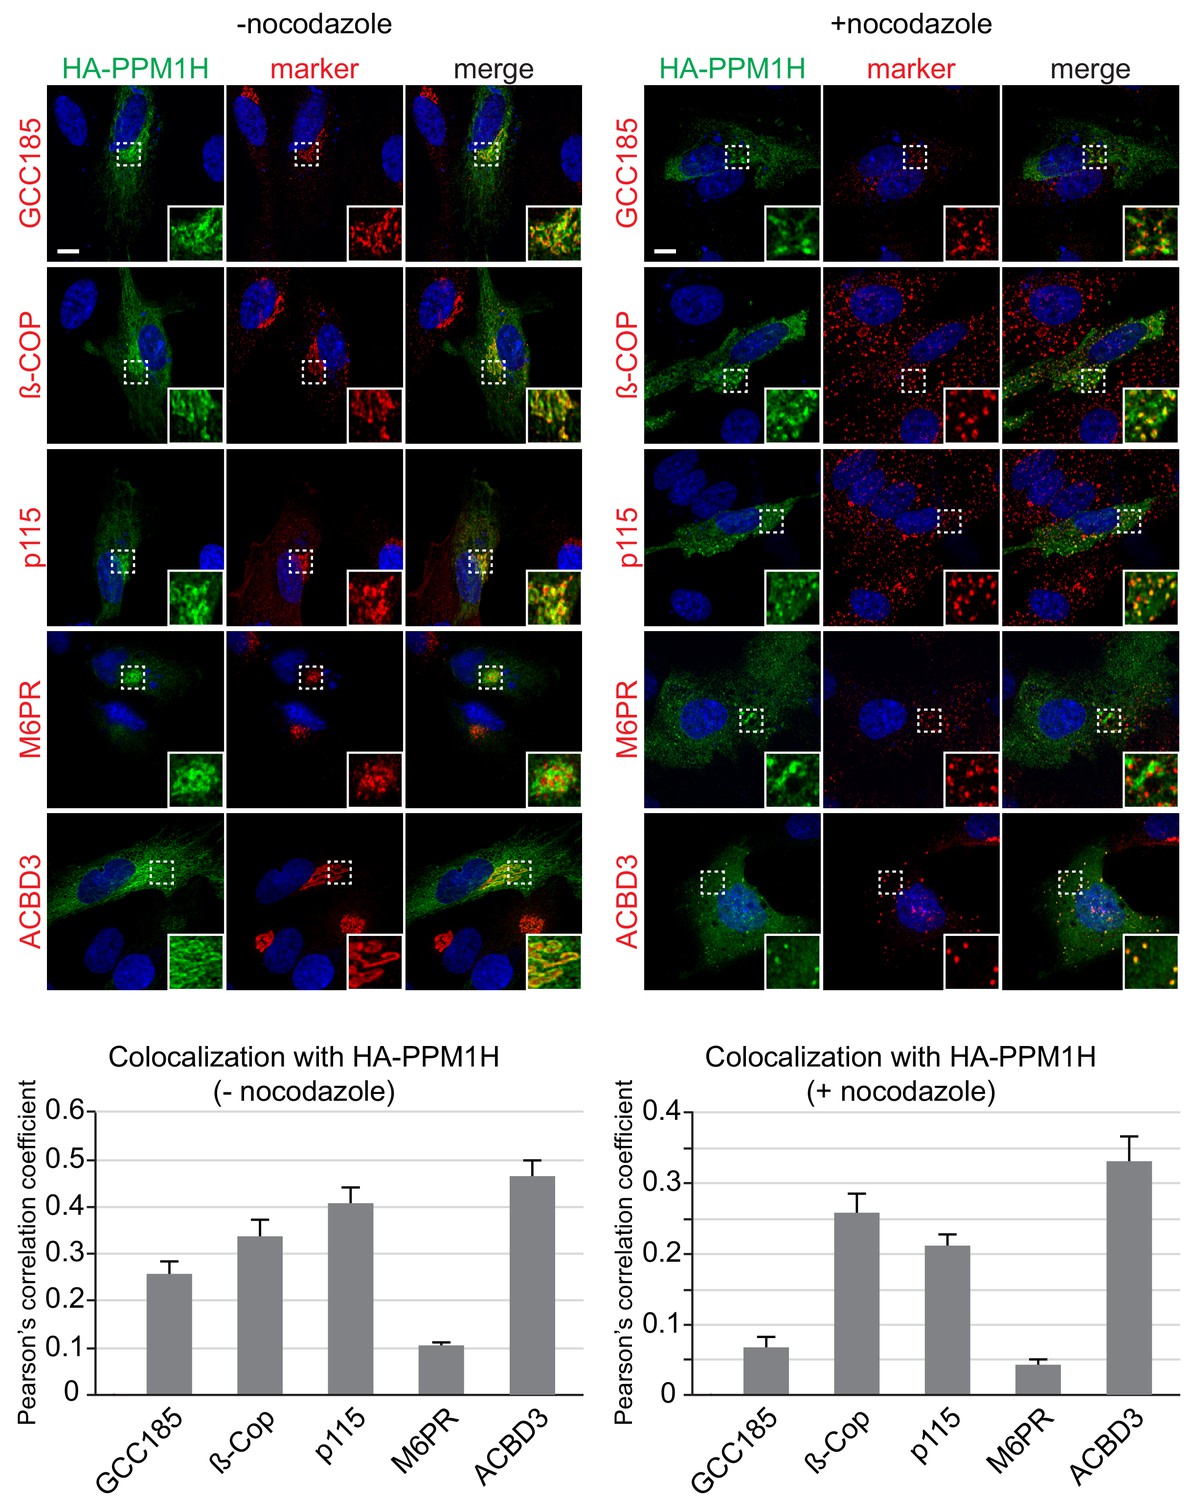
Localization of PPM1H in RPE cells.
RPE cells were transiently transfected with HA-PPM1H plasmid. After 24 hr, cells were treated ±20 µM nocodazole for 2 hr before fixation. Cells were subsequently stained with mouse or rabbit anti-HA antibody (green) and the following Golgi markers (shown in red): rabbit anti-GCC185, rabbit anti-ß-COP, mouse anti-p115, mouse anti-cation independent mannose 6-phosphate receptor, and rabbit anti-ACBD3. Nuclei were stained with DAPI (blue). Scale bar, 10 µm. Shown are maximum intensity projections. For each condition at least 20 cells were analyzed.
Figure 10—figure supplement 1
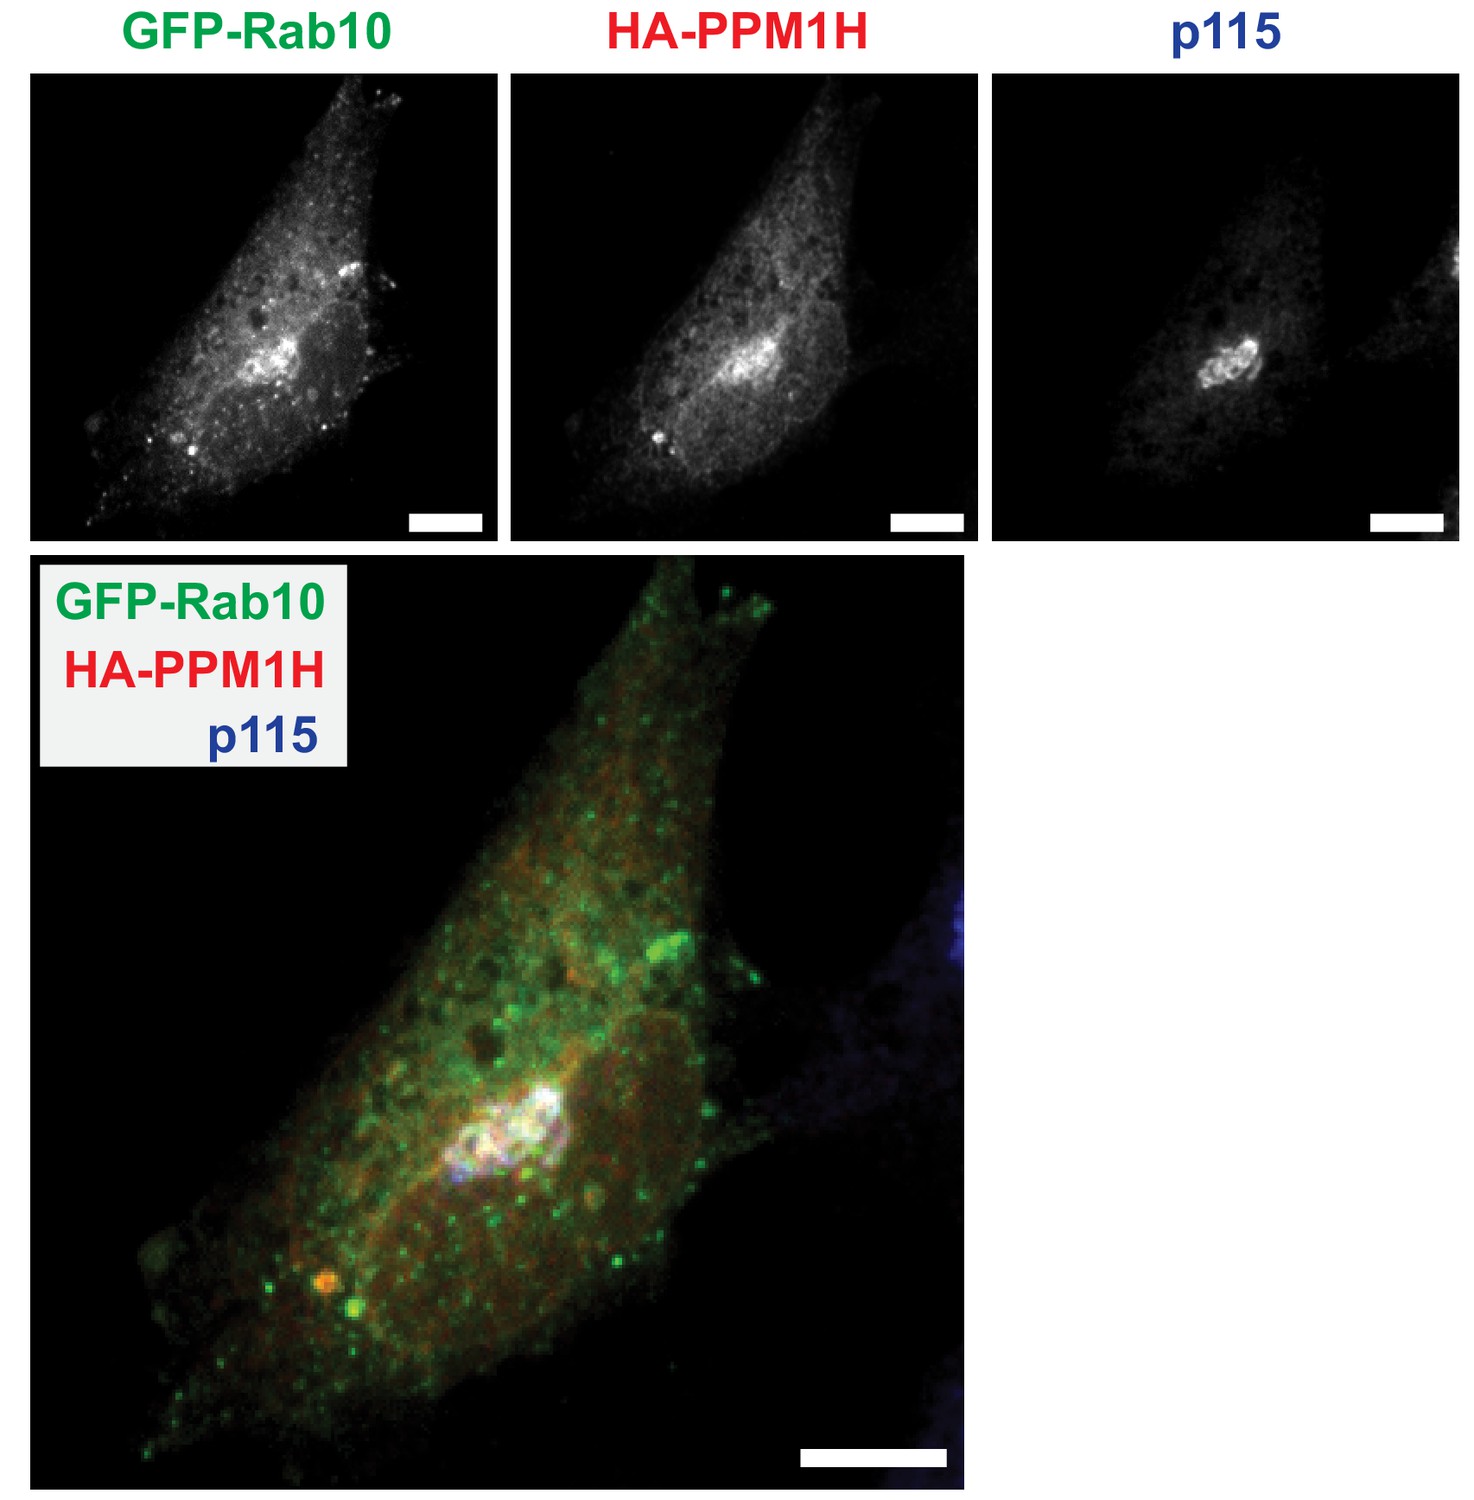
Localization of PPM1H and GFP-Rab10 in RPE cells.
RPE cells were transiently transfected with HA-PPM1H and GFP-Rab10 plasmids. Cells were subsequently stained with rabbit anti-HA antibody (red), mouse anti-p115 (blue), and native GFP fluorescence is shown in green. Scale bars, 10 µm. Shown are maximum intensity projections.
Figure 11
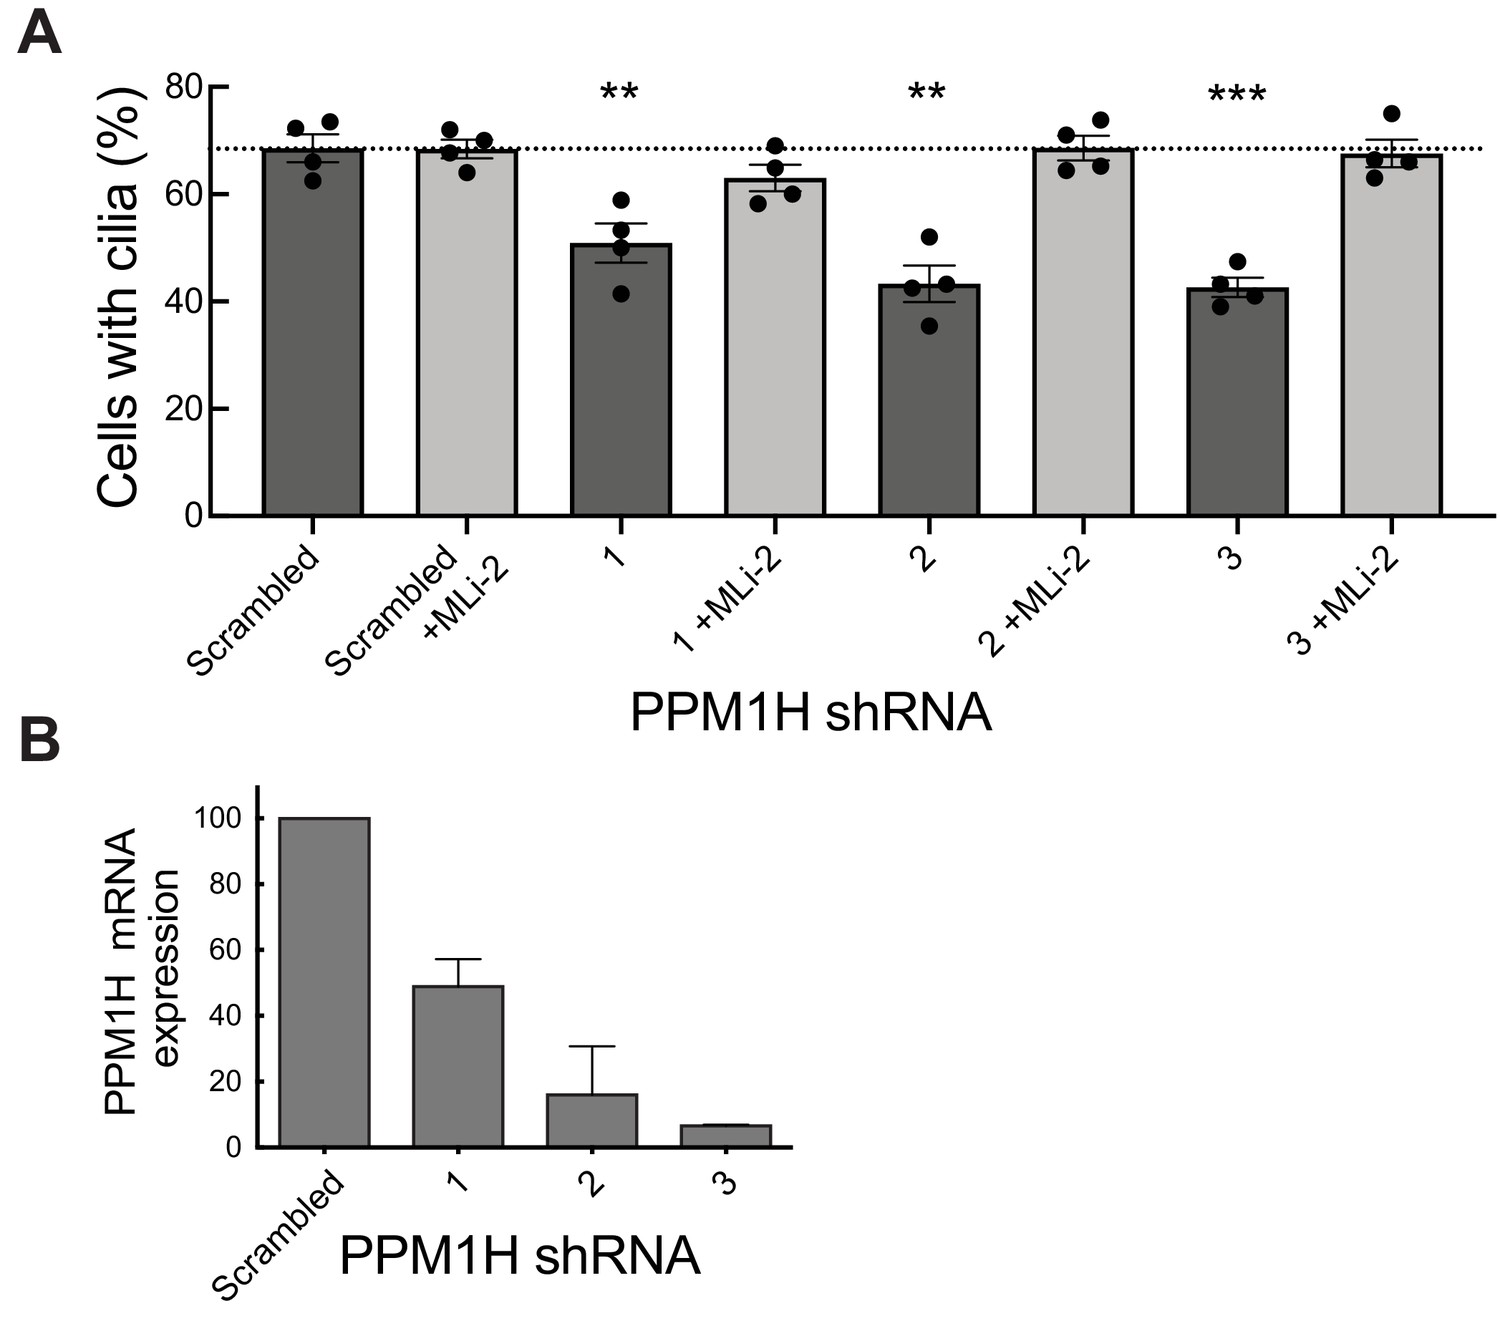
PPM1H depletion in wild-type MEF cells decreases ciliation, consistent with increased Rab phosphorylation.
Cells expressing the indicated shRNAs were assayed for ciliation 24 hr after serum starvation. (A) Shown is the average of duplicate determinations made at identical cell confluency; error bars represent SEM. The experiment was replicated four times by two lab members; p=0.008 (**), 0.001(**) or 0.0002 (***) for shRNAs 1, 2 and 3, respectively (unpaired two-tailed t test, GraphPad PRISM software). (B) PPM1H mRNA levels detected in the corresponding cell extracts using two different primers by qPCR in triplicate in relation to a GAPDH control. Error bars represent SD.
Figure 12 with 2 supplements
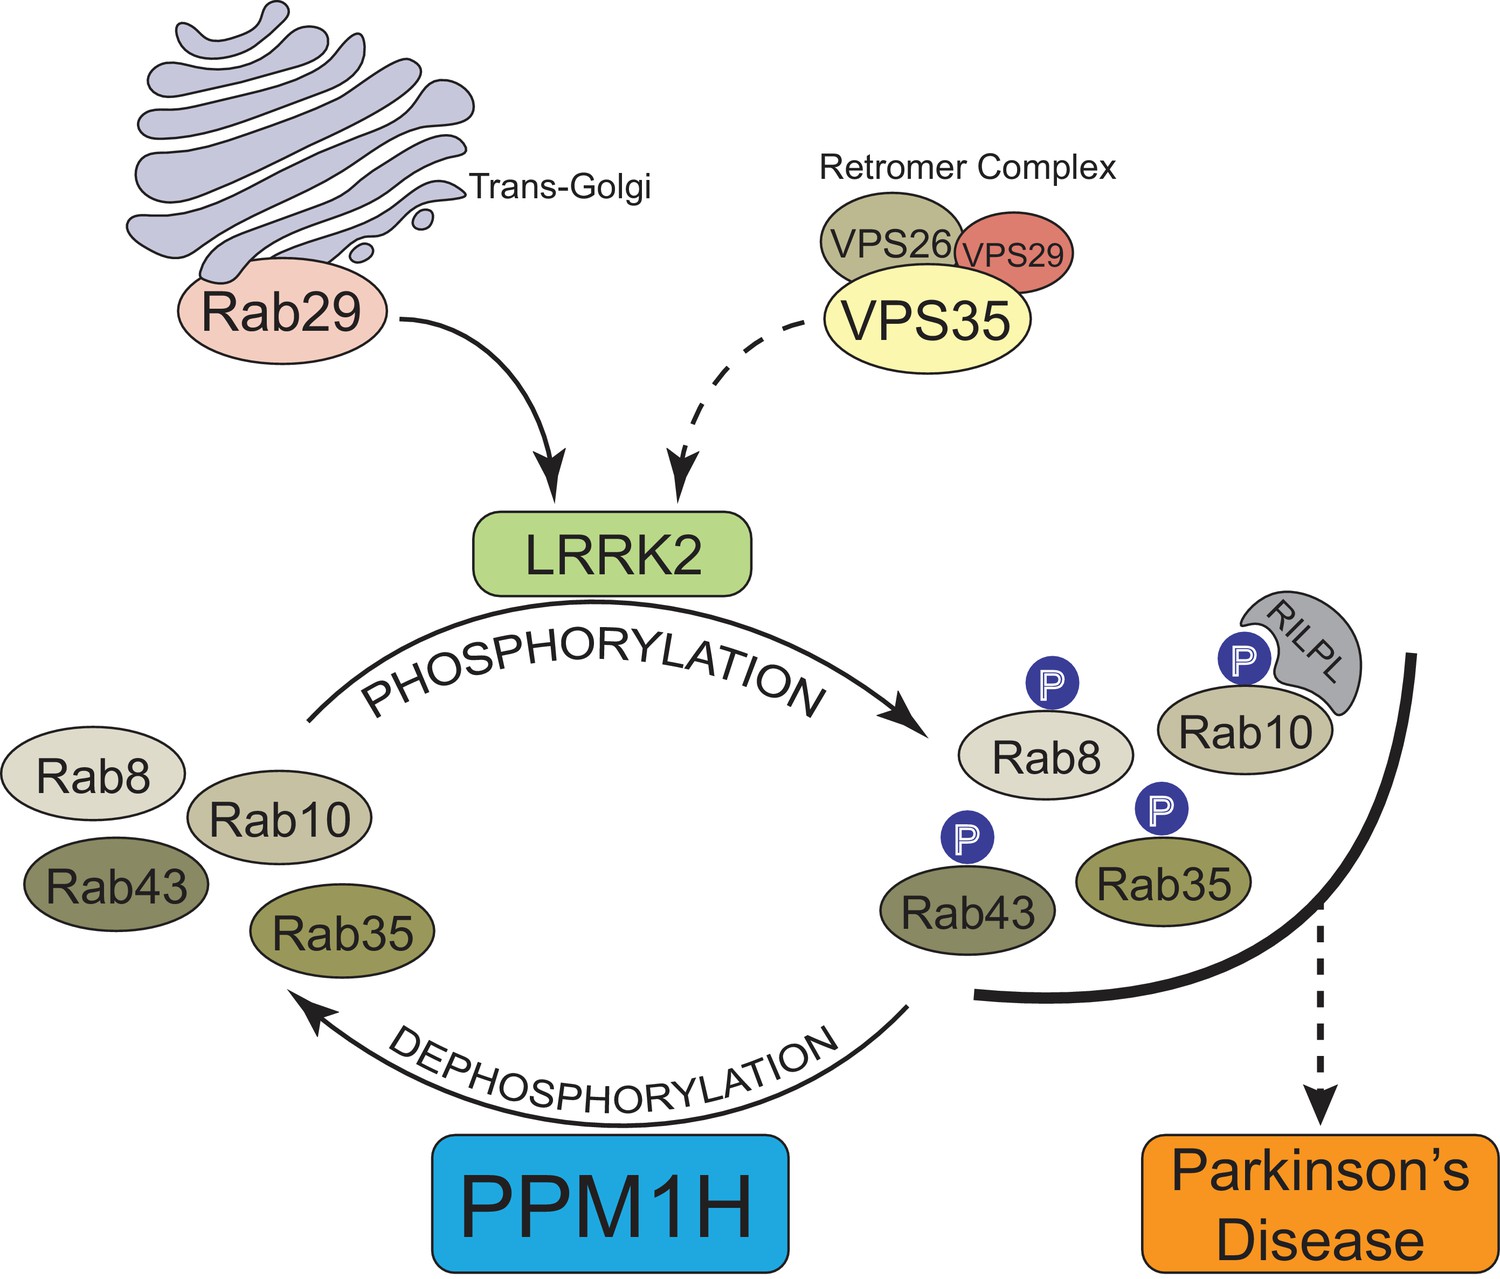
Model of how PPM1H counteracts LRRK2 signaling pathway by dephosphorylating Rab proteins.
https://doi.org/10.7554/eLife.50416.028
Figure 12—figure supplement 1
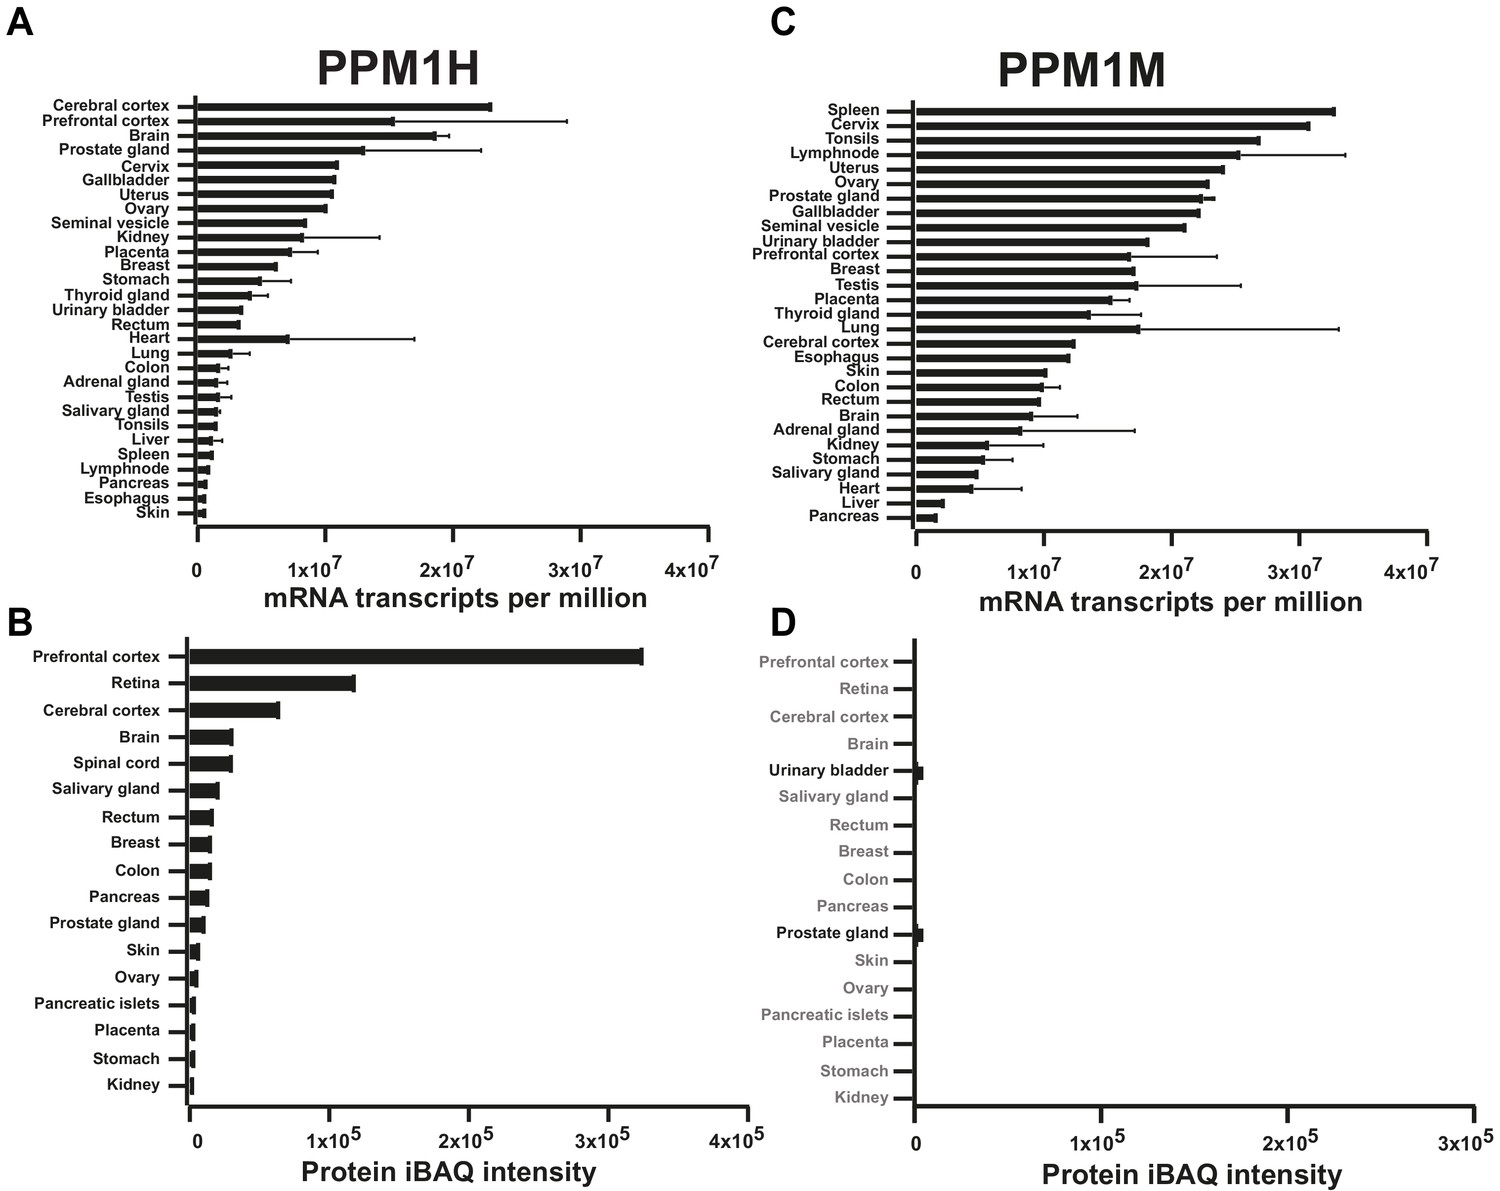
The abundance of PPM1H and PPM1M mRNA and protein in human tissues was analyzed using data downloaded from ProtemicsdB public repository database (https://www.proteomicsdb.org/) (Schmidt et al., 2018).
The median mRNA expression across the tissues studied is depicted as transcripts per million. The median protein expression for both PPM1H and PPM1M is calculated as the average normalized iBAQ (intensity based absolute quantification).
Figure 12—figure supplement 2
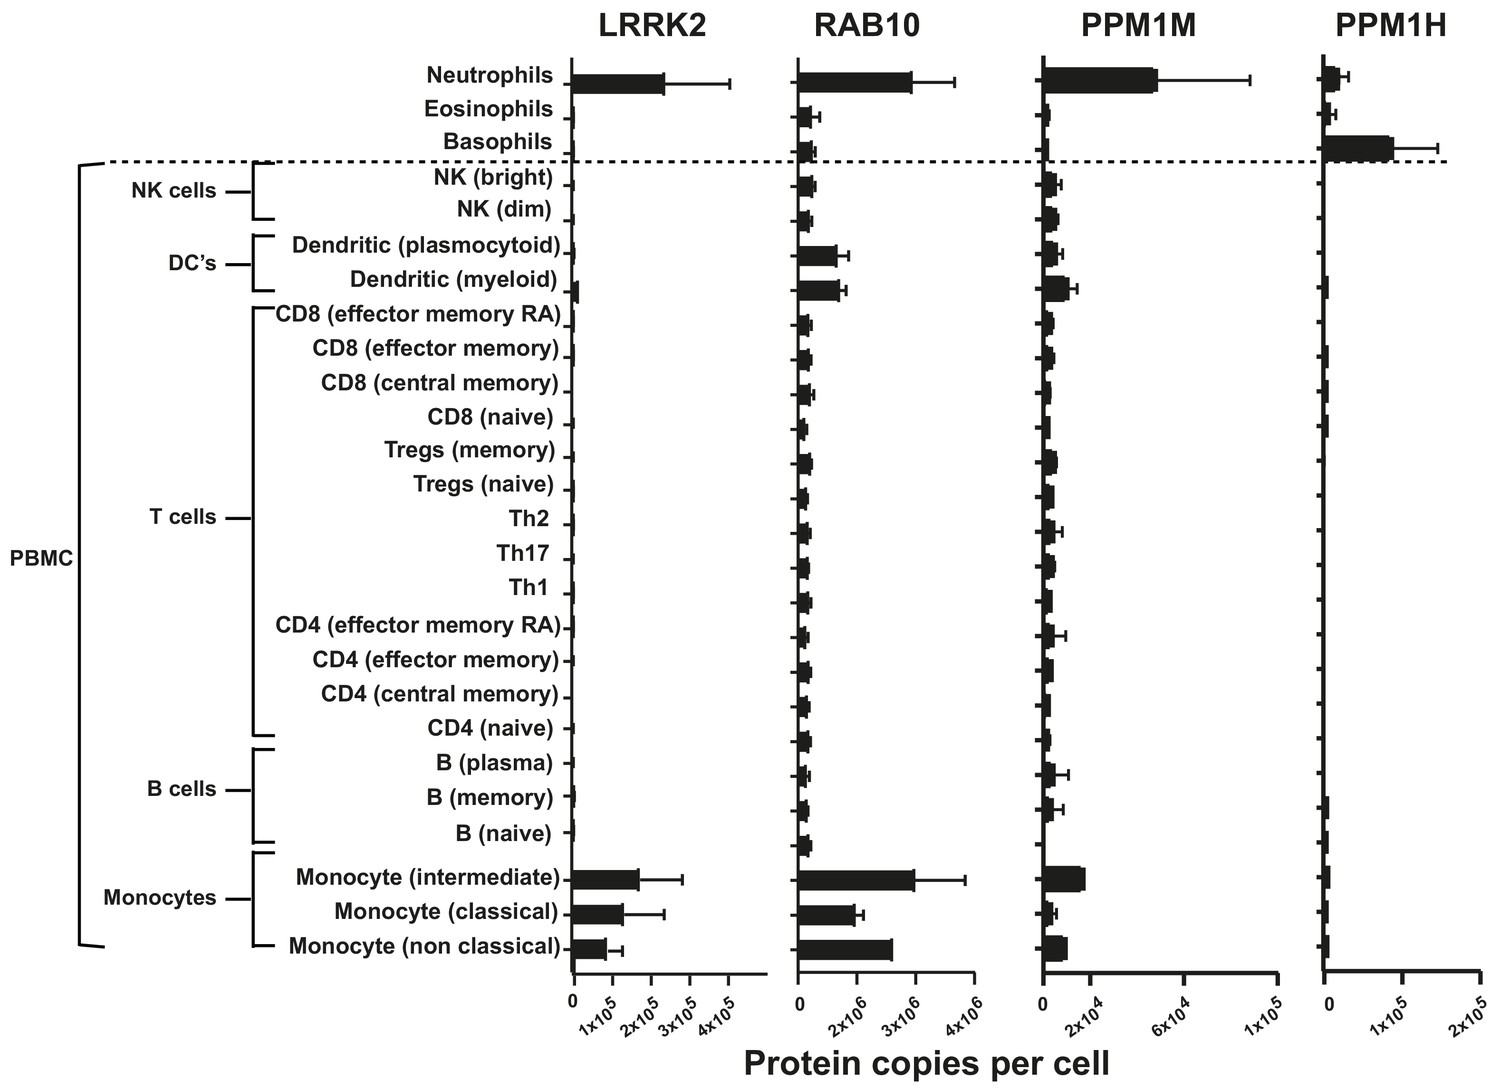
The abundance of PPM1H and PPM1M proteins in immune cells isolated from human blood using data available from the immprot database (http://www.immprot.org) (Rieckmann et al., 2017).
The study utilized pure populations of immune cells isolated from human blood using fluorescence-activated cell sorting, and whole cell proteomics data were generated. Data were analyzed using the histone ruler to estimate protein copy numbers per cell. The graphs show the number of protein copies per cell for PPM1H, PPM1M, LRRK2 and Rab10 in a range of peripheral blood immune cells including subsets of T cells, B cells, monocytes, NK cells, dendritic cells and the granulocytes neutrophils, basophils and eosinophils.
Tables
Key resources table
| Reagent type (species) or resource | Designation | Source or reference | Identifiers | Additional information |
|---|---|---|---|---|
| Cell line (Homo sapiens) | Lung adenocarcinoma | ATCC | RRID:CVCL_0023 | |
| Cell line (M. musculus) | LRRK2[R1441C], Mouse embryonic fibroblasts | Steger et al., 2017 | ||
| Antibody | anti-phospho-Rab10 (Thr73) (rabbit monoclonal) | Abcam | #ab230261 | WB (1:1000) |
| Antibody | anti-phospho-Rab8 (Thr72) (rabbit monoclonal) | Abcam | #ab230260 | WB (1:1000) |
| Antibody | anti-phospho-Rab12 (Ser106) (rabbit monoclonal) | Abcam | Mir et al., 2018 | WB (1:1000) |
| Antibody | anti-Rab8A (rabbit monoclonal) | Abcam | #ab237702 | WB (1:1000) |
| Antibody | anti-Rab10 (mouse monoclonal) | nanoTools | 0680–100/Rab10-605B11 | WB (1:1000) |
| Antibody | anti-PPM1H (sheep polyclonal) | MRC PPU Reagents and Services | DA018 | WB (1 µg/ml) |
| Antibody | anti-Akt (sheep polyclonal) | MRC PPU Reagents and Services | S695B | WB (1 µg/ml) |
| Antibody | anti-Rab12 (sheep polyclonal) | MRC PPU Reagents and Services | SA227 | WB (1 µg/ml) |
| Antibody | anti-Rab43 (sheep polyclonal) | MRC PPU Reagents and Services | S417B | WB (1 µg/ml) |
| Antibody | anti-S6K1 (sheep polyclonal) | MRC PPU Reagents and Services | SA135 | WB (1 µg/ml) |
| Antibody | anti- phospho-Ser935 LRRK2 (rabbit monoclonal) | MRC PPU Reagents and Services | UDD2 | WB (1:1000) |
| Antibody | anti-LRRK2 (rabbit monoclonal) | MRC PPU Reagents and Services | UDD3 | WB (1:1000) |
| Antibody | anti-LRRK2 (mouse monoclonal) | Neuromab | 75–253 | WB (1:1000) |
| Antibody | anti-Phospho-AMPKα (Thr172) (rabbit monoclonal) | CST | #2535, RRID:AB_331250 | WB (1:1000) |
| Antibody | anti- AMPKα (rabbit monoclonal) | CST | #5831, RRID:AB_10622186 | WB (1:1000) |
| Antibody | anti-Phospho-Akt Ser473 (rabbit monoclonal) | CST | #9271, RRID:AB_329825 | WB (1:1000) |
| Antibody | anti- Rab35 (rabbit monoclonal) | CST | #9690, RRID:AB_11178805 | WB (1:1000) |
| Antibody | anti- Rab3A (rabbit monoclonal) | CST | #12214 | WB (1:1000) |
| Antibody | anti- ACC1 (rabbit monoclonal) | CST | #3676, RRID:AB_2219397 | WB (1:1000) |
| Antibody | anti- ACC2 (rabbit monoclonal) | CST | #8578, RRID:AB_1094989 | WB (1:1000) |
| Antibody | anti-phospho-S6K1 Thr389 (rabbit monoclonal) | CST | #9205, RRID:AB_330944 | WB (1:1000) |
| Antibody | anti-phospho-MYPT1 Thr853 (rabbit monoclonal) | CST | #4563, RRID:AB_1031185 | WB (1:1000) |
| Chemical compound, drug | MLi-2 | University of Dundee | Fell et al., 2015 | |
| Chemical compound, drug | Calyculin A | Abcam | #ab141784 | |
| Chemical compound, drug | Okadaic Acid | Abcam | #ab120375 | |
| Chemical compound, drug | Microcystin-LR | Enzo Life Sciences | ALX-350–012 | |
| Transfected construct (human) | HA-EMPTY, pCMV5D | MRC PPU Reagents and Services | DU44059 | |
| Transfected construct (human) | HA-Rab10, pCMV5D | MRC PPU Reagents and Services | DU44250 | |
| Transfected construct (human) | HA-Rab8A, pCMV5D | MRC PPU Reagents and Services | DU35414 | |
| Transfected construct (human) | HA- Rab8B, pCMV5D | MRC PPU Reagents and Services | DU39856 | |
| Transfected construct (human) | HA- Rab12, pCMV5D | MRC PPU Reagents and Services | DU48963 | |
| Transfected construct (human) | HA- Rab3A, pCMV5D | MRC PPU Reagents and Services | DU51539 | |
| Transfected construct (human) | HA- Rab3B, pCMV5D | MRC PPU Reagents and Services | DU55007 | |
| Transfected construct (human) | HA- Rab3C, pCMV5D | MRC PPU Reagents and Services | DU55048 | |
| Transfected construct (human) | HA- Rab3D, pCMV5D | MRC PPU Reagents and Services | DU26388 | |
| Tansfected construct (human) | HA- Rab35, pCMV5D | MRC PPU Reagents and Services | DU26478 | |
| Transfected construct (human) | HA- Rab43, pCMV5D | MRC PPU Reagents and Services | DU26392 | |
| Transfected construct (human) | HA- PPM1H, pCMV5D | MRC PPU Reagents and Services | DU62789 | |
| Transfected construct (human) | HA- PPM1H[H153D], pCMV5D | MRC PPU Reagents and Services | DU62928 | |
| Transfected construct (human) | HA- PPM1H[D288A], pCMV5D | MRC PPU Reagents and Services | DU62985 | |
| Transfected construct (human) | HA- PPM1H[D288E], pCMV5D | MRC PPU Reagents and Services | DU62986 | |
| Transfected construct (human) | FLAG-LRRK2[R1441G], pCMV5D | MRC PPU Reagents and Services | DU13077 | |
| Peptide, recombinant protein | His-SUMO-PPM1H | MRC PPU Reagents and Services | Expressed from DU62835 | |
| Peptide, recombinant protein | His-SUMO-PPM1H[H153D] | MRC PPU Reagents and Services | Expressed from DU68104 | |
| Peptide, recombinant protein | His-SUMO-PPM1H[D288A] | MRC PPU Reagents and Services | Expressed from DU68087 |
Additional files
-
Supplementary file 1
Numerical data of the pRab10/Total Rab10 ratios relative to scrambled siRNA control from Screens 1, 2 and 3 (experiments shown in Figure 2).
The list of all siRNA targets and the sequences of all siRNA oligonucleotides are also included.
- https://doi.org/10.7554/eLife.50416.031
-
Supplementary file 2
The raw data obtained for Rab10 phosphorylation stoichiometry assessment (Figure 6B) and Rab phosphorylation levels in the PRM scan (Figure 6D).
- https://doi.org/10.7554/eLife.50416.032
-
Supplementary file 3
The list of protein groups identified in the PPM1H substrate trapping mutant experiment (Figure 9B).
- https://doi.org/10.7554/eLife.50416.033
-
Transparent reporting form
- https://doi.org/10.7554/eLife.50416.034
Download links
A two-part list of links to download the article, or parts of the article, in various formats.
Downloads (link to download the article as PDF)
Open citations (links to open the citations from this article in various online reference manager services)
Cite this article (links to download the citations from this article in formats compatible with various reference manager tools)
PPM1H phosphatase counteracts LRRK2 signaling by selectively dephosphorylating Rab proteins
eLife 8:e50416.
https://doi.org/10.7554/eLife.50416


