Antagonistic regulation by insulin-like peptide and activin ensures the elaboration of appropriate dendritic field sizes of amacrine neurons
- Section on Neuronal Connectivity, Eunice Kennedy Shriver National Institute of Child Health and Human Development, National Institutes of Health, United States
- Institute of Cellular and Organismic Biology, Academia Sinica, Taiwan, Republic of China
- Mathematical and Statistical Computing Laboratory, Center for Information Technology, National Institutes of Health, United States
- Institute of Chemistry, Academia Sinica, Taiwan, Republic of China
- Genome and Systems Biology Degree Program, National Taiwan University and Academia Sinica, Taiwan, Republic of China
Figures
Figure 1 with 1 supplement
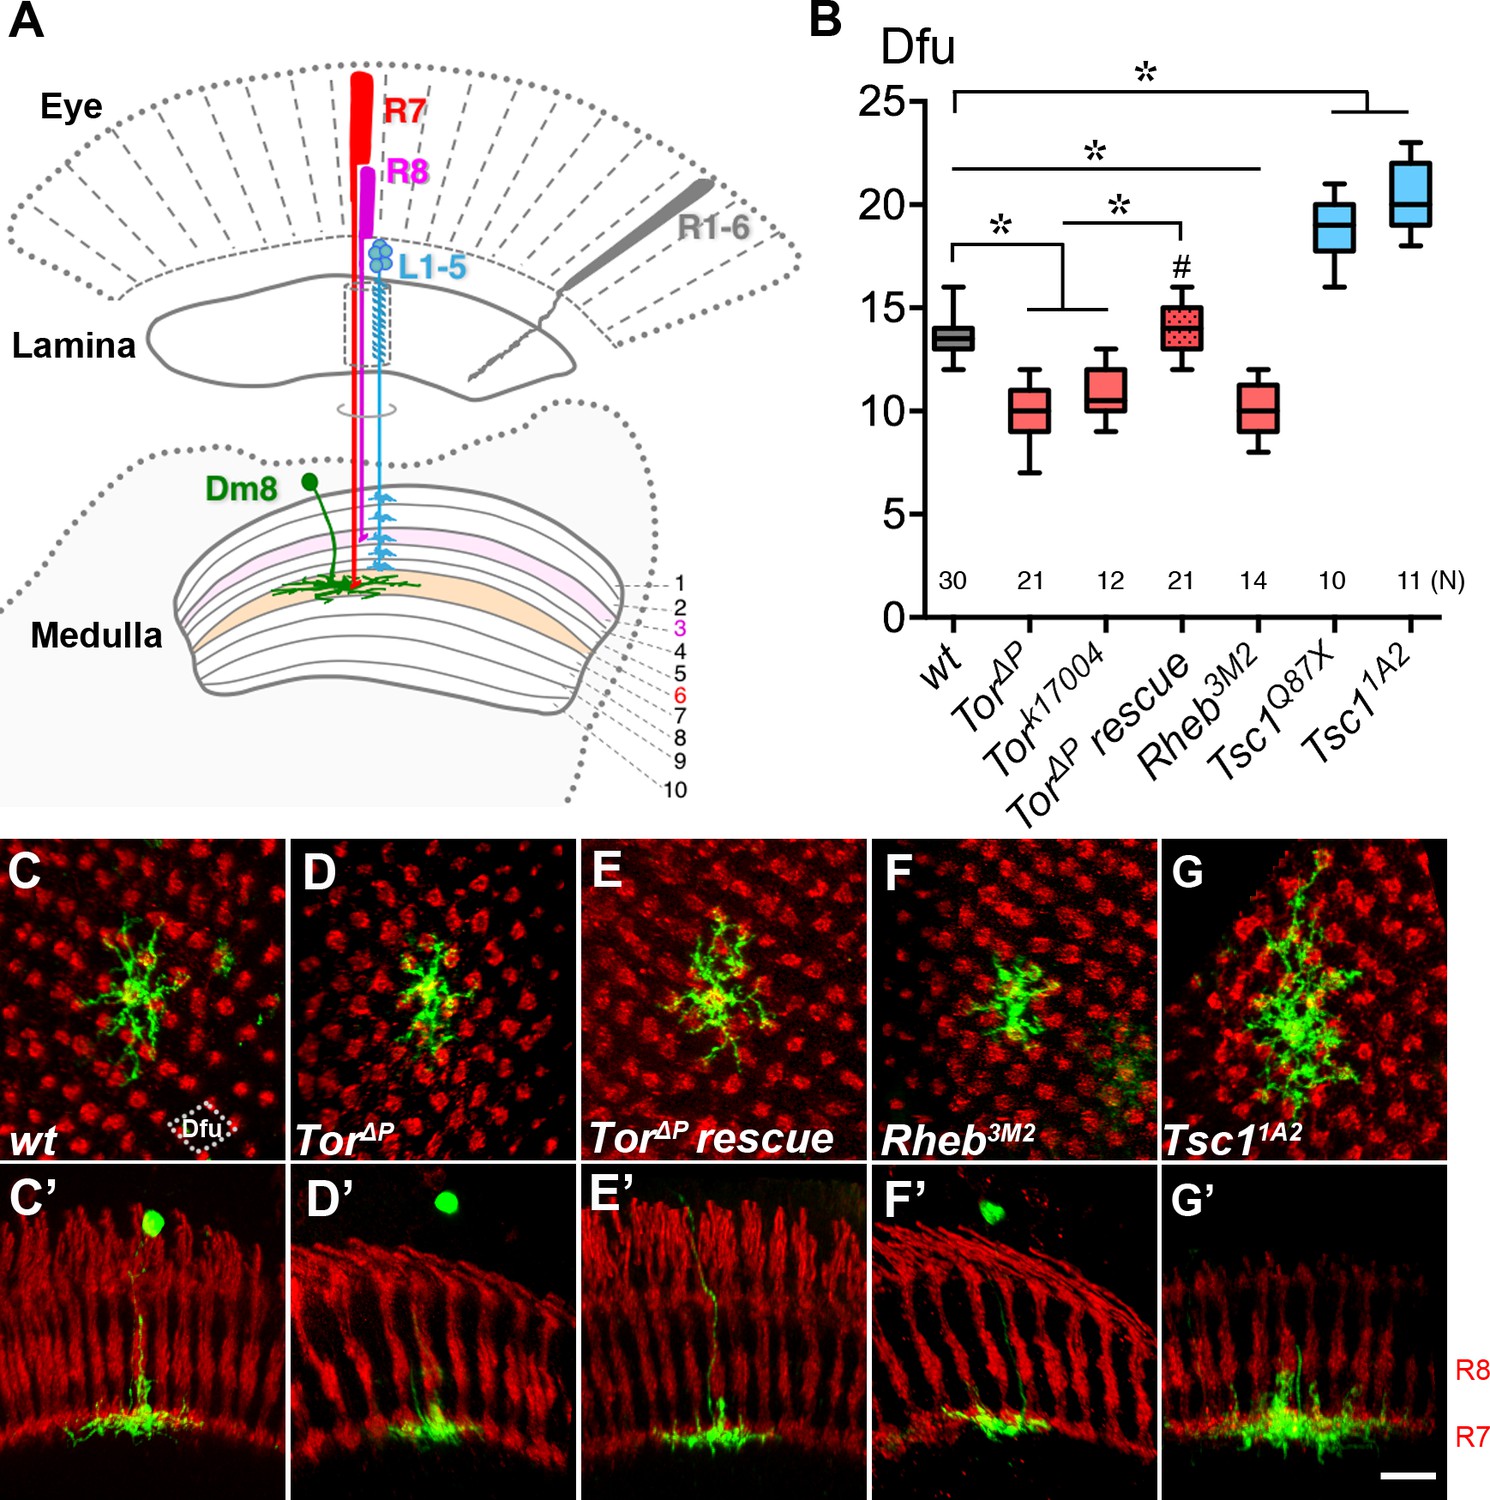
Cell-autonomous TOR signaling positively regulates the dendritic field sizes of Dm8 amacrine neurons.
(A) A schematic illustration of the Drosophila peripheral visual system, including the eye and two optic neuropils, the lamina and the medulla. The chromatic photoreceptors R7 (red) and R8 (magenta) extend axons into the M6 and M3 layers of the medulla neuropil, respectively, while the broad-spectrum R1-6 photoreceptors (grey) terminate their axons in the lamina. The wide-field amacrine neuron Dm8 elaborate their dendrites in the M6 layer to receive inputs from about 14 R7s. The axons of the lamina neurons L1-5 (cyan) terminate in various M1-M5 layers. (B) Box plot showing the dendritic field sizes of wild-type and various mutant Dm8 neurons. For Tor and Tsc1, two different null mutant alleles were tested. The Dm8 dendritic field sizes were quantified by counting the number of encompassed dendritic field units (dfu). One dfu was defined as a rhombus area with four neighboring photoreceptor terminals as vertexes (indicated by dotted lines in (C)). Expression of wild-type Tor significantly rescued Tor mutant Dm8 dendritic phenotypes. *p<0.05; unpaired Student’s t test. N; the number of cells scored for each genotype. (C–G) Single wild-type (C,C’), Tor mutant (D,D’,E,E’), Rheb mutant (F,F’) and Tsc1 mutant (G,G’) in adults. Dm8 neurons were generated and labeled with the mCD8GFP marker (green) using the hs-flp/MARCM system. The photoreceptor axons, labeled with anti-24B10 (red), were used as landmarks. (C–G) show proximal-distal views while (C’–G’) show the corresponding dorsal-ventral views. As compared to wild-type neurons (C,C’), Tor (D,D’) and Rheb (F,F’) mutant Dm8 dendritic fields were smaller, covering fewer dendritic field units (dfu), while Tsc1 (G,G’) mutant Dm8 dendritic fields were larger. The dendritic field size of Tor mutant Dm8 neurons was restored by overexpressing a wild-type form of Tor during development (E,E’). The layer-specific targeting of Dm8 dendrites was unaffected in all mutants examined (C’–G’). Scale bar (shown in G’ for C-G’), 5 μm.
Figure 1—figure supplement 1

Cell fate is unaffected in Tor and Pten mutant Dm8 neurons.
(A–A') Adult wild-type Dm8 neurons express the transcription factor Dachshund (Dac). Dm8 neurons were labeled by 24F06-Gal4-driven mCD8GFP (green) and co-labeled with anti-24B10 (blue) and anti-Dac (red). Most, if not all Dm8 neurons, are Dac-positive. Scale bar, 20 µm. (A’–A”) Magnification of the boxed region in (A). Two representative Dm8s (yellow arrows) are Dac-positive. (B–D’) Dac expression persists in Tor or Pten mutant Dm8s. Wild-type (B, B'), Tor (C, C'), Pten (D, D') Dm8 MARCM clones were labeled by mCD8GFP and anti-Dac. Scale bar, 5 µm. (E) Box plot showing the cell body sizes of adult wild-type and mutant Dm8 neurons. Tor mutation mildly affects Dm8 cell sizes, while Pten mutation enlarges Dm8 cell sizes. *p<0.05, #p=0.046; Student’s t test. (F–M’) Adult wild-type and Tor mutant Dm8 neurons do not express Drifter (Dfr), Twin of Eyeless (Toy), Dichaete (D), or Eyeless (Ey).
Figure 2 with 1 supplement
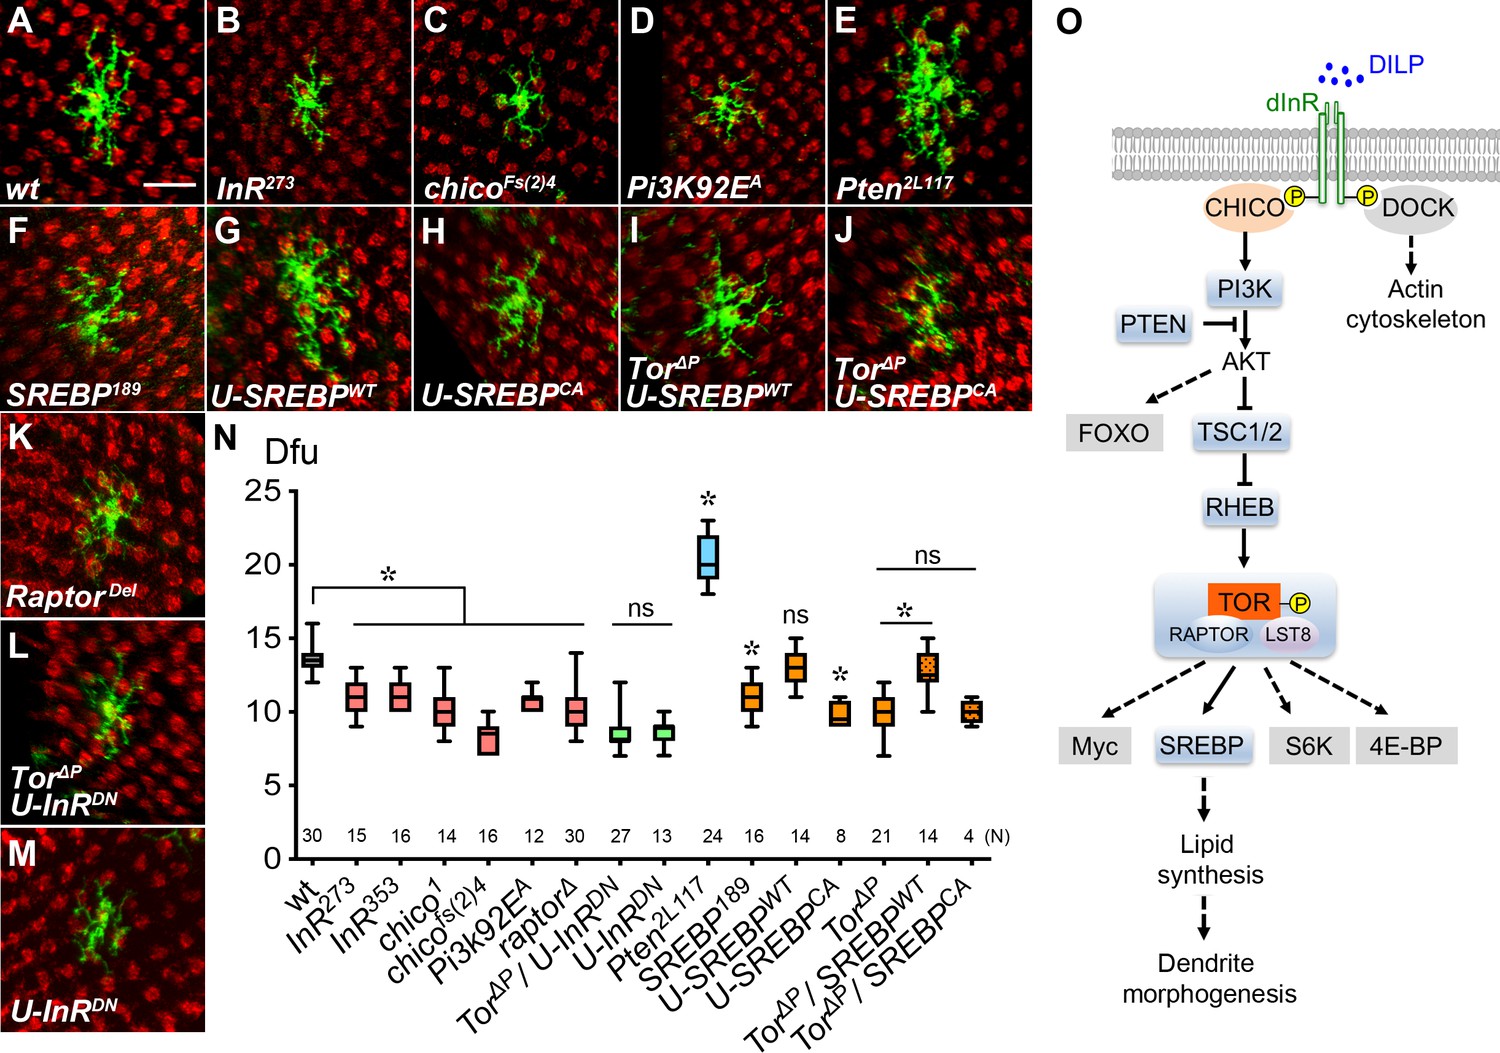
Insulin/Tor signaling positively regulates Dm8 dendrite development through SREBP.
(A–F) Insulin/Tor signaling and the downstream regulator SREBP are cell-autonomously required for normal Dm8 dendritic size and patterning. Single wild-type (A), InR273 (B), chicoFs(2)4 (C), Pi3K92EA (D), Pten2L117 (E), SREBP189 (F) and RaptorDel (K) were generated and labeled with mCD8GFP marker (green) using the hs-flp/MARCM system and examined in adults. The photoreceptor axons, labeled with anti-24B10 (red), were used as landmarks. As compared to wild type (A), mutation of InR (B), chico (C), Pi3K (D), SREBP (F) and Raptor (K) significantly decreased Dm8 dendritic field sizes, while mutation of Pten (E) enlarged Dm8 dendritic field size. Scale bar, 10 μm. (G–H) Using DIP-γ-Gal4 to generate Dm8 MARCM clones and simultaneously overexpressing a wild-type form of SREBP (SREBPWT) (G) resulted in no changes of Dm8 dendritic field size, while overexpressing a constitutively active form of SREBP (SREBPCA) decreased Dm8 dendritic field size (H). (I–J) Overexpression of SREBPWT (I), but not SREBPCA(J), rescued the dendritic phenotypes of Tor mutant Dm8 neurons. Overexpressing a dominant negative form of InR (U-InRDN) in Tor mutant (L) or otherwise wild-type (M) Dm8s decreased dendritic field size. (N) Box plot showing dendritic field sizes of wild-type and various mutant Dm8 neurons. *p<0.05; ns, not significant; unpaired Student’s t-test. N; the number of cells scored for each genotype. (O) A schematic drawing depicts the core components in the insulin/Tor signaling pathways that regulate Dm8 dendritic field size. The tested components shown with grey shading are not required for Dm8 dendritic field size regulation. Dashed lines indicate probable but unconfirmed cascades.
Figure 2—figure supplement 1
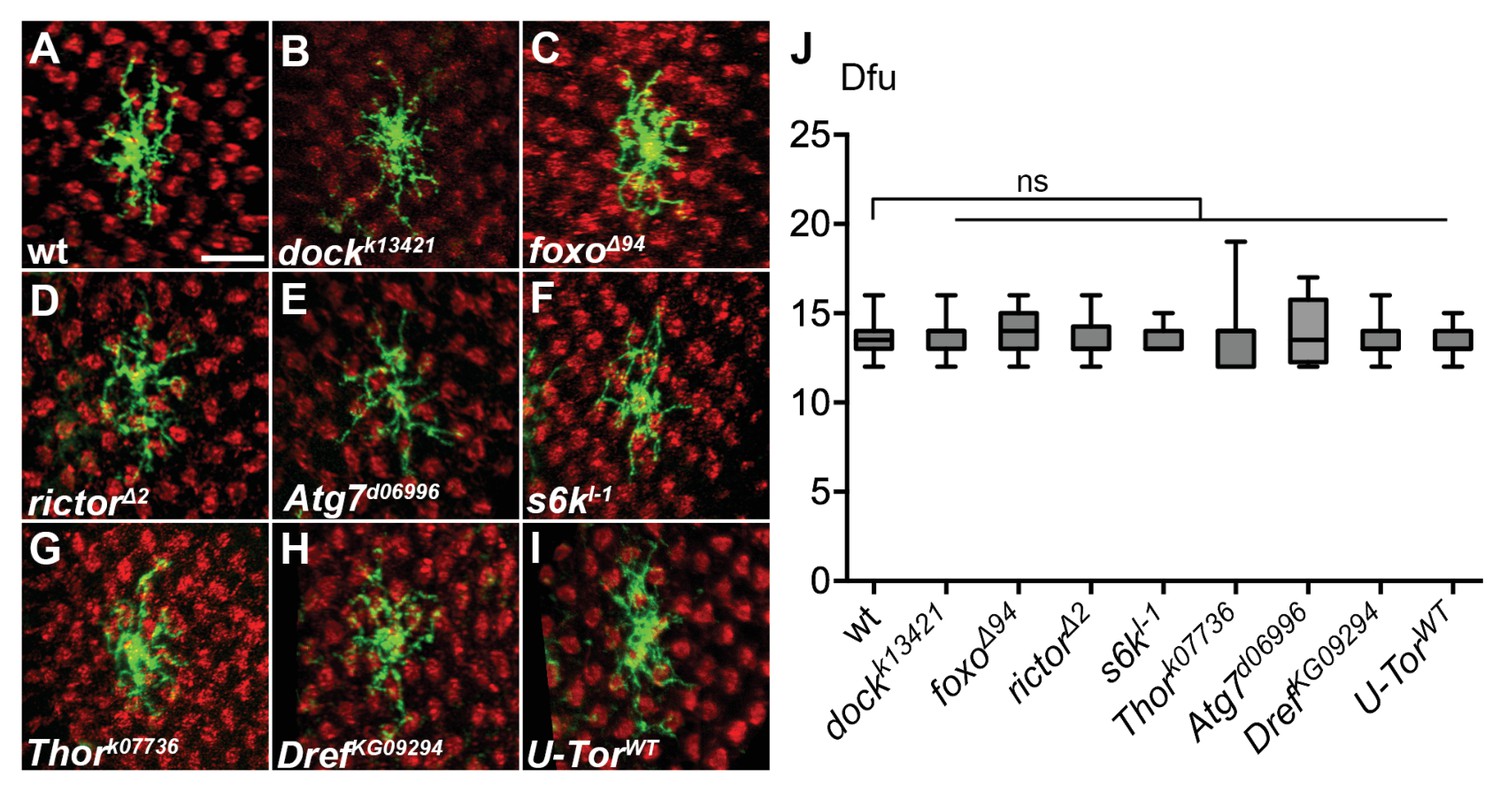
Genetic mutations of several components in the insulin/Tor signaling cascade do not alter Dm8 dendritic field size.
(A–G) Mutation of the potential components in the insulin/Tor pathway caused no defects of Dm8 dendritic field size. Single wild-type (A), dock (B), foxo (C), rictor (D), Atg7(E), s6k (F), Thor (G), Dref (H) mutant Dm8s (green) were generated by the MARCM method and examined in adults. The photoreceptors were labeled by anti-24B10 (red). Scale bar, 10 μm. (I) Overexpression of a wild-type form of Tor (TorWT) has no effect on Dm8 dendritic field size. (J) Box plot showing the cell body sizes of adult wild-type and mutant Dm8 neurons. None of these potential insulin/Tor signaling pathway components were required for Dm8 dendritic field elaboration. *p<0.05, ns, not significant; Student’s t-test.
Figure 3 with 1 supplement
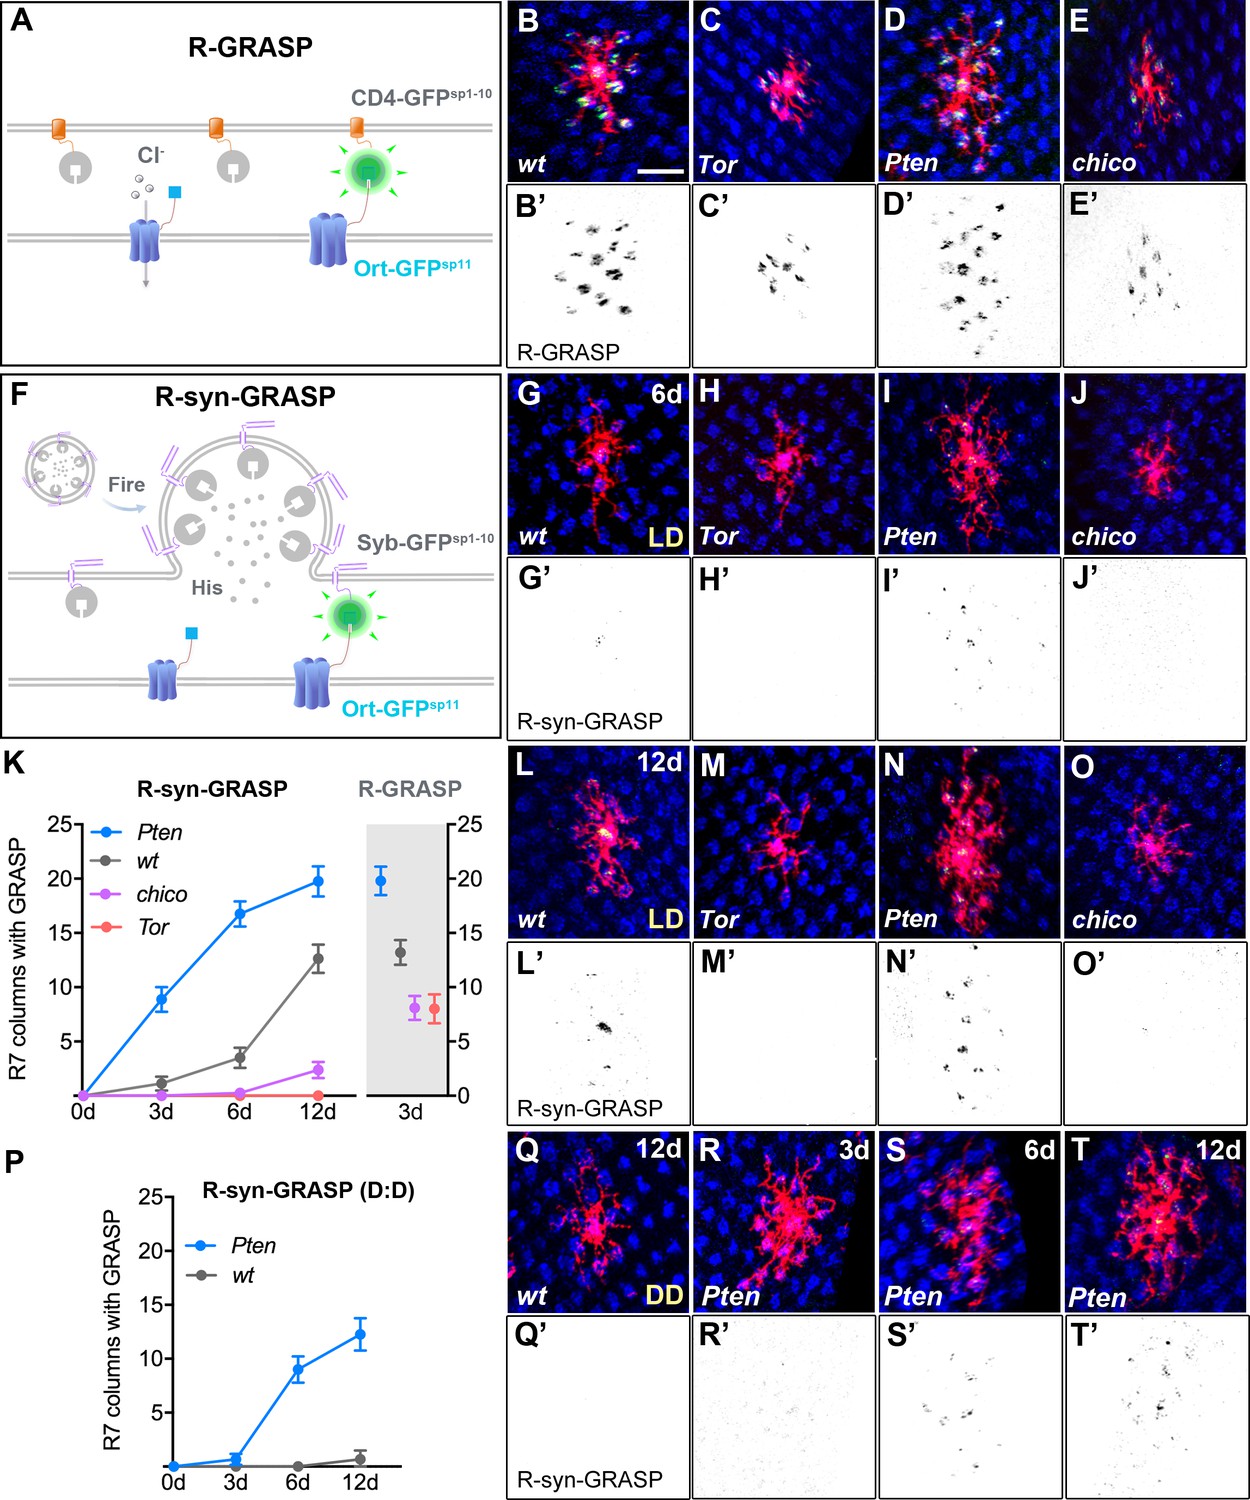
Defects in Dm8 dendritic fields caused aberrant synaptic connections with R7 photoreceptors.
(A–E) Defective dendrites of Tor, Pten and chico mutant Dm8 neurons exhibit altered membrane contacts with R7 photoreceptors, revealed by the ‘receptor-based’ version of GFP Reconstitution Across Synaptic Partners technique (R-GRASP). (A) A schematic illustration of R-GRASP is shown. Membrane tethered spGFP1-10 (CD4-GFPsp1-10) (grey) is expressed in presynaptic neurons (R7s), while the other GFP fragment (blue), spGFP11 fused to histamine receptor Ort (Ort-GFPsp11), is expressed at postsynaptic neurons (Dm8). Functional reconstitution of the two GFP fragments generates fluorescent GFP (green), indicating neuronal contact sites. (B–E) The R-GRASP technique was applied to monitor neuronal contacts between R7 photoreceptors and their postsynaptic Dm8 partners in single wild-type (B, B'), Tor mutant (C, C'), Pten mutant (D, D') and chico mutant (E, E') Dm8 neurons. The photoreceptor R7 axons were labeled with anti-24B10 (blue), and the Dm8 MARCM clones were labeled by mCD8Cherry (red). The R-GRASP signal between R7 and single Dm8 cells is shown in green. Tor (C, C') and chico (E, E') mutations in Dm8 neurons diminished the number and area of contact with R7 cells, while Pten (D, D') mutation in Dm8 neurons significantly increased the contact number. (F) A schematic illustration of the neurotransmitter ‘receptor-based’ version of synaptobrevin GRASP (R-synGRASP). Upon neuronal firing, activity-dependent synaptobrevin-fused spGFP1-10 (Syb-GFPsp1-10) in synaptic vesicles become localized to the presynaptic sites and exposed to the Ort-GFPsp11 expressed at postsynaptic sites. Reconstitution of the two GFP fragments in the synaptic cleft generates functional GFP to indicate active synapses. (G–O) Dendritic defects in Tor, Pten and chico mutant Dm8 neurons caused synaptic defects, as revealed by R-synGRASP under a 12 hr light-dark cycle (L:D). R-synGRASP between R7 and Dm8 neurons was monitored in 6-day-old (G, G') and 12-day-old (L, L') wild-type flies, 6-day-old (H, H') and 12-day-old (M, M') Tor mutants, 6-day-old (I, I') and 12-day-old (N, N') Pten mutants, and 6-day-old (J, J') and 12-day-old (O, O') chico mutant Dm8 neurons. (G, G', L, L') 6-day-old and 12-day-old wild-type flies exhibited the most prominent GRASP signal in the central R7 column. (H, H', M, M') Tor mutation in Dm8 neurons caused a complete loss of active synapses with R7 photoreceptors. (I, I', N, N') Pten mutation in Dm8 neurons resulted in aberrant synapse formation with R7 photoreceptors. (J, J', O, O') chico mutant Dm8 neurons exhibited significantly decreased number of active synapses with R7 photoreceptors. (K) Quantification of R-synGRASP in 0- to 12-day-old flies and quantification of R-GRASP in 3-day-old flies under a 12 hr light-dark cycle (L:D cycle). Pten mutant Dm8 neurons displayed R-synGRASP signal in consistently more R7 columns, while chico and Tor mutants exhibited R-synGRASP signal in fewer R7 columns. The R-synGRASP signals in Pten mutant and wild-type 12-day-old flies were comparable to R-GRASP in 3-day-old flies. (P–T) Pten mutant Dm8 neurons form synapses with R7 photoreceptors under constant darkness (D:D cycle). (P) R-synGRASP signal was quantified in wild-type and Pten mutant Dm8 neurons of flies raised in constant darkness. R-synGRASP signal was nearly absent in 12-day-old wild-type neurons (Q, Q'). In contrast, GRASP signal appeared in 3-day-old Pten mutant Dm8 neurons (R, R') and became stronger in 6-day-old (S, S') and 12-day-old (T, T') adult flies. (B’–E’, G’–J’, L’–O’, Q’–T’) GRASP signals shown in inverted black-and-white images for (B–E, G–J, L–O, Q–T), respectively.
Figure 3—figure supplement 1
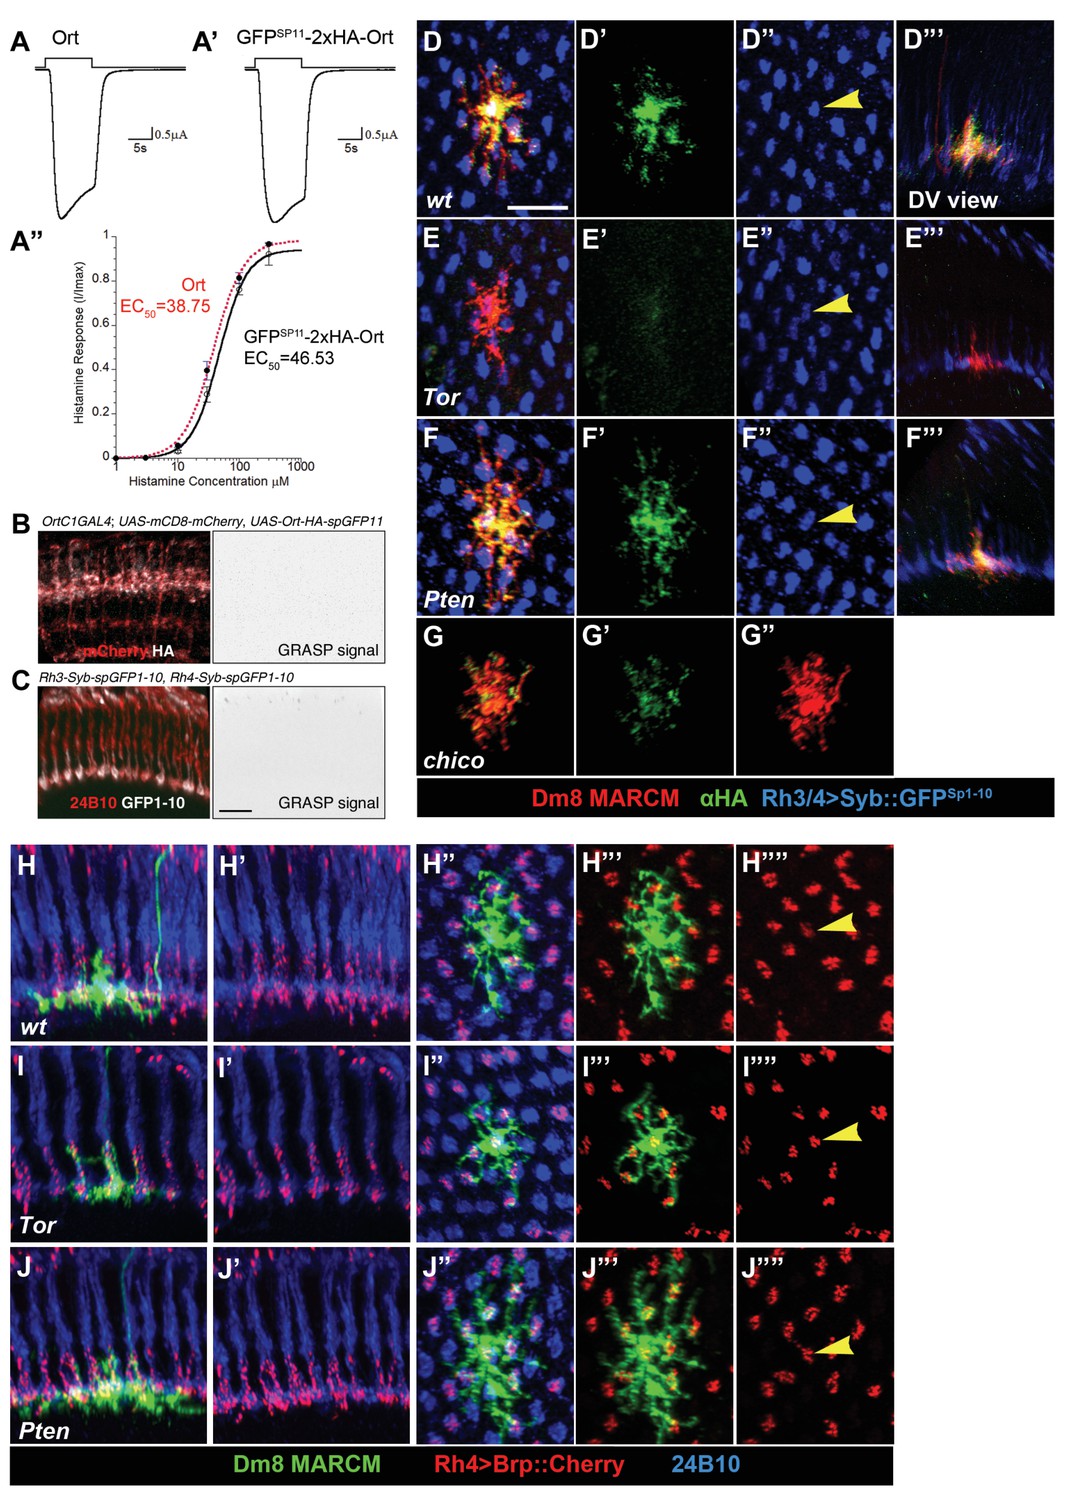
In vitro TEVC recording of GFPSP11-2xHA-Ort and its in vivo expression in wild-type and mutant Dm8 clones in adults.
(A–A”) Ort and GFPSP11::2xHA::Ort display similar efficacies in response to histamine, as measured by in vitro TEVC recording. (A–A’) Responses to 10 µM histamine at −60 mV for wild-type Ort (A) and GFPSP11::2xHA::Ort (A’) recorded from Xenopus oocytes. (A”) Concentration-dependent stimulation of Ort (red) and GFPSP11::2xHA::Ort (black) at −60 mV in response to 1, 3, 10, 30, 100 and 300 µM histamine. Data points show mean ± SD for three cells. (B,C) Negative controls for R-synGRASP. (B) The OrtC1-Gal4 drives the expression of only one component of the split-GFP, GFPSP11-2xHA-Ort, and the membrane maker, mCD8-mCherry (red) in a subset of medulla neurons, giving no GRASP signal (right panel). GFPSP11::2xHA::Ort stained by anti-HA antibody (white) is detectable on the dendrites. (C) The Rh3 promoter drives the expression of the other component of the split-GFP, Syb::GFPsp1-10, in pale R7 photoreceptors, giving no GRASP signal (right panel). Note that the Syb::GFPsp1-10, stained by rabbit polyclonal anti-GFP antibody (white), is concentrated at the synaptic terminals. Photoreceptors were visualized by 24B10 (red). (D–G") Tor mutation reduced in vivo expression of Ort in Dm8 neurons as compared with wild type, while presynaptic synaptobrevin (Syb) expression was unaffected. The single wild-type (D, D', D",D"'), Tor (E, E', E",E"'), Pten (F, F', F",F"'), chico (G, G', G") mutant Dm8 neurons were generated by the MARCM method. Dm8 cells were labeled by mCD8::Cherry (red); Rh3/4::Syb::GFPsp1-10 was labeled by rabbit polyclonal anti-GFP (blue), and GFPsp11::2xHA::Ort was visualized by anti-HA (green). Arrows in D’, E’ and F’ indicate Syb in the central column of Dm8. D’'-F’', dorsoventral views. (H–J"") Presynaptic Bruchpilot (Brp) targeting was unaffected in Tor or Pten mutant Dm8 neurons. The single wild-type (H–H""), Tor (I–I""), Pten (J–J"") mutant Dm8 cells were generated by the MARCM method. Presynaptic active zones were genetically labeled by Brp fused with Cherry RFP (red fluorescent protein) under the Rh4 promoter (red). Photoreceptors were visualized by anti-24B10 (blue). Arrows in H’‘, I’‘, J’’ indicate the central column of each Dm8 neuron.
Figure 4 with 1 supplement
Split-GFP tagging of insulin receptor reveals its endogenous expression pattern in the optic lobe and Dm8 dendrites.
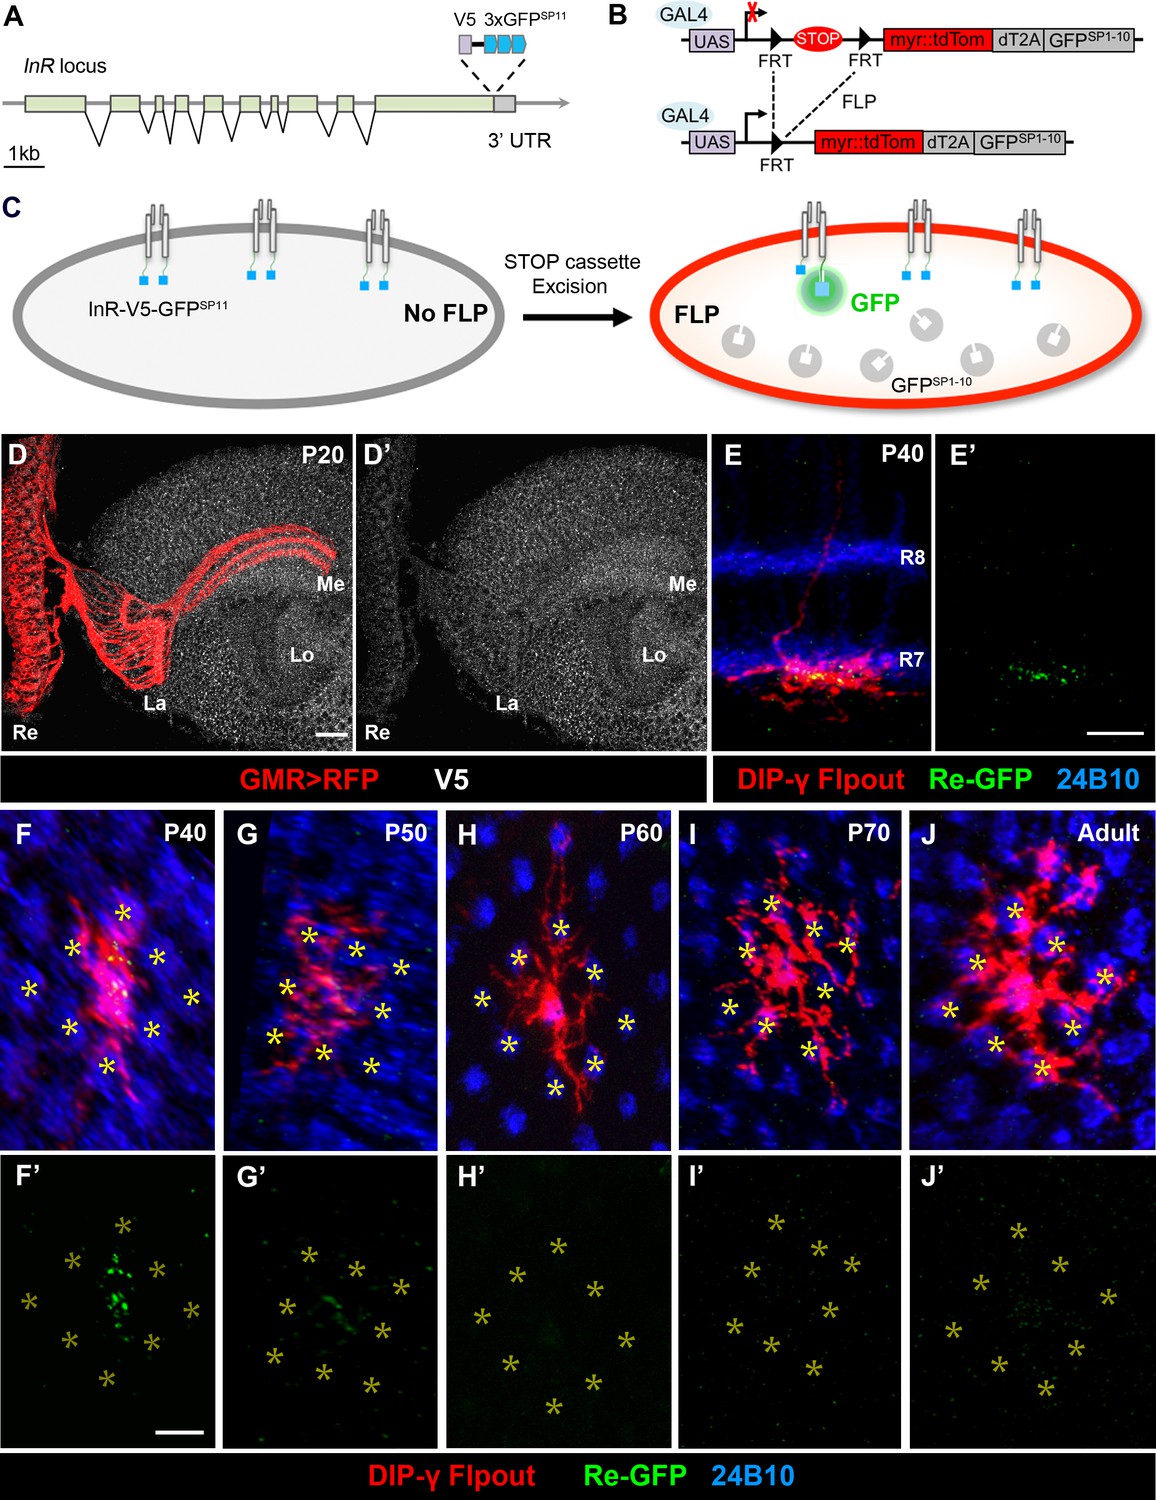
(A–C) Schematics depict the split-GFP tagging strategy to visualize endogenous insulin receptor (InR) expression at single cell resolution. (A) Three copies of split-GFP11 (3x GFPSP11, blue) and a V5 epitope (grey) were inserted into the end of the coding region of the InR locus, immediately before the stop codon. (B) Heat-shock-induced expression of flippase recombinase (FLP) excised the STOP cassette flanked by two FRTs, allowing the targeted neurons to express membrane-tethered tdTomato (myr::tdTom) and split-GFP1-10 (GFPSP1-10) in the cytosol. (C) After excision of the STOP cassette, the targeted neurons express tdTom and GFPSP1-10. The cytosolic GFPSP1-10 binds to GFPSP11 on the intracellular C-terminus of InR, constituting a functional GFP to indicate the location of the endogenous InR. (D–D’) Endogenous InR in the optic lobe was visualized by anti-V5 staining (white) in developing pupae at 20 hr APF (after puparium formation). The photoreceptors were labeled by GMR-Gal4-driven RFP (red). InR was highly expressed in the cell bodies of visual cortex neurons and the neuropils of neurons in the visual system. Re, retina; La, lamina; Me, medulla; Lo, lobula. Scale bar, 10 μm. (E–E’) Endogenous InR is highly expressed in the central area of Dm8 dendrites at 40 hr APF. tdTom (red) labels a single Dm8 flipout clone, which simultaneously expresses GFPsp1-10 after STOP cassette excision. The photoreceptors R7/8 layers and growth cones of R7 were labeled by anti-24B10 (blue). InR, indicated by the prominent GRASP signals (green), was located in the central region of Dm8 dendrites, shown in dorsoventral views. Scale bar, 5 μm. (F–J’) The temporal patterns of endogenous InR expression in Dm8 dendrites surrounded by eight adjacent R7 growth cones (yellow asterisks), shown in proximodistal views. Single Dm8 neurons were labeled by DIP-γ-Gal4 with Flp-FRT flipout system (red). The R7 photoreceptors were labeled with anti-24B10 (blue) and GRASP signals (green). InR is strongly expressed in the central area of Dm8 dendrites at 40 hr APF (F, F'), subsides at 50 hr APF (G, G') and is absence at 60 hr (H, H’), 70 hr (I, I’) APF and adult (J, J').
Figure 4—figure supplement 1
InR is expressed in the growth cones of photoreceptors during pupal stages.
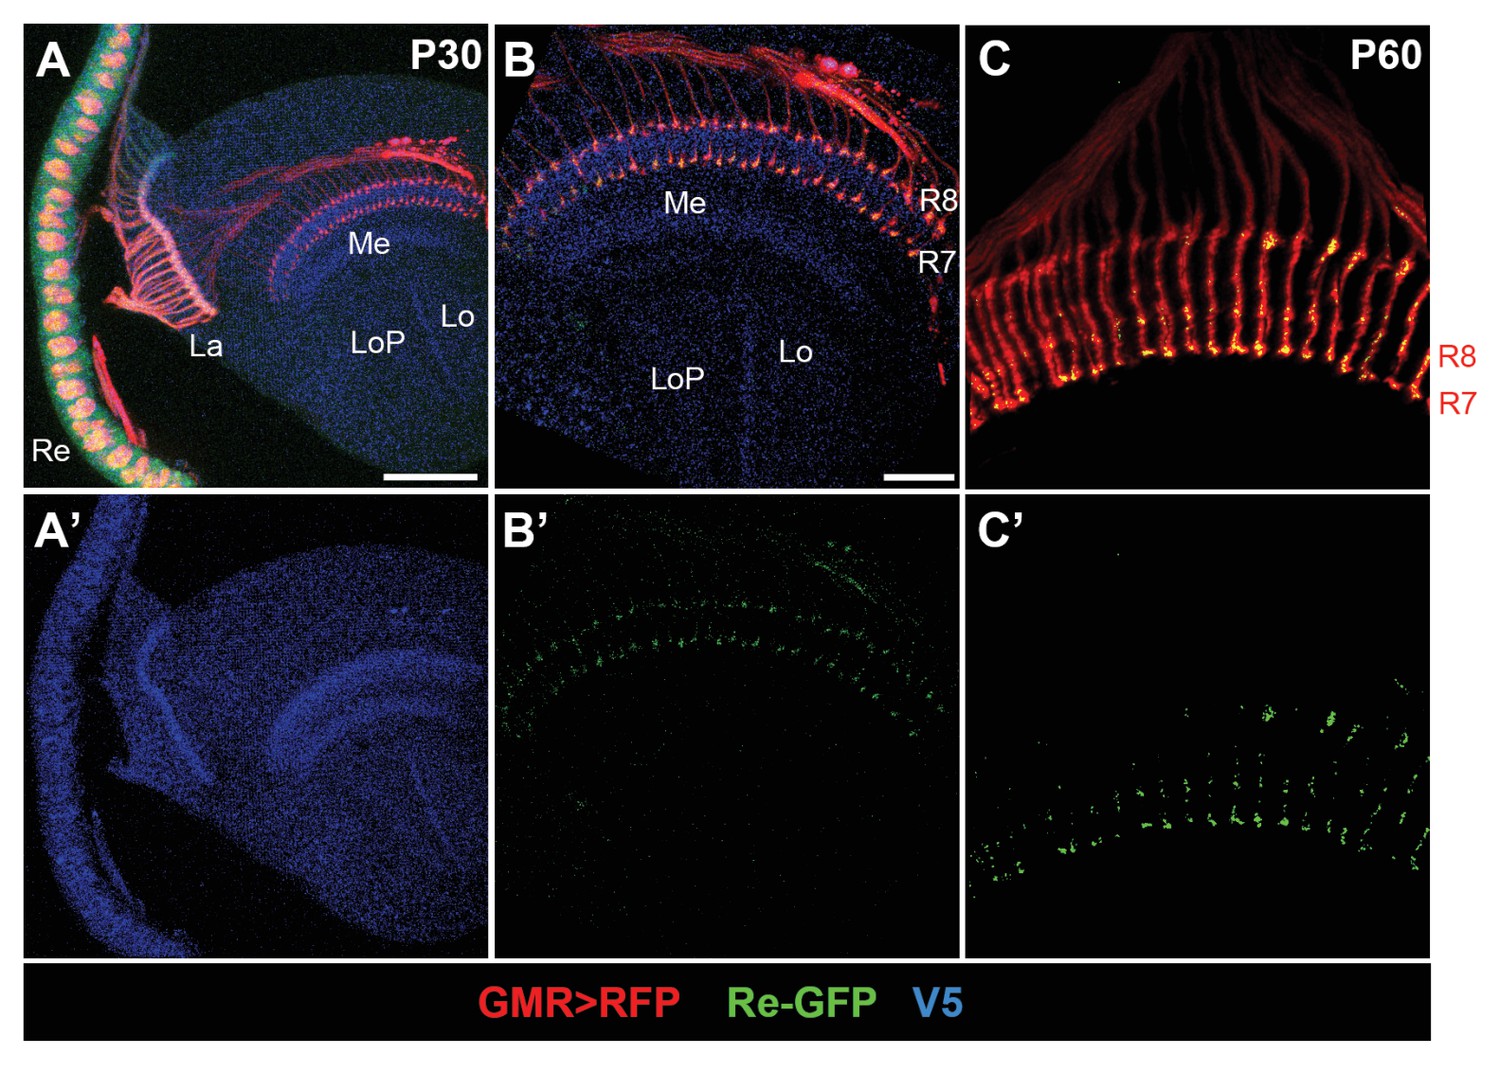
(A–A’) Expression pattern of endogenous InR in the optic lobe of developing pupal brain at 30 hr APF visualized by anti-V5 staining (blue). InR is highly expressed in the visual system. Re, retina; La, lamina; Me, medulla; Lo, lobula; LoP, lobula plate. Scale bar, 50 μm. (B–C’) Subcellular location of endogenous InR protein in the growth cones of photoreceptors as indicated by GRASP signal. The photoreceptors were labeled by GMR-Gal4-driven RFP (red), and InR was visualized by anti-V5 (blue). GFPsp1-10 was expressed in photoreceptors by GMR-Gal4, and the reconstituted GFP signal was strongly present at the growth cones of photoreceptors at 30 and 60 hr APF. Scale bar, 20 μm.
Figure 5 with 1 supplement
DILP2 derived from L5 lamina neurons positively regulates Dm8 dendritic field elaboration.
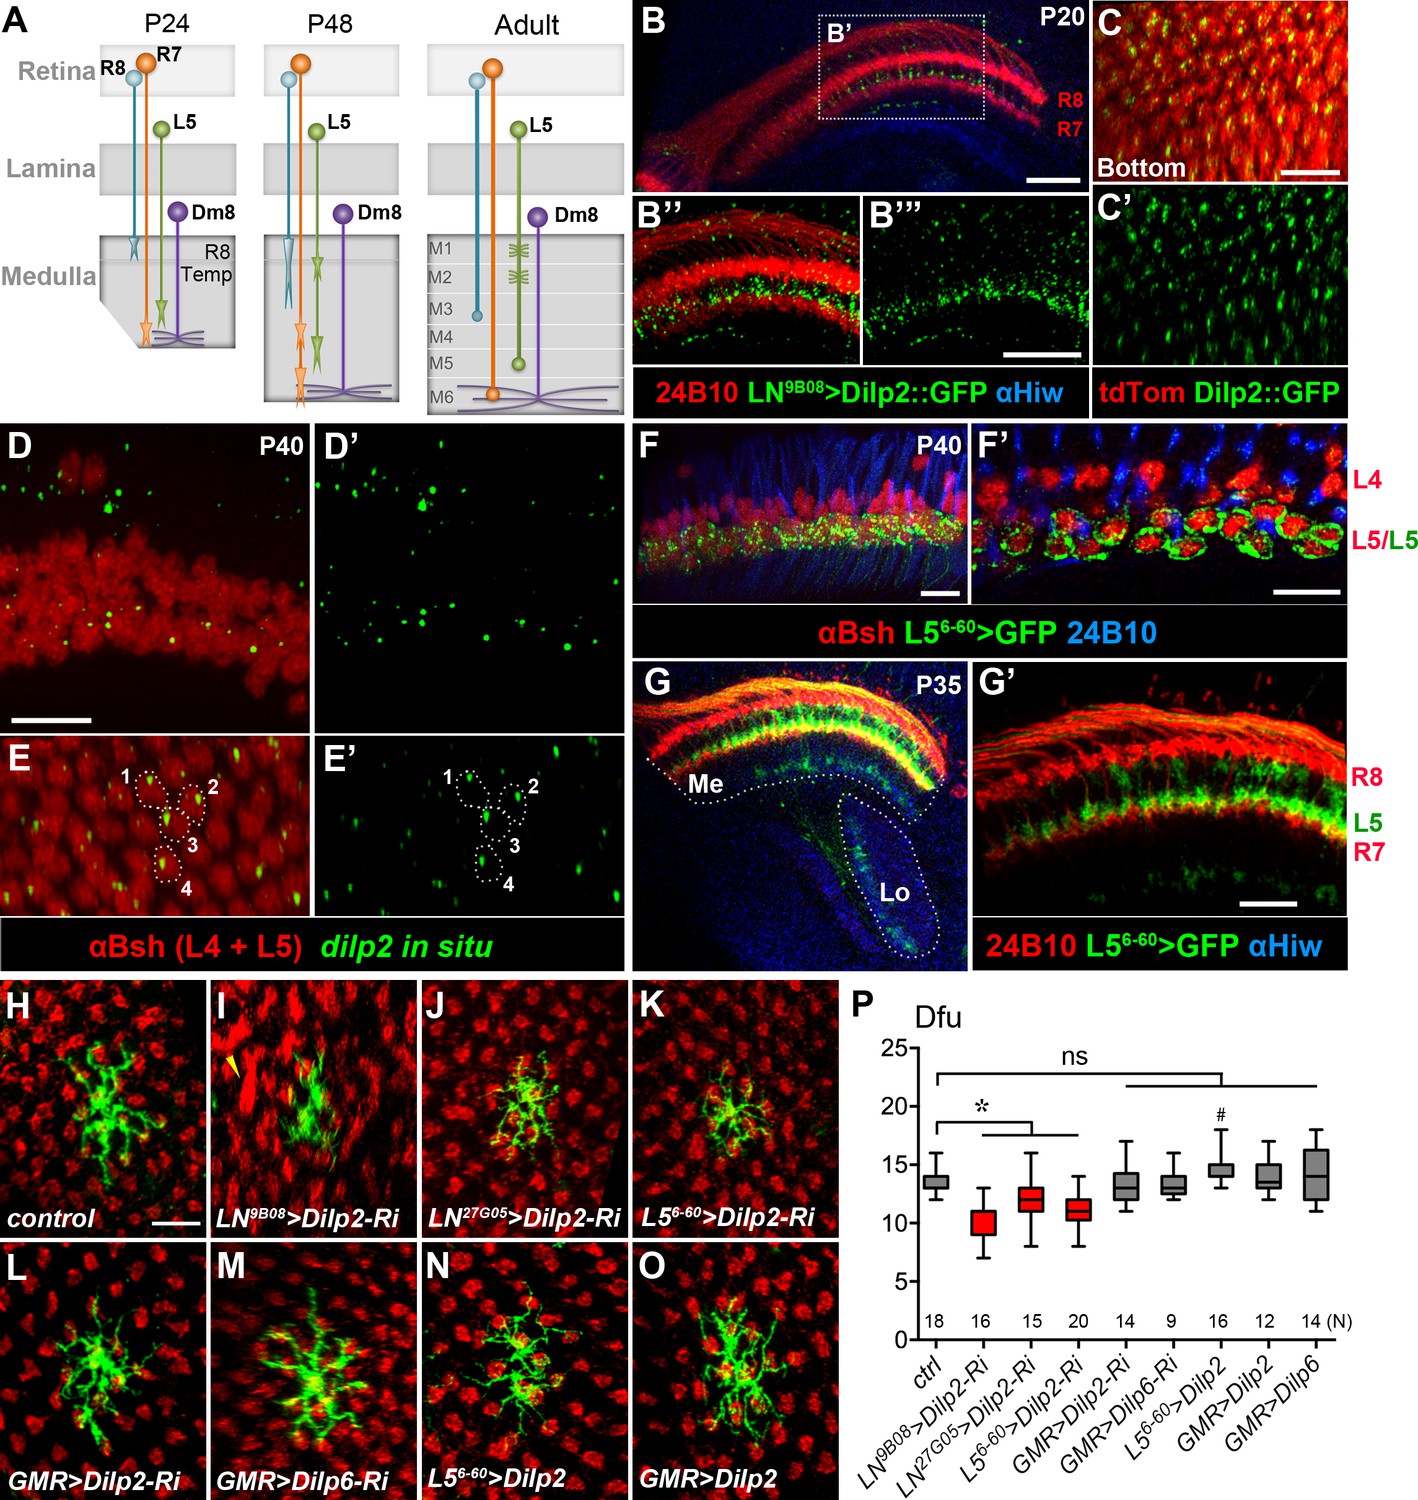
(A) A schematic illustration showing the developmental processes of R7 and R8 photoreceptors, L5 lamina neurons and Dm8 neurons. A Dm8 neuron (purple) expands its dendritic arbors during development to reach its final size. R7 (orange), R8 (cyan) and L5 (green) growth cones undergo dynamic changes at their target locations. R8 growth cones first project to a temporary layer at 24 hr APF and then extend to a deeper layer (M3 in the adult). At 24 hr APF (after puparium formation), R7 growth cones first target the deep medulla layer where Dm8 dendrites reside, and then reshaped and stabilized at the M6 layer in the adult. L5 growth cones extend close to Dm8 dendrites by 24 APF and eventually to the M5 layer at the adult stage. (B–B"') Overexpression of a GFP-tagged DILP2 (green) in LNs led to its accumulation in the deep layer of lamina neurons. Photoreceptors were labeled by anti-24B10 (red), and medulla (Me) and the lobula (Lo) neuropil were labeled by anti-Highwire (Hiw) (blue). Scale bar, 20 μm. (C–C') The GFP-tagged DILP2 (green) is present in the growth cone of lamina neurons (red). The bottom (proximodistal) view is shown. Scale bar, 10 μm. (D–E') In situ hybridization of dilp2 in the developing pupal eye disc. In situ hybridization detected a high level of dilp2 mRNA (green) in the developing L5 lamina neurons (red) which were labeled by anti-Bsh immunostaining (red). Anti-Bsh also labeled the nuclei of L4 lamina neurons (the upper row) in addition to L5’s (the lower row). Side view (D, D') and bottom view (E, E') are shown. The dilp2 mRNA was located in the cytosol adjacent to the nucleus of L5, as shown in E and E'. Scale bar, 10 µm (in D). (F–F') The L5 cell bodies were labeled using 6–60 Gal4 driving the mCD8GFP marker (green). Photoreceptors were labeled by anti-24B10 (blue) as landmarks. (F') shows a single z-section in (F). Scale bar, 10 µm. (G–G') 6–60 Gal4 labeled L5 processes (green) in the medulla (Me), anti-24B10 staining R7/R8 (red) and anti-Hiw (blue) for neuropil landmarks. Scale bar, 10 µm (in G’). 6–60 Gal also labeled few trans-medulla neurons with processes in the medulla and lobula. (H–O) RNAi-mediated dilp2 knockdown in pan-lamina neurons or L5s caused Dm8 dendritic field reduction, as examined in adults. Single flipped-out Dm8 clones (green) with dilp2-RNAi alone (H) or driven two pan-LN driver, 9B08-Gal4 (I) and 27G05-Gal4 (J), or L5-specific 6–60 Gal4 (K), or photoreceptor-specific GMR-Gal4 (L). Misalignment of photoreceptor terminals was consistently observed with pan-LN knock-down of dilp2 (yellow arrow). (M) GMR-Gal4-driven dilp6-RNAi had minimal effects on Dm8 dendrites. (N–O) Overexpression of dilp2 in L5s or photoreceptors did not significantly alter Dm8 dendritic field sizes. Scale bar, 10 μm (in H). (P) Box plot showing the dendritic field sizes of Dm8 neurons in wild-type and dilp manipulations. Dilp2 knock-down in pan-lamina neurons or L5 neurons specifically reduced the Dm8 dendritic fields. *p<0.05; #p=0.002; ns, not significant, unpaired Student's t-test. N; the number of cells scored for each genotype.
Figure 5—figure supplement 1
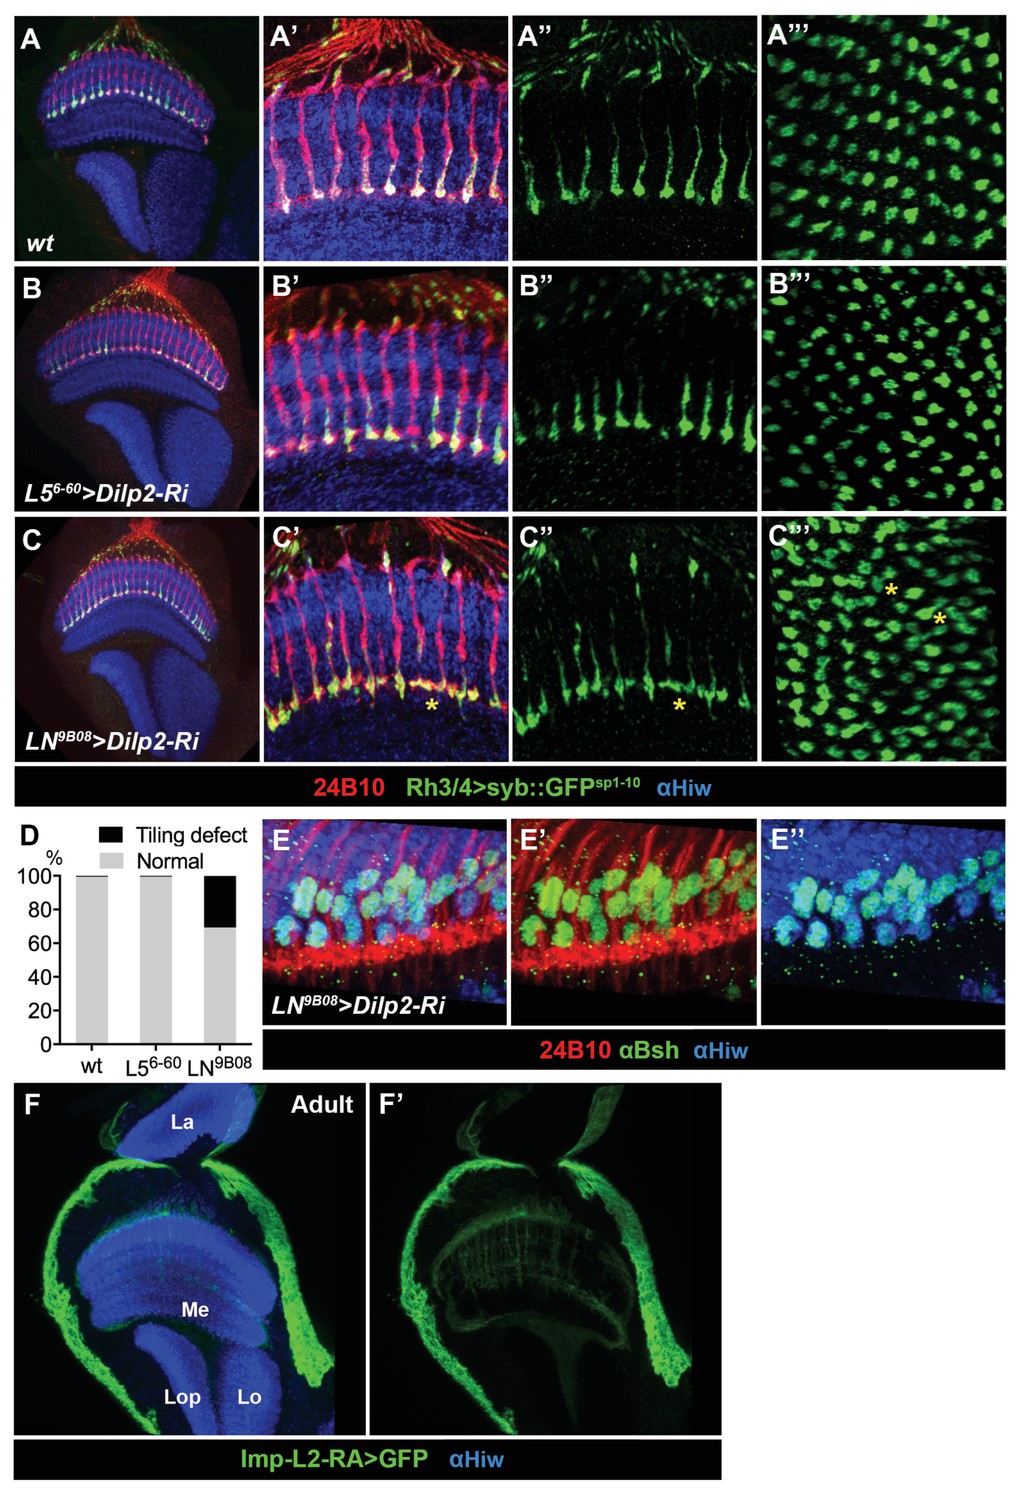
RNAi-mediated knockdown of dilp2 in lamina neurons caused tiling phenotype of photoreceptor R7.
(A–D) The axon terminals of R7 photoreceptors displayed tiling defects after knockdown of dilp2 by the pan-LN 9B08-Gal4, but not the L5-specific 6–60 Gal4 driver. Photoreceptors were visualized by anti-24B10 (red), and R7 axon terminals were labeled by a transgene Rh3/4-Syb::GFPsp1-10 with polyclonal anti-GFP staining (green). Neuropils were labeled by anti-Hiw (blue). The bottom views of R7 terminals are shown for wild type (A"'), knockdown of dilp2 by 6–60 Gal4 (B"'), and knockdown of dilp2 by 9B08-Gal4 (C"'). (D) Quantification of terminal fusion of R7 photoreceptors in adult wild-type and flies with dilp2 knockdown by 6–60 Gal4 and 9B08-Gal4. (E–E'') Knockdown of dilp2 by 9B08-Gal4 did not cause cell death of lamina neurons. The nuclei of lamina neurons are labeled by anti-Elav (blue), and co-stained with anti-Bsh (green) for L4 and L5. The photoreceptors are labeled by anti-24B10 (red). (F–F') The insulin-binding protein Imp-L2 is highly expressed in the surface glia of the adult optic lobe. Imp-L2 expression was visualized by the Imp-L2-Gal4 driving a mCD8-GFP (green), and co-stained with anti-Hiw (blue) to label the neuropil. La, lamina; Me, medulla; Lo, lobula; Lop, lobula plate.
Figure 6
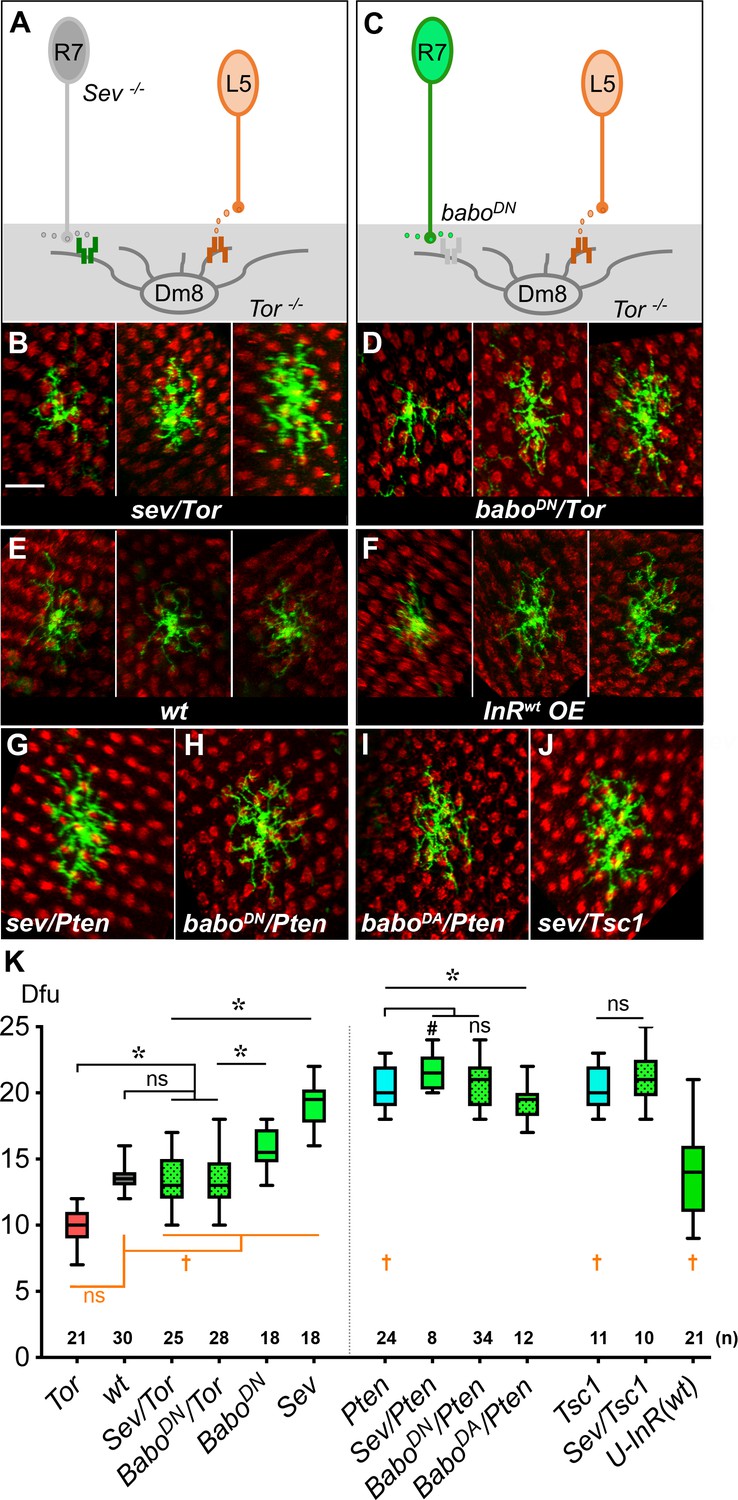
Insulin/Tor signaling operates in parallel with Activin/Baboon signaling to control Dm8 dendritic field sizes.
(A–B) Blocking both insulin and Activin signaling in Dm8s resulted in an additive effect and highly variable dendritic field sizes. (A) An illustration depicts Tor mutant Dm8s, which receive but can’t respond to L5-derived DILP2, in the sevenless (sev) mutant background which ablates R7s, hence the source of Activin. (B) Three examples of Tor mutant Dm8s in the sev background. The dendritic fields of sev/Tor mutants displayed great variation, spanning from 10 to 17 dfu, while the average was comparable to wild type. Single Tor mutant Dm8 neurons were generated using the Flp-MARCM system and labeled with mCD8GFP (green), and examined in adults. (C–D) Ectopic expression of a dominant negative Babo (BaboDN) in Tor mutant Dm8 neurons recapitulated the variability phenotypes of the sev/Tor double mutation. (C) An illustration depicts that ectopic expression of BaboDN in Tor mutant Dm8s (BaboDN/Tor) prevents Dm8s from responding to both L5-derived DILP2 and R7-derived Activin. (D) Three examples of the BaboDN/Tor mutant Dm8 neurons. Tor mutant Dm8s expressing the dominant negative form of Baboon (BaboDN) were generated using the Flp-MARCM system and the DIP-γ-Gal4 driver. Dm8 dendritic fields of BaboDN/Tor mutants are highly variable in sizes, spanning 10–18 dfu while the average size was comparable to wild type (E). (F) Expressing insulin receptors in single Dm8s throughout pupal stages led to highly variable dendritic field sizes. (G–J) Single Dm8 mutant clones were labeled with Flp-MARCM with various genetic manipulations on insulin and Activin signaling. (G) Pten mutant Dm8 in the sev background (Sev/Pten); (H) Pten mutant Dm8 ectopically expressing BaboDN, a dominant negative form of Baboon (BaboDN/Pten); (I) Pten mutant Dm8 expressing BaboDA, a dominant active form of Baboon (BaboDA/Pten); and (J) Tsc1 mutant Dm8 in the sev background (Sev/Tsc1). The double mutants of sev/Pten, BaboDN/Pten, and Sev/Tsc1 resembled single mutations of Pten or Tsc1, while BaboDA/Pten moderately reduced the Dm8 dendritic field sizes as compared with Pten mutation. Photoreceptor axon terminals were labeled by anti-24B10 staining for landmarks (red). Scale bar, 10 μm (in B for B-J). (K) Box plot showing the dendritic field sizes of Dm8 neurons in wild type and mutants. Analysis of means (colored in black): *p<0.05; ns, not significant, unpaired Student's t-test. Analysis of variance (in orange): †p<0.05; ns, not significant, Conover test and Siegel-Turkey test.
Figure 7 with 1 supplement
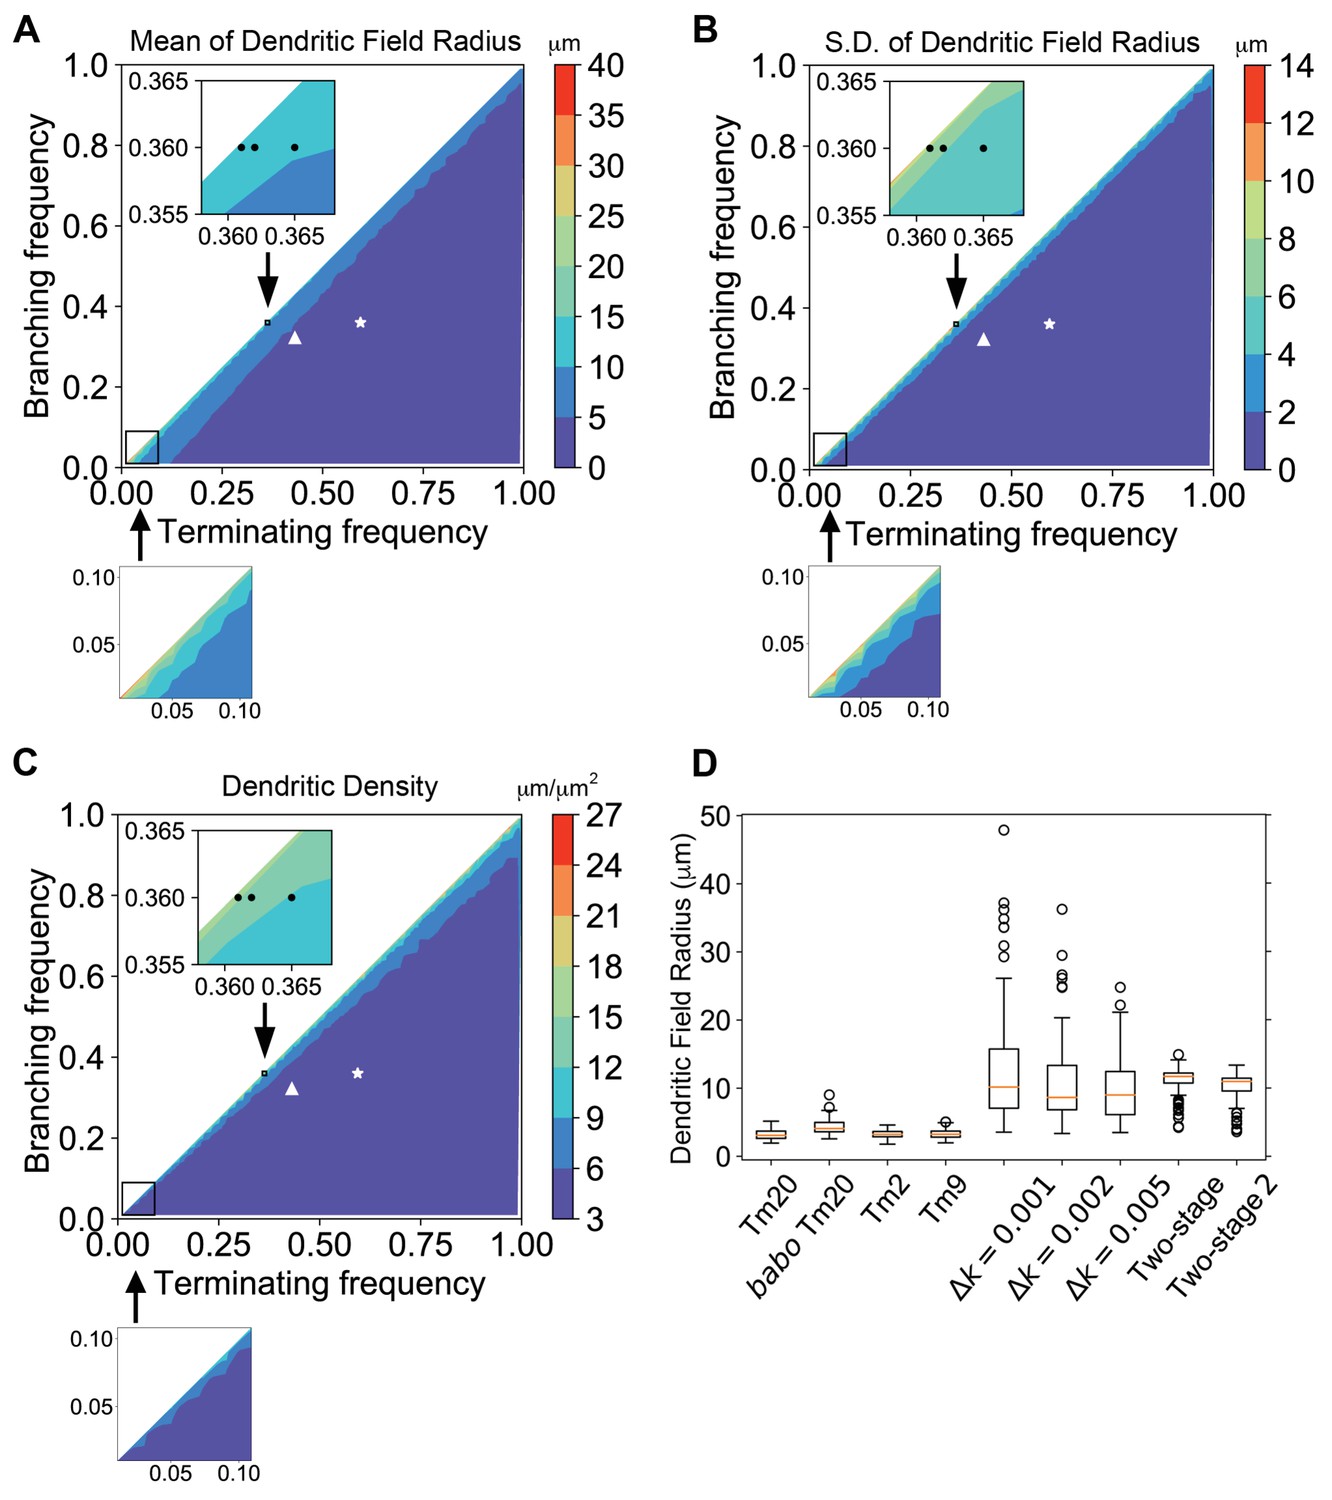
Dendritic growth simulation reveals the relationship between kinetic parameters and field sizes and variability.
Stochastic dendritic growth was simulated with broad branching (kb) and terminating (kt) rate parameters and the radii of the resulting dendritic fields (R95) were calculated as the distance of 95th percentile of all terminal points to the origin. (A,B,C) Heat maps show the mean (A), standard variation (B) and density (C) in the R95 radius. Color bars display the color range as indicated. White stars and triangles indicate the position of reported parameters for wild-type and the babo mutant Tm20, respectively (Ting et al., 2014). Black dots in the zoomed inset indicate the trial parameter sets for generating large neurons, correspond to branching rate kb = 0.360 μm−1 and terminating rate kt = 0.361, 0.362, and 0.365 μm−1 (from left to right), respectively. In the bottom row are zoom-in for the lower-left corner for very low branching and terminating rates, with the same color cues as the corresponding top panels. (D) R95 distributions of 100 simulated neurons for Tm20 (wild type and babo mutant), Tm2, and Tm9 with their parameters reported previously, followed by tests with kb = 0.36 μm−1 and kf = 0.361, 0.362, and 0.365 μm−1, respectively. For the two-stage model, kt was kept at 0.4 μm−1 and kb started with 0.42 μm−1 initially, and switched to 0.36 μm−1 at the second stage; for the two-stage-2, the kt raises to 0.42 μm−1 at the second stage.
Figure 7—figure supplement 1
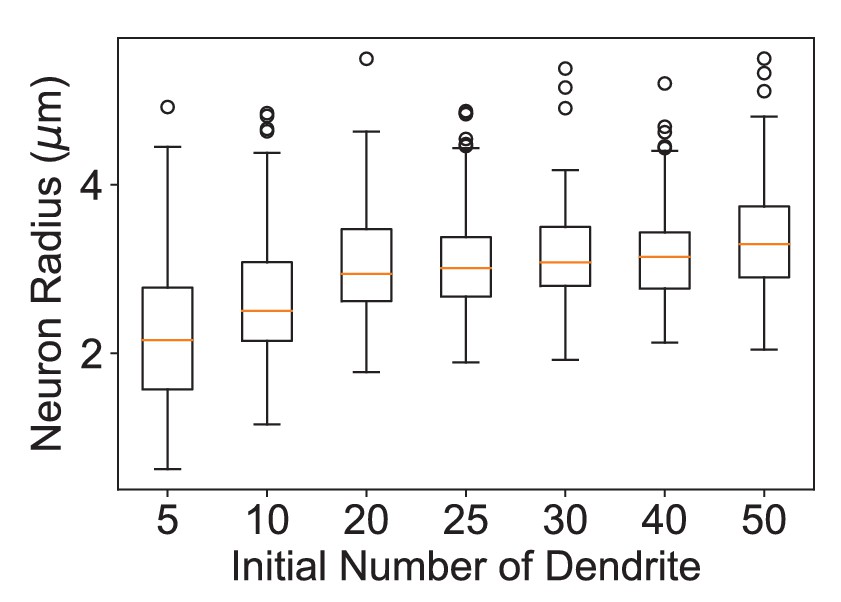
Dendritic growth simulation with different numbers of initial dendrites.
Distributions of the radii of dendritic fields of 100 neurons simulated using different numbers of initial dendrites and the parameters for the wild-type Tm20 neuron (kb = 0.360 μm−1 and kt = 0.594 μm−1). The sizes of dendritic fields are relatively insensitive to the number of initial dendrites over 20.
Figure 8

Antagonistic regulation of Dm8 dendritic field arborization by two afferent-derived factors, Activin and DILP2.
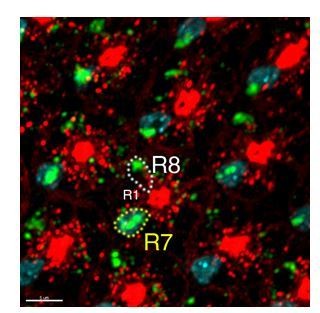
(A) Two afferent-derived factors, Activin and insulin-like peptide2 (DILP2), signal to Dm8 amacrine neurons to control their dendritic field elaboration. Activin is provided by R7 photoreceptors, the major synaptic partners of Dm8 neurons. DILP2, on the other hand, is provided by L5 lamina neurons, which form few or no synapses with Dm8 neurons. During early developmental stages, L5-derived DILP2 locally activates InR on the Dm8 dendrites and facilitates its dendritic field expansion. In contrast, R7-derived Activin acts on Baboon in Dm8 dendrites to restrict its dendritic elaboration by increasing dendritic terminating frequency. The antagonistic regulation by DILP2 and Activin contributes to the robust and stereotyped morphology of Dm8 dendrites. (B) The relationship between dendritic developmental parameters (terminating and branching frequencies) and growth/robustness is shown. In the green area, the difference between the terminating and branching frequencies is small and dendritic growth is favored at the cost of robustness. Conversely, a large difference between the terminating and branching frequencies (orange area) ensures well-controlled size at the cost of overall sizes. The elaboration of large and consistent sizes of dendritic fields can be achieved by temporal and/or spatial segregation of these two phases, for example, by favoring growth in the early stages or in the center of the dendritic field.
Author response image 1
In situ hybridization of Activin of developing eye discs..
Author response image 2
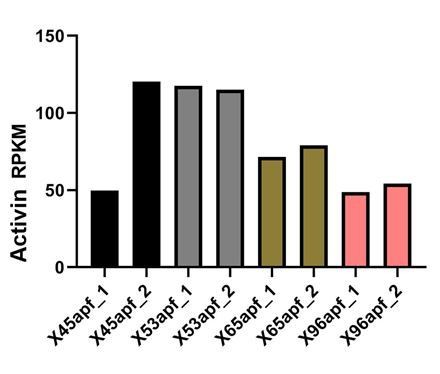
Activin mRNA levels in developing R-cells (Zhang et al., 2016)..
Author response image 3
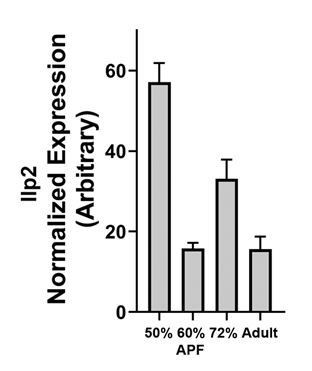
Dilp2 mRNA levels in developing lamina..
Additional files
-
Source code 1
Simulation programs.
- https://cdn.elifesciences.org/articles/50568/elife-50568-code1-v1.zip
-
Supplementary file 1
Summary of experimental genotypes.
- https://cdn.elifesciences.org/articles/50568/elife-50568-supp1-v1.docx
-
Supplementary file 2
Statistics.
- https://cdn.elifesciences.org/articles/50568/elife-50568-supp2-v1.docx
-
Supplementary file 3
Key Resources Table.
- https://cdn.elifesciences.org/articles/50568/elife-50568-supp3-v1.docx
-
Transparent reporting form
- https://cdn.elifesciences.org/articles/50568/elife-50568-transrepform-v1.pdf
Download links
A two-part list of links to download the article, or parts of the article, in various formats.
Downloads (link to download the article as PDF)
Open citations (links to open the citations from this article in various online reference manager services)
Cite this article (links to download the citations from this article in formats compatible with various reference manager tools)
Antagonistic regulation by insulin-like peptide and activin ensures the elaboration of appropriate dendritic field sizes of amacrine neurons
eLife 9:e50568.
https://doi.org/10.7554/eLife.50568


