Large-scale state-dependent membrane remodeling by a transporter protein
- National Heart, Lung and Blood Institute, National Institutes of Health, United States
- National Institute of Neurological Disorders and Stroke, National Institutes of Health, United States
Figures
Figure 1 with 1 supplement
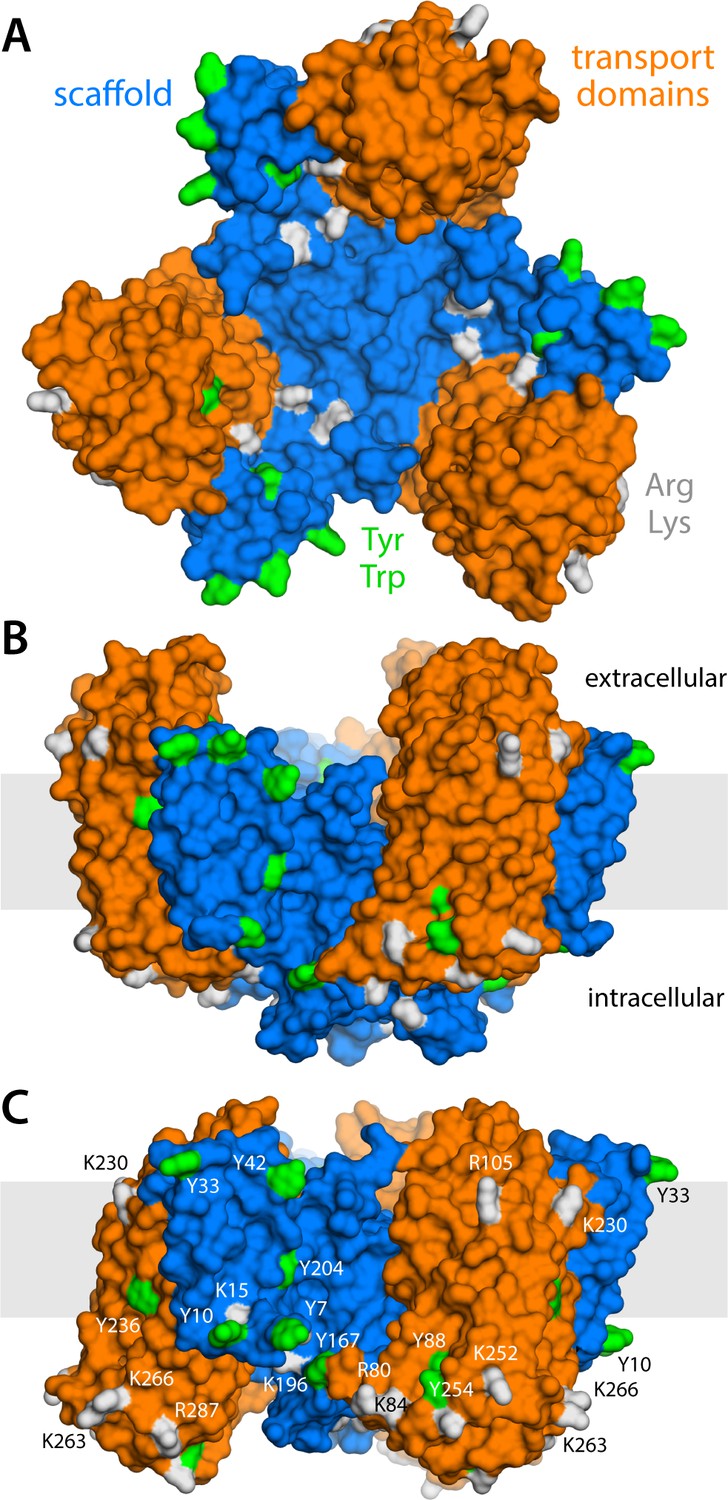
Structure of the GltPh trimer in the outward- and inward-facing states.
(A) View from the extracellular space, with the three protomers in the outward-facing conformation (PDB 2NWL). The ‘scaffold’ (blue) mediates all protein-protein interactions between protomers. The ‘transport’ domains (orange) carry the bound substrates, moving relative to the scaffold perpendicularly to the membrane. Side-chains that might form hydrogen-bonds with lipid headgroups are highlighted (Tyr, Trp, Arg, Lys). (B) Same as (A), viewed along the membrane plane, with the approximate membrane region shown as a gray box. (C) Same view as (B), with all three protomers in the inward-facing conformation (PDB 3KBC).
Figure 1—figure supplement 1
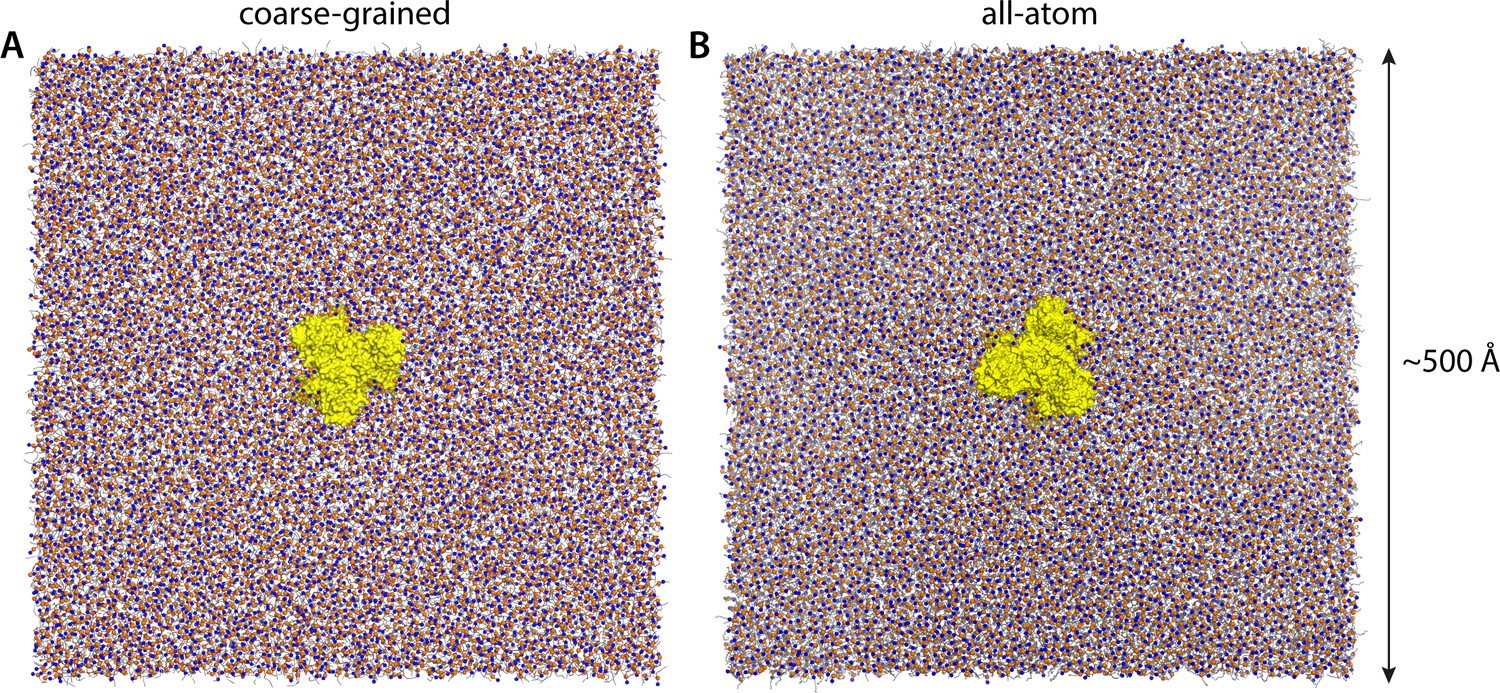
Molecular simulation systems.
(A) Coarse-grained representation of all-inward GltPh (yellow surface) in a model POPC membrane (298 K), viewed from the extracellular space. Phosphate and choline groups are highlighted with orange and blue spheres, respectively. The system amounts to ~260,000 particles, including ~7500 lipid molecules. Analogous simulation systems were constructed to study states of GltPh with one, two or all three protomers in the outward-facing conformation. (B) All-atom representation of all-inward GltPh, in a DPPC membrane (323 K). This simulation system amounts to ~3,000,000 atoms. Note that the longest dimension of the GltPh trimer is ~80 Å. The solvent is omitted in both panels, for clarity.
Figure 2 with 2 supplements
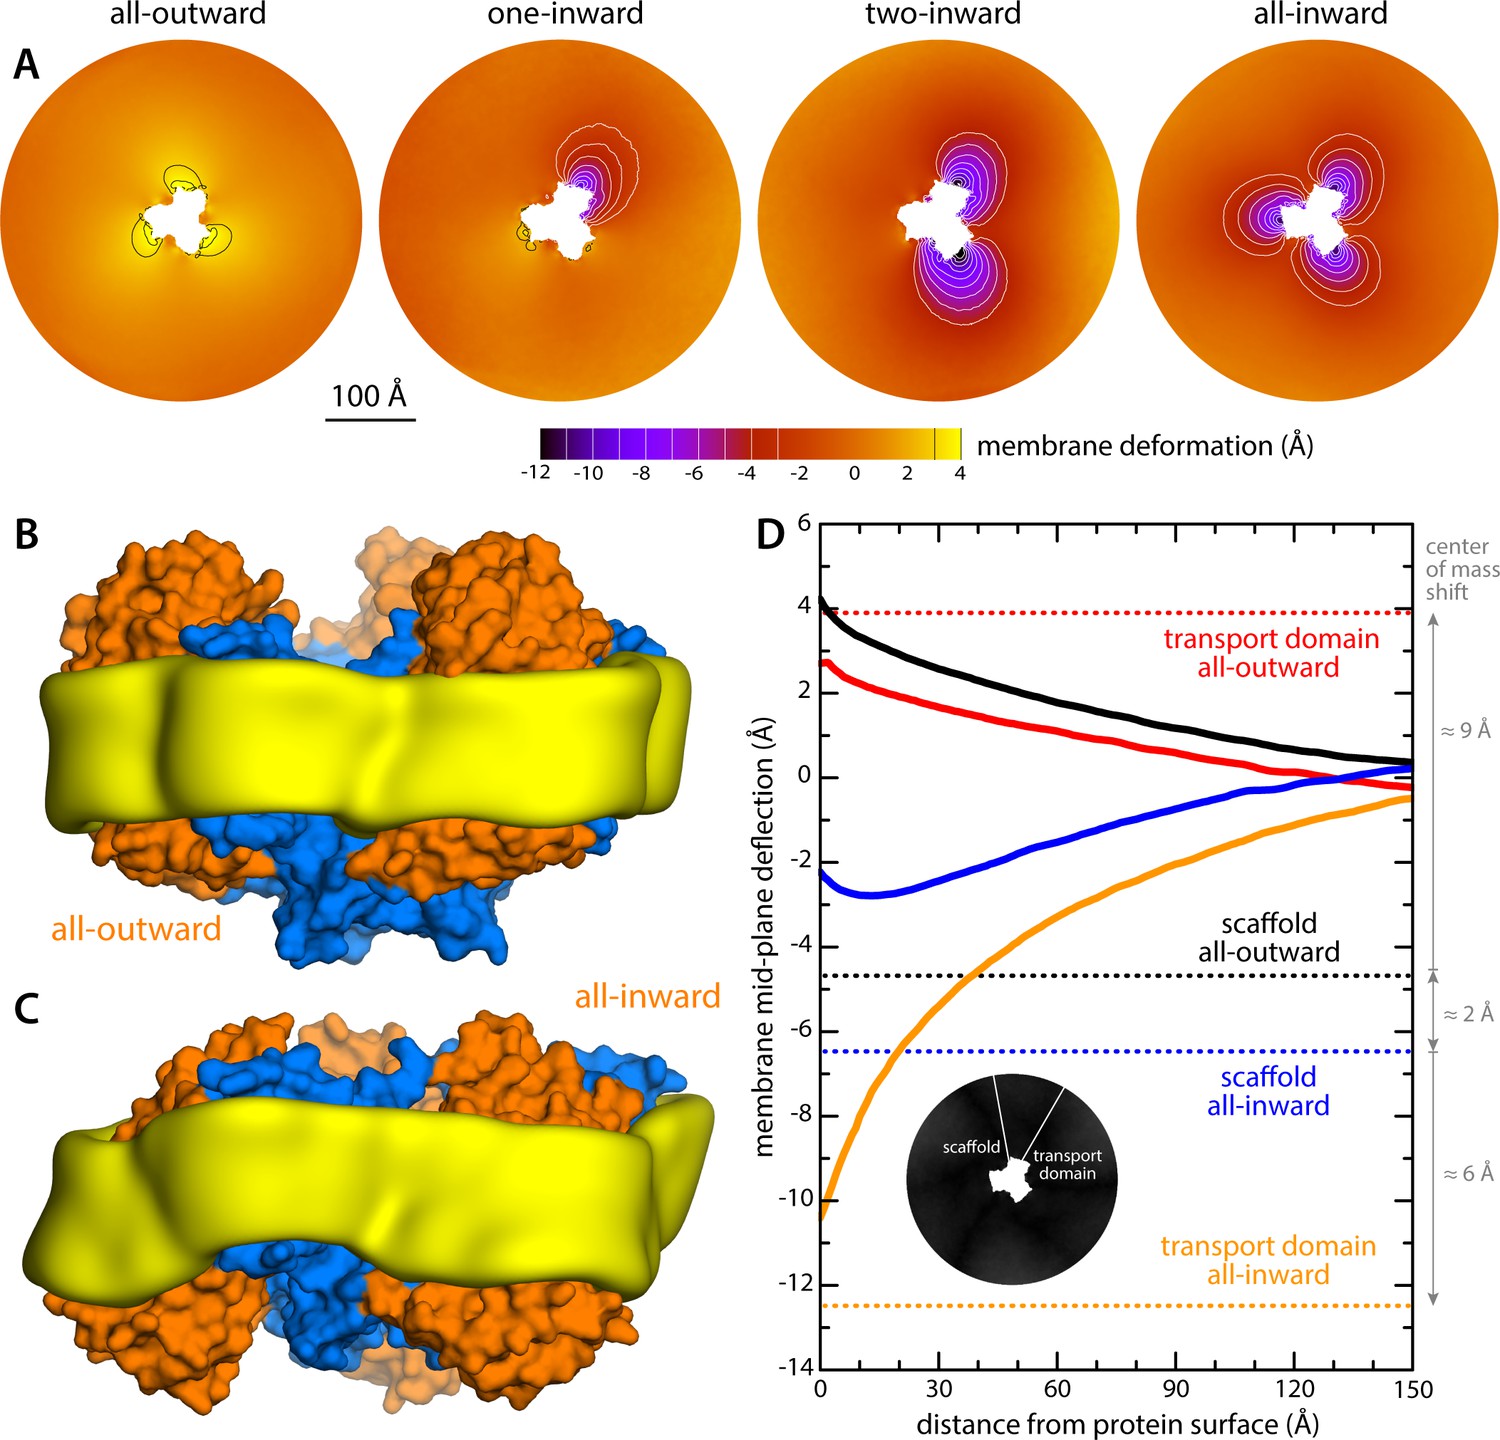
Changes in membrane morphology induced by the conformational cycle of GltPh.
The results are based on coarse-grained MD simulations of the transporter in a POPC bilayer at 298K. (A) Deflection of the membrane mid-plane for each of the primary states in the cycle. The deflection is quantified by calculating the mean value of the Z coordinate of the bilayer across the X-Y plane. The zero-level is set at ~200 Å from the protein center, where the membrane mid-plane is flat, on average. The resulting maps are viewed from the extracellular space. Each map is the mean of N = 3 observations, each of which is a time-average for one simulated trajectory. Positive values reflect an outward deflection; negative values reflect inward bending. Values equal to or greater than ±3 Å are contoured (black/white), for clarity. From left to right, the standard error of the data across each map is, on average, 0.8 Å, 0.8 Å, 0.5 Å and 0.6 Å. (B) Structure of all-outward GltPh (represented as in Figure 1), alongside a calculated density map for the lipid bilayer alkyl chains within 10 Å of the protein surface (yellow), based on all simulation data gathered for this state. See also Figure 2—video 1. (C) Same as (B), for the all-inward state. See also Figure 2—video 2. (D) Cross-sections of the membrane-deflection data in (A), plotted as a function of the distance to the protein surface. The cross-sections project away from the transport domain, in either the all-outward or all-inward states (solid red and orange lines, respectively), or from the scaffold domain (solid black and blue lines, respectively), following the direction indicated by the inset schematic. Horizontal dashed lines indicate the location of the center of mass of each domain, in either conformation (same color scheme).
Figure 2—video 1
Changes in membrane morphology induced by the conformational cycle of GltPh.
Structure of all-outward GltPh (represented as in Figure 1) alongside a calculated density map for the lipid bilayer alkyl chains within 10 Å of the protein surface (yellow), based on CG simulations for this state in a POPC membrane.
Figure 2—video 2
Changes in membrane morphology induced by the conformational cycle of GltPh.
Structure of all-inward GltPh (represented as in Figure 1) alongside a calculated density map for the lipid bilayer alkyl chains within 10 Å of the protein surface (yellow), based on CG simulations for this state in a POPC membrane.
Figure 3
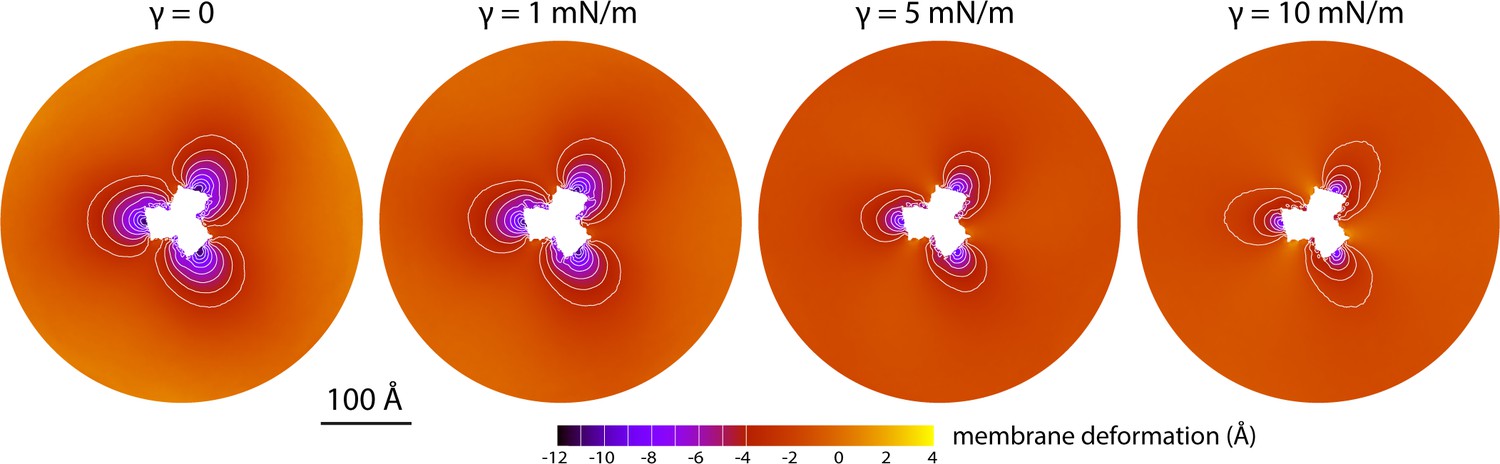
Membrane deformation induced by all-inward GltPh in coarse-grained MD simulations in a POPC bilayer at 298 K, with and without an applied membrane tension of increasing magnitude (as indicated).
The deflection of the membrane mid-plane was calculated and represented as in Figure 2A. From left to right, the standard error of the data (N = 3) across each map is, on average, 0.6 Å, 0.7 Å, 0.4 Å and 0.3 Å.
Figure 4 with 2 supplements
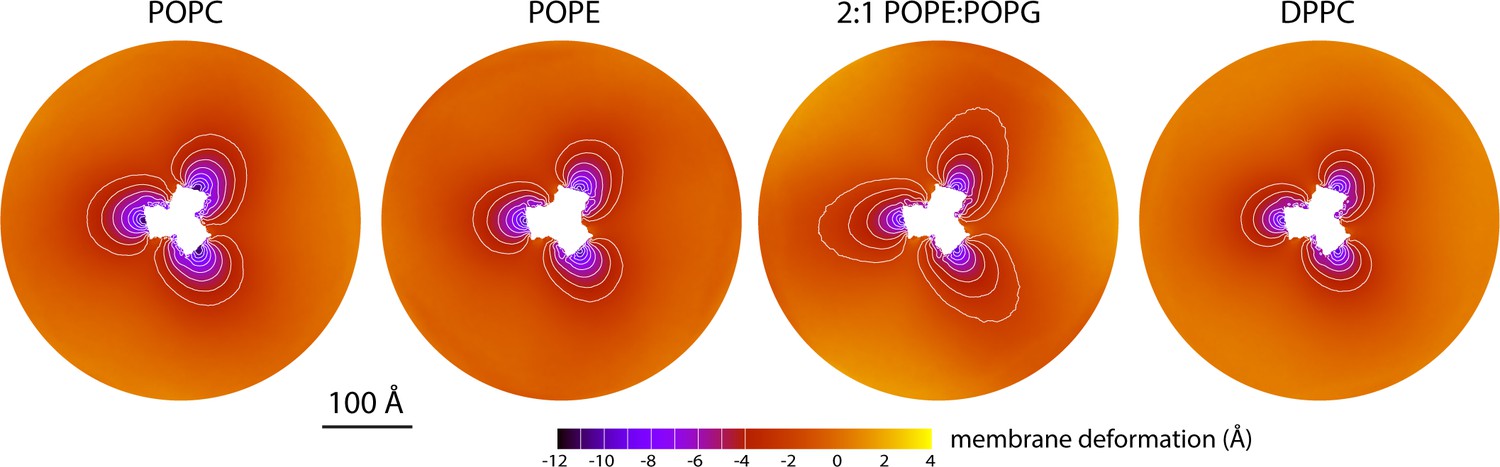
Membrane deformation induced by all-inward GltPh in coarse-grained MD simulations in different bilayers.
The data for POPC, POPE, and 2:1 POPE:POPG were obtained at 298 K; the data for DPPC were obtained at 323 K. The deflection of the membrane mid-plane was calculated and represented as in Figure 2A. From left to right, the standard error of the data (N = 3) across each map is, on average, 0.6 Å, 0.6 Å, 0.4 Å and 1.0 Å.
Figure 4—figure supplement 1
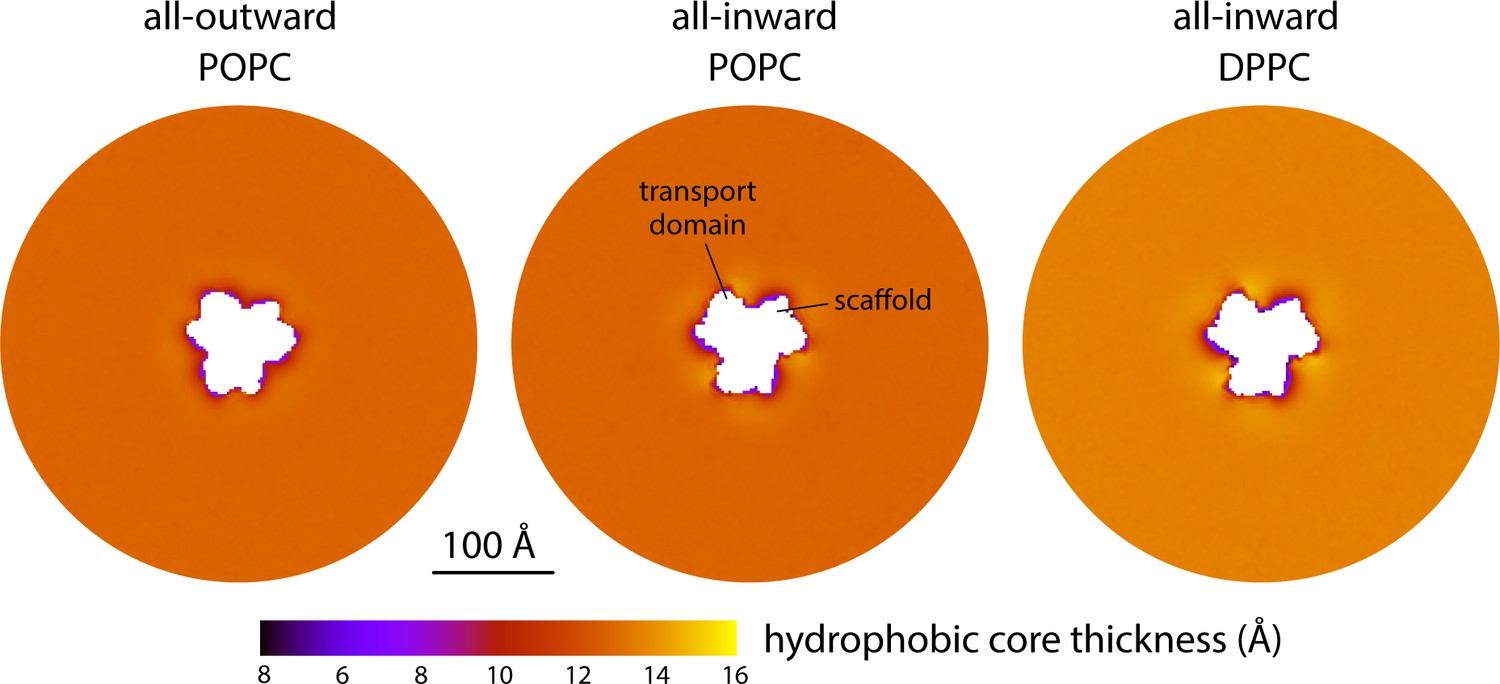
Changes in bilayer thickness induced by the conformational cycle of GltPh.
The plots quantify the thickness of the hydrophobic core of the membrane, as defined by the lipid alkyl chains, in either the all-outward or all-inward states of the transporter. Data are shown for coarse-grained simulations in POPC at 298 K and in DPPC at 323 K. Similarly to Figure 2A, each map reflects the mean of N = 3 time-averages derived from independent simulation trajectories.
Figure 4—figure supplement 2
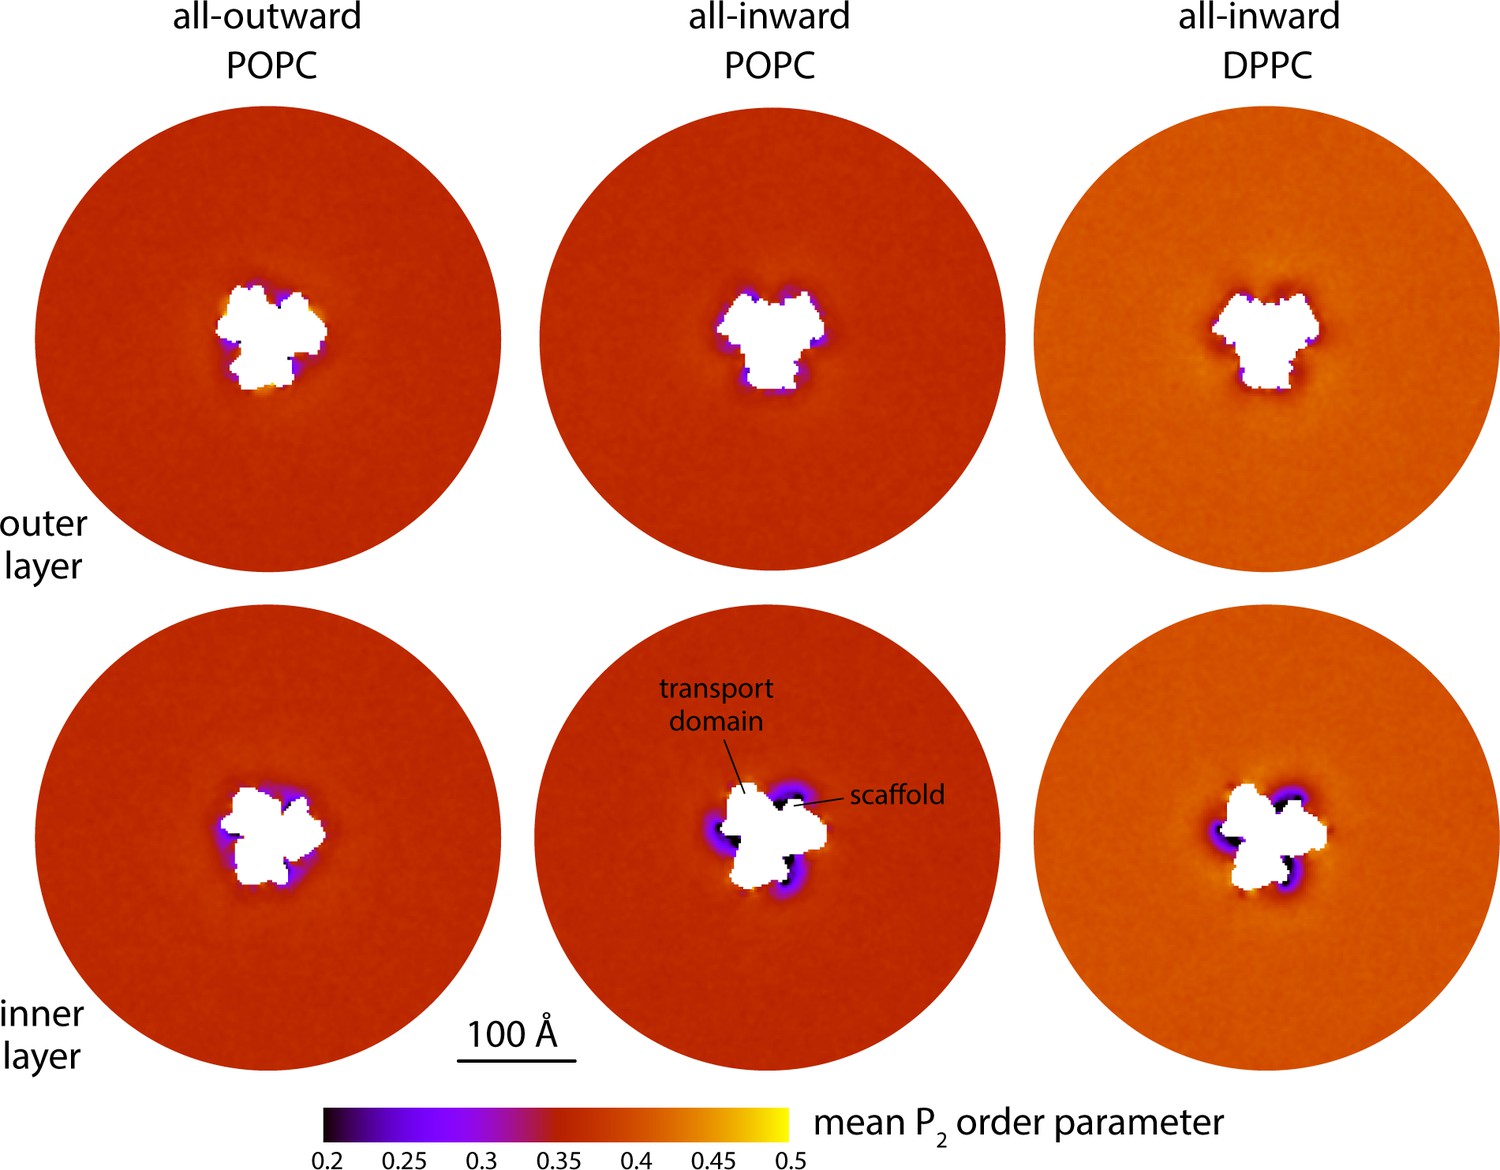
Changes in lipid-chain tilt induced by the conformational cycle of GltPh.
The plots quantify the mean second-rank order parameter of the C-C bonds along the lipid alkyl chains, for either the outer or inner layers of the lipid bilayer (upper and lower panels, respectively), in either the all-outward or all-inward state of the transporter. The second-rank order parameter of a given C-C bond along the chain is defined as 1/2 (3 cos2< θ > − 1), where < θ > denotes the average value of the angle between the bond and the bilayer normal. Data are shown for coarse-grained simulations in POPC at 298 K and in DPPC at 323 K. Similarly to Figure 2A, each map reflects the mean of N = 3 time-averages derived from independent simulation trajectories.
Figure 5 with 2 supplements

Membrane deformation induced by all-inward GltPh, based on large-scale all-atom simulations in DPPC at 323 K.
(A) Deflection of the membrane mid-plane relative to a flat surface, calculated exactly as in Figure 2A. The standard error of the data (N = 3 trajectories, 150 ns each) across the deflection map is, on average, 1.5 Å. (B) Structure of all-inward GltPh (as in Figure 1), alongside a calculated density map for the lipid bilayer alkyl chains within 10 Å from the protein surface (yellow), based on all simulation data gathered for this state. See also Figure 5—video 1. (C) Hydrogen-bonding lipid-protein interactions observed during the all-atom simulations of all-inward GltPh. Direct donor-acceptor interactions are considered, as are interactions mediated by a water molecule. For each protein side chain, the plot quantifies the fraction of the simulation time during which an interaction with a lipid was observed. Figure 1C indicates the location of most of the side chains observed to have persistent lipid interactions.
Figure 5—figure supplement 1
Evaluation of potential biases resulting from conversion of coarse-grained molecular configurations into an all-atom representation.
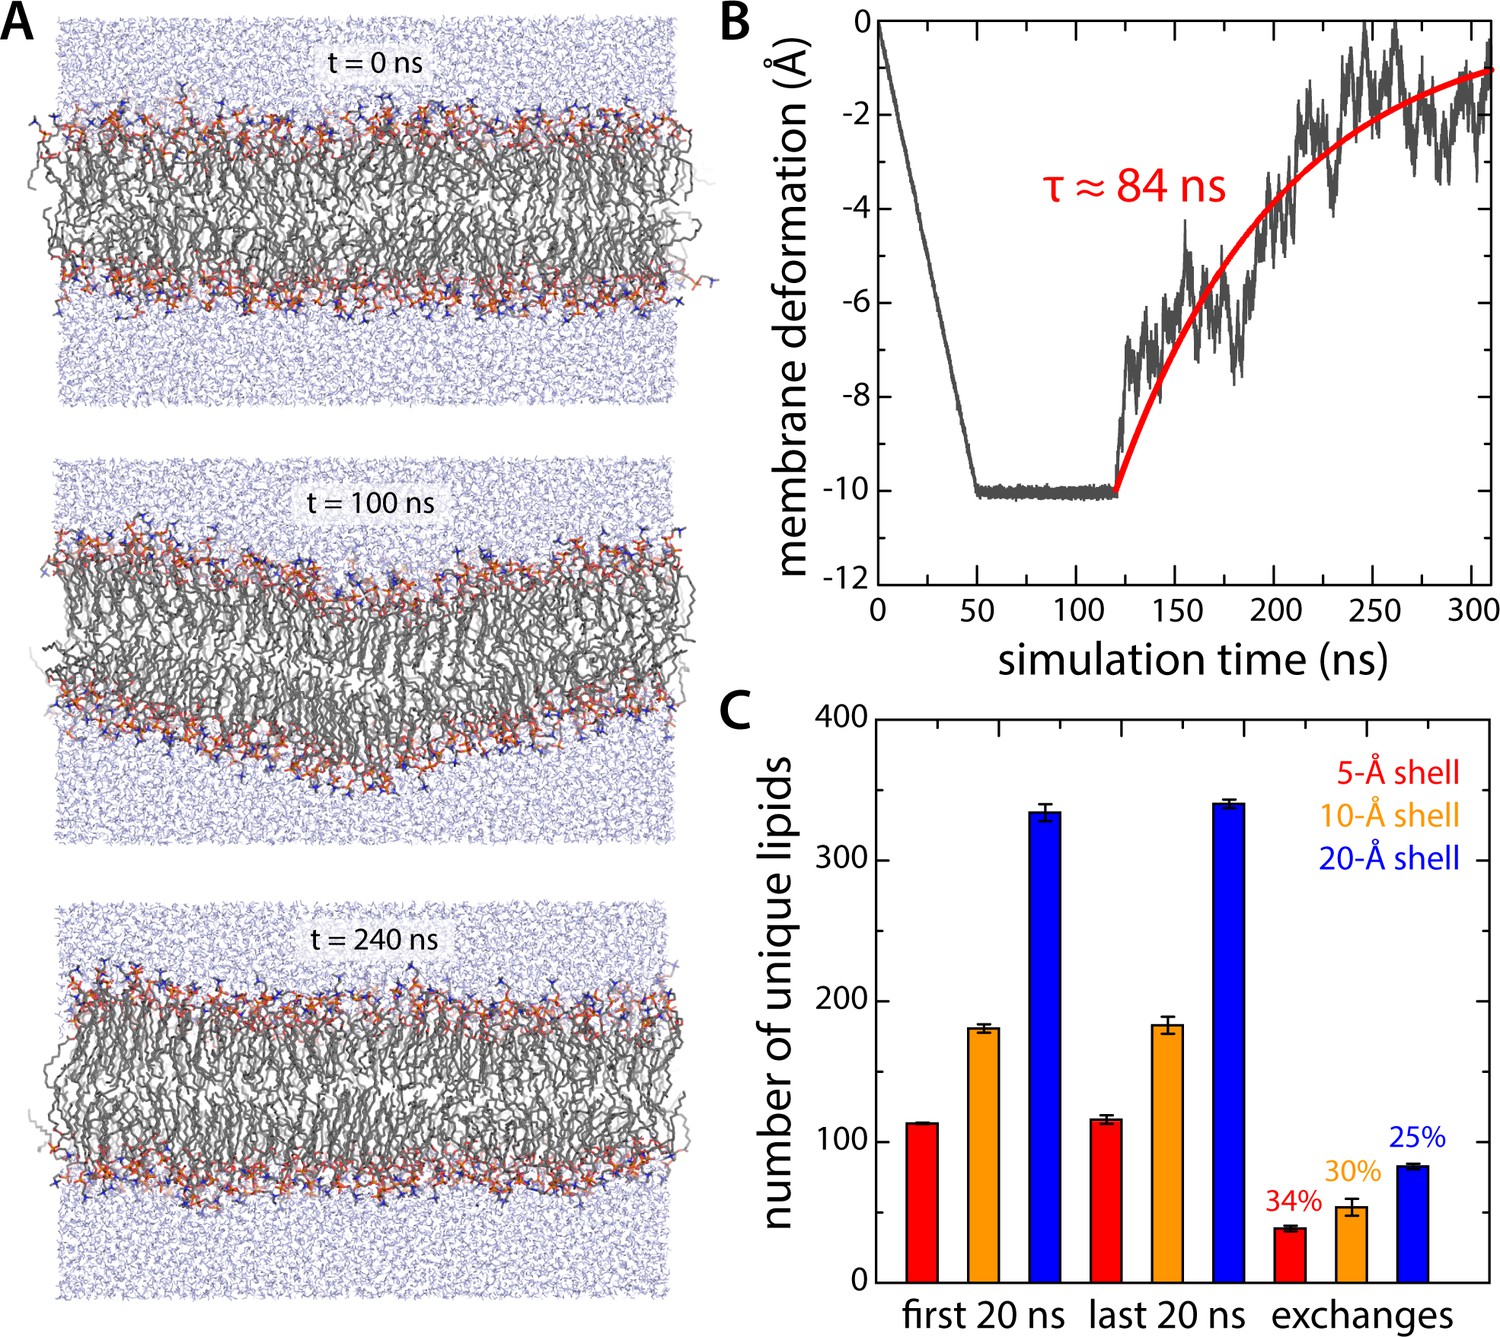
(A, B) All-atom simulation of the relaxation of an artificial 10 Å deflection in the membrane mid-plane. Given the large system size of the all-atom simulation system for all-inward GltPh (~3,000,000 atoms), we sought to determine the minimum sampling time required to evaluate whether the membrane deformation induced by the protein in coarse-grained simulations was compatible with this more accurate representation. To this end we constructed a simulation system consisting of a 640-DPPC lipid bilayer (323 K) and ~32,700 TIP3P water molecules, enclosed in a periodic box of ~140 × 140×80 Å. After equilibration, an artificial deflection of the membrane mid-plane was created in this bilayer whose magnitude is comparable to that observed in the simulations of inward-facing GltPh (see Figure 2A). To create this perturbation, lipid molecules inside a cylinder of ~10 Å in radius were progressively displaced perpendicularly to the plane of the membrane by applying a harmonic restraint with a moving center and force constant of 100 kcal/mol Å−2. The rate of movement of the restraint center was such that after 50 ns of simulation the vertical deflection was 10 Å; this value was then sustained for 70 ns, using the same restraint, now stationary. An unrestrained simulation of ~200 ns was carried out thereafter to evaluate the persistence or relaxation of the membrane deformation, during which we observed that the membrane relaxed fully within ~150 ns. Accordingly, each of the three all-atom trajectories calculated for inward-facing GltPh was 150 ns long. (C) Lipid dynamics in the all-atom simulations of inward-facing GltPh. The plot quantifies the number of lipid molecules that reside in three different shells around the protein (of 5, 10 or 20 Å width – red, orange and blue, respectively) for at least 50% of a 20-ns window at the beginning of the simulations (N = 3). The same values are given for a 20-ns window at the end of the simulations. The number of lipid molecules found in the latter set but not the former gives the number of exchanges between lipid molecules inside the shell and those further away from the protein.
Figure 5—video 1
Membrane deformation induced by all-inward GltPh in large-scale all-atom simulations.
The structure of the protein is represented as in Figure 1, and shown alongside a calculated density map for the lipid bilayer alkyl chains within 10 Å from the protein surface (yellow). The density map derives from three 150-ns simulations of a molecular system comprising over 3,000,000 atoms. The bilayer consists of DPPC lipids, at 323 K.
Figure 6 with 1 supplement
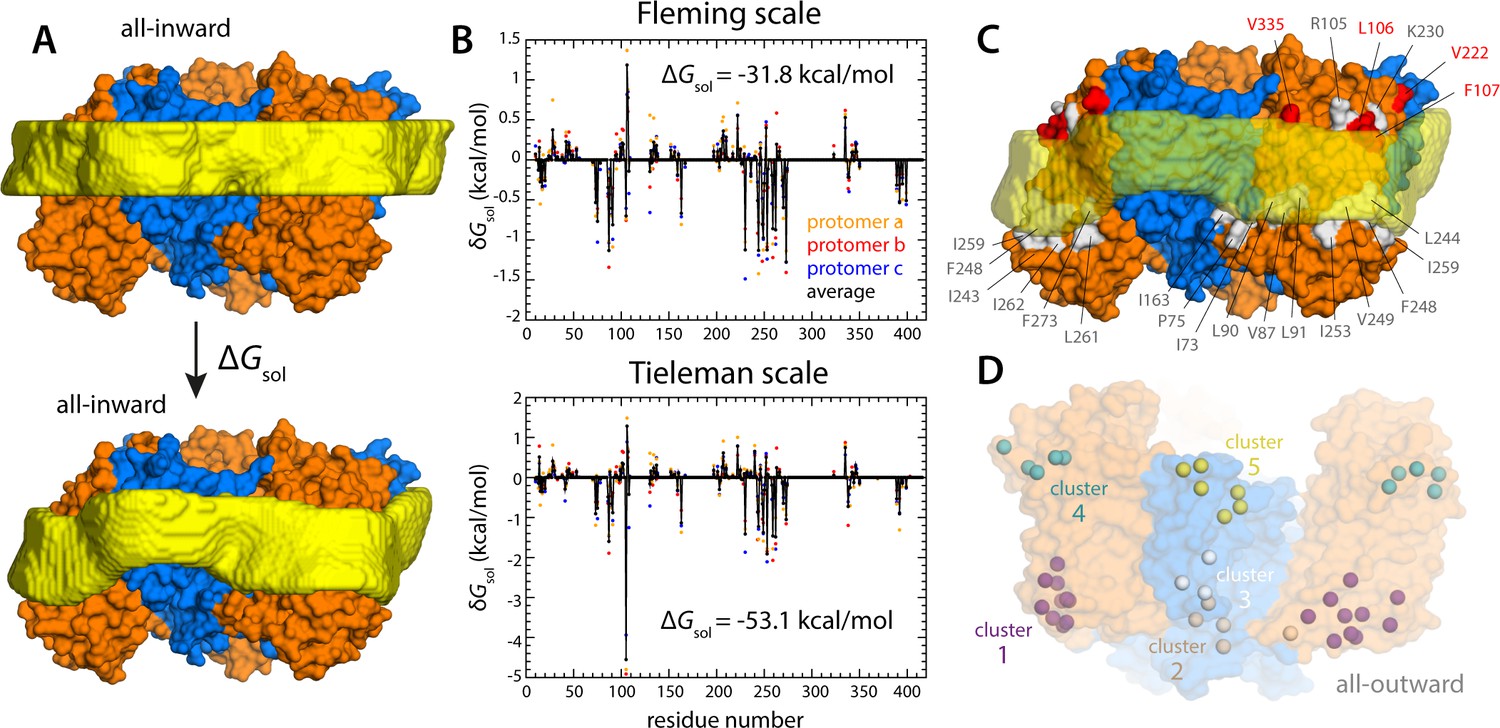
Energetics of solvation and evolutionary conservation of the GltPh lipid interface.
(A) Molecular systems used to evaluate the change in the free energy of polar/hydrophobic solvation that results from membrane bending, for all-inward GltPh. The solvent-accessible surface area of each residue in the protein was calculated for either case (Materials and methods). (B) Per-residue change in the free-energy of polar/hydrophobic solvation, deduced from two alternative hydrophobicity scales (Materials and methods). Negative values of δGsol indicate the deformed membrane state is favored; positive values favor the flat configuration instead. All residue contributions, in the three protomers, were summed to obtain the total value of ΔGsol. (C) Residues for which the magnitude of δGsol is 1 kBT or greater (with both scales) are highlighted in the context of the proposed membrane deformation for all-inward GltPh. Residues that favor the deformed state are shown in gray; those that favor the flat state are shown in red. The protein structure examined in panels (A, B) is an equilibrated snapshot of the all-atom simulation of all-inward GltPh. An analogous analysis of the X-ray structure of all-inward GltPh is shown in Figure 6—figure supplement 1. (D) Residues involved in H-bonds to lipid head groups (Figure 5C) that are also predicted to have co-evolved with neighboring residues at the protein-lipid interface (Materials and methods). The position of these residues in the outward-facing X-ray structure of GltPh is indicated by their Cα atoms (spheres). On the cytoplasmic side of the protein, there are three main clusters: one on the transport domain (cluster 1, purple) comprising residues E80, K84 and Y88 (TM3), L250, Y254 (TM6), I411, V412, K414, T415, and E416 (TM8); and two mostly on the scaffold: one including A67 (TM3), A164, Y167 (TM4), K196, and G200 (TM5) (cluster 2, gray), and the other including K15 (TM1), Q203 and I207 (TM5) (cluster 3, white). On the periplasmic side, there are two clusters: one on the transport domain (cluster 4, cyan), comprising R105, N108 (TM3), F323 (TM7), V335, and Q338 (HP2a); and one on the scaffold (cluster 5, yellow) containing L30, H32, Y33 (TM1), T41, Y42, and V43 (TM2).
Figure 6—figure supplement 1
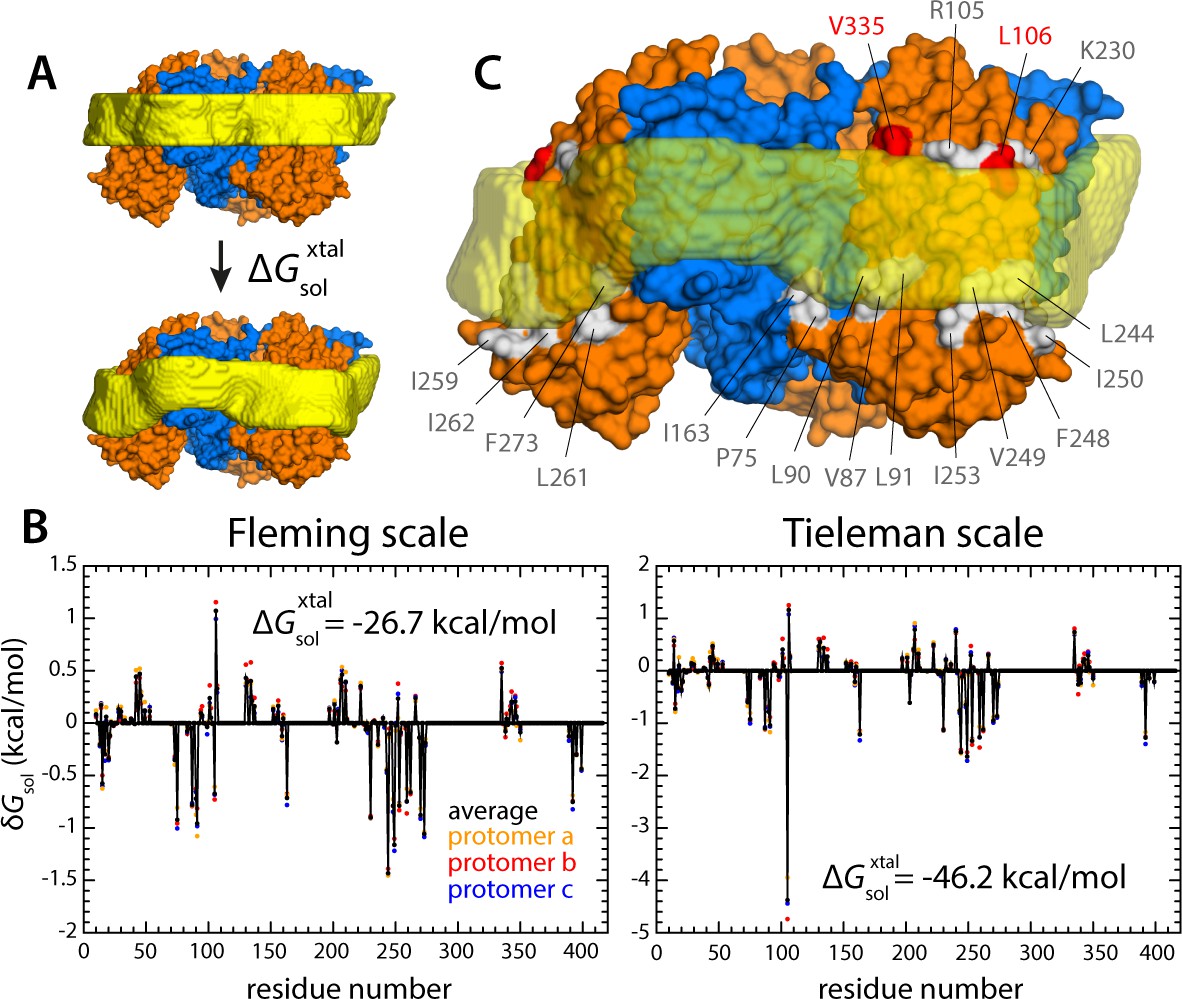
Energetics of polar and hydrophobic solvation of the GltPh lipid interface.
Panels (A), (B) and (C) display information analogous to that shown in Figure 6, but for the X-ray structure of all-inward GltPh (PDB 3KBC).
Figure 7 with 1 supplement
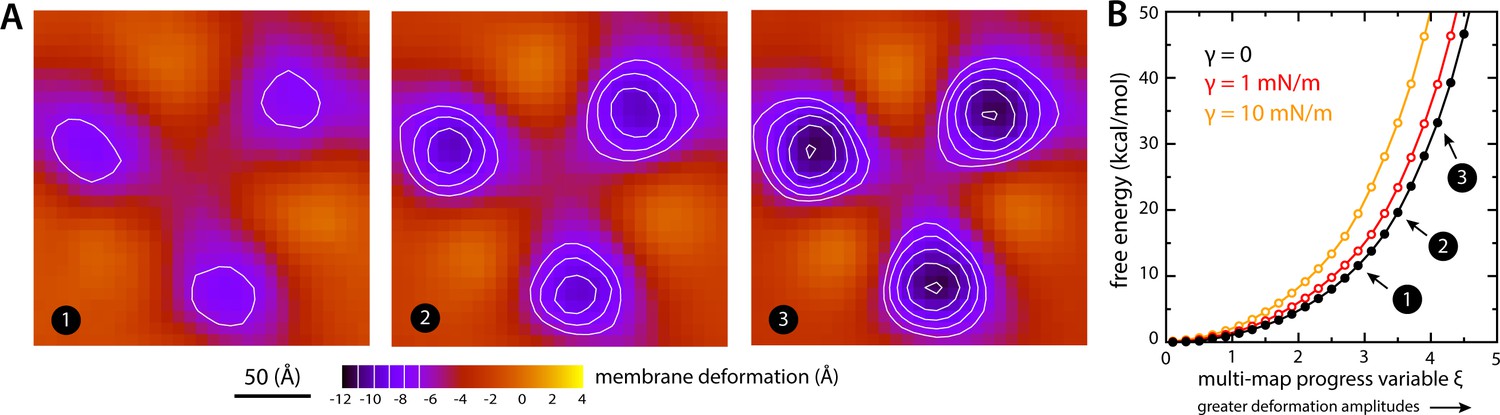
Estimate of the free-energy cost associated with the membrane deformation caused by all-inward GltPh, from direct potential-of-mean-force calculations.
(A) Simulated membrane deformation, in the absence of the protein, induced by application of the Multi-Map method in combination with umbrella sampling, for a coarse-grained POPC lipid bilayer at 298 K. The figure shows three deflection maps analogous to those shown in Figure 2A, that is calculated from trajectory data by averaging the Z coordinate of the bilayer mid-plane across the range of X and Y encompassed by the simulation box. The deflection maps shown correspond to three individual umbrella-sampling windows used in this free-energy calculation, differing in the amplitude of the perturbation that is induced in each case. Other trajectories/windows sample deformation amplitudes that are smaller or larger than those represented in the figure, that is, smaller or larger values of the Multi-Map variable. Each map reflects an average of 18 independent simulations of 1 μs each. (B) Potential-of-mean-force (PMF) curve for the morphological perturbation depicted in panel (A), as a function of the Multi-Map variable, that is, as a function of an increasing deformation amplitude. The free-energy values for the three configurations represented in panel (A) are indicated. PMF curves are also shown for two additional calculations based on umbrella-sampling simulations under an applied membrane tension, for the values indicated. Each of these PMF curves is an average of 18 independent calculations, each sampling 1 μs per window. Error bars for each curve average to about 0.6 kcal/mol.
Figure 7—figure supplement 1
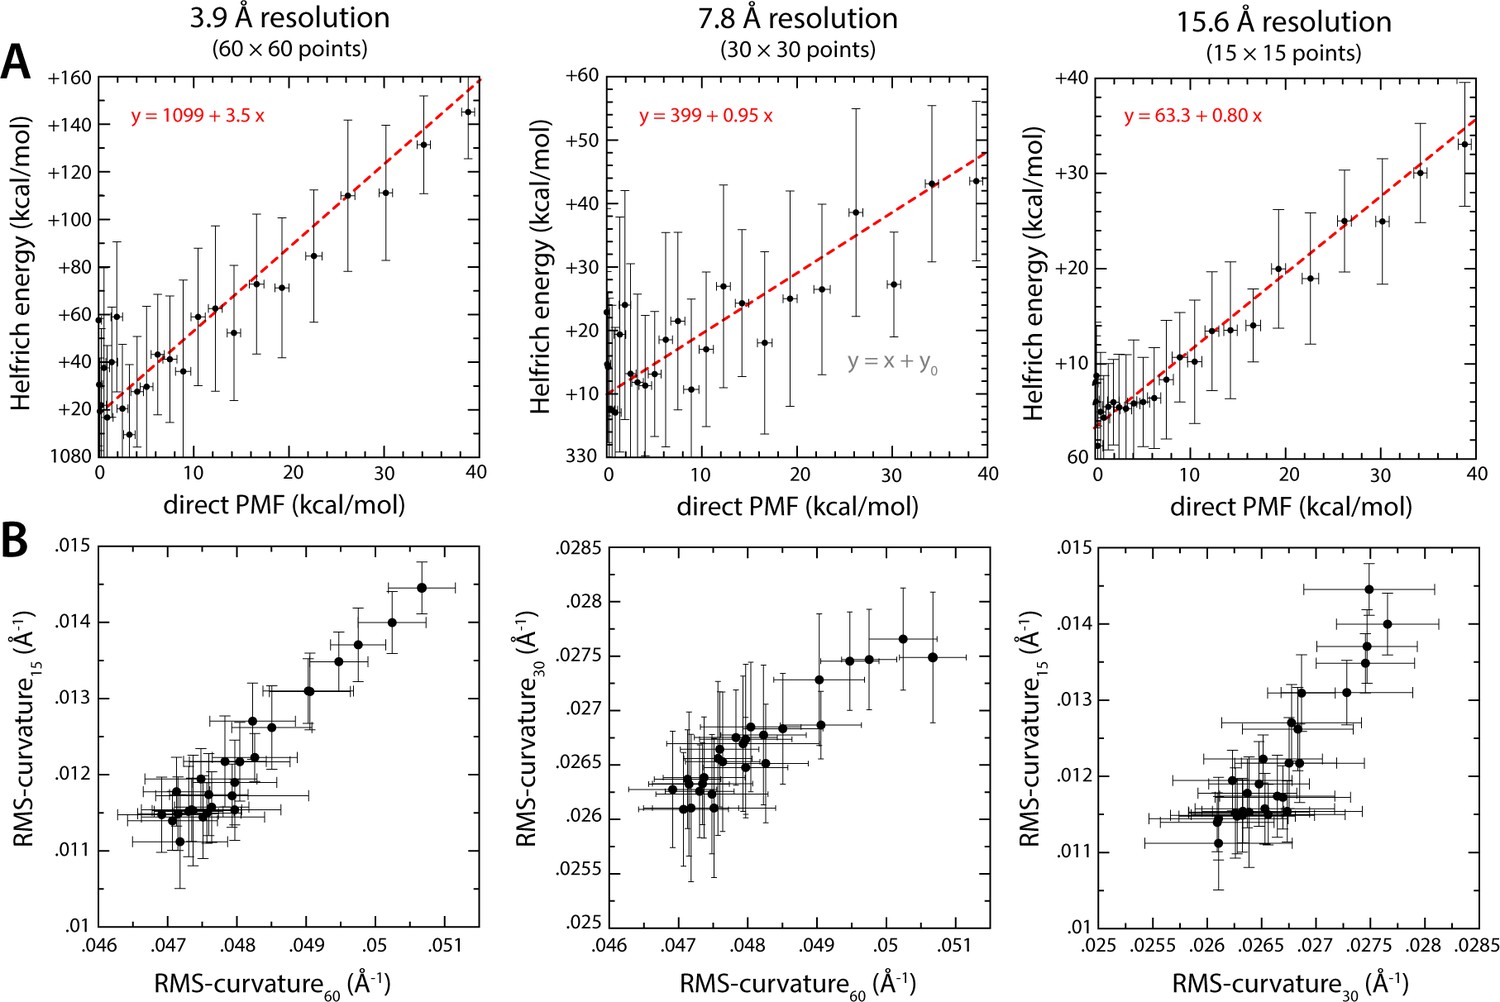
Comparison of membrane-bending free-energy values calculated with the Multi-Map method and with the Helfrich-Canham theory, for the same ensembles of molecular configurations.
(A) The PMF curves shown in Figure 7 are correlated with energy profiles calculated with the Helfrich-Canham equation. Calculation of the latter requires two inputs: the assumed bending modulus kc and the membrane curvature distribution across the X-Y plane, c(x, y). For each of the umbrella-sampling windows used in the PMF calculation (18 trajectories × 1 μs), that is for each value of the progress variable ξ, we evaluate this curvature distribution from analysis of the average mid-plane of the membrane; specifically, maps such as those shown in Figure 7A were interpolated with cubic splines and differentiated with respect to coordinates x and y to obtain the corresponding local curvature maps, c(x, y). The elastic energy for each value of ξ was then calculated by integrating the Helfrich-Canham energy density [0.5 kc c2(x, y)] over the area of the membrane. The three plots in panel (A) describe Helfrich-Canham calculations that use the same value of kc, namely 18 kcal/mol (Fiorin et al., 2019), but differ in the level of resolution used to quantify c(x, y), as indicated. Linear regressions of the data in each case (using points up to ~100 kcal/mol – dashed red lines) show that the Helfrich-Canham energies can be much larger, similar or somewhat smaller that the PMF values depending on the resolution used for this curvature evaluation. (B) Comparison of curvature evaluations carried out at different resolutions. Specifically, for each umbrella-sampling window we compute the root-mean-squared curvature across the whole bilayer plane and contrast different resolutions. Despite extensive simulation time, that is 18 trajectories × 1 μs per window, the evaluation of the local membrane curvature is prone to large statistical errors (which propagate to the energy calculations) and ill-defined averages for moderate to low curvature values. By contrast, the PMFs curves shown in Figure 7 approximately converge after 1 μs of sampling per window. In our view, these ambiguities in the definition of membrane curvature and the appropriate value of the bending modulus highlight the merits of direct PMF calculations such as those shown in Figure 7.
Figure 8

Membrane deformation induced by the Na+-dicarboxylate symporter VcINDY, based on coarse-grained MD simulations in POPC at 298 K.
(A) Structure of the VcINDY dimer in the outward-facing state, viewed along the membrane perpendicular from the extracellular space. The protein is represented as GltPh in Figure 1. (B) Deflection of the membrane mid-plane induced by VcINDY in the outward- and inward-facing states (left and right, respectively) based on three independent simulations for either state. The view is from the extracellular space. From left to right, the standard error of the data (N = 3) across each map is, on average, 1.0 Å and 0.8 Å. (C) Structures of outward- and inward-facing VcINDY (represented as in panel A), alongside calculated density maps for lipid alkyl chains within 10 Å from the protein surface (yellow), based on all the simulation data obtained for either state. Note the outward-facing state is a model, constructed on the basis of the experimental inward-facing structure through repeat-swapping (Mulligan et al., 2016).
Additional files
Download links
A two-part list of links to download the article, or parts of the article, in various formats.
Downloads (link to download the article as PDF)
Open citations (links to open the citations from this article in various online reference manager services)
Cite this article (links to download the citations from this article in formats compatible with various reference manager tools)
Large-scale state-dependent membrane remodeling by a transporter protein
eLife 8:e50576.
https://doi.org/10.7554/eLife.50576


