Opioids modulate an emergent rhythmogenic process to depress breathing
- David Geffen School of Medicine at UCLA, United States
- Chicago Medical School, Rosalind Franklin University of Medicine and Science, United States
- Rosalind Franklin University of Medicine and Science, United States
Figures
Figure 1
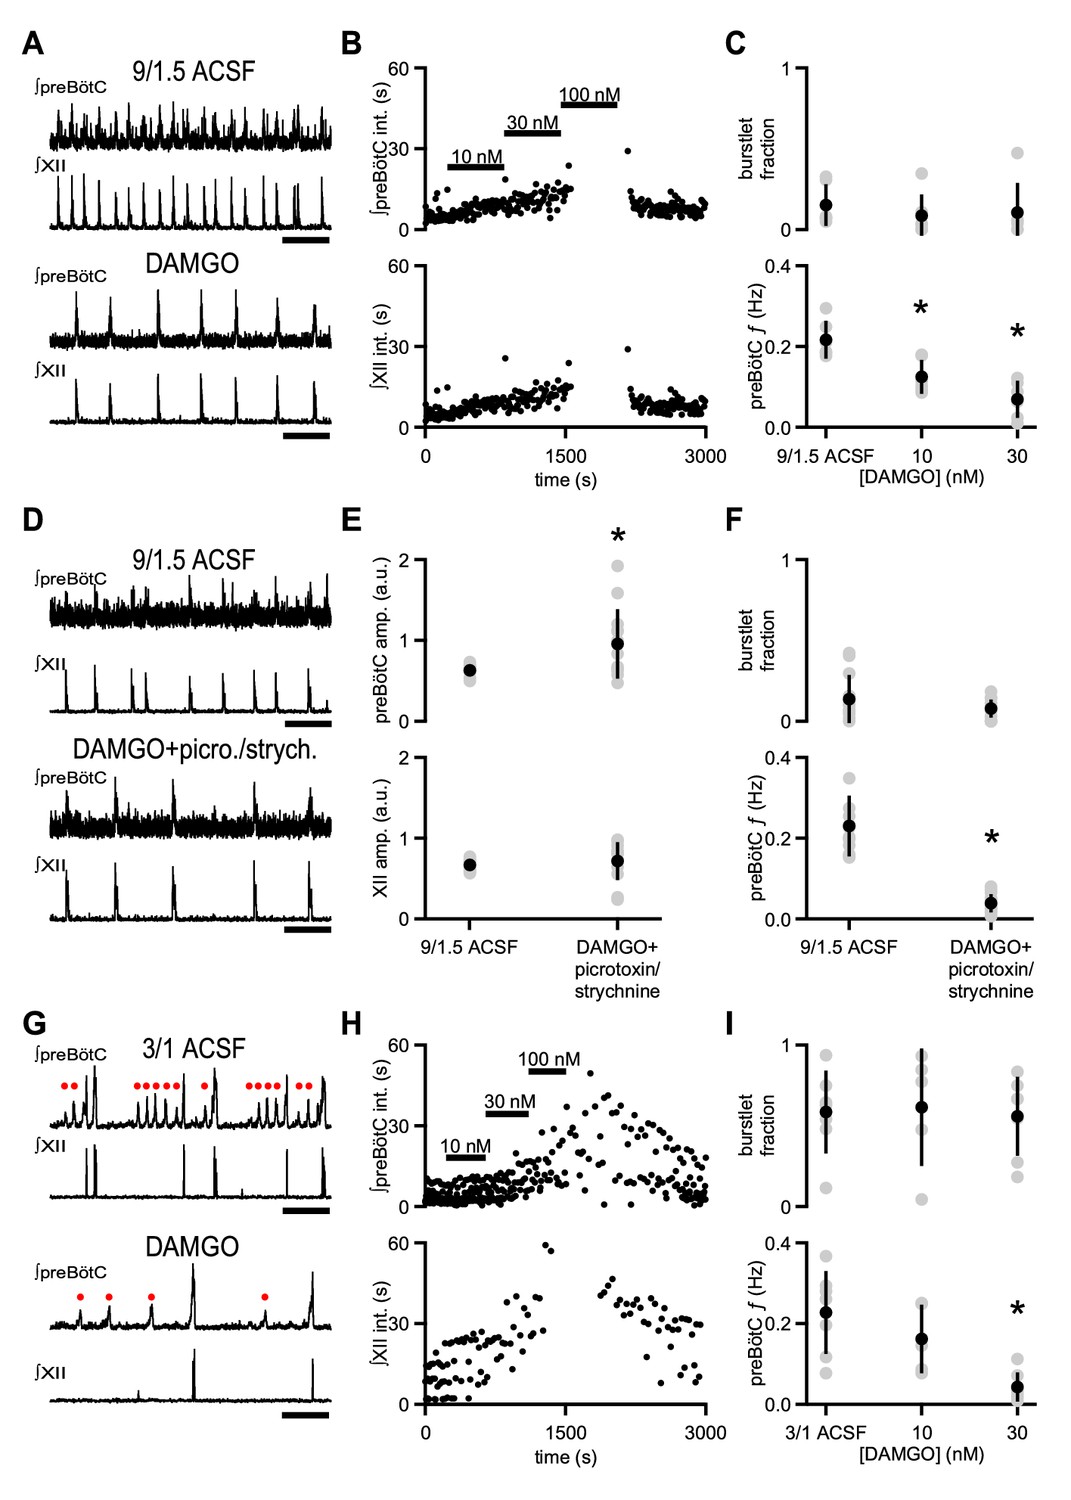
µOR activation depresses inspiratory frequency without affecting burstlet fraction.
(A) Representative traces of ∫preBötC and ∫XII population activity in 9/1.5 ACSF control and 30 nM DAMGO. Scale bar, 10 s. (B) Representative time course of an experiment where increasing concentrations of DAMGO were bath-applied in 9/1.5 ACSF. Interevent intervals (int.) in preBötC (top) and XII (bottom) are plotted. In this experiment, 100 nM DAMGO led to cessation of rhythm. (C) Average burstlet fraction and preBötC f in 9/1.5 ACSF and 10 nM and 30 nM DAMGO. Increasing concentrations of DAMGO did not significantly affect burstlet fraction whereas preBötC f was significantly lower in 10 nM and 30 nM DAMGO. *, p<0.05, One-way ANOVA, post-hoc Tukey test, n = 6. (D) Representative traces of ∫preBötC and ∫XII population activity in 9/1.5 ACSF control and in 30 nM DAMGO with 100 µM picrotoxin and 1 µM strychnine (picrotoxin/strychnine). Scale bar, 10 s. (E) Average preBötC burst and XII burst amplitude (amp.) in 9/1.5 ACSF and in 30 nM DAMGO with 100 µM picrotoxin and 1 µM strychnine (picrotoxin/strychnine). Addition of DAMGO and picrotoxin/strychnine increased preBötC burst amplitude compared to 9/1.5 ACSF control while XII burst amplitudes were not significantly different. The low frequency or lack of preBötC burstlets precluded analysis of their amplitudes. *, p<0.05, Student’s t-test, n = 13. (F) Average burstlet fraction and preBötC f in 9/1.5 ACSF and in 30 nM DAMGO with 100 µM picrotoxin and 1 µM strychnine (picrotoxin/strychnine). When picrotoxin/strychnine was added with DAMGO, preBötC f remained significantly reduced and burstlet fraction was similar. *, p<0.05, Student’s t-test, n = 13. (G) Representative traces of ∫preBötC and ∫XII population activity in 3/1 ACSF control and 30 nM DAMGO. Both small amplitude burstlets (), which did not produce XII activity, and large amplitude bursts, which generated XII bursts, were observed. Scale bar, 10 s. (H) Representative time course of an experiment, where increasing concentrations of DAMGO were bath-applied in 3/1 ACSF. Interevent intervals in preBötC (top) and XII (bottom) are plotted. In this experiment, 100 nM DAMGO led to cessation of XII activity while preBötC rhythm persisted. (I) Average burstlet fraction and f in 3/1 ACSF and 10 nM and 30 nM DAMGO. Increasing concentrations of DAMGO did not significantly affect burstlet fraction whereas preBötC f was significantly lower in 30 nM DAMGO. *, p<0.05, One-way ANOVA, post-hoc Tukey test, n = 7.
Figure 2

DAMGO specifically modulates preBötC rhythmogenesis.
(A) Representative traces of ∫preBötC and ∫XII population activity in 3/1 ACSF control, 8 µM Cd2+, and 8 µM Cd2+ + 10 nM DAMGO. In 3/1 ACSF (top), rhythmic activity consisted of both burstlets () and bursts. After Cd2+ application (middle), preBötC bursts were no longer observed, and XII activity was abolished, leaving only a preBötC burstlet rhythm with a f similar to control. With addition of DAMGO (bottom), burstlet f and amplitude decreased. Note: the two large deflections in ∫XII (bottom) are not synchronized with preBötC activity, and are likely non-inspiratory or electrical artifact. Scale bar, 5 s. (B) Average burstlet fraction, preBötC f, and burstlet amplitude (amp.) in 3/1 ACSF control, 6–25 µM Cd2+, and 6–25 µM Cd2+ + 0.1–10 nM DAMGO. Addition of Cd2+ significantly increased the burstlet fraction while preBötC f and burstlet amplitudes were unchanged. Bath application of DAMGO significantly decreased preBötC f (consisting almost solely of burstlets) and burstlet amplitude. *, p<0.05, one-way ANOVA, post-hoc Tukey test, n = 8. (C) Overlays of representative traces of ∫preBötC from successive photoexcitation of 8 Dbx1+ neurons in control 9/1.5 ACSF, 30 nM DAMGO, and 100 nM DAMGO. The illumination pattern consisted of 10 µm soma-centered spots over the targeted neurons. Photoexcitation was provided by 405 nm holographic illumination of 500 µM MNI-glutamate. Arrow represents time of laser stimulation. In 9/1.5 ACSF, a failure was seen, but burst initiation was otherwise reliably successful. Bursts were consistently triggered after a ~ 100 ms latency. In 30 nM DAMGO, failures were more frequent when the same stimulation parameters were used, and the latency between laser stimulation and burst initiation was longer and more variable. In 100 nM DAMGO, bursts in this experiment were no longer triggered with the same stimulation parameters. Scale bar, 200 ms. (D) Average success rate (stim→burst) for burst initiation in control 9/1.5 ACSF conditions and in increasing concentrations of DAMGO using entraining stimuli that elicits >80% success in 9/1.5 ACSF. To entrain the rhythm, 5–10 Dbx1+ neurons were stimulated 8–20 times every 3–6 s. DAMGO produced a dose-dependent decrease in the success rate for triggering bursts with a significant reduction in success between control and at 100 nM and 200 nM DAMGO. *, p<0.05, one-way ANOVA, post-hoc Tukey test, n = 6. (E) Average latency between laser stimulation and burst initiation when bursts were successfully triggered during entraining stimuli was increased in 30 nM DAMGO compared to control 9/1.5 ACSF. *, p<0.05, Student’s t-test, n = 5.
Figure 3 with 1 supplement
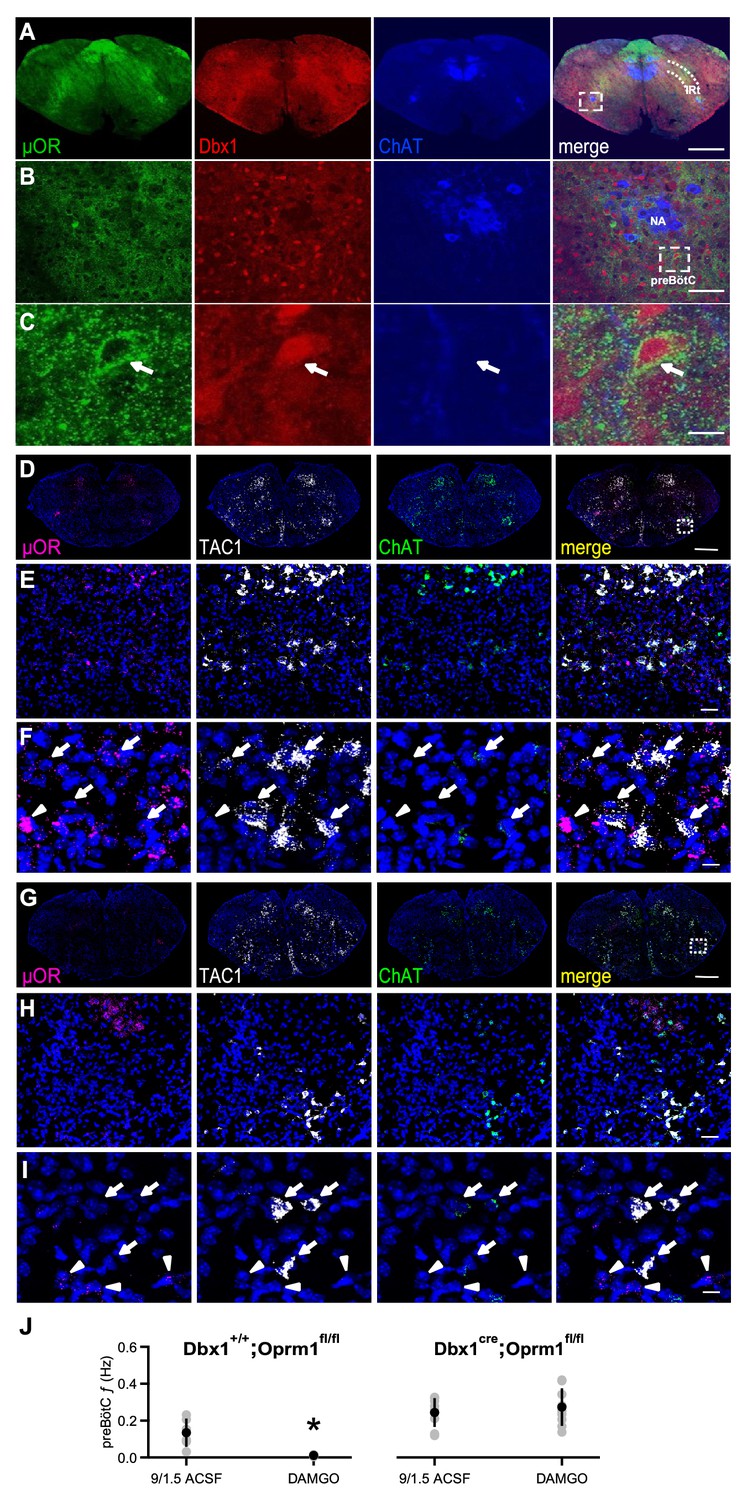
µORs expressed in Dbx1+ neurons mediate DAMGO inhibition of preBötC rhythmic activity.
(A) Confocal images of brainstem sections of a Dbx1Cre;Rosa26tdTomato mouse pup (P2) double-stained with antibodies to Choline acetyltransferase (ChAT; blue) and µOR (green). Coronal sections showing µOR expression in the preBötC and the Intermediate band of the Reticular Formation (IRt) and colocalization with Dbx1+ neurons in the preBötC. Scale bar, 500 μm. (B) Higher magnification of nucleus ambiguus (NA) and preBötC from the boxed region in A. Scale bar, 50 μm. (C) Expanded images of the boxed preBötC region highlighted in B. The arrow shows a preBötC Dbx1+ neuron with abundant punctate µOR expression on the cell body. Scale bar, 10 μm. (D) Confocal image of a medullary brainstem section at the level of the preBötC from a control P2 Dbx1+/+;Oprm1fl/fl mouse processed with RNAScope. Probes for µOR (magenta), tachykinin precursor 1 peptide (TAC1; white), and ChAT (green) were used, and the tissue was counterstained with DAPI (blue). A box marks the location of preBötC. Scale bar, 1 mm. (E) Higher magnification of the boxed preBötC region in D. µOR and TAC1 were highly expressed in this region. Scale bar, 100 μm. (F) Higher magnification images of TAC1-positive neurons and µOR mRNA (arrows). Colocalization of TAC1 and multiple µOR puncta was observed in several neurons (arrows) as well as abundant µOR puncta in negative TAC1 regions (arrowhead). Scale bar, 40 μm. (G) Confocal image of a medullary brainstem section at the level of the preBötC from a P2 Dbx1cre/cre;Oprm1fl/fl mouse processed with RNAScope. Probes for µOR (magenta), TAC1 (white), and ChAT (green) were used, and the tissue was counterstained with DAPI (blue). In the preBötC of these mice, the density of µOR puncta was low. A box marks the location of preBötC. Scale bar, 1 mm. (H) Higher magnification of the boxed preBötC region in G. The density of µOR puncta was low, and µOR expression was not associated with TAC1 expression. Scale bar, 100 μm. (I) Higher magnification images of TAC1-expressing neurons from H with few to no µOR puncta, as well as µOR transcripts without TAC1 expression (arrowheads). Scale bar, 40 μm. (J) Average f of preBötC activity in control 9/1.5 conditions and 100 nM DAMGO in Dbx1Cre;Oprm1fl/fl mice (right), where µORs are selectively deleted in Dbx1+ neurons, and their Dbx1+/+;Oprm1fl/fl littermate controls with preserved µOR expression (left). Whereas 100 nM DAMGO reduced preBötC f significantly in Dbx1+/+;Oprm1fl/fl control mice, the same concentration had no effect on f when µORs were deleted. *, p<0.05, Student’s t-test, n = 6 for Dbx1+/+;Oprm1fl/fl, n = 9 for Dbx1Cre;Oprm1fl/fl.
Figure 3—figure supplement 1
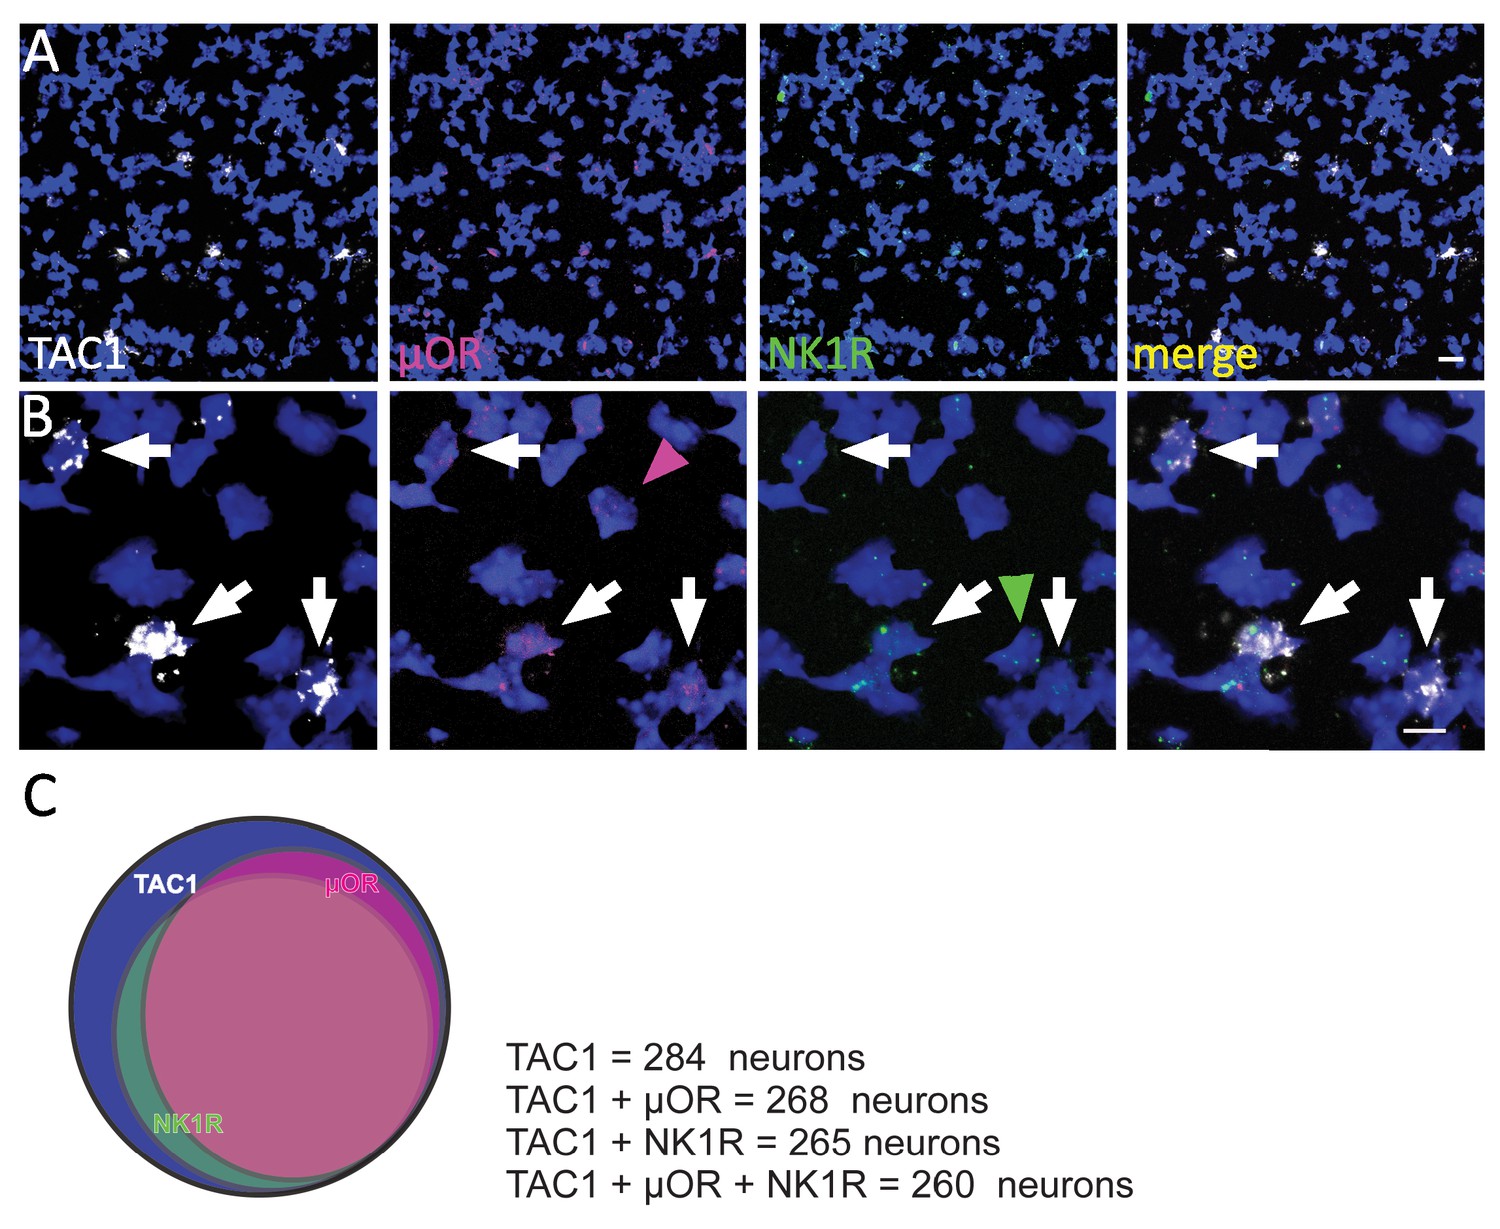
µOR, TAC1, and NK1R expression in preBötC.
(A) Confocal image of a medullary brainstem section at the level of the preBötC from a P2 wild-type mouse triple processed with RNAScope. Probes for NK1R (green), µOR (magenta), and TAC1 (white) were used, and the tissue was counterstained with DAPI (blue). Scale bar, 20 μm. (B) Higher magnification images showing colocalization of TAC1, NK1R, and µOR puncta in several preBötC neurons. μOR and NK1R transcripts are detectable in approximately 90% of these neurons (arrows). Note that in the absence of TAC1; NK1R and μOR-positive mRNA transcripts were detected (arrowheads). Scale bar, 25 μm. (C) Venn diagram depicting the co-expression incidence of μOR and NK1R in TAC1-positive neurons in the mouse preBötC.
Figure 4
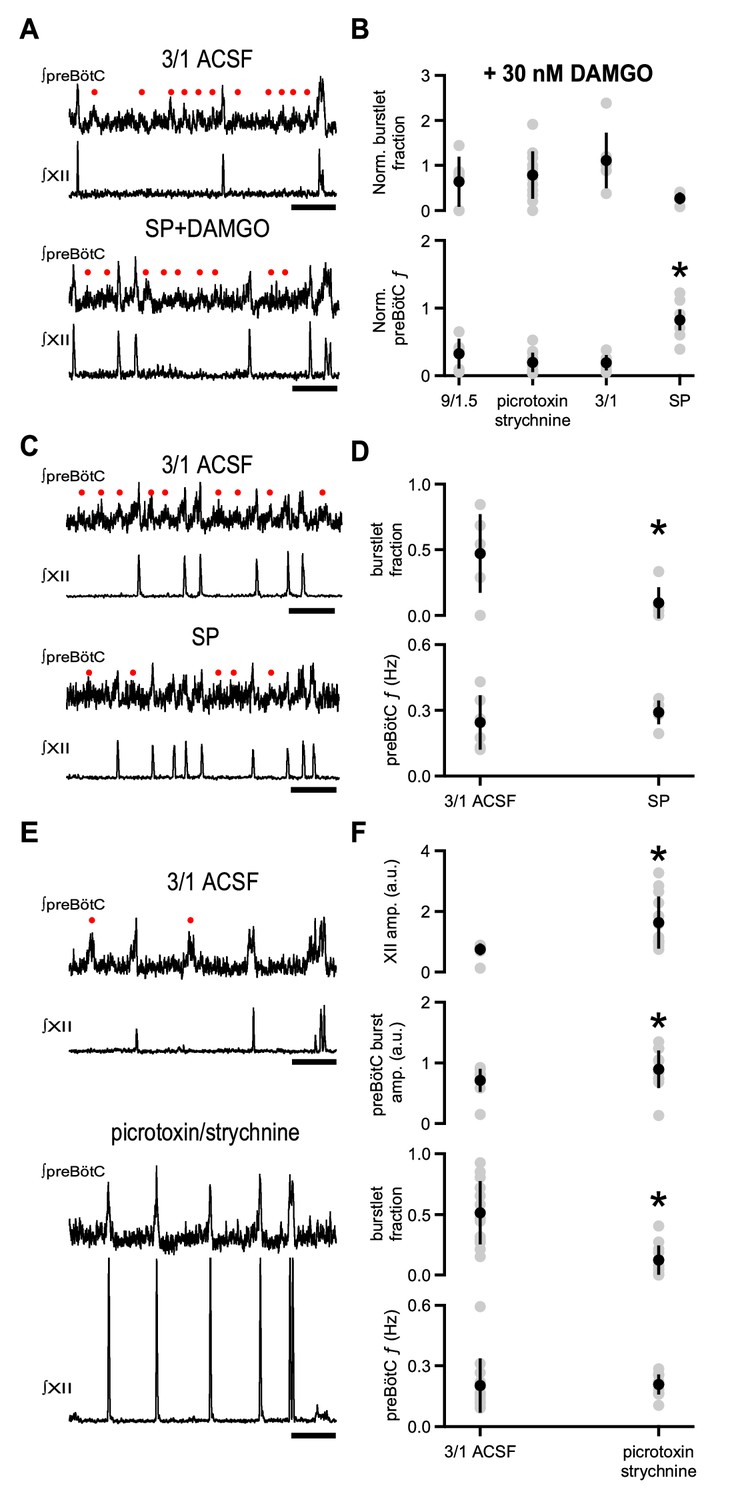
Substance P, but not blockade of inhibitory synaptic transmission, relieves DAMGO-mediated depression.
(A) Representative traces of ∫preBötC and ∫XII population activity in 3/1 ACSF control and 500 nM SP and 30 nM DAMGO. SP mitigated the effects of DAMGO, and preBötC activity, consisting of both burstlets () and bursts, resembled that in control conditions. Scale bar, 10 s. (B) Average normalized burstlet fraction and preBötC f when 30 nM DAMGO was added alone (9/1.5, 3/1) or following application of either 100 µM picrotoxin/1 µM strychnine or 500 nM SP. For each experiment, values were normalized to burstlet fraction or preBötC f during baseline 9/1.5 or 3/1 ACSF in that experiment. The normalized preBötC f when SP was added with DAMGO was significantly higher than all other conditions. *, p<0.05, one-way ANOVA, post-hoc Tukey test, n = 6 for 9/1.5, n = 7 for 3/1, n = 13 for picrotoxin/strychnine, n = 6 for SP. (C) Representative traces of ∫preBötC and ∫XII population activity in 3/1 ACSF control and 500 nM SP. In 3/1 ACSF, rhythmic activity consisted of both burstlets () and bursts. After SP, f was unchanged, but more preBötC bursts were observed. Scale bar, 10 s. (D) Average burstlet fraction and f in 3/1 ACSF control condition and 500 nM SP. SP significantly decreased the burstlet fraction, but did not change preBötC f. *, p<0.05, Student’s t-test, n = 13. (E) Representative traces of ∫preBötC and ∫XII population activity in 3/1 ACSF control and 100 µM picrotoxin/1 µM strychnine. In 3/1 ACSF, rhythmic activity consisted of both burstlets () and bursts. After picrotoxin/strychnine, f was unchanged; however, more preBötC bursts were observed, and XII bursts were larger. Scale bar, 10 s. (F) Average burstlet fraction and f in 3/1 ACSF control condition and 100 µM picrotoxin/1 µM strychnine. Picrotoxin/strychnine significantly decreased the burstlet fraction, but did not change preBötC f. *, p<0.05, Student’s t-test, n = 13.
Additional files
-
Supplementary file 1
Correlation of burst and burstlet parameters and preBötC f.
- https://cdn.elifesciences.org/articles/50613/elife-50613-supp1-v2.pdf
-
Source data 1
Source data for graphs.
- https://cdn.elifesciences.org/articles/50613/elife-50613-data1-v2.xlsx
-
Transparent reporting form
- https://cdn.elifesciences.org/articles/50613/elife-50613-transrepform-v2.docx
Download links
A two-part list of links to download the article, or parts of the article, in various formats.
Downloads (link to download the article as PDF)
Open citations (links to open the citations from this article in various online reference manager services)
Cite this article (links to download the citations from this article in formats compatible with various reference manager tools)
Opioids modulate an emergent rhythmogenic process to depress breathing
eLife 8:e50613.
https://doi.org/10.7554/eLife.50613


