A projection specific logic to sampling visual inputs in mouse superior colliculus
- Neuro-Electronics Research Flanders, Belgium
- VIB, Belgium
- KU Leuven, Belgium
- Northeastern University, United States
- IMEC, Belgium
Figures
Figure 1 with 2 supplements
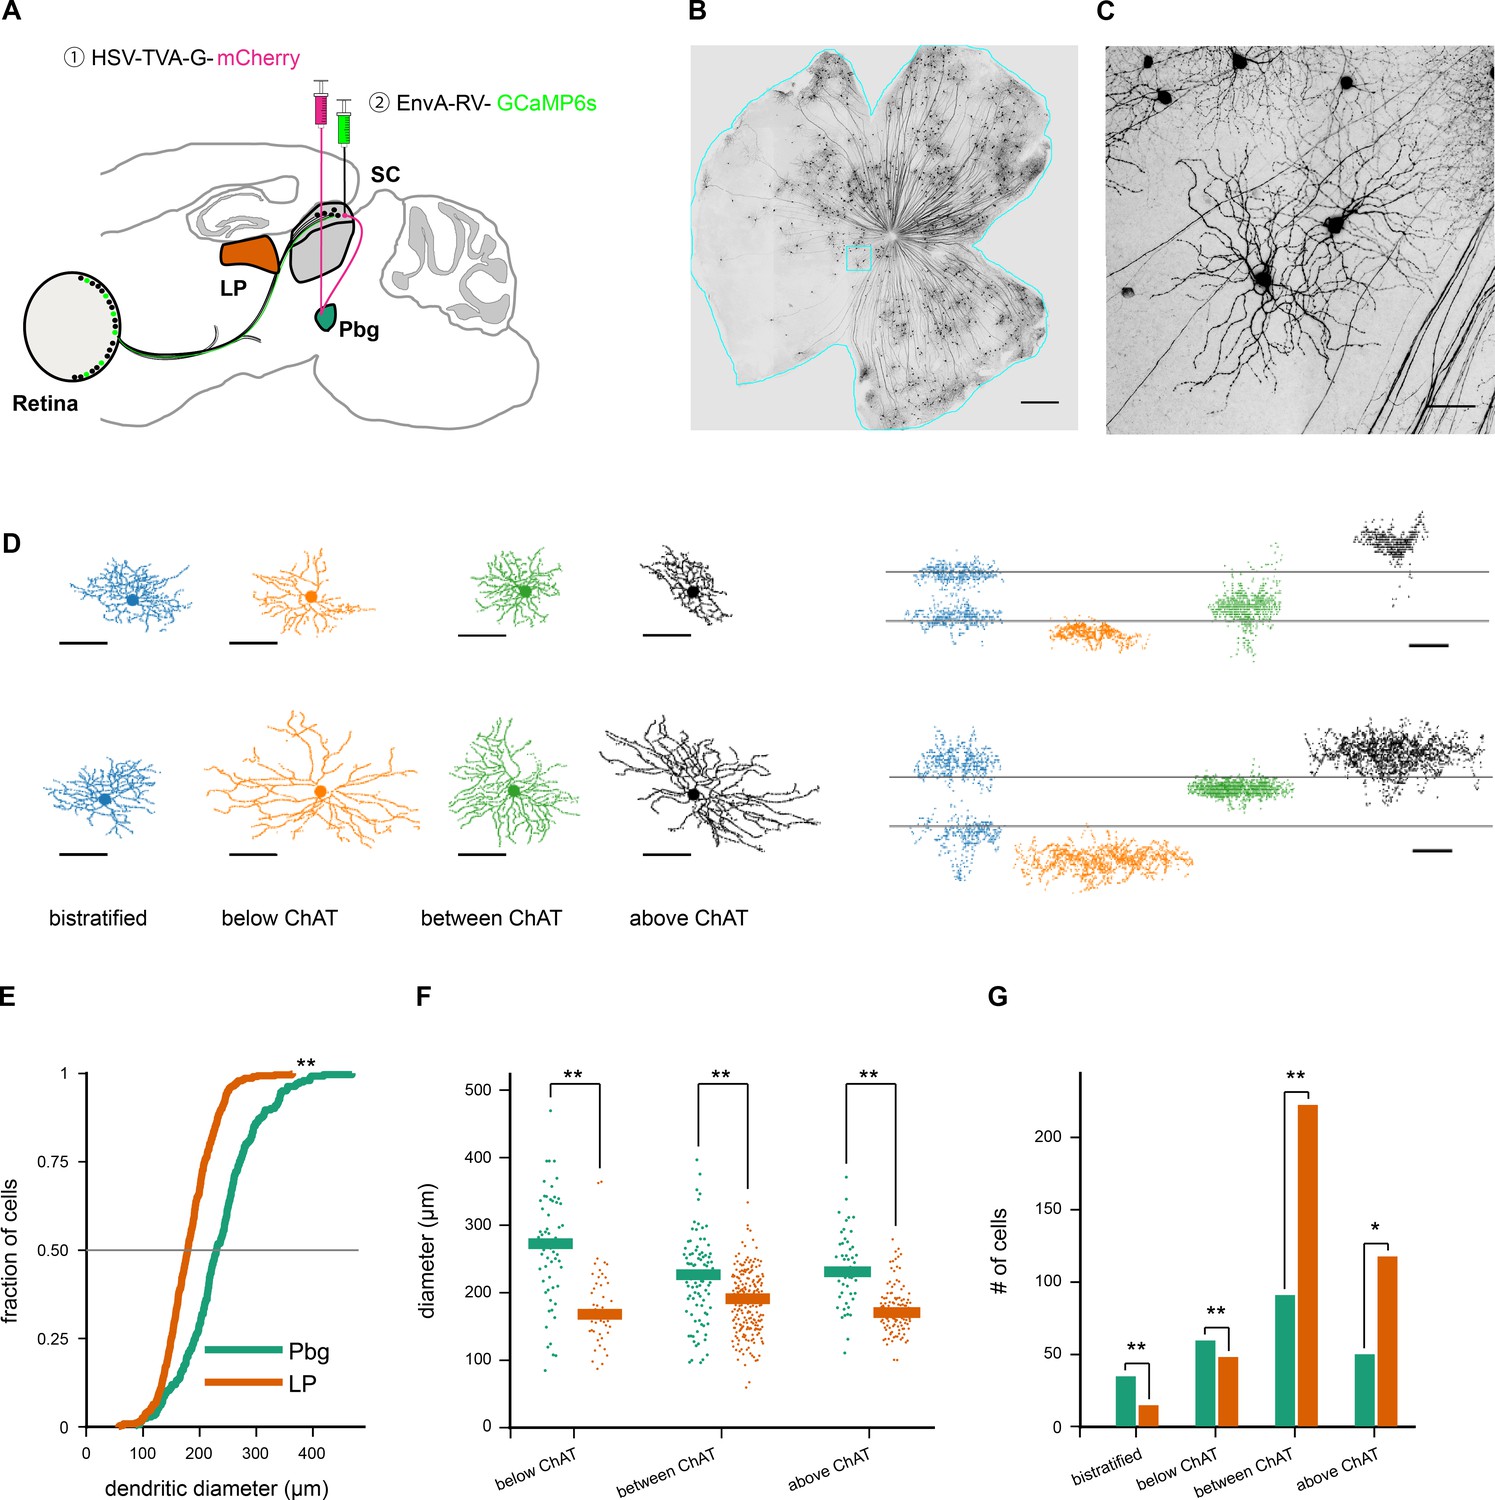
Transsynaptic tracing of retinal ganglion cells from the parabigeminal nucleus and the lateral pulvinar.
(A–C). Labeling retinal inputs to the colliculo-parabigeminal circuit. (A) Injection strategy for labeling the circuit connecting the retina to the parabigeminal nucleus, via the superior colliculus. (B) Example retina with labeled ganglion cells innervating the colliculo-parabigeminal circuit. Scale bar: 500 µm. (C) Zoom into cyan box in B. Scale bar: 50 µm. (D) Eight example retinal ganglion cells from either injection approach (parabigeminal nucleus or pulvinar). Left: en-face view of the dendritic tree. Right: side-view of the dendritic tree. Location of the ChAT-bands is indicated with two gray lines. The cells are separated into four stratification groups: bistratified (first column), below (second column), between (third column), and above the ChAT-bands (last column). (E) Distribution of dendritic tree diameter of retinal ganglion cells that are part of the colliculo-pulvinar (LP; orange) and the colliculo-parabigeminal (Pbg; green) circuit. **p<0.01 Kolmogorov-Smirnov and Wilcoxon rank sum test. (F) Retinal ganglion cell diameters for cells stratifying below, between, and above ChAT-bands. **p<0.01 Kolmogorov-Smirnov and Wilcoxon rank sum test. (G) Retinal ganglion cells of each circuit were grouped into four stratification groups based on the peak of their dendritic profile. *p<0.05, **p<0.01 two proportion z-test. See also Figure 1—figure supplements 1 and 2.
Figure 1—figure supplement 1
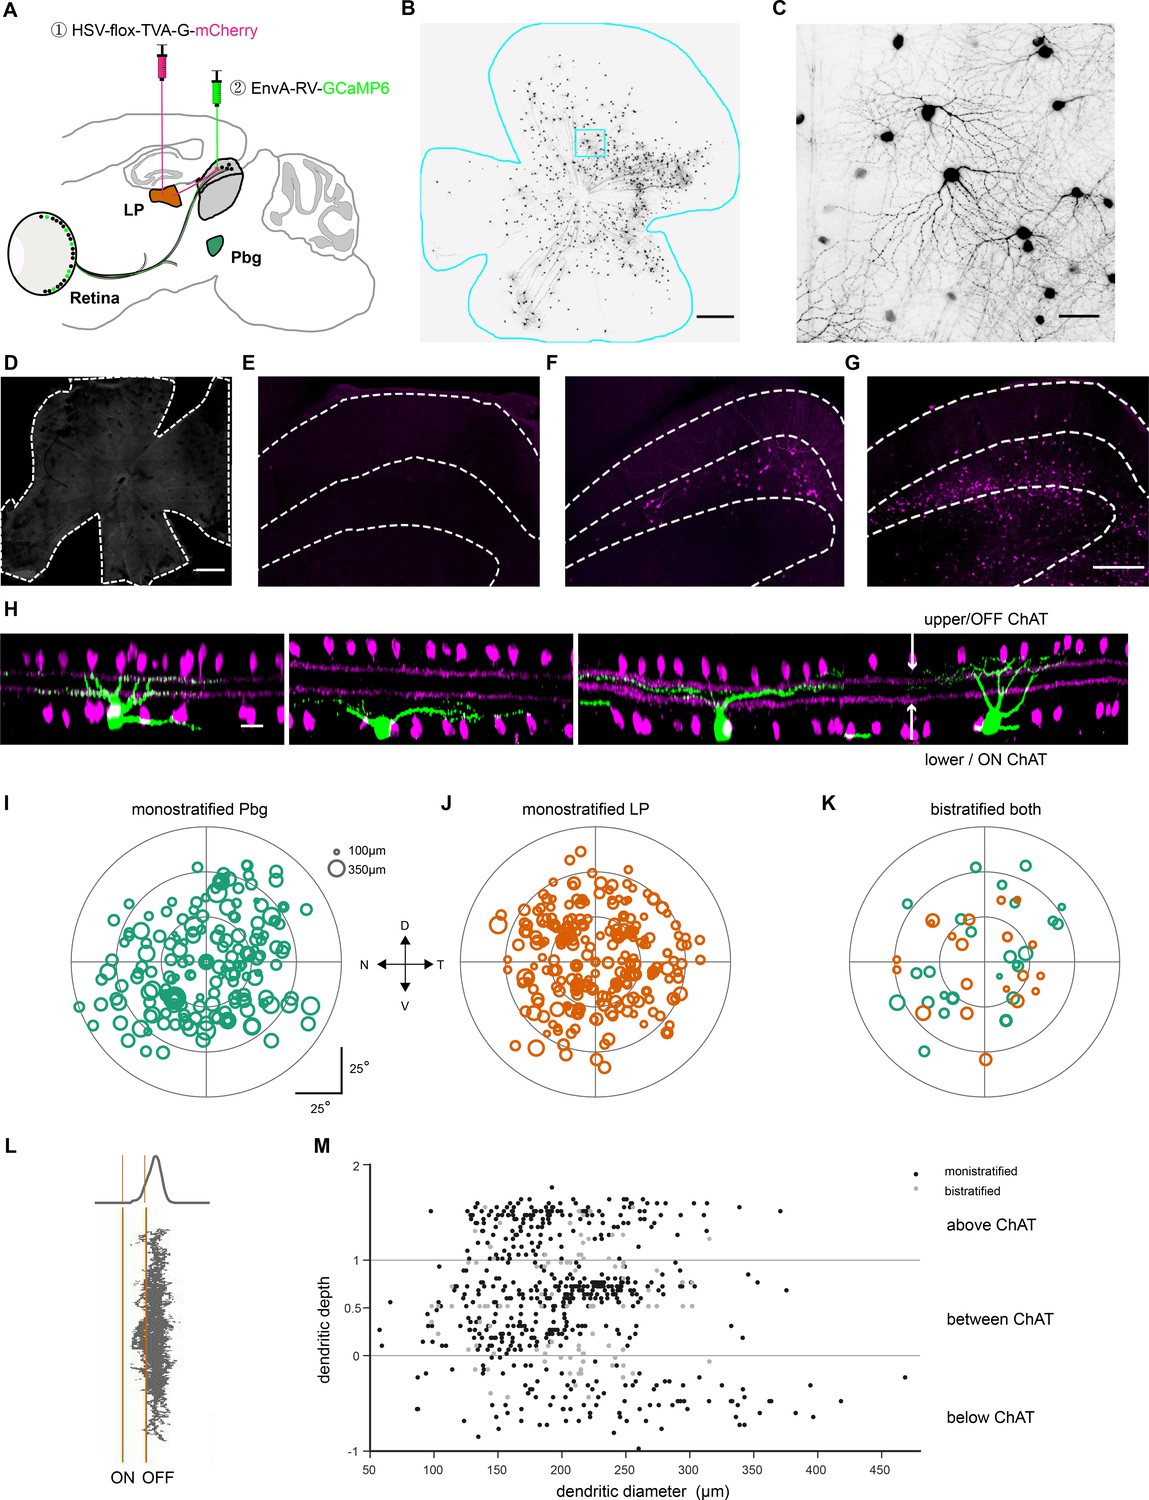
Viral tracing with EnvA-coated rabies virus and herpes-simplex-virus (HSV).
(A) Injection strategy for labeling of the circuit connecting the retina to the pulvinar, via the superior colliculus. (B) Example retina with labeled ganglion cells innervating the colliculo-pulvinar circuit. Scale bar = 500 μm. (C) Zoomed-in version of B. Scale bar = 50 μm. (D) Whole-mount retina stained with antibody for GCaMP6s after EnvA-coated SAD-△G-GCaMP6s rabies virus injection to superior colliculus alone without first injection of HSV. No labeled cells are observed 11 days after injection. Scale bar: 500 µm. (E) Injection of conditional HSV into the pulvinar of a wild-type mouse without any Rabies injection. Very few labeled cells are observed 21 days after injection. (F–G) Injection of conditional HSV into the pulvinar (F) and non-conditional HSV into the parabigeminal nuclei (G) labeled superior colliculus neurons. Neurons were stained with anti-mCherry antibody, showed in magenta. Scale bar = 200 µm. (H) Side-view of z-stack scans of four example retinal ganglion cells (green) and the ChAT-bands (magenta). Scale bar = 20 µm. (I–K) Retinal position and dendritic tree diameter of retinal ganglion cells that are part of the colliculo-parabigeminal circuit (I), cells innervating the colliculo-pulvinar circuit (J), and bistratified ganglion cells of both circuits (K). To determine if the differences in size between the colliculo-parabigeminal and colliculo-pulvinar circuit are due to a bias in the retinotopic location of the sampled ganglion cells, we analyzed the spatial distribution of the labeled neurons across the retina. For each circuit, we sampled evenly from each retinal quadrant (15.6% naso-dorsal, 30.4% dorso-temporal, 28.3% temporo-ventral, 24.6% ventro-nasal. In addition, we sampled at all retinal eccentricities: 52% of labeled ganglion cells were sampled from the central third of the retina (within 30° of the optic nerve), 43% from the middle third (30°−60° from the optic nerve) and 5% from the peripheral third (60°−90° from the optic nerve). This indicates that the observed difference in size between the two circuits is not due to a sampling bias in retinotopic location. N = nasal, D = dorsal, T = temporal, V = ventral. The optic nerve is indicated with a black disc. (L) The distribution of the dendritic tree in depth was summed to create a stratification profile. (M) Stratification depth and dendritic tree diameter of all 658 labeled retinal ganglion cells from both experimental conditions.
Figure 1—figure supplement 2

HSV injection sites of pulvinar and parabigeminal nucleus.
(A–D) Histological section of four examples pulvinar injection sites. The pipette (indicated as a yellow line) was coated with a fluorescent dye (DiD) and the fluorescent signal coincides with the location of the pulvinar (LP). A-C were from sagittal sections and D was from coronal section. Scale bar = 1 mm. (E–H) Histological section of four example prabigeminal nucleus injection sites. All of them were from coronal sections. Scale bar = 1 mm.
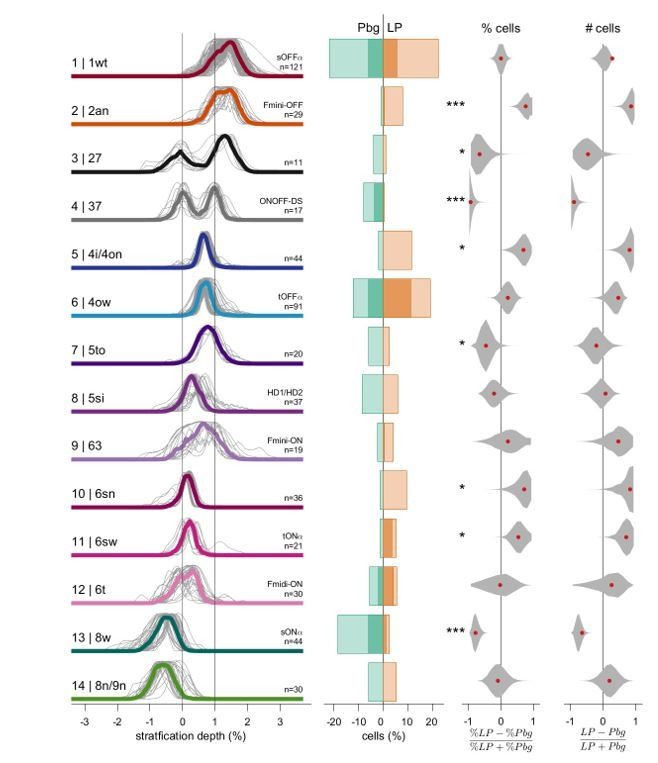
Figure 2
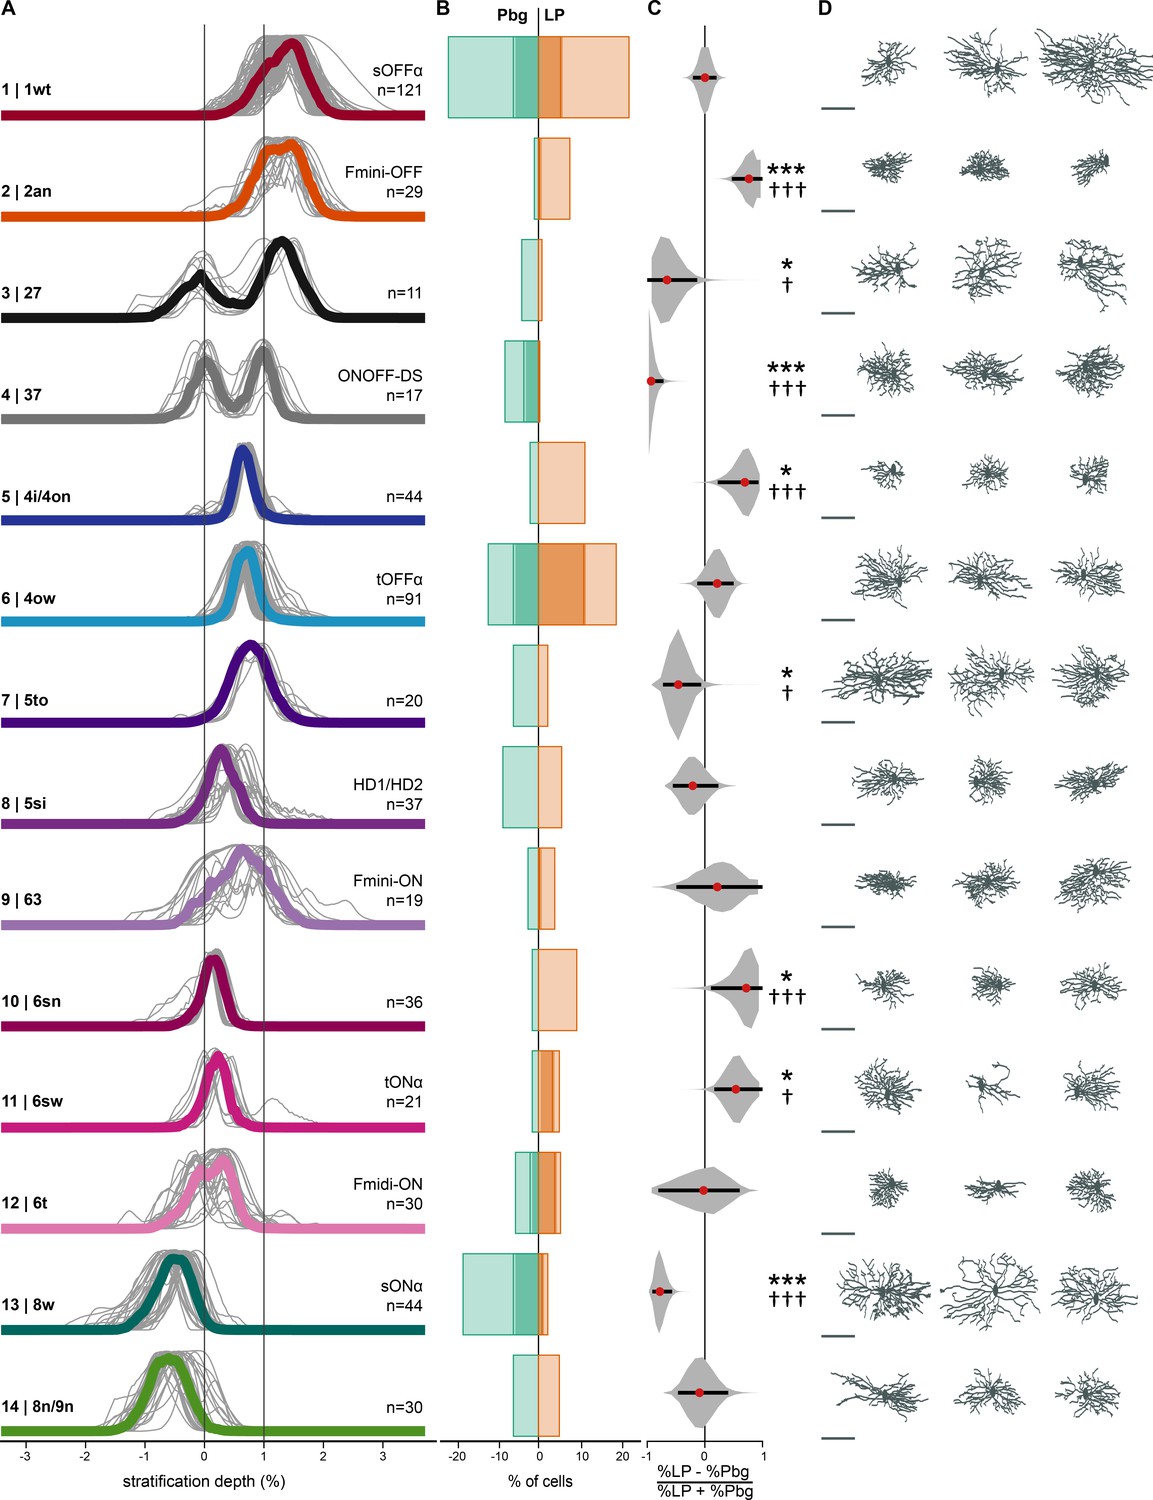
Retinal ganglion cell types targeting parabigeminal- and pulvinar-projecting collicular neurons.
(A) Individual and median stratification profiles of 550 cells for the 14 cell types that innervate the colliculo-parabigeminal and colliculo-pulvinar circuit. Cluster names and additional names refer to the classification and assignment in Bae et al. (2018). (B) Percentages of cells in each cluster for both circuits (100% equals the total number of cells in a given circuit, n = 196 for Pbg and n = 354 for LP). Darker shading represents the molecularly identified neurons. (C) Biases for the two circuits expressed as percentage differences. Black lines span 2.5% to 97.5% of the data. Red dots indicate the ratio calculated from B. *p<0.05, ***p<0.001, bootstrap analysis; † p<0.05, ††† p<0.01, two proportion z-test. (D) En-face view of example cells. Scale bar: 100 µm. See also Figure 2—source data 1.
-
Figure 2—source data 1
All 599 cells in their corresponding cluster.
Positive cluster numbers are ones included in main text. Negative cluster numbers are clusters assigned less than 1% of the total population. Scale bar: 100 µm.
- https://cdn.elifesciences.org/articles/50697/elife-50697-fig2-data1-v1.pdf
Figure 3 with 1 supplement
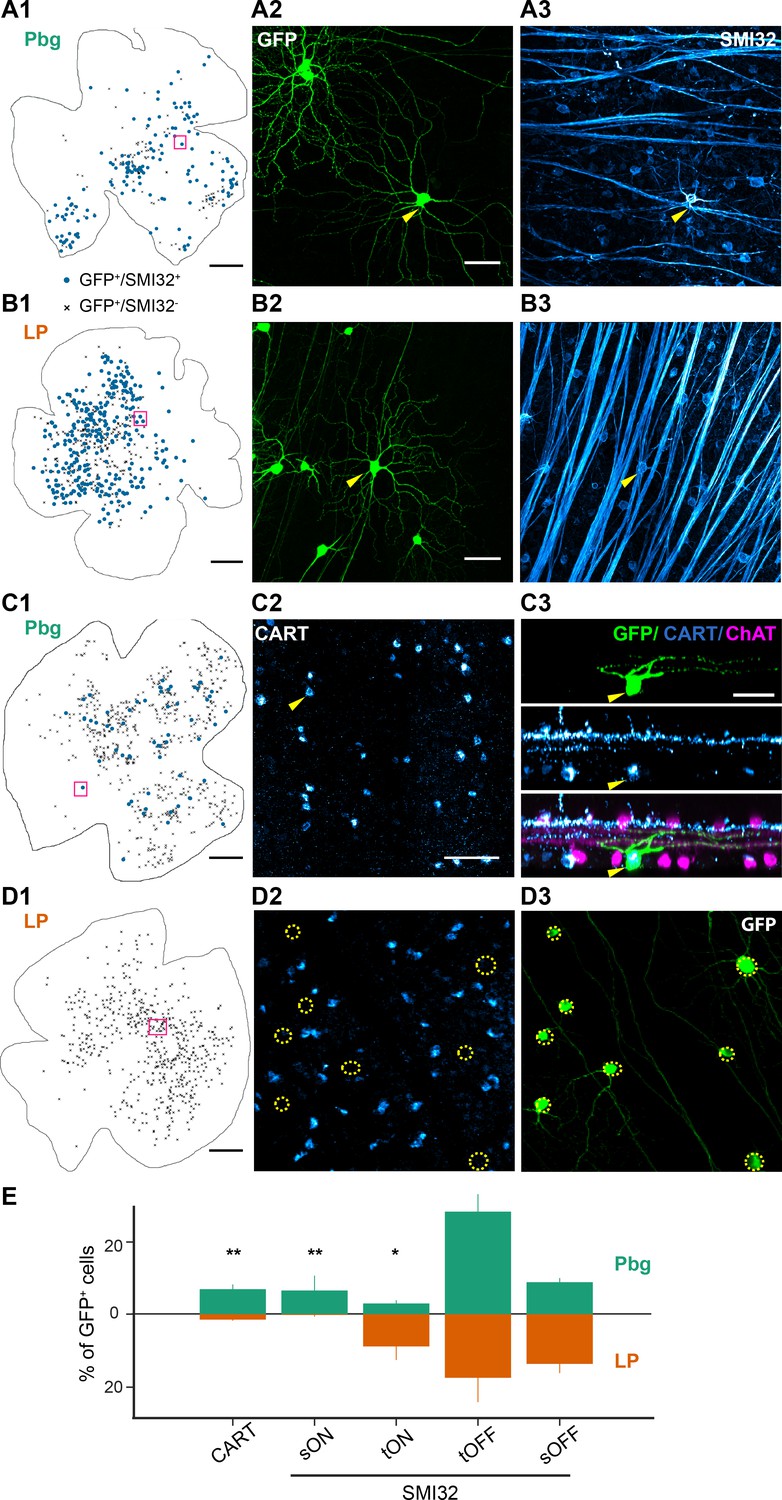
Distinct projection patterns of molecularly labeled retinal ganglion cells.
(A–B) Example retinas with SMI32–positive labeled retinal ganglion cells innervating the colliculo-parabigeminal and colliculo-pulvinar circuit. (A1, B1) Example whole-mount view of the retina with SMI32-positive cells (blue dots) and SMI32-negative cells (other labeled retinal ganglion cells after virus injections; black crosses). Scale bar: 500 µm. (A2, B2) Histological staining against GCaMP6s. Yellow arrows indicate SMI32-positive retinal ganglion cells. (A3, B3) SMI32 histological staining against neurofilament. A2-3 and B2-3 are zoomed-in versions of the magenta square in A1 and B1. Scale bar: 50 µm. (C–D) ON-OFF direction-selective cells labeled with CART. Scale bar: 500 µm. (C1, D1) Example whole-mount view of the retinas with CART-positive (dots) and CART-negative (crosses) retinal ganglion cells. (C2-3) Histological staining against CART. Yellow arrows indicate a CART-positive retinal ganglion cell and its side-view. The cell has been labeled by the rabies virus (GFP-positive; top) and is CART-positive (middle). Bottom: overlay of GFP, CART, and ChAT-staining. C2-3 are zoomed-in versions of the magenta square in C1. (D2-3) No CART-positive neurons were labeled in the example retina from pulvinar experiments. D2-3 are zoomed-in versions of the magenta square in D1. Scale bar: 50 µm. (E) Percentage of CART-positive cells and the four different alpha ganglion cell types labeled in each circuit (100% corresponds to all GCaMP6s-expressing cells). Bars indicate standard errors. *p<0.05, **p<0.01 two proportion z-test. See also Figure 3—figure supplement 1.
Figure 3—figure supplement 1
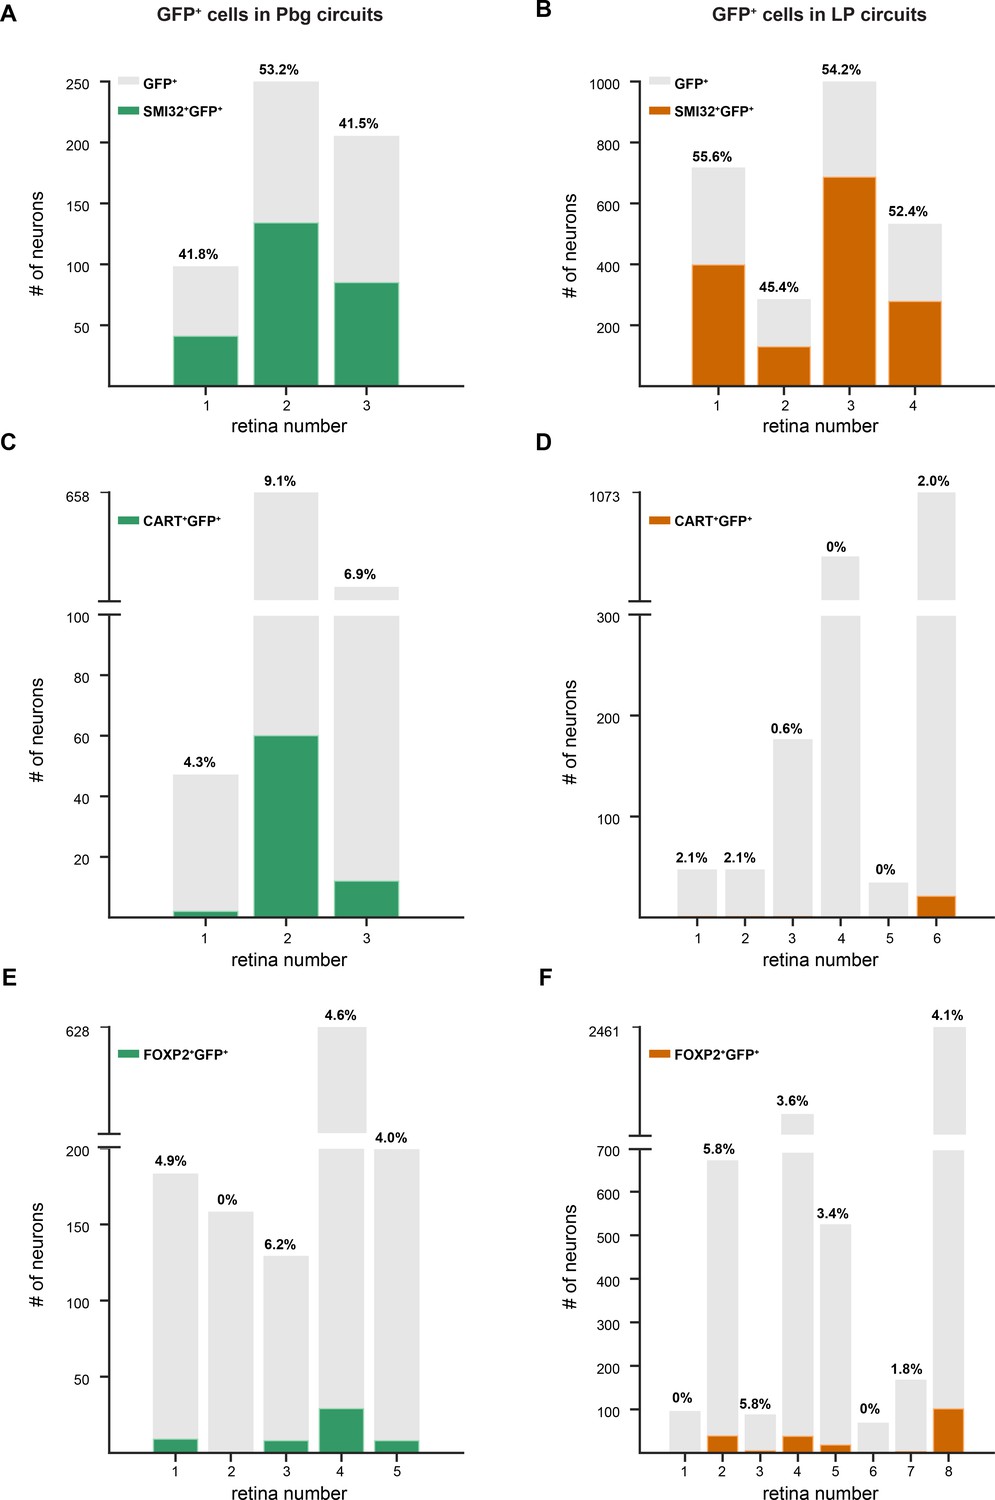
Number of GFP-positive neurons labeled by different molecular markers from colliculo-parabigeminal and colliculo-pulvinar circuit.
(A–B) Number of SMI32-positive and GFP-positive neurons (colored bars) innervating the colliculo-prabigeminal and colliculo-pulvinar circuits, respectively. Each bar is representative of one retina. Gray indicates the total number of GFP positive neurons labeled after virus injection in each retina. On top of each bar is the percentage of the double-labeled neurons of all the GFP-positive neurons. (C–D) Number of CART-positive and GFP-positive neurons innervating the two circuit. (E–F) Number of CART-positive and GFP-positive neurons innervating the two circuits.
Figure 4 with 1 supplement
Visual response properties of anatomically identified retinal ganglion cells.
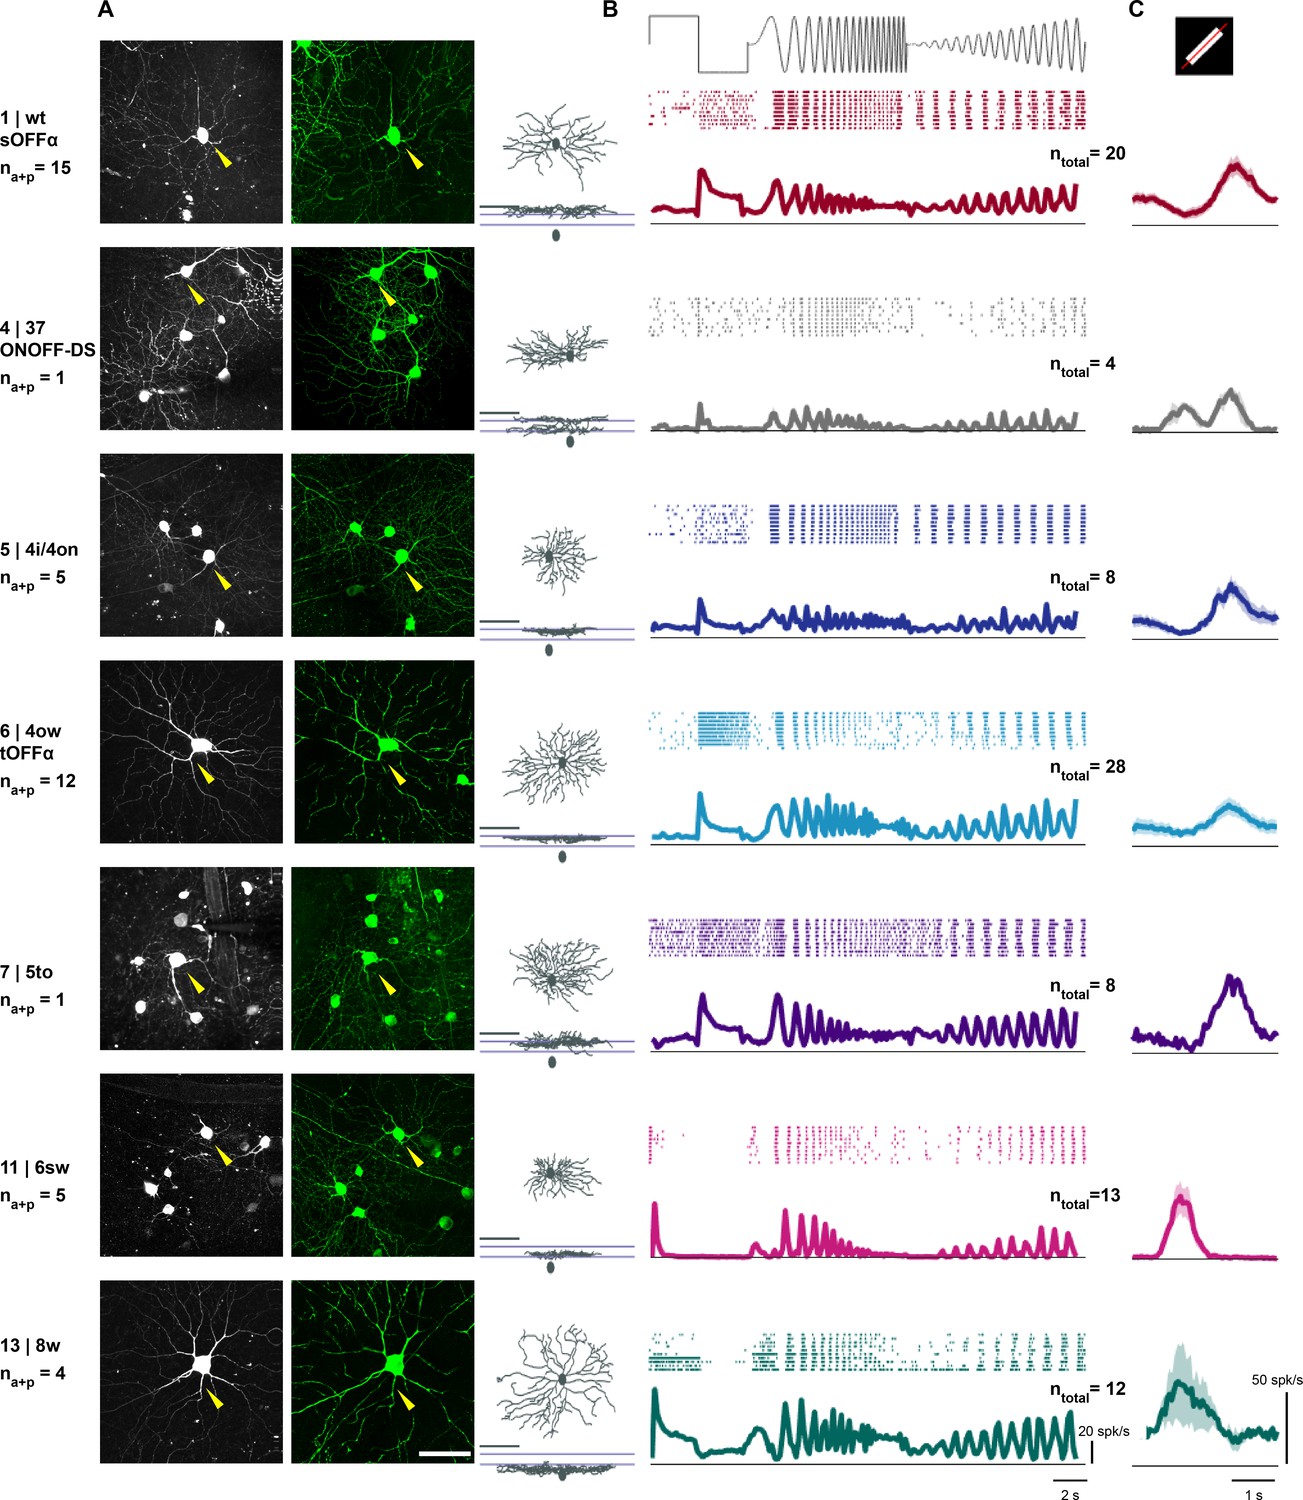
(A) Left: maximum intensity projection of a two-photon image stack of a GCaMP6-expressing cell assigned to each cluster. Cluster number, assigned cluster in the Eyewire museum and the putative name are indicated in the left column. na+p indicates the number of cells in this cluster with both anatomy and patch recordings. Middle: en-face view of a confocal microscope z-stack (maximum intensity projection) showing the same cell after staining (green: GCaMP6). Scale bar: 50 μm. Right: en-face and stratification view of this example cell after tracing. Scale bar: 100 μm. (B) Mean ± standard error of the mean (SEM) of responses to ‘chirp’ stimulus for cells assigned to an anatomical cluster. Top: raster plot of one example cell. ntotal indicates the number of cells with patch recordings. (C) Mean ± SEM of average response to a white bar moving in eight directions. The average response across all eight directions is plotted. See also Figure 4—figure supplement 1.
Figure 4—figure supplement 1

Targeted patch-clamp recording of virus-labeled retinal ganglion cells.
(A) Schematic of the setup for the two-photon targeted patch-clamp recording. (B) Top: Maximum intensity projection of a two-photon image stack showing a GCaMP6-expressing cell after the rabies injection. En-face view (middle) and side-view (bottom) of a confocal microscope z-stack (maximum intensity projection) showing the same cell after the staining process (green: GCaMP6, magenta: ChAT). Scale bar: 50 μm. (C) Response of this cell to the chirp stimulus. The black trace representing the mean firing rates (50 ms bins) across 10 trials, which are shown below in the raster plot (red). (D) Response to the black fast moving bar. (E) Response to spot stimuli consisting of a black spot presented for 2 s with 120, 240, 360, 480, 600 and 1200 μm diameter. The gray bars indicate stimulus duration. The blue line represents the spot size tuning curve. (F) Response to a linearly expanding black dot. (G) Response to a large dot that linearly dimmed from gray to black. (H–J) Responses to non-linearly expanding black dots at different speeds.
Figure 5
Spatial distribution of cell types across the retina confirms correct classification.
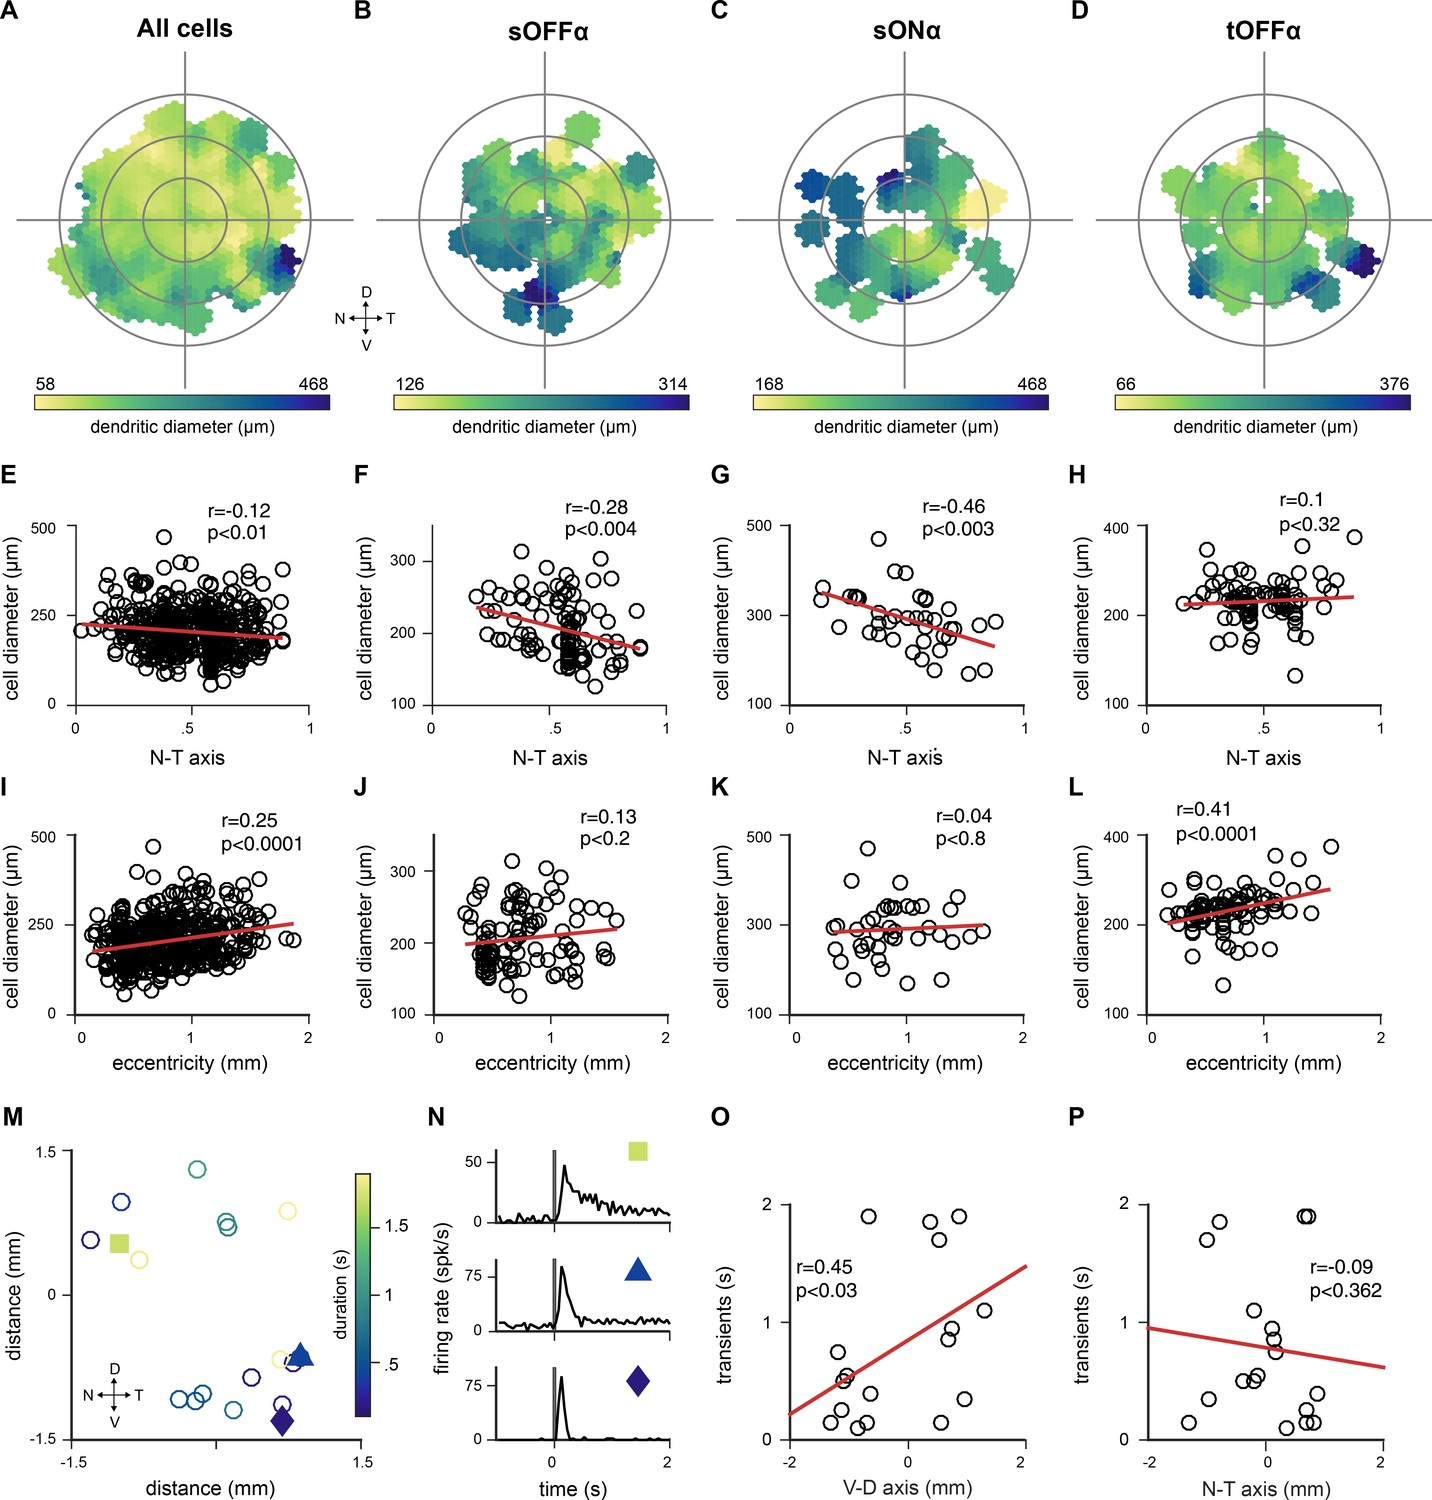
(A–D) Distribution of dendritic field diameter of all labeled cells (A), sustained OFF (sOFF) alpha cells from cluster 1 (B), sustained (sON) alpha cells from cluster 13 (C) and transient OFF (tOFF) alpha cells from cluster 6 (D) at their retinotopic location. (E–H) Dendritic field diameter of all labeled cells (E), sOFF-alpha cells (F), sON alpha cells (G) and tOFF-alpha cells (H) are plotted along the nasal - temporal axis. sOFF- and sON-alpha cells showed negative correlation (sOFF: r = −0.28, p<0.004; sON: r = −0.46, p<0.003; two-tailed Pearson correlation coefficient test). (I–L) Dendritic field size of all labeled cells (I), sOFF-alpha cells (J), sON-alpha cells (K) and tOFF-alpha cells (L) relative to eccentricity (from optic nerve to periphery). tOFF-alpha cells and the whole labeled cell population showed positive correlation (tOFF: r = 0.41, p<0.0001; all cells: r = 0.25, p<0.0001; two-tailed Pearson correlation coefficient test) M) Positions of 18 labeled retinal ganglion cells that were assigned to the tOFF-alpha cell group. D, dorsal; V, ventral; T, temporal; N, nasal. Color bar indicated response duration time. (N) Mean responses of 3 representative retinal ganglion cells from the tOFF-alpha cell group, whose locations are indicated in M. (O–P) Response durations are plotted across the ventral-dorsal axis (O) and nasal-temporal axis (P). Response transients gradually change along the ventral – dorsal axis (r = 0.45, p<0.03, Pearson correlation coefficient test).
Figure 6 with 1 supplement
In-vivo recordings from the parabigeminal nucleus and pulvinar.
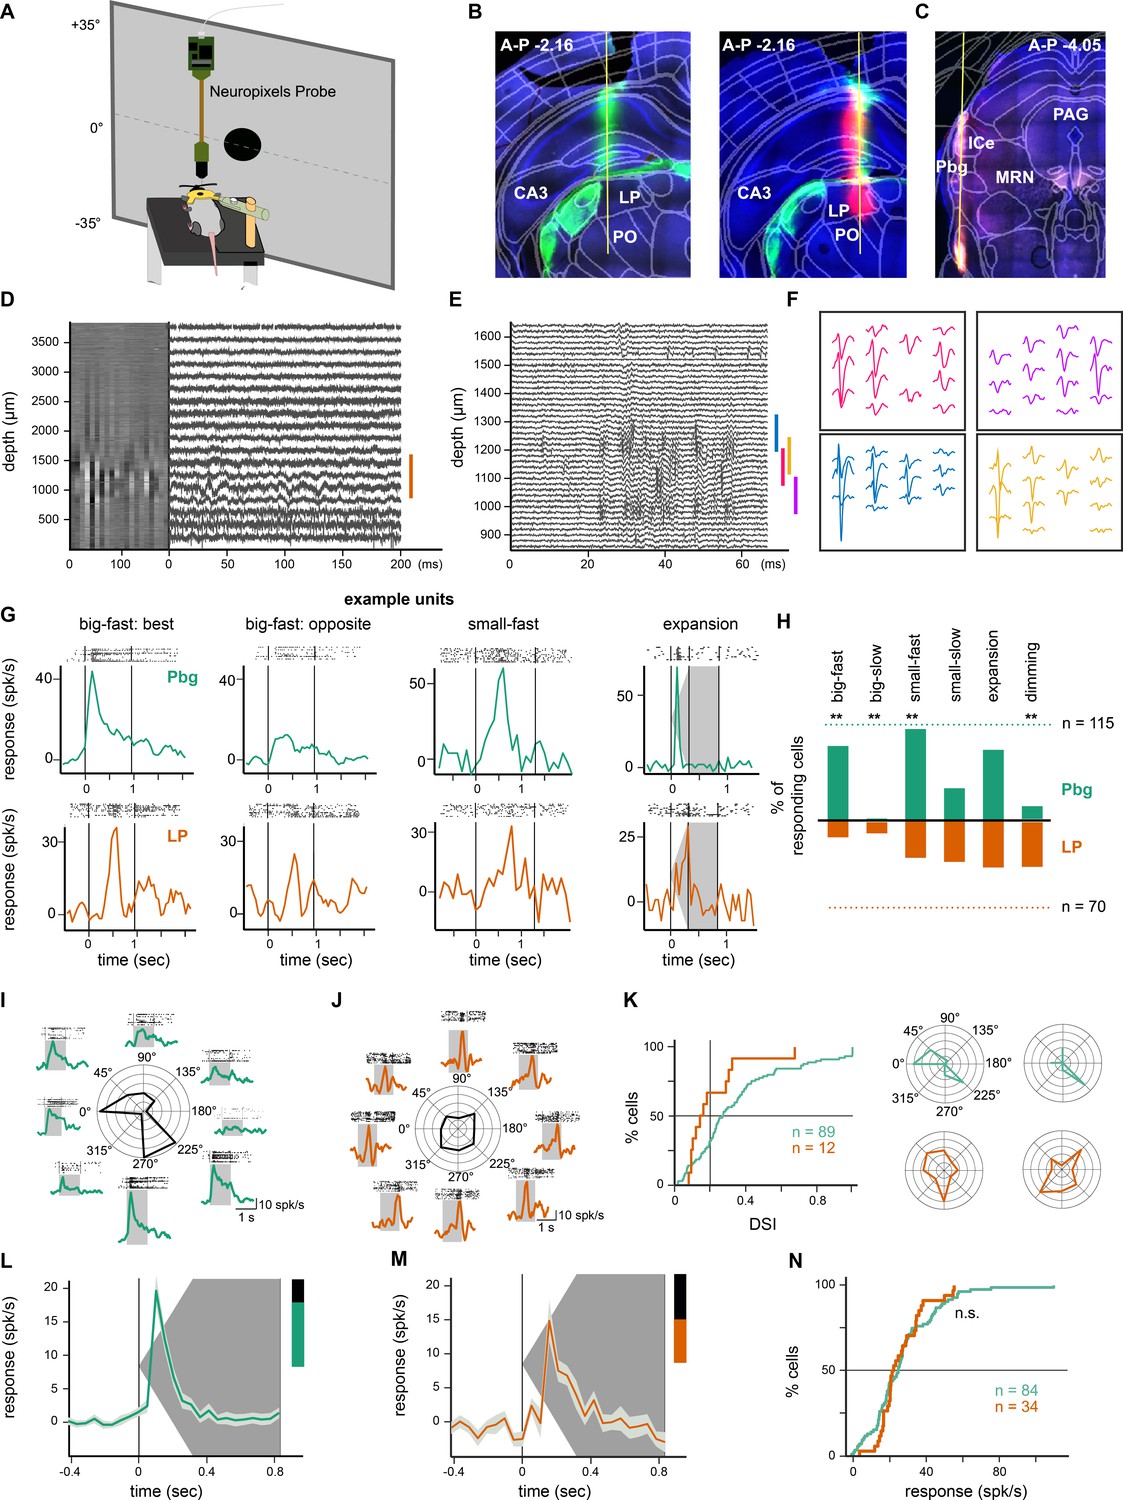
(A) Schematic of the setup for Neuropixels recordings in awake, head-fixed mice. (B) Tracks of DiI- and DiD-coated probes (green and magenta) visible in the pulvinar. Retina targets, including the LGN, were labeled using Choleratoxin-b-Alexa488 injections into the eye (green). (C) Track of DiD-coated probe in parabigeminal nucleus. (D) Heatmap of activity on all 384 electrodes (300 Hz high-pass filtered data, 20 ms bins) and traces of example electrodes at different locations. The orange bar indicates the location of the pulvinar. (E) High-pass filtered activity only on the electrodes in the pulvinar during the presentation of an expanding disc. (F) Waveform footprints of four sorted neurons. Their location is indicated with colored bars in E. (G) Example responses from parabigeminal and pulvinar recordings to 10 repetitions of different stimuli. Stimuli were: Big-fast black square (53° side length, moving at 150°/s); small-fast black dot (4° diameter, moving at 150°/s); expanding black disc (expanded from 2° to 50° of diameter within 300 ms). The vertical lines indicate the stimulus beginning and end. (H) Percentage of responding Pbg (green) and pulvinar (orange) units for six tested visual stimuli. The dashed lines correspond to 100%, that is the total number of light responsive units (n = 70 pulvinar; n = 115 Pbg). **p<0.01 two proportion z-test. (I–K) Direction-selectivity was measured with a big-fast black square moving in eight directions. Pbg example unit (I) responding preferentially to a stimulus moving to the front and to stimuli moving to the back/down. Pulvinar example unit (J) without direction preference. Distribution of direction-selectivity indices (DSI) and two example cells with a DSI around the population average (K). *p<0.05 Kolmogorov-Smirnov test. (L–M) Median ± octiles of responses from Pbg (L) and pulvinar (M) recordings to an expanding disc. Pbg: n = 84; LP: n = 34. (N) Cumulative distributions are shown for response amplitude during the expansion. See also Figure 6—figure supplement 1.
Figure 6—figure supplement 1

Parabigeminal and pulvinar responses.
(A) Probe location of two pulvinar recordings; one in the posterior LP (top) and one in the more anterior LP (bottom). Green and magenta indicate DiI and DiD that dissolved from the coated probe. Middle and right: responses to chirp stimulus from 80 neurons in the posterior LP (middle) and the anterior LP (right). (B) Population response to the chirp stimulus of all light responsive neurons in the Pbg (left) and LP (right). (C) Population response (mean ± SD) to a big, fast stimulus (53°, 150°/s). (D) Population response to a small, fast stimulus (4°, 150°/s). (E) Population response to a small, slow stimulus (4°, 21°/s).
Figure 7
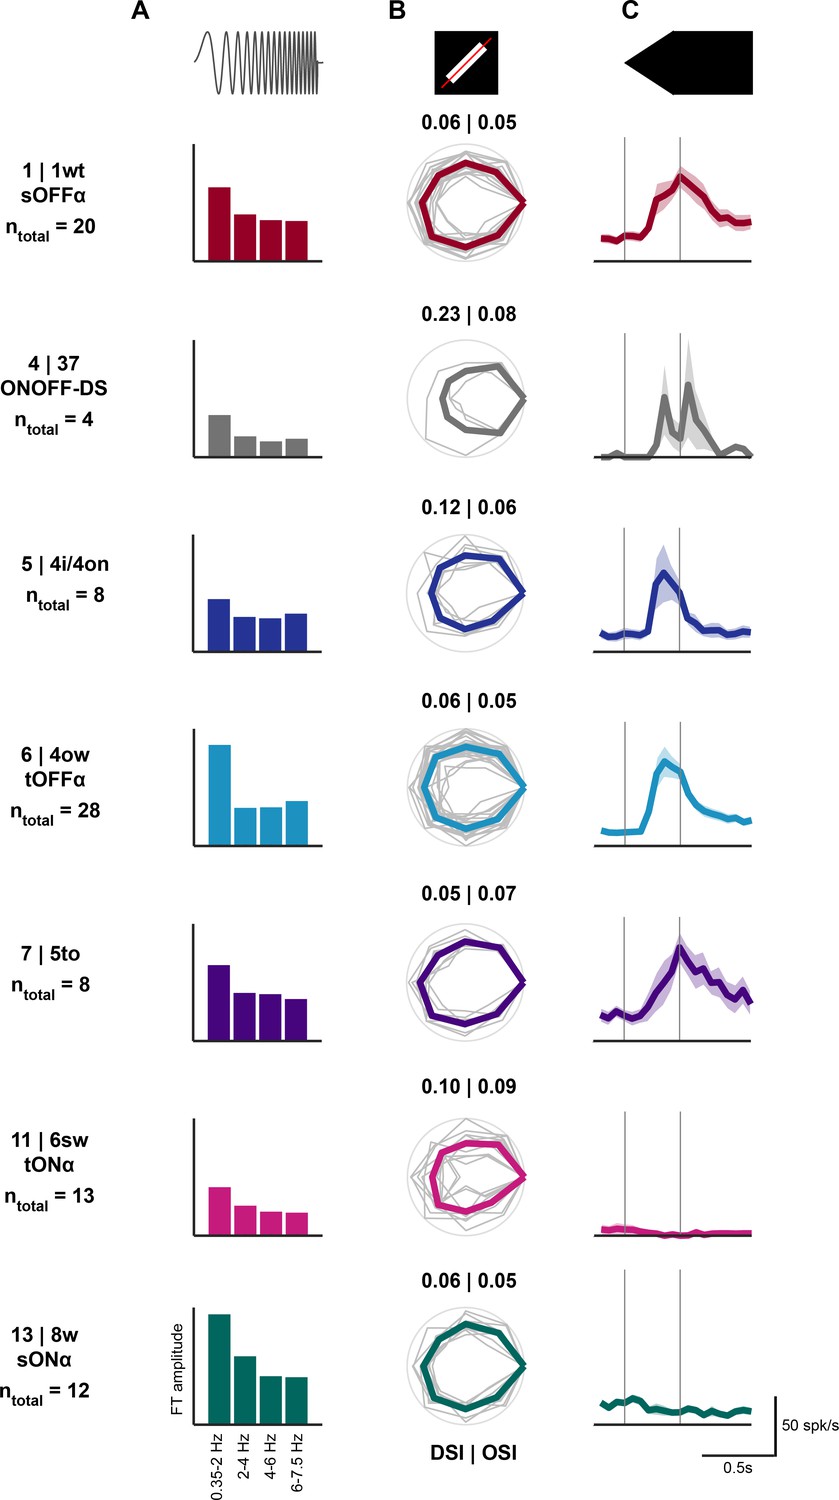
Visual responses of retinal ganglion cells innervating the colliculo-parabigeminal and the colliculo-pulvinar circuits.
ntotal indicates the number of cells with patch recording. (A) Mean Fourier Transform amplitude for four different frequency bands. (B) Peak response to each of the 8 directions of the moving bar. Peak responses were normalized for each cell to its maximum and the polar plot was rotated so that the maximal response is on the right. Gray: individual cells; color: mean polar plot. Direction-selectivity index (DSI) and orientation-selectivity indices (OSI) are indicated. (C) Mean ± SEM of responses to a linearly expanding disc.
Figure 8
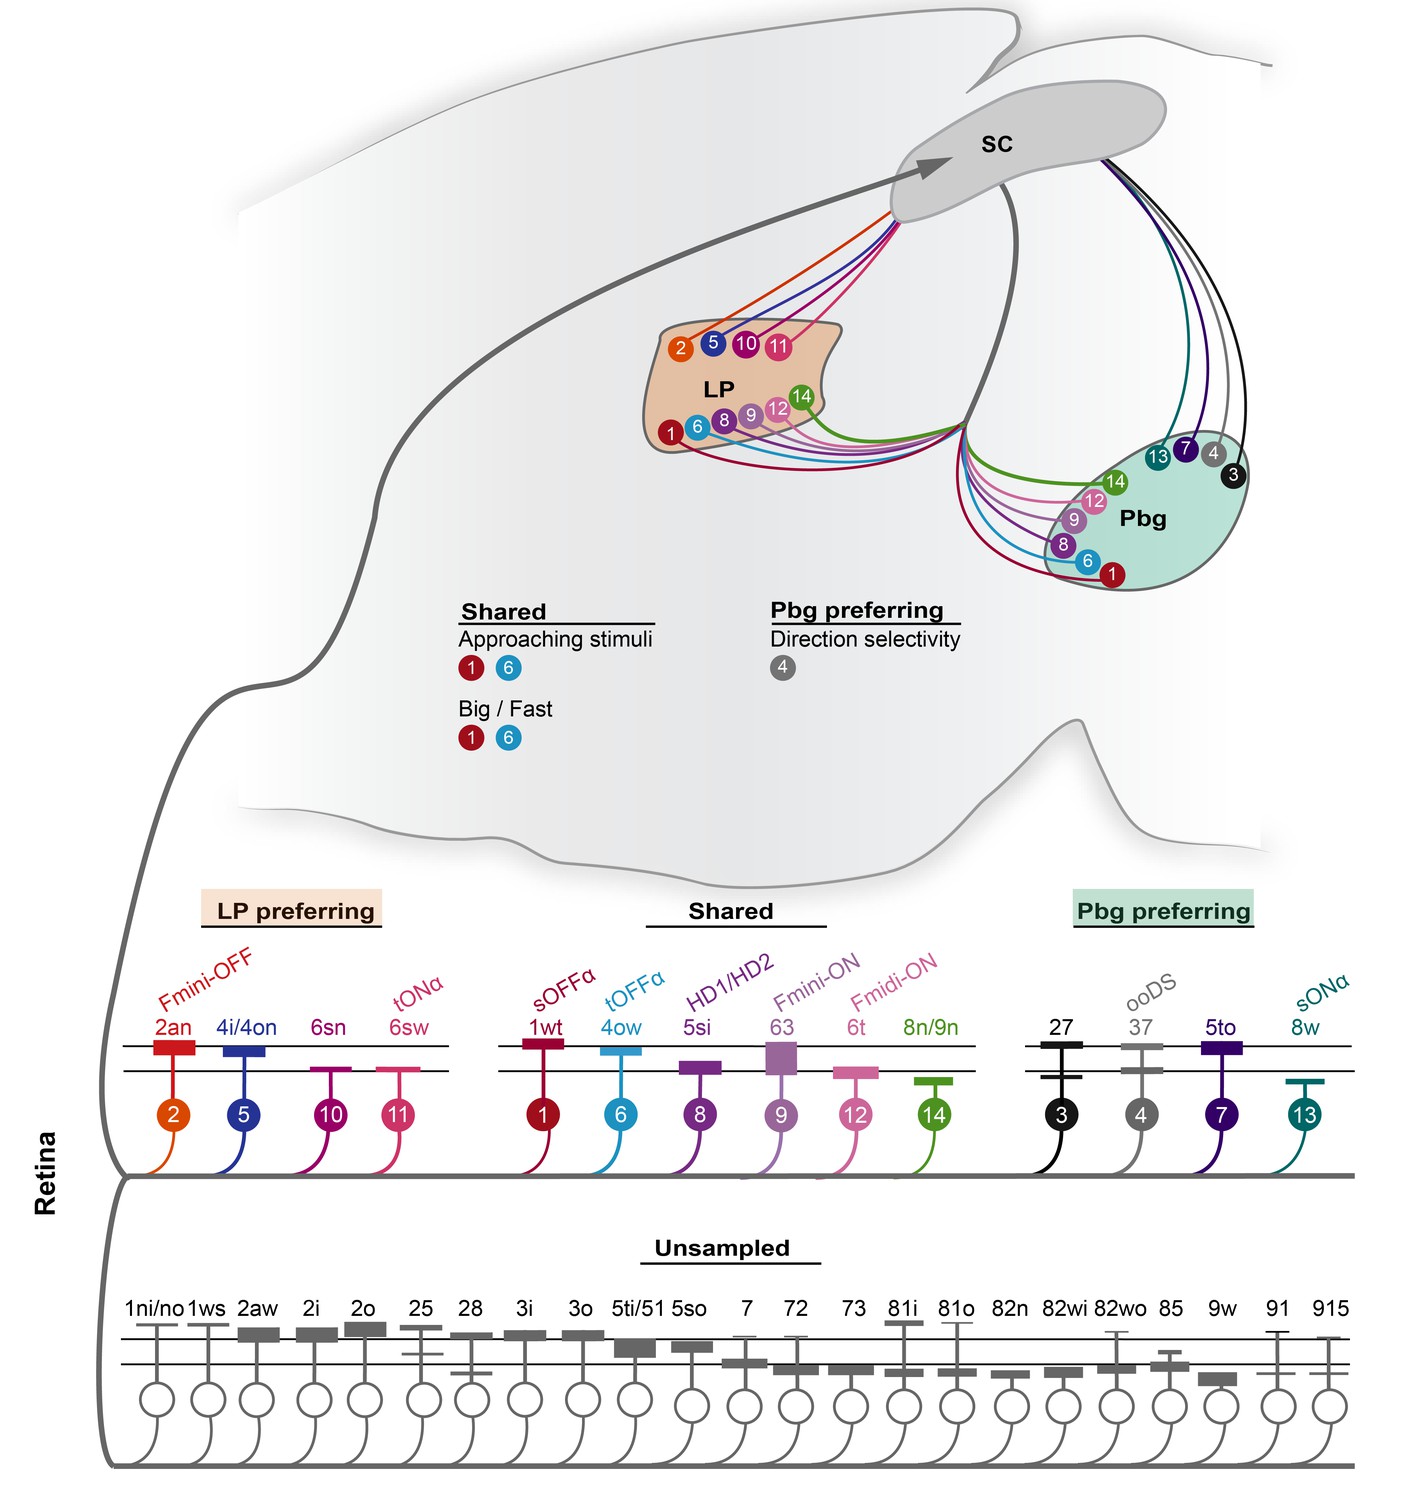
Schematic of the projection preference logic of retinal ganglion cell inputs to the superior colliculus.
In total, 14 ganglion cell types are sampled by parabigeminal- and pulvinar-projecting collicular neurons. Four cell types are biased for the LP-circuit, four have a preference for the Pbg-circuit, and six have no bias for either circuit. The color and the number of the retinal ganglion cell types corresponds to the clusters defined in Figure 2. All the other cell types of the EM data set are not sampled by our data set. The relative response properties routed to the pulvinar and/or parabigeminal nucleus are indicated with the relative color and number.
Author response image 1
Tables
Table 1
Overview of the retinal inputs to the colliculo-parabigeminal and colliculo-pulvinar circuits.
Top: Average stratification profile for each cluster. In bold are associations with published retinal ganglion cell types that are supported by molecular markers and the assignments in Bae et al. (2018). The best matches defined by visual inspection of the published anatomical and functional ganglion cell libraries are listed in normal font.
| Parabigeminal nucleus | Shared | Pulvinar | |||||||||||||
|---|---|---|---|---|---|---|---|---|---|---|---|---|---|---|---|
 | |||||||||||||||
| Anatomy | Cluster # | 3 | 4 | 7 | 13 | 1 | 6 | 8 | 9 | 12 | 14 | 2 | 5 | 10 | 11 |
| EM name | 27 | 37 | 5to | 8w | 1wt | 4ow | 5si | 63 | 6t | 8n/9n | 2an | 4i/4on | 6sn | 6sw | |
| Marker | CART | SMI32 | SMI32 | SMI32 | FOXP2 | FOXP2 | FOXP2 | SMI32 | |||||||
| Putative type | onoff-DS | sONa | sOFFa | tOFFa | HD1/ HD2 | Fmini-ON | Fmidi-ON | Fmini-OFF | tONa | ||||||
| Putative anatomical types | Sümbül et al. 2014 | D | I | F | B | H | |||||||||
| Völgyi et al. 2009 | G16 | G20/22 | G2 | G3 | G4/5 | G14 | G6 | G18 | G8 | G9 | |||||
| Krieger et al. 2017 | sONa | sOFFa | tOFFa | tONa | |||||||||||
| Rousso et al. 2018 | Fmini-ON | Fmidi-ON | Fmini-OFF | ||||||||||||
| Jacoby et al. 2017 | HD1, HD2 | ||||||||||||||
| Farrow et al. 2013 | PV0 | PV1 | PV6 | PV5 | PV7 | ||||||||||
| Baden et al. 2016 | G26 | G12 | G4 | G24 | G5 | G8 | G11/14 | G18 | G15/20 | G22/30 | G2 | G9 | G17 | G19 | |
| Known functional properties | ON responses | Direction-selective; small objects; expansion responses | Sustained OFF; big objects | Big, fast objects | Big, fast objects | ‘looming detector’, preference for big objects | ON-OFF responses; small objects; ‘high-definition’ | Small, rather slow objects | Small, rather slow objects | Very sustained ON-responses | Small objects | Expansion response | (local stimuli) | Strong responses to big and small objects | |
Key resources table
| Reagent (type) or Resource | Designation | Source or reference | Identifiers | Additional information |
|---|---|---|---|---|
| Strain, strain background (Mus musculus) | C57BL/6 | Jackson laboratory | JAX:000664 | |
| Genetic reagent (Mus musculus) | PV-Cre (B6;129P2-Pvalbtm1(cre)Arbr/J) | Jackson laboratory | JAX:008069 | |
| Genetic reagent (Mus musculus) | Ai9 (B6.Cg-Gt(ROSA)26Sortm9(CAG-tdTomato)Hze/J | The Jackson laboratory | JAX:007909 | |
| Genetic reagent (Mus musculus) | Gad2-IRES-CRE | The Jackson laboratory | JAX: 10802 | |
| Genetic reagent (Mus musculus) | Tg(Ntsr1-cre)GN209Gsat/Mmucd | Laboratory of Keisuke Yonehara | RRID:MMRR_030780-UCD | |
| Antibody | anti-GFP (rabbit polyclonal) | Thermo Fisher Scientific | Cat# A-11122; RRID:AB_221569 | 1:500 |
| Antibody | anti-GFP (chicken, polyclonal) | Thermo Fisher Scientific | Cat# A-10262; RRID:AB_2534023 | 1:500 |
| Antibody | anti-ChAT (goat, polyclonal) | Millipore | Cat# AB144P RRID:AB_11214092 | 1:200 |
| Antibody | SMI32 (mouse, monoclonal) | Biolend | Cat# 801701; RRID:AB_2564642 | 1:1000 |
| Antibody | anti-CART (rabbit, polyclonal) | Phoenix Pharmaceuticals | H-003–62; RRID:AB_2313614 | 1:500 |
| Antibody | anti-FOXP2 (goat, polyclonal) | abcam | Cat# 1307; RRID:AB_1268914 | 1:2000 |
| Antibody | anti-mCherry (chicken, polyclonal) | Novus | Cat# NBP2-25158 RRID:AB_2636881 | 1:1000 |
| Antibody | Alexa 488 donkey anti-rabbit | Thermo Fisher Scientific | Cat# A-21206; RRID:AB_2535792 | 1:500–1000 |
| Antibody | Alexa 488 donkey anti-chicken | Immuno-Jackson | Cat# 703-545-155 RRID:AB_2340375 | 1:500 |
| Antibody | Alexa 633 donkey anti-goat | Thermo Fisher Scientific | Cat# A-21082 RRID:AB_10562400 | 1:500 |
| Antibody | Cy3 donkey anti-mouse | Immuno-Jackson | Cat# 715-165-151 RRID:AB_2315777 | 1:400 |
| Antibody | Alexa 555 donkey anti-goat | abcam | Cat# ab150130 | 1:300 |
| Antibody | DyLight 405 donkey anti-rabbit | Immuno-Jackson | Cat# 715-475-150 RRID:AB_2340839 | 1:200 |
| Antibody | Cy3 donkey anti-chicken | Immuno-Jackson | Cat# 703-166-155 RRID:AB_2340364 | 1:800–1000 |
| Antibody | 435/455 Nissl Stain | Thermo Fisher Scientific | Cat# N21479 | 1:150 |
| Antibody | DAPI | Roche | Cat# 10276236001 | 1:1000 |
| Peptide, recombinant protein | Cholera Toxin Subunit B conjugated with Alexa488 | Thermo Fisher Scientific | Cat# C22841 | |
| Chemical compound, drug | Lipophilic tracers DiI, DiD, DiO | Thermo Fisher Scientific | Cat# D7776, D7757, D275 | |
| Strain, strain background (SAD-B19 rabies virus) | Rabies virus: G-coated SAD-△G-GCaMP6s | This paper | N/A | Is available upon request or from Laboratory of Botond Roska |
| Strain, strain background (SAD-B19 rabies virus) | Rabies virus: EnvA-coated SAD-△G-GCaMP6s | This paper | N/A | Is available upon request or from Laboratory of Botond Roska |
| Strain, strain background (herpes simplex virus) | HSV: hEF1a-TVA950-T2A-RabiesG-IRES-mCherry | MIT core | RN714 | |
| Strain, strain background (herpes simplex virus) | HSV: hEF1a-LS1L-TVA950-T2A-RabiesG-IRES-mCherry | MIT core | RN716 | |
| Chemical compound, drug | 10x PBS | VWR | Cat# 437117K | |
| Chemical compound, drug | 1x PBS | VWR | Cat# 444057Y | |
| Chemical compound, drug | Histofix 4% | Roche | Cat# P087.5 | |
| Chemical compound, drug | Normal Donkey Serum | Millipore | Cat# 30–100 ML | |
| Chemical compound, drug | 10% Bovine Albumin | Sigma | Cat# SRE0036-250ML | |
| Reagent | DABCO | Sigma | Cat# 290734 | |
| Chemical compound, drug | DMEM, high-glucose | Thermo Fisher Scientific | Cat# 41965062 | |
| Chemical compound, drug | Trypsin 0.05% | Thermo Fisher Scientific | Cat# 25300054 | |
| Chemical compound, drug | Fetal Bovine Serum (FBS) | Thermo Fisher Scientific | Cat# 10270106 | |
| Chemical compound, drug | 2,2'-thiodiethanol (TDE) | Sigma | Cat# 166782–500G | |
| Chemical compound, drug | ProLong Gold Antifade Mounting Medium | Thermo Fisher Scientific | Cat# P36934 | |
| Chemical compound, drug | Sodium Azide (NaN3) | Sigma | Cat# S2002-100G | |
| Chemical compound, drug | Triton X-100 | Sigma | Cat# S8875 | |
| Chemical compound, drug | Sodium Chloride (NaCl) | Sigma | Cat# S7653-250G | |
| Chemical compound, drug | Potassium Chloride (KCl) | Sigma | Cat# P5405-25G | |
| Chemical compound, drug | Calcium Chloride (CaCl2) | Sigma | Cat# C5670-100G | |
| Chemical compound, drug | Magnesium Chloride (MgCl2) | Sigma | Cat# 4880 | |
| Chemical compound, drug | D-glucose (Dextrose) | Sigma | Cat# D9434-250G | |
| Chemical compound, drug | Sodium phosphate monobasic (NaH2PO4) | Sigma | Cat# S5011 | |
| Chemical compound, drug | Sodium Hydroxide (NaOH) | Sigma | Cat# 655104–500G | |
| Chemical compound, drug | Sodium bicarbonate (NaHCO3) | Sigma | Cat# S8875-1KG | |
| Cell Line (Mesocricetus auratus) | BHK cells | Laboratory of Botond Roska/Laboratory of Karl-Klaus Conzelmann | N/A | |
| Cell Line (Mesocricetus auratus) | B7GG cells | Laboratory of BotondRoska/Laboratory of Karl-Klaus Conzelmann | N/A | |
| Cell Line (Mesocricetus auratus) | BHK-EnvA cells | Laboratory of Botond Roska/Laboratory of Karl-Klaus Conzelmann | N/A | |
| Cell Line (Homo sapiens) | HEK293T-TVA cells | Laboratory of Botond Roska/Laboratory of Karl-Klaus Conzelmann | N/A | |
| Software, algorithm | Fiji | Schindelin et al. (2012) | RRID:SCR_002285 | |
| Software, algorithm | MATLAB | Mathworks | RRID:SCR_001622 | |
| Software, algorithm | Zen lite | Zeiss | ||
| Software, algorithm | CAFFE | caffe.berkeleyvision.org | ||
| Software, algorithm | ChAT band detector | This paper | https://github.com/ farrowlab/ChATbandsDetection | |
| Software, algorithm | VNET | github.com/faustomilletari/VNet | ||
| Software, algorithm | PYTHON | Python Software Foundation | www.python.org | |
| Software, algorithm | t-distributed Stochastic Neighbor Embedding | Maaten and Hinton, 2008 | ||
| Software, algorithm | CANDLE | Coupé et al., 2012 | ||
| Software, algorithm | sparse PCA | http://www2.imm.dtu.dk/projects/spasm | ||
| Software, algorithm | nanconv | Benjamin Kraus | http:// mathworks.com/matlabcentral/fileexchange/41961-nanconv | |
| Software, algorithm | retistruct | Sterratt et al., 2013 | http://davidcsterratt.github.io/retistruct/ | |
| Software, algorithm | SpikeGLX | https://billkarsh. github.io/SpikeGLX/ | ||
| Software, algorithm | GNU Octave | Free Software Foundation | www.gnu.org/software/octave | |
| Software, algorithm | Psychophysics Toolbox | Psychtoolbox | http://psychtoolbox.org | |
| Software, algorithm | SpyKING CIRCUS | Yger et al. 2018 | https://spyking-circus.readthedocs.io | |
| Software, algorithm | Phy | Cortex Lab at University College London | https://phy-contrib.readthedocs.io https://github.com/kwikteam/phy | |
| Software, algorithm | WaveSurfer (version: 0.918) | Janelia Research Campus | http://wavesurfer.janelia.org/ | |
| Software, algorithm | ScanImage | Vidrio Technoloies | http://scanimage. vidriotechnologies.com | |
| Software, algorithm | Allen CCF Tools | Shamash et al. (2018) | https://github.com/cortex-lab/allenCCF | |
| Software, algorithm | TREES toolbox | Cuntz et al. (2011) | https://github.com/cuntzlab/treestoolbox | |
| Other | Rapid Flow Filters 0.2 µm pore size | VWR | Cat# 514–0027 | |
| Other | Premium Standard Wall Borosilicate capillary glass | Warner Instrument | Cat# G100-4 | |
| Other | Wiretrol II capillary micropipettes | Drumond Scientific | Cat# 5-000-2005 | |
| Other | Borosilicate glass | Sutter Instrument | Cat# BF100-20-10 | |
| Other | Laser-Based Micropipette Puller | Sutter Instrument | Cat# P-2000 | |
| Other | Small Animal Stereotaxic Workstation | Narishige | Cat# SR-5N | |
| Other | Stereotaxic Micromanipulator | Narishige | Cat# SM-15R | |
| Other | Hydraulic Oil Micromanipulator | Narishige | Cat# MO-10 | |
| Other | Oil Microinjector | Narishige | Cat# IM-9B | |
| Other | Two-photon microscope | Scientifica | Serial# 14200 | |
| Other | 780 nm LED light source | Thorlabs | Cat# M780L3 | |
| Other | Patch-Clamp amplifier | Molecular Device | Axon Multiclamp 700B | |
| Other | Patch-Clamp microscope | Scientifica | Slice Scope | |
| Patch-Clamp manipulator | Scientifica | Serial# 301311 | ||
| Other | Zeiss LSM 710 confocal microscope | Zeiss | Cat# LSM710 | |
| Other | Neuropixels phase 3A system | Imec | ||
| Other | FPGA Kintex-7 KC705 | Xilinx | EK-K7-KC705-G | |
| Other | Micromanipulator | Sensapex | Cat# uMp-1 |
Additional files
Download links
A two-part list of links to download the article, or parts of the article, in various formats.
Downloads (link to download the article as PDF)
Open citations (links to open the citations from this article in various online reference manager services)
Cite this article (links to download the citations from this article in formats compatible with various reference manager tools)
A projection specific logic to sampling visual inputs in mouse superior colliculus
eLife 8:e50697.
https://doi.org/10.7554/eLife.50697


