Homeostasis of branched-chain amino acids is critical for the activity of TOR signaling in Arabidopsis
- Michigan State University, United States
- Great Lakes Bioenergy Research Center, Michigan State University, United States
Figures
Figure 1 with 2 supplements
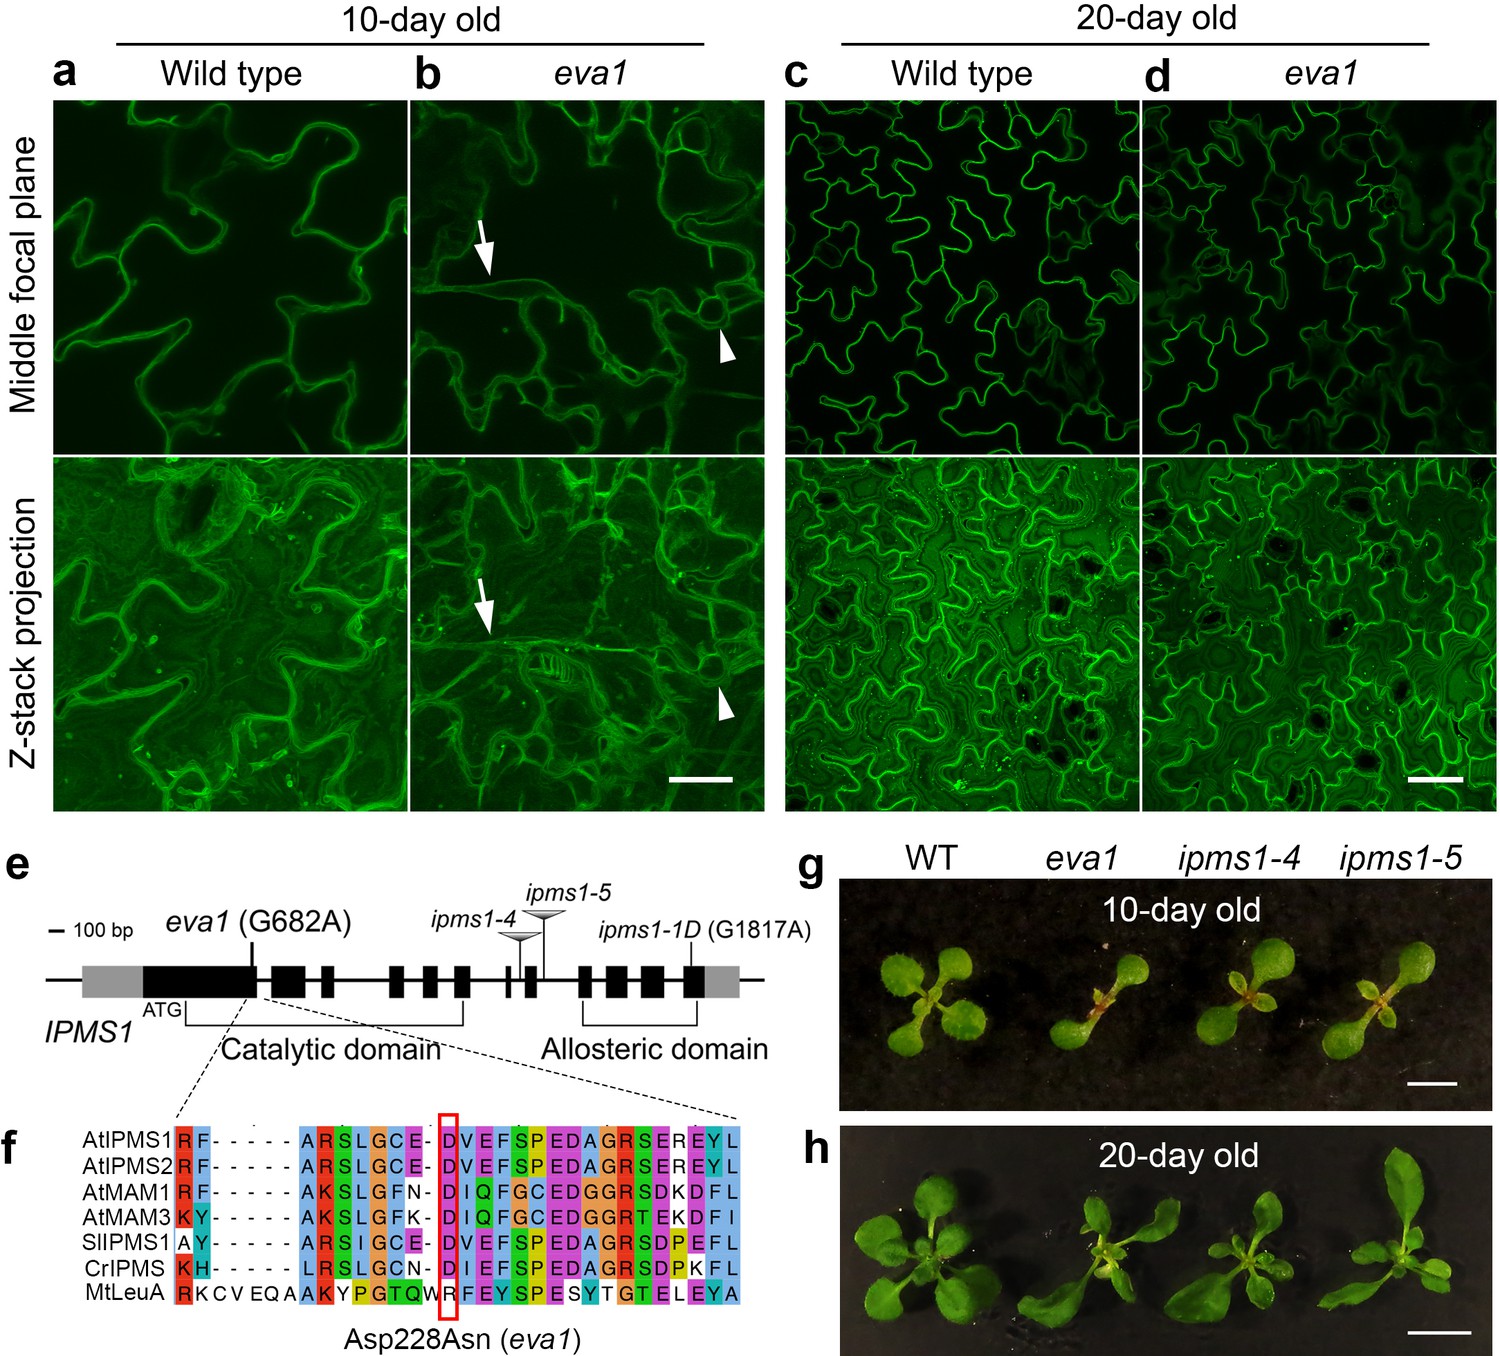
Identification of a mutant with defects in vacuole morphogenesis.
(a – d) Confocal images of cotyledon epidermal cells expressing tonoplast marker GFP-δTIP in 10 day old (a and b) and 20 day old (c and d) wild type and eva1. The top panels present single images of the middle focal plane of the epidermal cells. The bottom panels present Z-stack maximal projections, which is a stack of about 20 single images with 20 μm intervals that fully span the top-to-bottom Z-axis of the epidermal cells. Arrows point to TVSs and arrowheads indicate presumably small vacuoles, which are prominent in eva1. Scale bar in (a and b), 20 μm. Scale bar in (c and d), 50 μm. (e) Genomic structure of IPMS1 (AT1G18500). Gray boxes: UTRs; black boxes: exons; lines: introns. (f) Amino acid sequence alignment of IPMS1 homologs using T-COFFEE in Jalview. Amino acids are grouped by color with ClustalX based on their similarity of physicochemical properties. At, Arabidopsis thaliana; Sl, Solanum lycopersicum; Cr, Chlamydomonas reinhardtii; Mt, Mycobacterium tuberculosis. The amino acid substitution of eva1 is denoted by a red box. (g and h), Photographs of 10-day old (g) and 20-day old (h) plants. Scale bar in g, 0.5 cm. Scale bar in h, 1 cm.
Figure 1—figure supplement 1
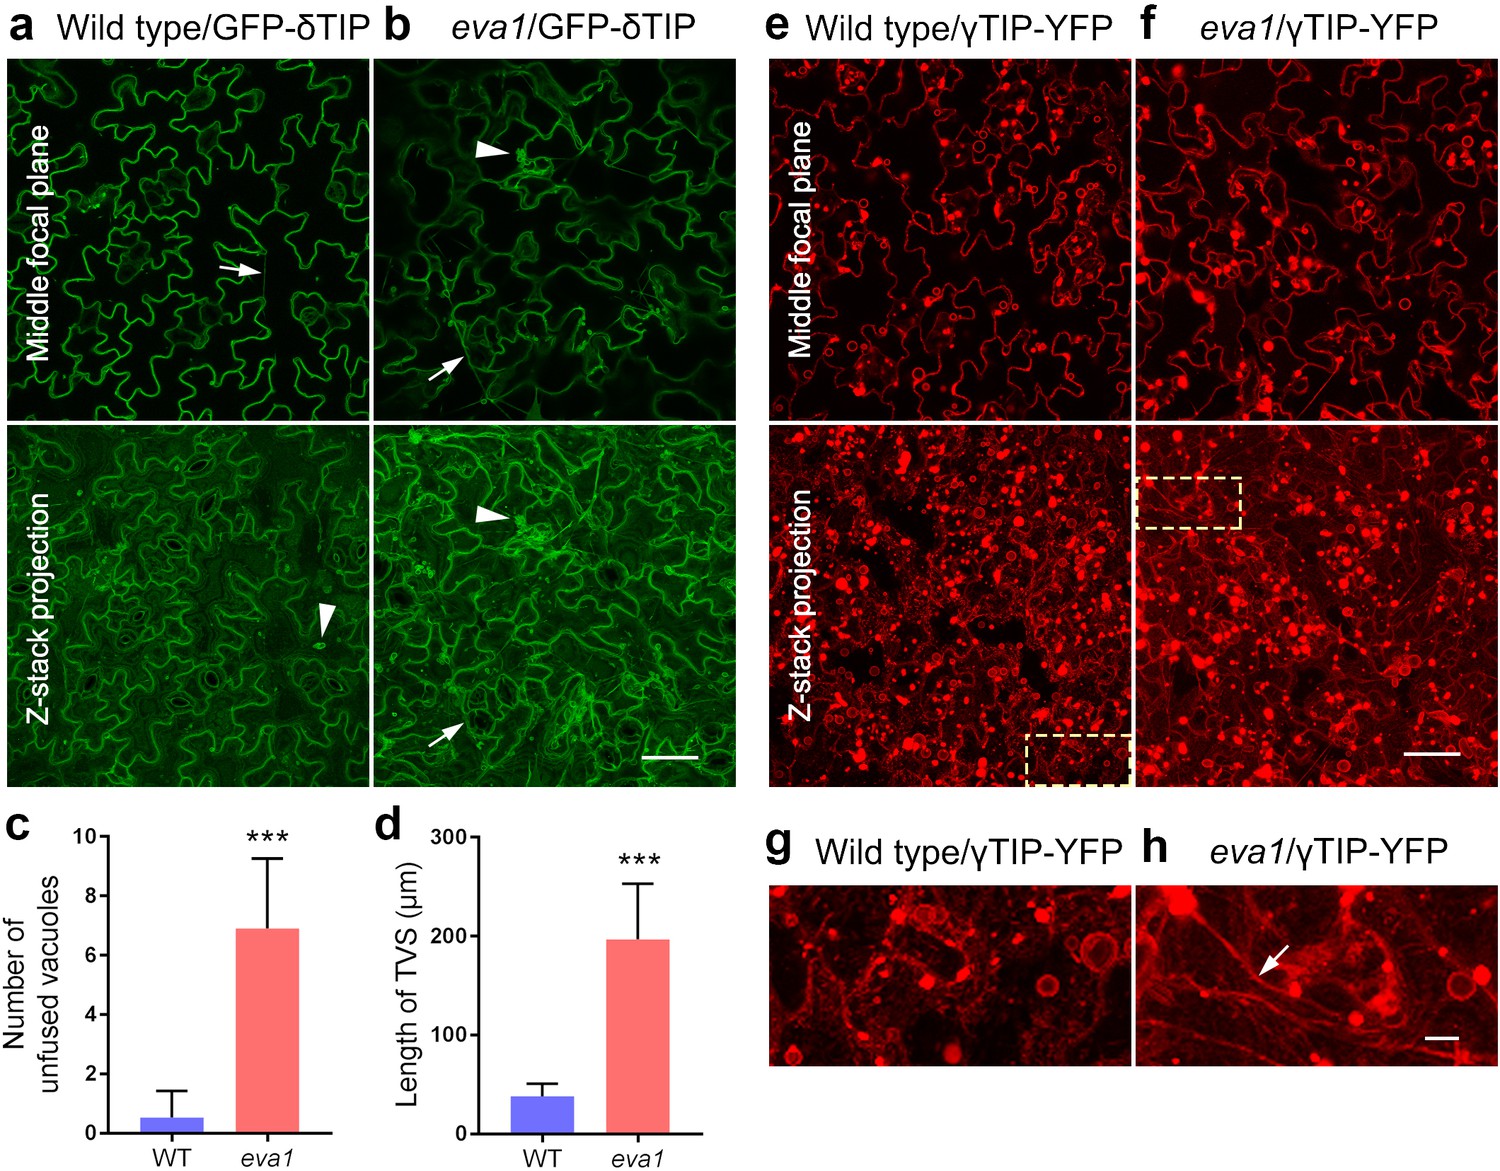
eva1 mutants show vacuolar phenotypes of TVSs and presumably unfused vacuoles.
(a and b), Confocal images of cotyledon epidermal cells expressing GFP-δTIP in 10 day old wild type and eva1 plants. Arrows point to TVSs and arrowheads indicate small vacuoles, which are rarely seen in wild type but prominent in eva1. Scale bar for (a and b), 50 μm. (c and d), Quantification of eva1 vacuolar phenotypes. (c) Number of presumably unfused vacuoles. n = 40 cells for each genotype. (d) Length of TVSs. Notably, in 10 day old wild-type cotyledon epidermal cells, TVSs are rarely observed. Cells of eva1 background have numerous TVSs, and only the longest string in each cell was measured. n = 16. Values are mean ± SD. The asterisks indicate significant differences compared to wild type (***p≤0.001, unpaired t test). (e – h) Confocal images of cotyledon epidermal cells expressing γTIP-YFP in 10 day old wild type and eva1 plants. Dash-line yellow boxes in e and f) indicate regions of interest, which are magnified in (g and h). The arrow indicates enhanced TVSs. Scale bar for (e and f), 50 μm. Scale bar for (g and h), 10 μm.
Figure 1—figure supplement 2
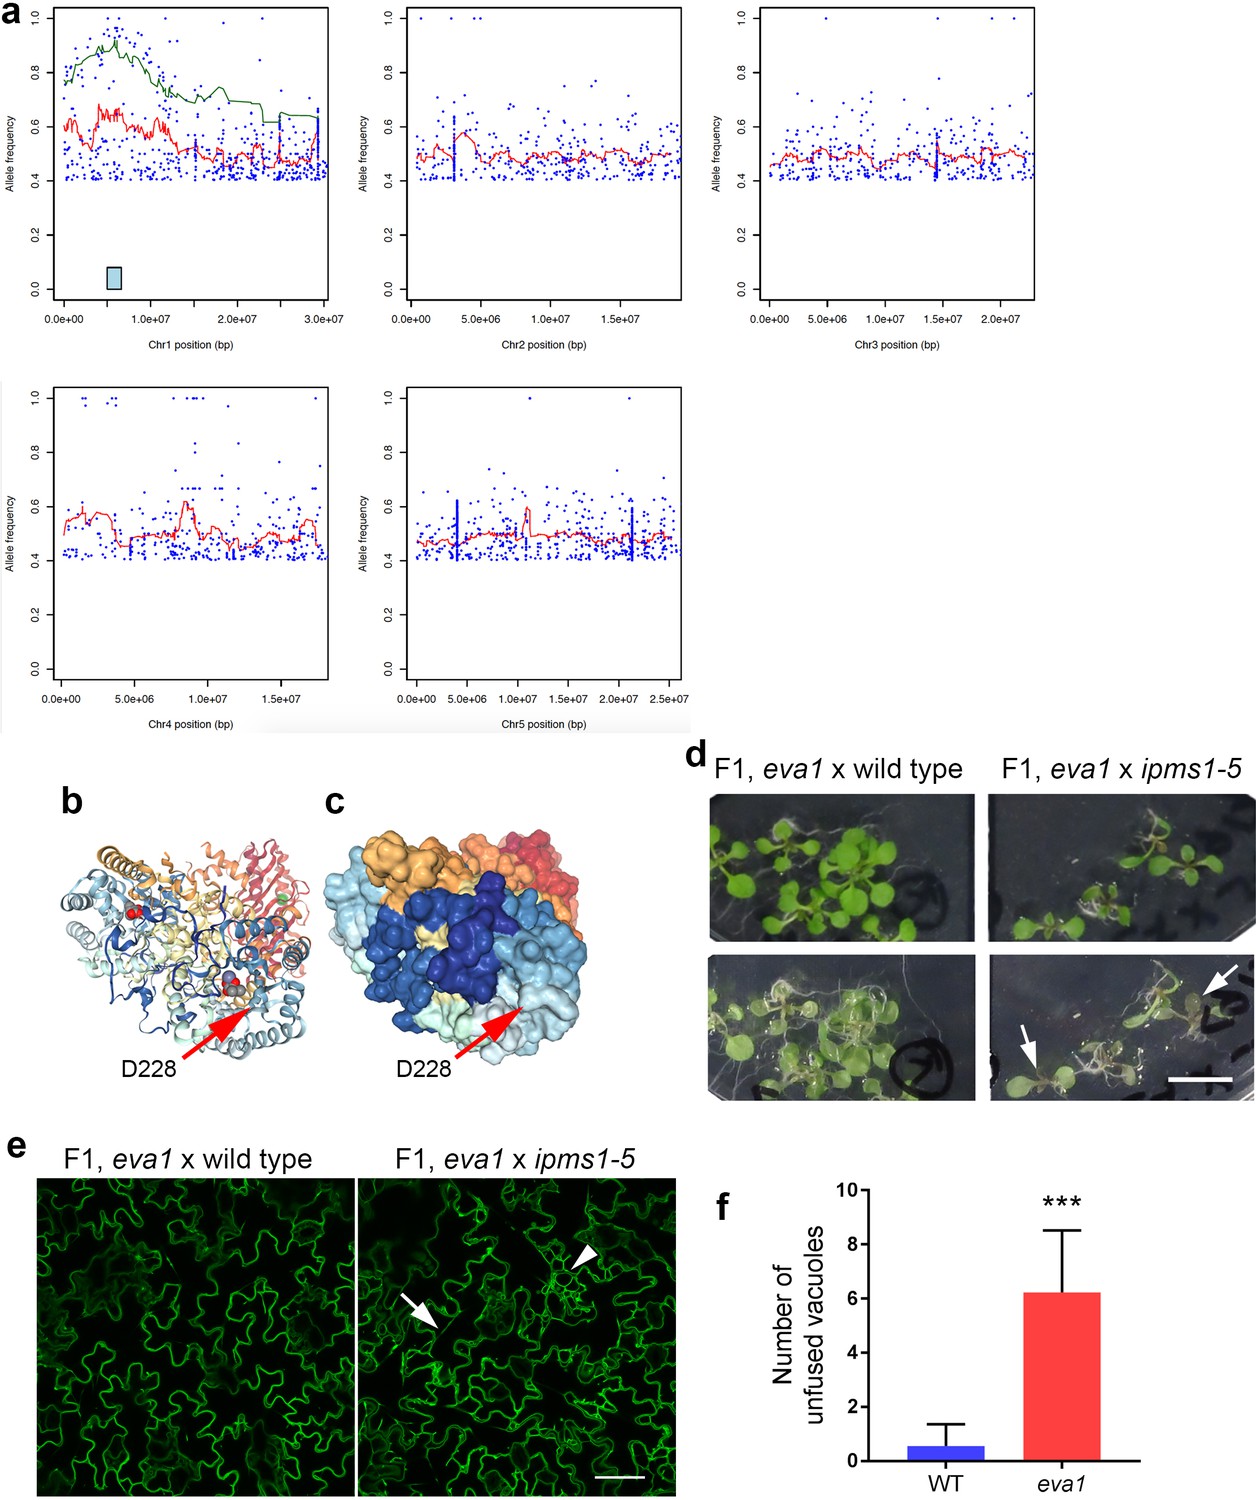
The causal mutation of eva1 mutant is mapped to IPMS1.
(a) Mapping the causal mutation using bulk sergeant analysis. Horizontal and vertical axes are genomic position and observed allele frequency, respectively. Blue dots represent the SNPs identified from a pool of F2 population with mutant phenotypes. Red lines represent smoothed curves over 100 SNP windows with SNPs whose allele frequency are greater than 0.4. The green line represents a smoothed curve over 10 SNP windows with SNPs whose allele frequency are greater than 0.6. The light blue box indicates the mapping interval. (b and c) Cartoon (b) and space-filling (c) models of the IPMS1 dimers generated by fitting Arabidopsis IPMS1 to the Mycobacterium tuberculosis homolog structure (PDB: 1SR9) using Phyre2 program. The models are rainbow colored from N-terminus as blue to C-terminus as red. Red arrows point to the position of residue D228, which is substituted in eva1. A regulatory Leucine molecule is shown as a green ball; two 2-oxoisovalerate molecules are depicted as space-filling models. The models of IPMS1 dimers are rotated towards another substrate acetyl-CoA, which approaches from the viewer’s perspective. (d) Examination of growth phenotypes of 10 day old F1 plants from crosses of eva1 with either wild type (Col-0) or ipms1-5. Photographs show adaxial and abaxial sides of seedlings. Arrows point to visible accumulation of anthocyanins in cotyledon petioles and emerging true leaves. Scale bar, 1 cm. (e and f) Examination of vacuolar phenotypes of 10 day old F1 plants from crosses of eva1 with either wild type (Col-0) or ipms1-5. (e) Single-plane confocal images of cotyledon epidermal cells expressing GFP-δTIP. Arrow indicates prominent TVSs; arrowhead indicates small vacuoles. Scale bar, 50 μm. (f) Quantification of presumably unfused vacuoles. n = 40 cells for each genotype. Values are mean ± SD. The asterisks indicate significant difference compared to wild type (***p≤0.001, unpaired t test).
Figure 2
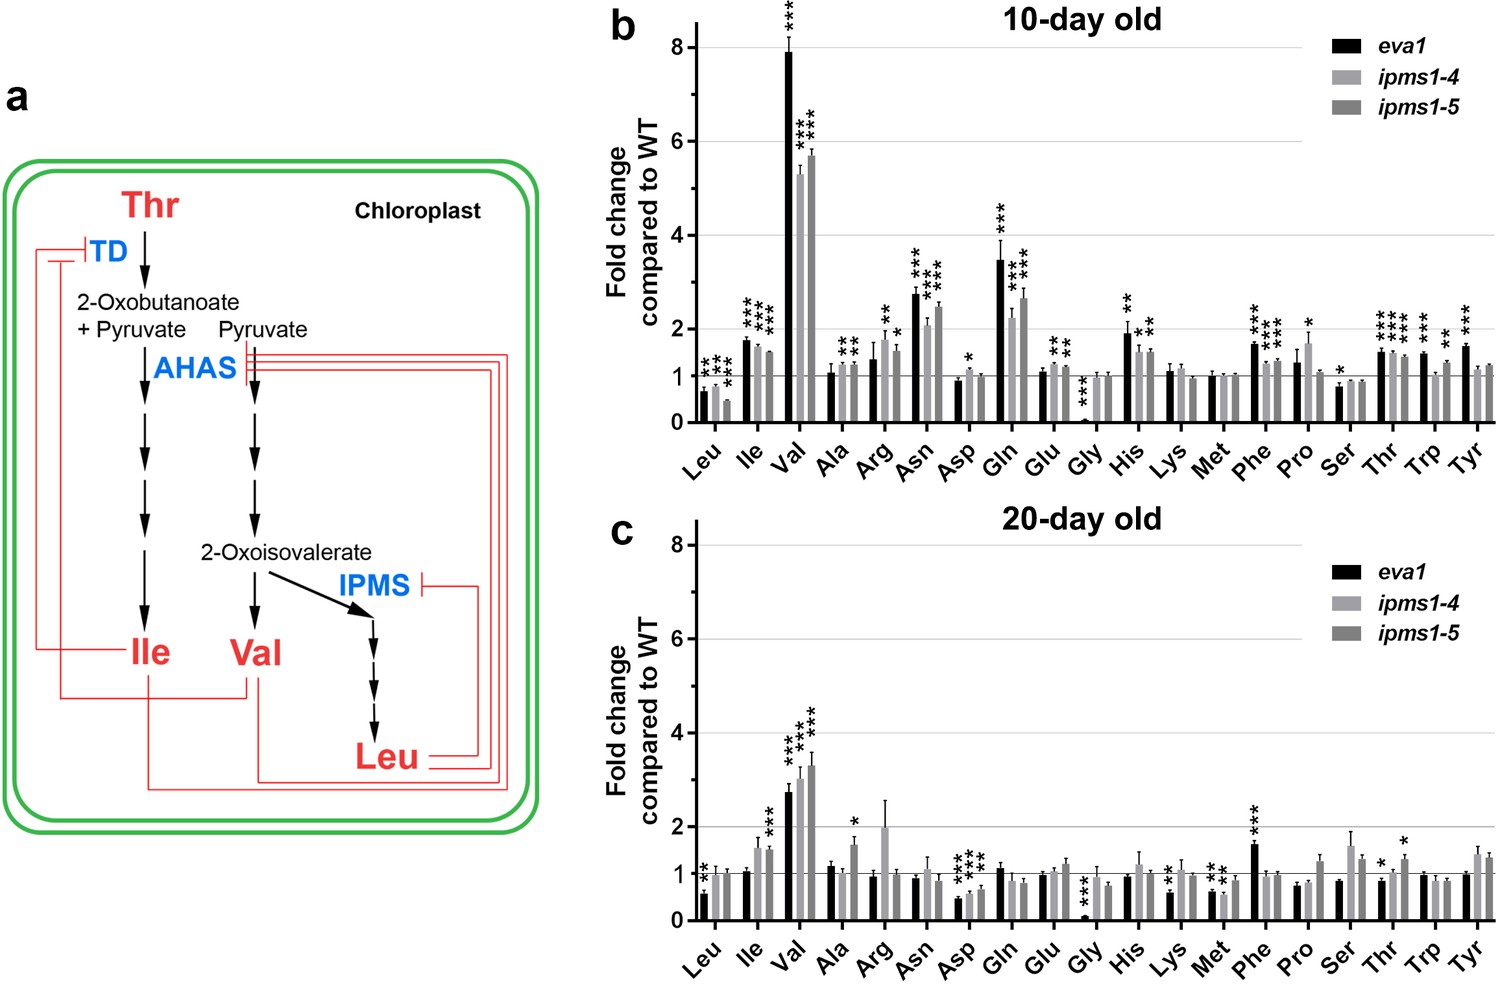
Amino acid profiling of IPMS1 loss-of-function mutants.
(a) Schematic of the BCAA biosynthetic pathway in the chloroplast. Red lines show known feedback inhibitions of enzymes by end products. (b and c) Fold changes of each free amino acid in eva1, ipms1-4 and ipms1-5 compared to wild type. Values are mean ± SEM. For 10 day-old sampling, n = 7 for WT, n = 5 for eva1, n = 8 for ipms1-4, n = 7 for ipms1-5. For 20 day-old sampling, n = 6 for each genotype. The asterisks indicate significant differences compared to the wild type (*p≤0.05, **p≤0.01, ***p≤0.001, unpaired t test).
-
Figure 2—source data 1
The BCAA biosynthesis pathway is up-regulated in young seedlings of eva1 and IPMS1 loss-of-function mutants.
Amino acids were extracted from aerial tissues of 10 days old seedlings and rosette leaves of 20 days old plants. Each value represents the mean ± SEM. The asterisks indicate significant difference compared to the GFP-δTIP as wild type (WT) (*p≤0.05, **p≤0.01, ***p≤0.001, unpaired t test). aFW, fresh weight; bFC, fold change compared to GFP-δTIP; cFAA, total 19 free amino acids without cysteine.
- https://cdn.elifesciences.org/articles/50747/elife-50747-fig2-data1-v2.xlsx
Figure 3 with 3 supplements
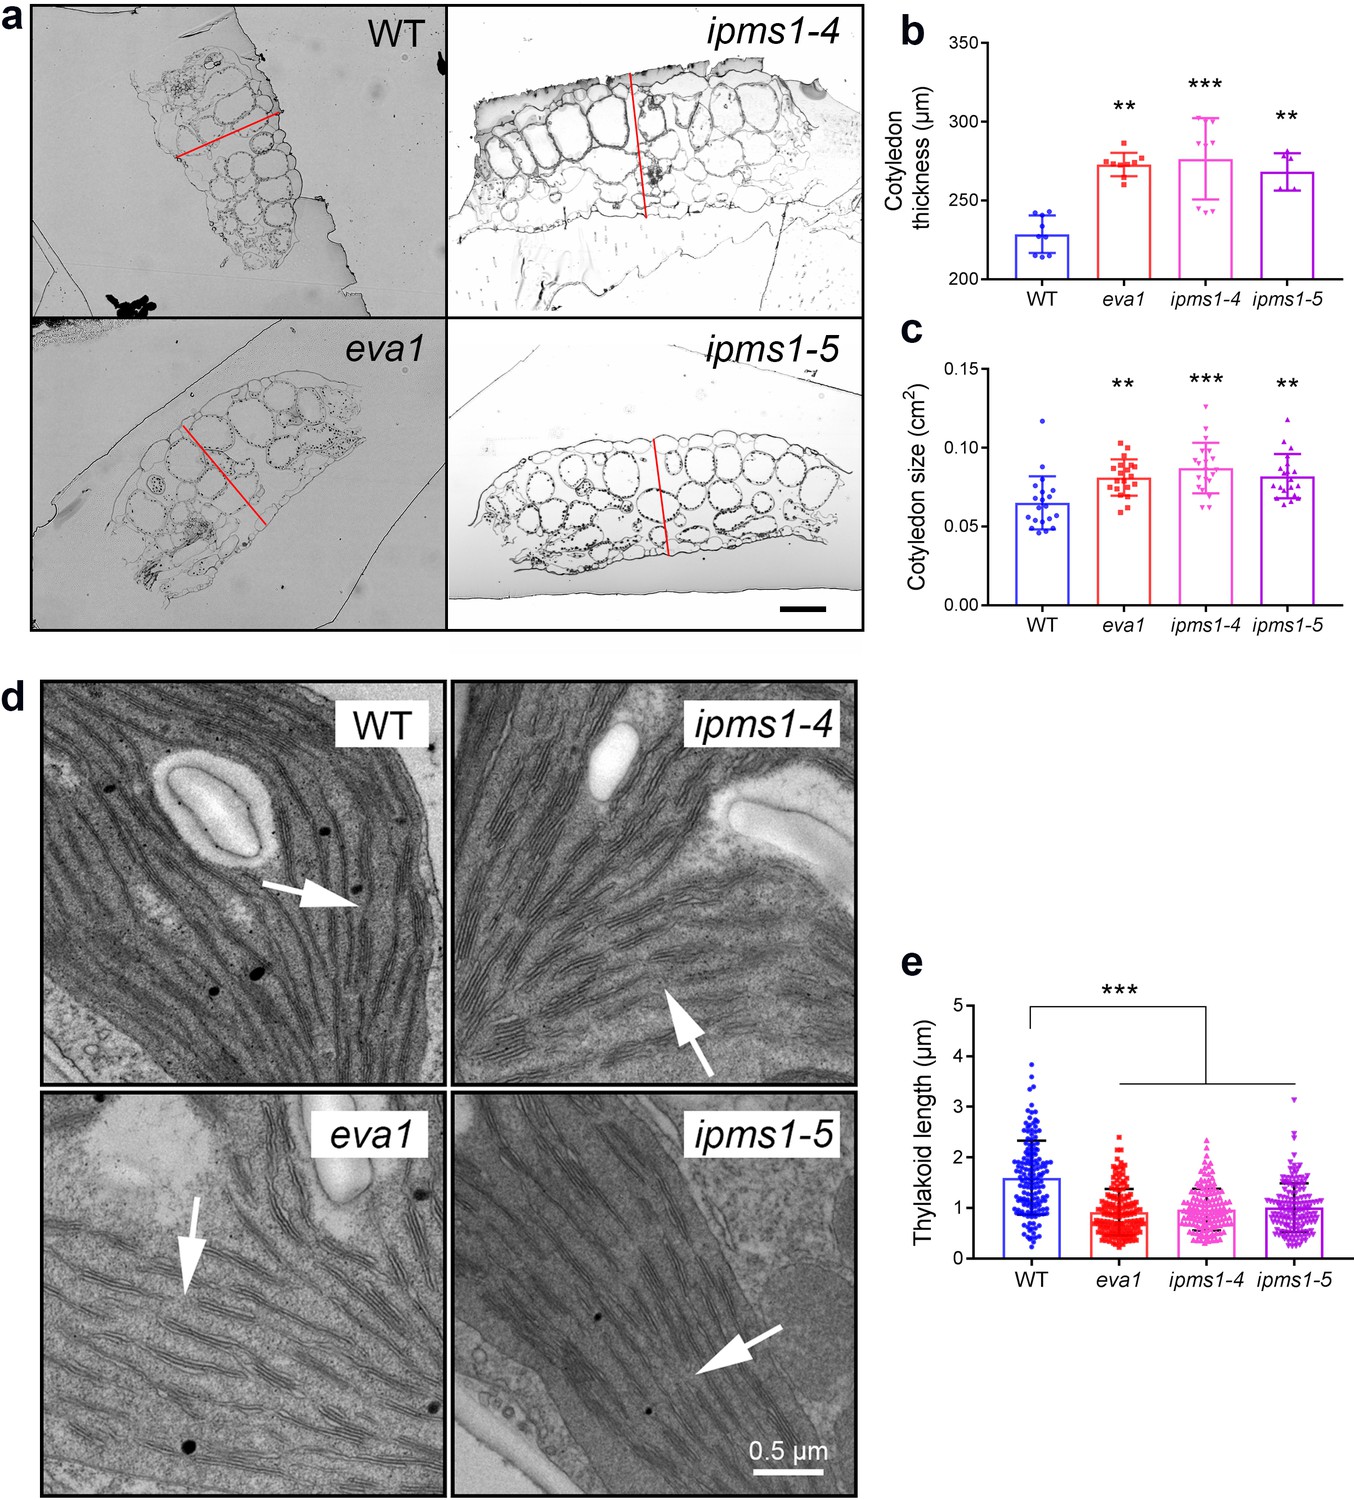
Mutants of IPMS1 show defects in cotyledon architecture and chloroplast ultrastructure.
(a) Light microscopic images of cotyledon cross sections. Cotyledon thickness is denoted by red lines. Scale bar, 100 μm. (b) Measurement of cotyledon thickness. n = 9 for WT, eva1 and ipms1-4; n = 6 for ipms1-5. (c) Measurement of cotyledon size. n = 20 for each genotype. (d) Representative transmission electron microscopy images of chloroplasts. Arrows point to connecting stroma thylakoids that are existing in WT and absent in mutants. Scale bar, 0.5 μm. (e) Measurement of thylakoid length. Five cotyledons from each genotype were sampled for imaging, and at least 30 stroma thylakoids were measured in each sample (n ≥ 150). For all graphical representations of data, columns are mean ± SD. The asterisks indicate significant differences of each mutant compared to wild type (***p≤0.001, **p≤0.01, unpaired t test).
Figure 3—figure supplement 1
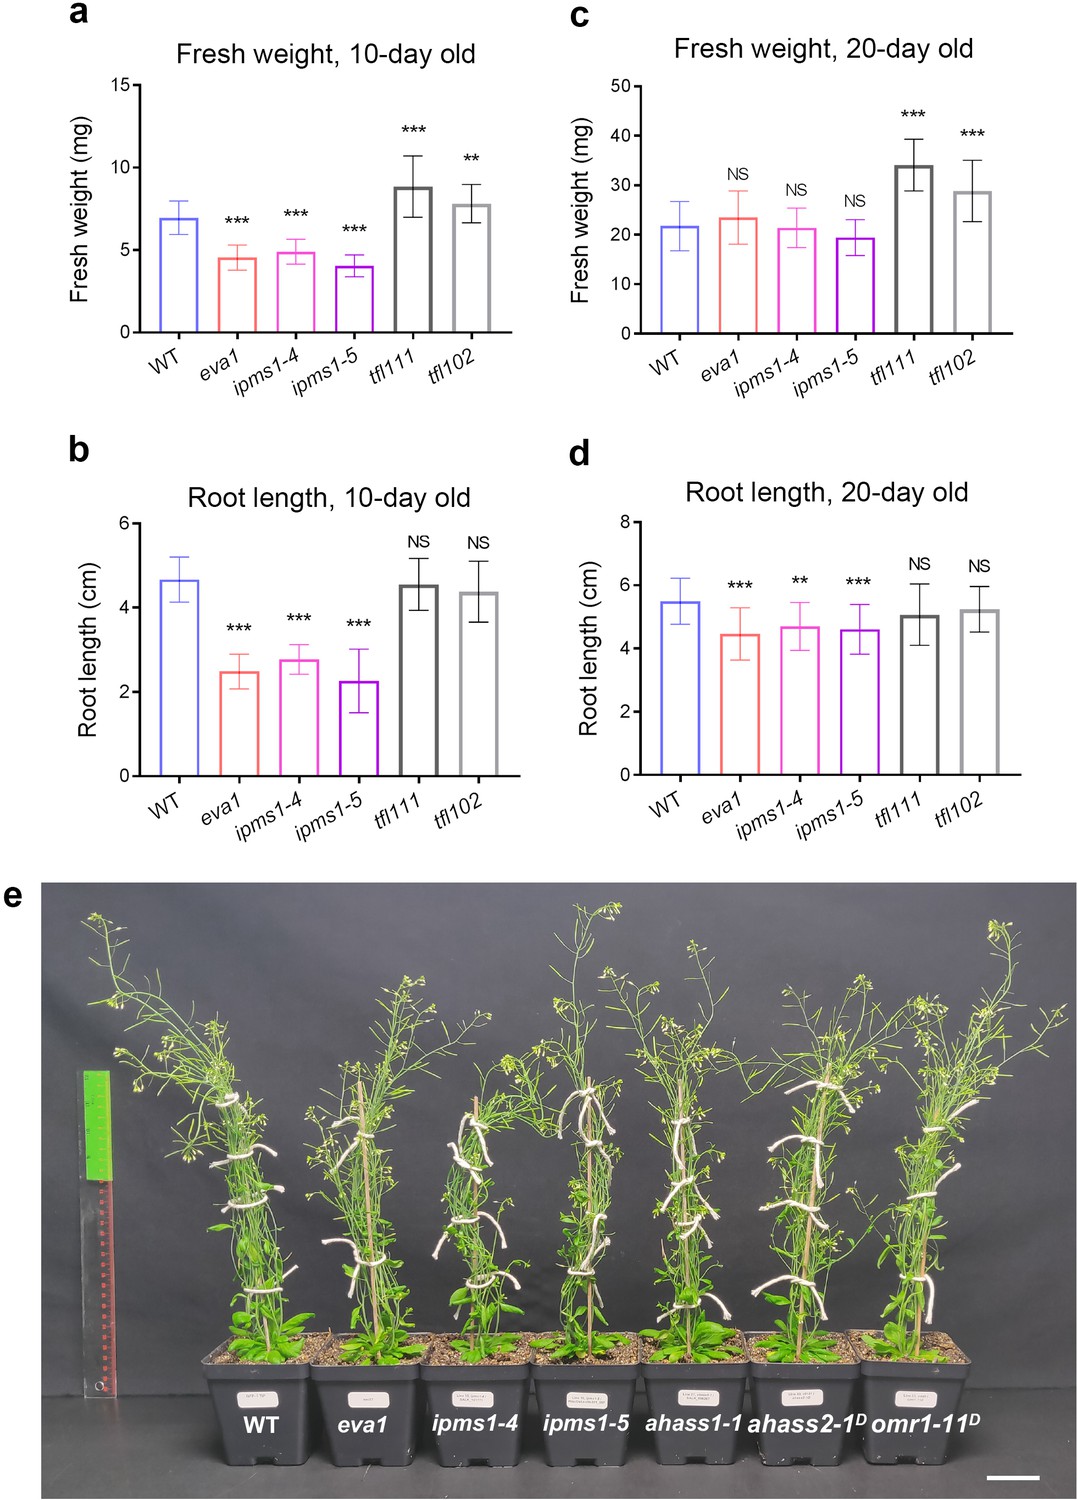
Mutations of IPMS1 affect plant growth at early stage.
(a – d) Wild type (WT) and five mutants of IPMS1 were measured for fresh weight and primary root length at 10 day old stage (a and b) and 20 day old stage (c and d). tfl111 and tfl102 are two independent EMS lines of ipms1-1D. Values are mean ± SD. The asterisks indicate significant differences compared to wild type (n = 30 for each genotype at 10 day old stage, n = 20 for each genotype at 20 day old stage; ***p≤0.001, **p≤0.01, NS, p>0.05 and not significant, unpaired t test). (e) A photograph of six weeks old plants of wild type (WT) and mutants of three key enzymes for BCAA biosynthesis. Scale bar, 5 cm.
Figure 3—figure supplement 2
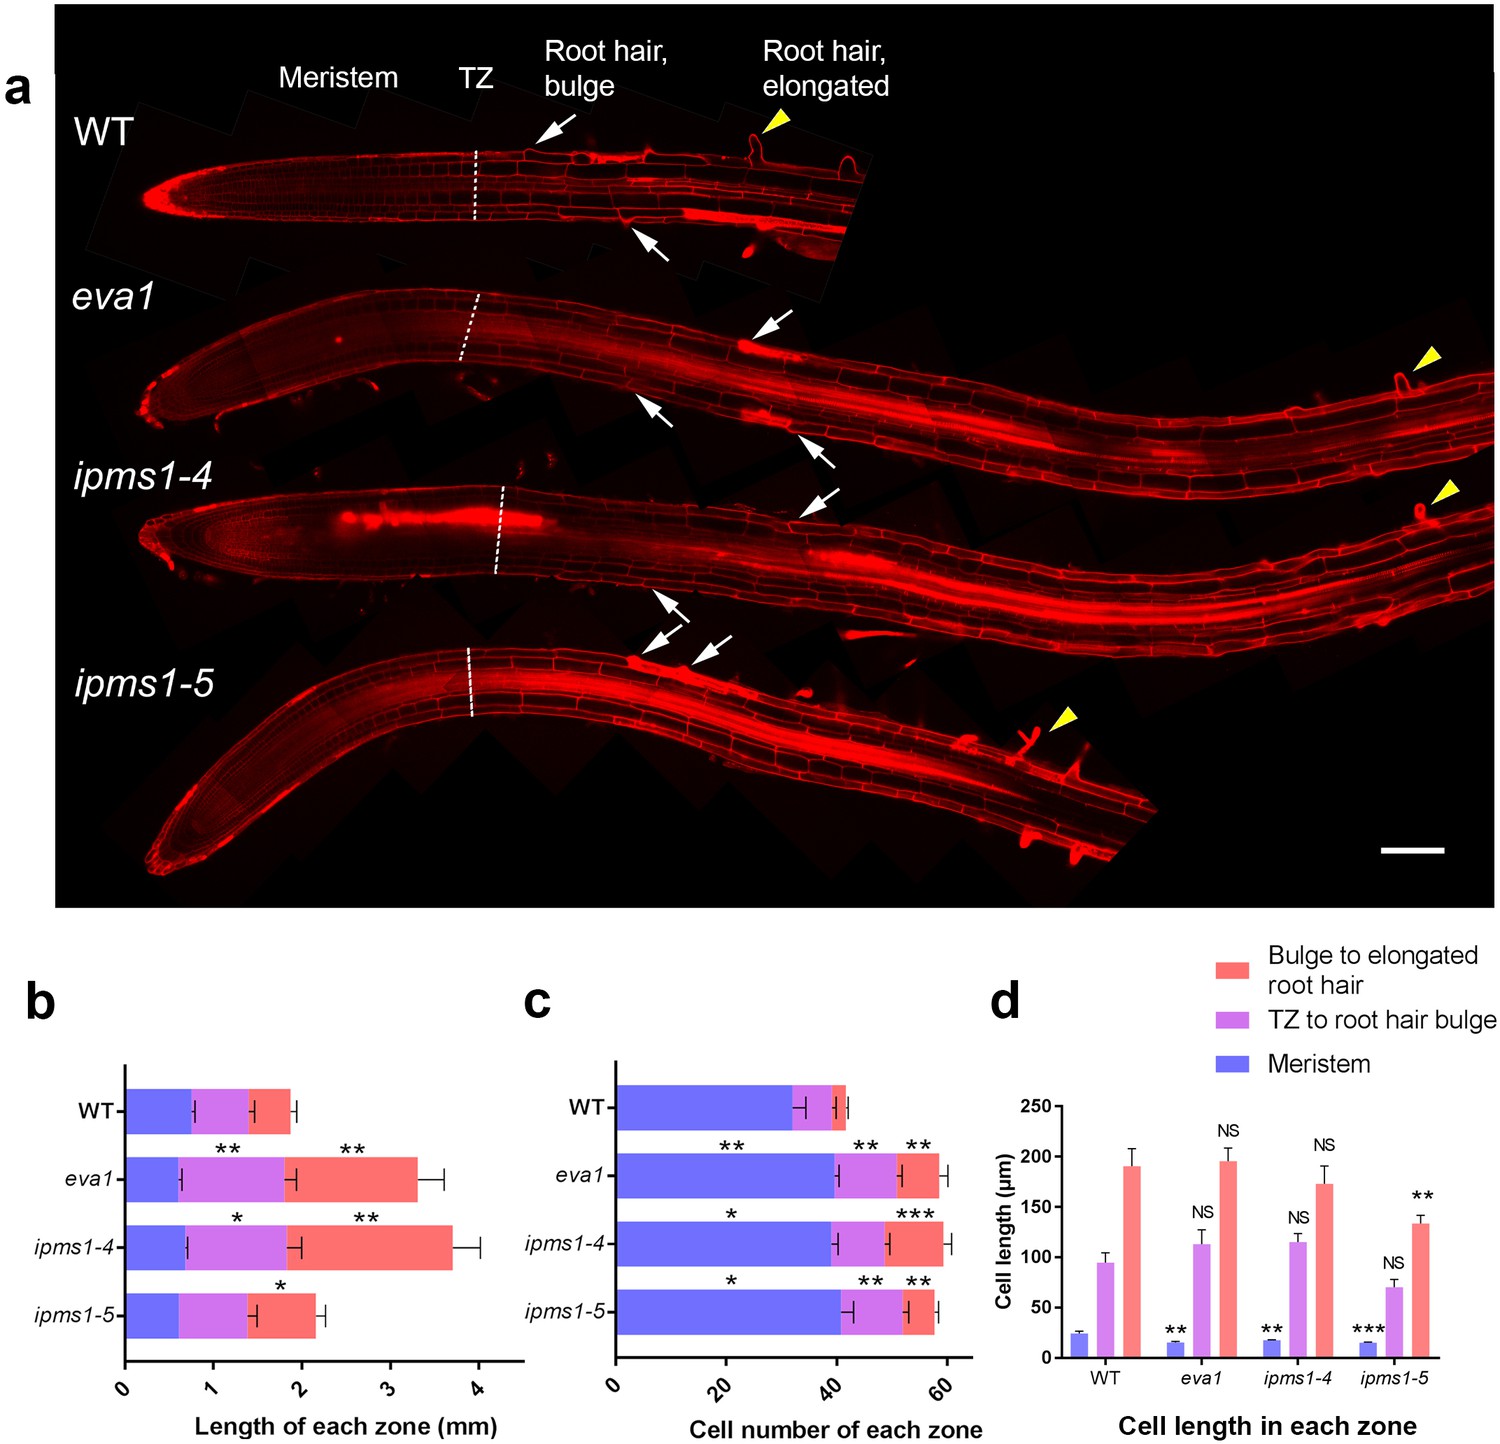
Root tip staining and analyses.
(a) Propidium iodide staining of the root tips of 10 day old wild type (WT), eva1, ipms1-4 and ipms1-5 seedlings. Meristem is the region between the quiescent center and the transition zone (TZ; defined as the position of the first elongating cortical cell). Dashed lines indicate the location of TZ, white arrows point to root hair bulges, yellow arrowheads point to the first elongated root hair that is at least 50 μm long. Scale bar, 200 μm. (b), (c and d), Analyses of zone length (b), cell number (c), and cell length (d) in three zones of the root tip. Values are mean ± SEM. The asterisks indicate significant differences compared to the same zone of wild type (n = 9 for each genotype; ***p≤0.001, **p≤0.01, *p≤0.05, NS, p>0.05 and not significant, unpaired t test).
Figure 3—figure supplement 3
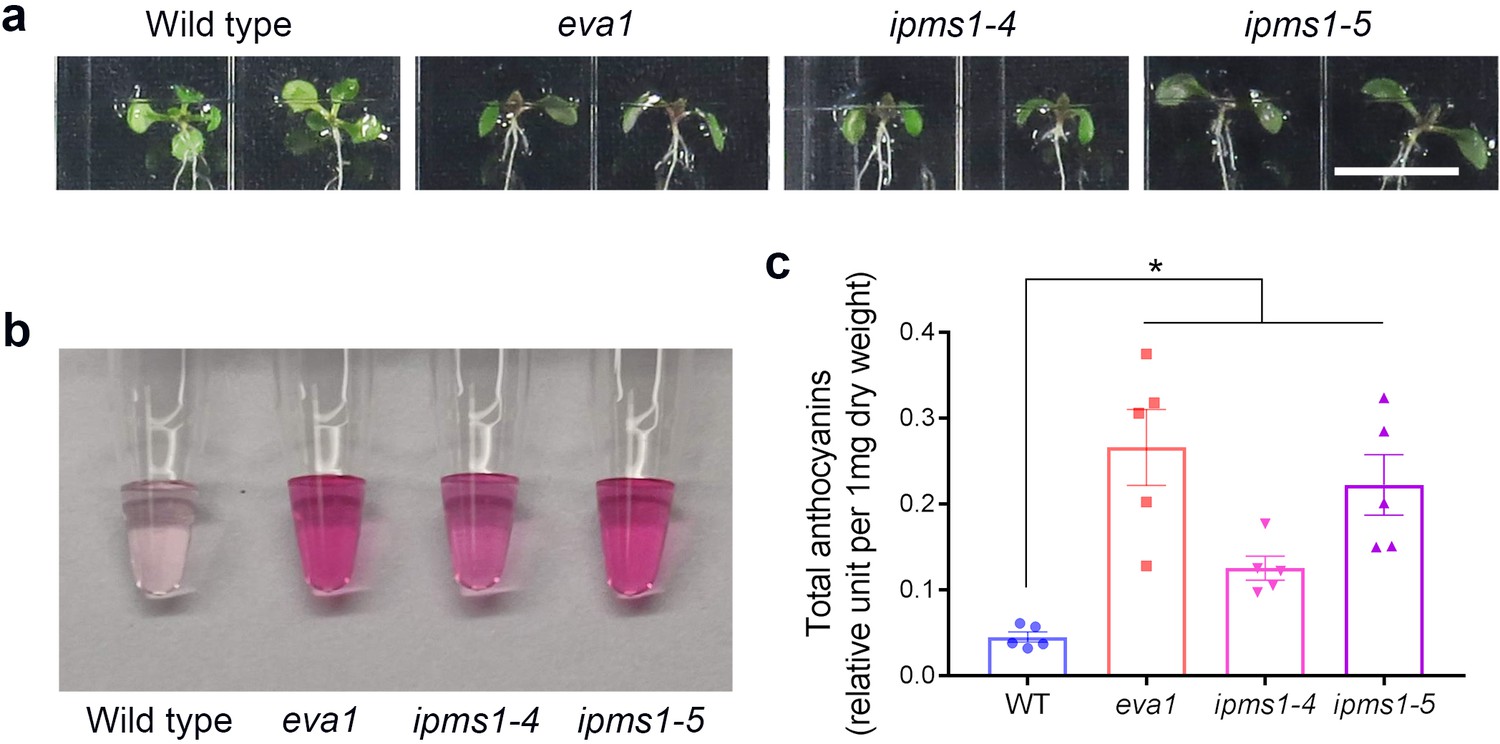
Accumulation of anthocyanins in IPMS1 loss-of-function mutants.
(a) Visible accumulation of anthocyanins in 10 day old seedlings, particularly in cotyledon petioles and emerging true leaves. Scale bar, 1 cm. (b) Extracts of total anthocyanins from aerial tissues of 10 day old seedlings. (c) Measurement of total anthocyanins. Samples that contain 50 μL extraction buffer per 1 mg dry weight were measured for 532 nm absorbance. Values are mean ± SEM. The asterisk indicates significant differences between each mutant line and the wild type (n = 5 for each genotype; *p≤0.05, unpaired t test).
Figure 4 with 4 supplements
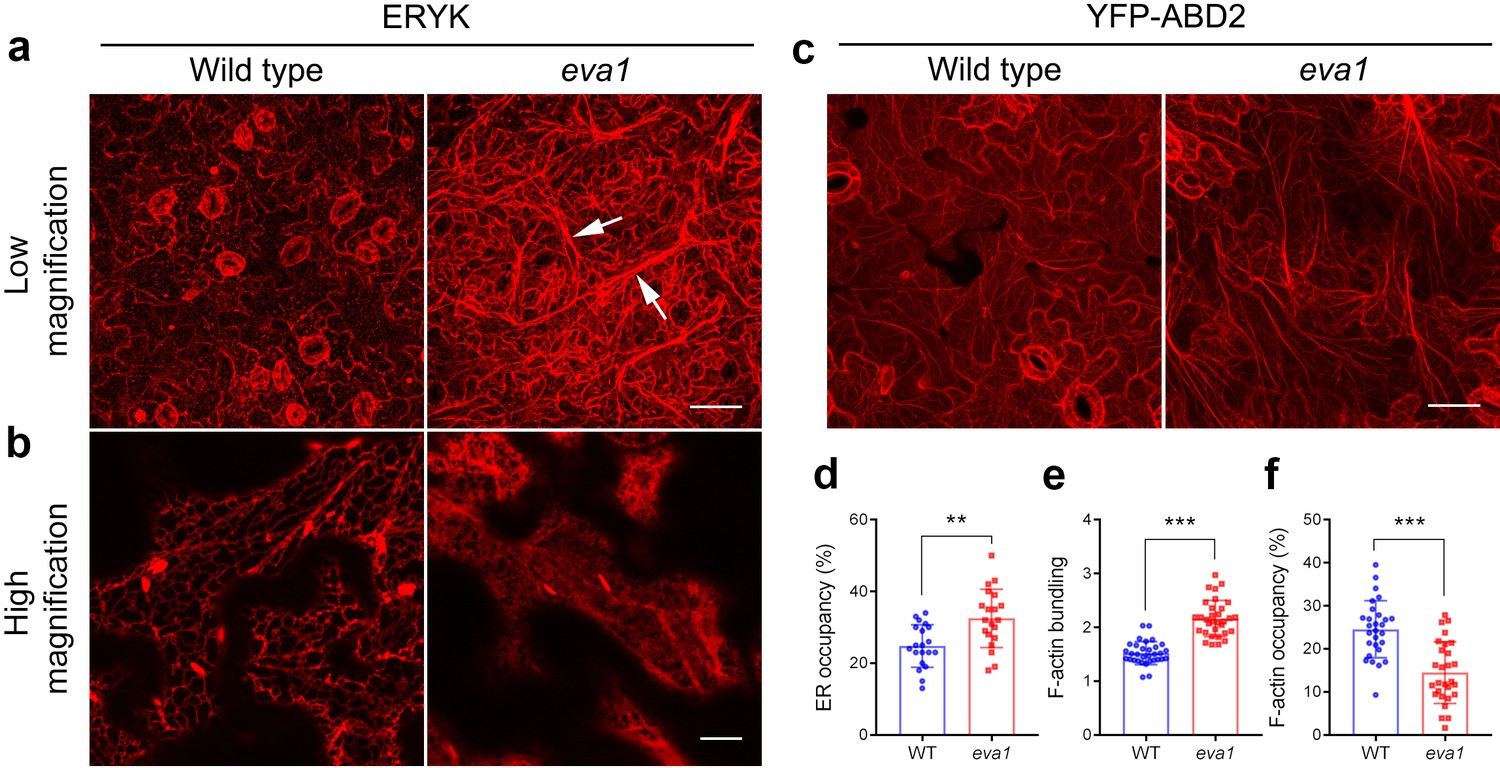
Mutation of IPMS1 affects the ER morphology and the F-actin organization.
(a and b) Confocal images of the wild type and eva1 cotyledon epidermal cells expressing ER marker ERYK. (a) Low-magnification Z-stack projection images show the ER morphology in eva1 is altered, featuring longer and more thickened ER strands, as the arrows indicate. Scale bar, 50 μm. (b) High-magnification single-plane images show enlarged ER sheets in eva1 mutant. Scale bar, 10 μm. (c) Confocal images of the wild type and eva1 cotyledon epidermal cells expressing F-actin marker YFP-ABD2. Scale bar, 50 μm. d), Quantification of ER occupancy, which measures the percentage of the area occupied by ER in the total field of view (n = 20 for each genotype). Single-plane images were used for the quantification. Columns show mean ± SD. The asterisks indicate significant differences (**p≤0.01, unpaired t test). (e and f) Quantitative evaluation of the F-actin organization using two parameters. Quantification of skewness (e) indicates higher level of F-actin bundling in eva1 compared to wild type (n = 32 for each genotype); measurement of density (f) percentage suggests lower occupancy of F-actin in eva1 compared to wild type (n = 28 for each genotype). Z-stack projection images were used for the quantification. Columns show mean ± SD. The asterisks indicate significant differences (**p≤0.01 and ***p≤0.001, unpaired t test).
Figure 4—figure supplement 1

The ER strands and trans-vacuolar strands are partially overlapping structures.
Confocal images shown in Figure 4a of ER marker (ERYK) are combined with a second channel of tonoplast marker (GFP-δTIP), showing ER strands and TVSs are only partially overlapping structures in wild type (a) and eva1 (b) cotyledon epidermal cells. Arrows point to exclusive formation of ER strands without TVSs. Arrowheads indicate where vacuole membranes aggregate without thick ER strands. Scale bars, 50 μm. All images are maximal Z-stack projection images.
Figure 4—figure supplement 2
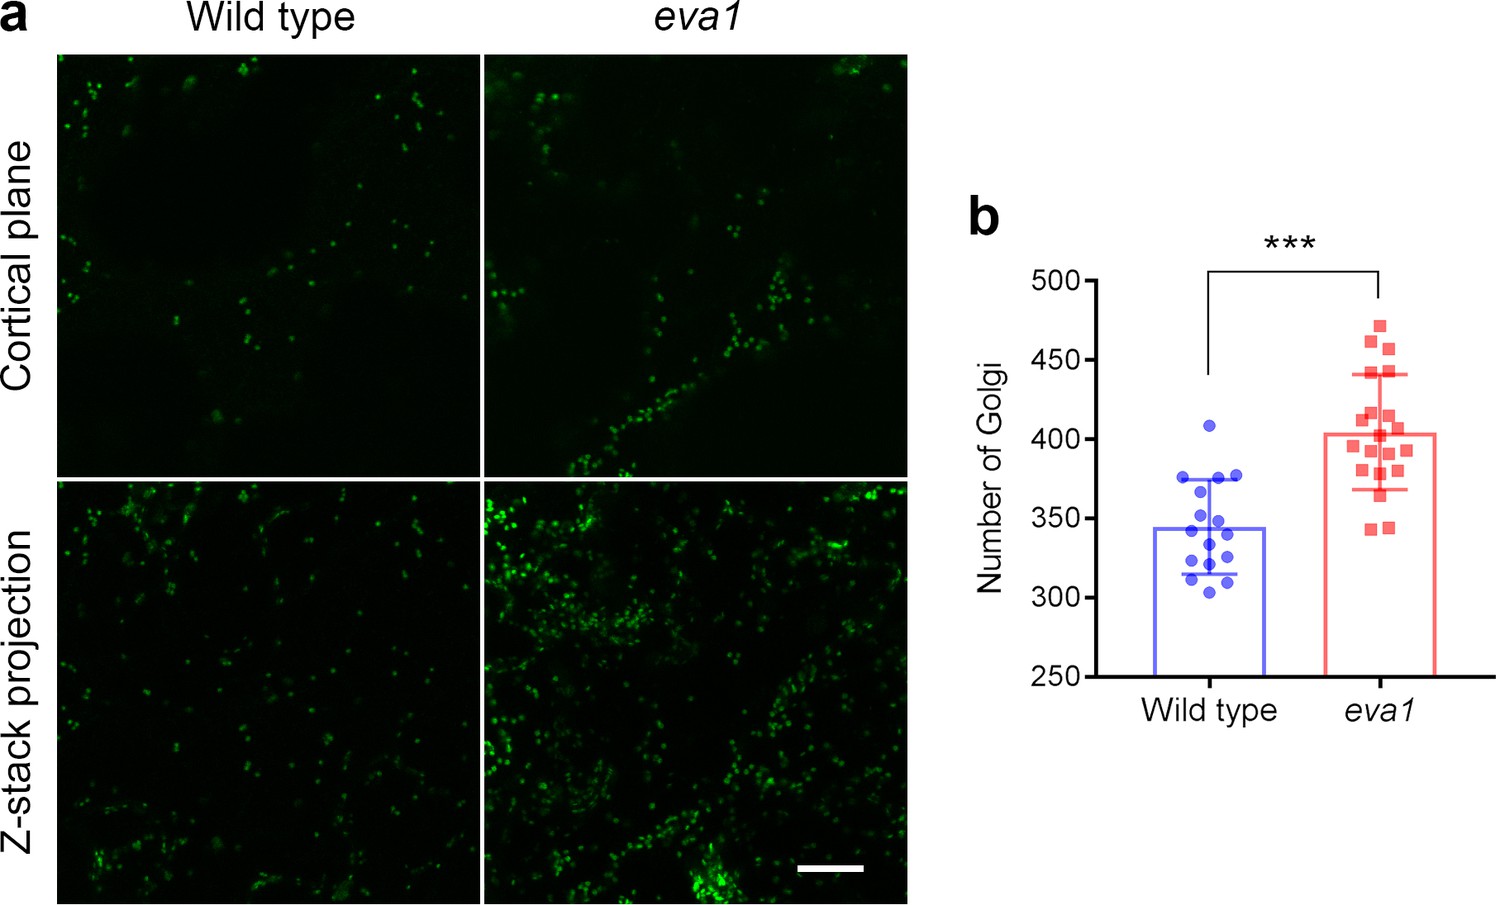
The number and distribution of Golgi are altered in eva1 mutant.
(a) Confocal images of the wild type and eva1 mutant cotyledon epidermal cells expressing a Golgi marker GFP-CASP. Single images (top panel) show Golgi in the cortical focal plane. Maximal Z-stack projection images (bottom panel) show Golgi in a single cell. Scale bar, 10 μm. (b) The numbers of Golgi in each genotype were measured in independent field of view squares (100 μm x 100 μm; wild type, n = 16, eva1, n = 20). Columns show mean ± SD. The asterisks indicate significant difference compared to the wild type (***p≤0.001, unpaired t test).
Figure 4—figure supplement 3
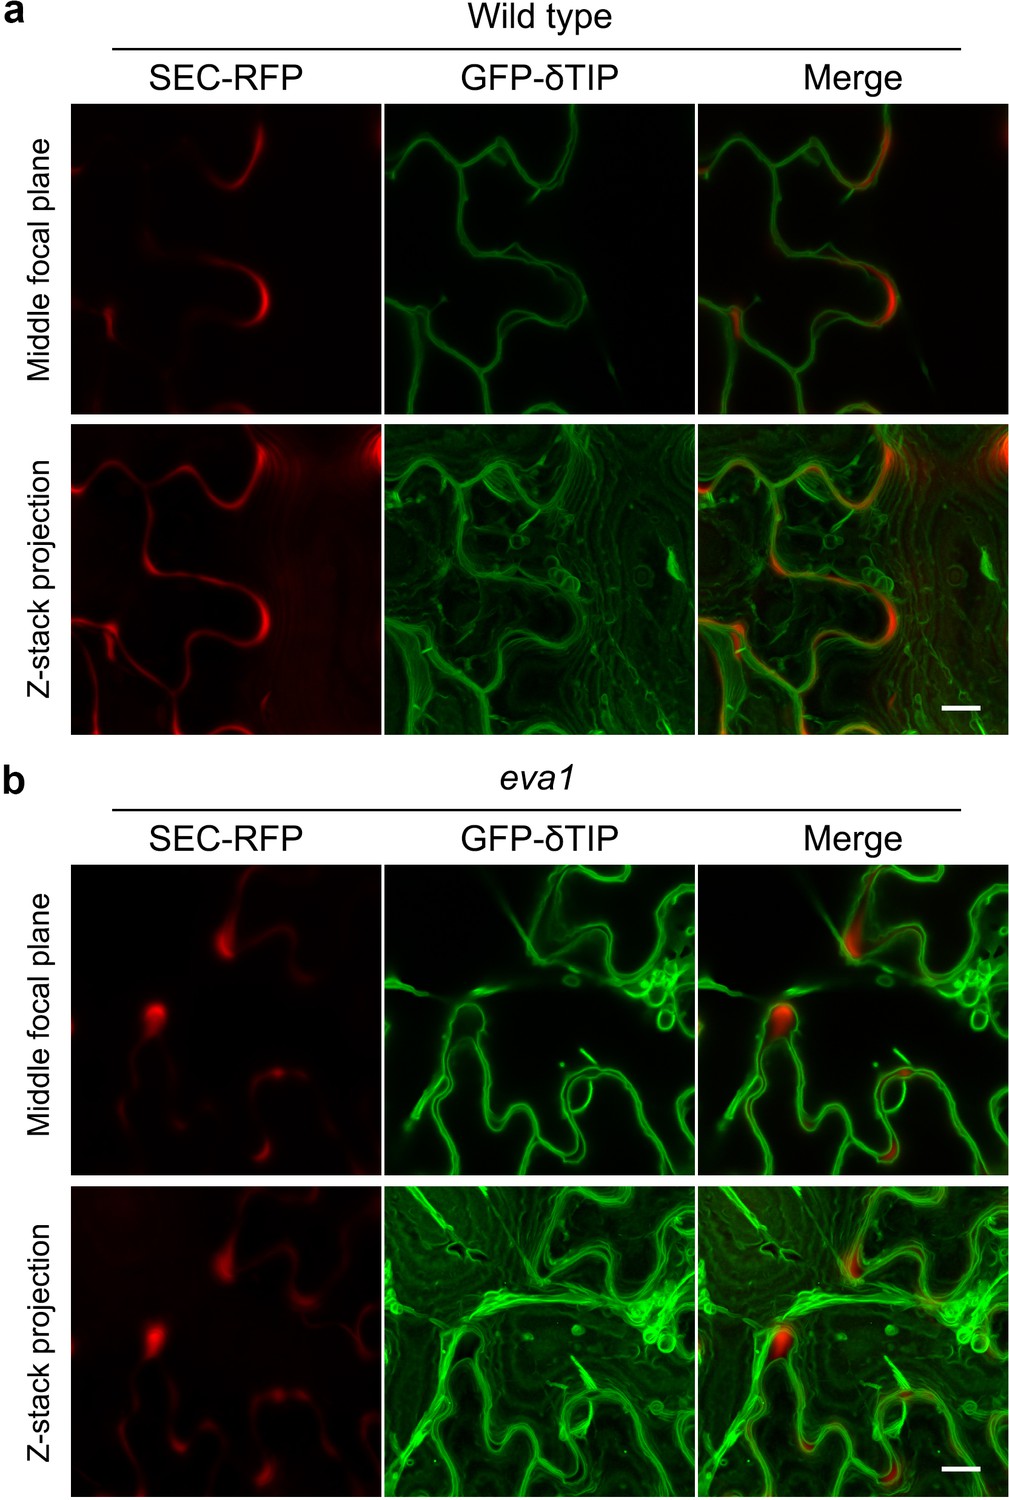
The eva1 mutation does not affect secretion of a bulk flow marker to the apoplast.
Confocal images of the wild type (a) and eva1 mutant (b) cotyledon epidermal cells expressing SEC-RFP and GFP-δTIP. Scale bars, 10 μm.
Figure 4—figure supplement 4
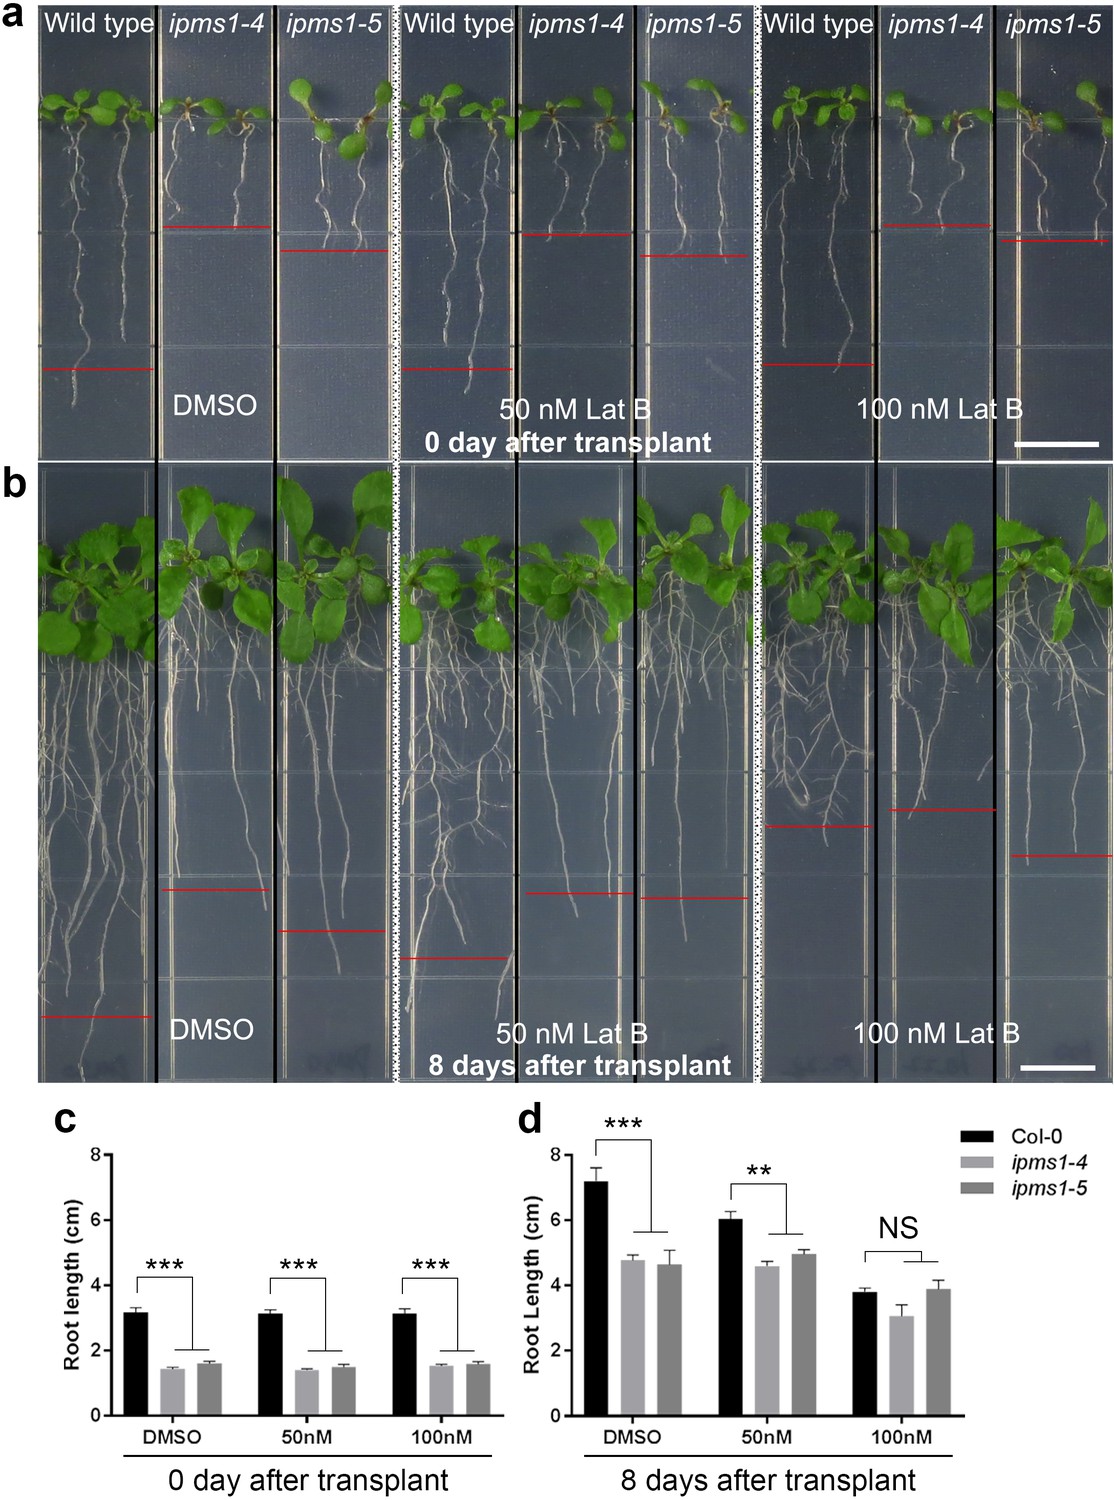
Compared to wild type, IPMS1 loss-of-function mutants are less sensitive to Lat B.
(a and b), 10 day old wild type (Col-0), ipms1-4 and ipms1-5 seedlings germinated and grew on ½ LS and 1% sucrose medium was transplanted to ½ LS and 1% sucrose medium containing DMSO, 50 nM Lat B or 100 nM Lat B. Photographs were taken immediately after transplant (a) and 8 days after transplant (b). Scale bars, 1 cm. (c and d) Quantification of primary root length of the wild type, ipms1-4 and ipms1-5 seedlings when 0 day (c) and 8 days (d) after transplant. Values are mean ± SEM. The asterisks indicate significant differences compared to the wild type (n = 8 for each genotype on a specific medium; ***p≤0.001, **p≤0.01, NS, p>0.05 and not significant, unpaired t test).
Figure 5 with 1 supplement
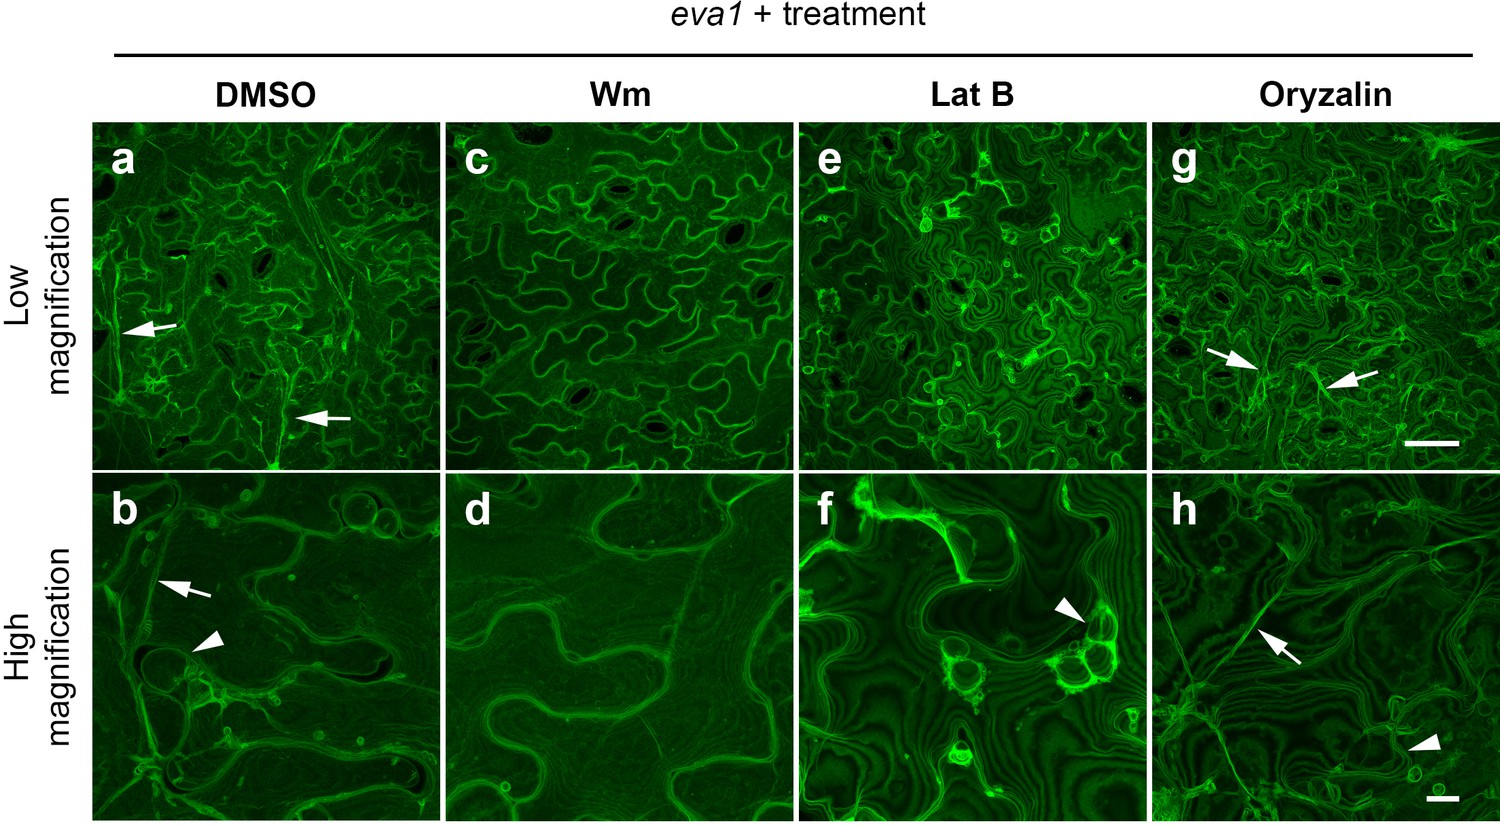
Chemical interventions can fully or partially rescue the vacuolar mutant phenotypes of eva1.
(a – h) Confocal images of cotyledon epidermal cells expressing GFP-δTIP from 10 day old eva1 plants. Images were acquired after 2 hr treatment of DMSO (a and b), wortmannin (Wm; c and d), latrunculin B (Lat B; e and f), or oryzalin (g and h). The top panel (a), (c), (e, and g) presents images of lower magnification with a scale bar of 50 μm. The bottom panel (b), (d), (f, and h) presents images of higher magnification with a scale bar of 10 μm. Arrowheads suggest presumably unfused vacuolar structures and arrows pinpoint enhanced TVSs. All the images are Z-stack maximal projections.
Figure 5—figure supplement 1

Chemical treatment with PI3K/TOR dual inhibitors wortmannin and LY294002.
(a – h) Confocal images of cotyledon epidermal cells expressing tonoplast marker GFP-δTIP from 10 day old wild type (WT) and eva1 plants. Images were acquired after 3 hr treatment of DMSO (a and b), wortmannin (Wm; c and d) or LY294002 (e – h). Scale bar in the top panel, 50 μm. Scale bar in the bottom panel, 10 μm. All the images are Z-stack maximal projections. (i) Quantification of presumably unfused small vacuoles. Values are mean ± SD. The asterisks indicate significant differences (n = 40 cells for each treatment; ***p≤0.001, NS, p>0.05 and not significant, unpaired t test).
Figure 6 with 3 supplements

Vacuolar mutant phenotypes of eva1 are correlated with up-regulated TOR activity.
(a – f) TOR inhibitor AZD-8088 treatment rescues vacuolar mutant phenotypes of eva1. Confocal images were acquired before (a and b), after 2 hr (c and d), and after 4 hr (e and f) 5 μM AZD-8055 treatment of wild type and eva1 mutant. Arrowhead indicates presumably unfused vacuolar structures and arrows point to enhanced TVSs. All the images are Z-stack maximal projections. Scale bar, 25 μm. (g), Quantification of presumably unfused vacuoles in eva1 before and after TOR inhibitor treatment. Values are mean ± SD. The asterisks indicate significant differences (n = 30 cells for each treatment; ***p≤0.001, NS, p>0.05 and not significant, unpaired t test). (h) Immunoblotting detected phosphorylation of S6K by TOR, using specific antisera against S6K-phosphorylated and S6K. LC, loading control with Ponceau S staining. (i) S6K phosphorylation status calculated by the ratio of S6K-p/S6K in fold change compared to wild type. n = 3 and values are mean ± SEM (***p≤0.05, unpaired t test). (j) EdU staining detected root meristem activity of 10 day old seedlings. For each genotype, an image of green pseudocolor shows EdU-stained newly synthesized DNA and a bright-field image shows structure of root tip. Scale bar, 100 μm. (k) Quantification of EdU fluorescence intensity. Values are mean ± SD. The asterisks indicate significant differences compared to wild type (n = 9 for each genotype; **p≤0.01, ***p≤0.001, unpaired t test).
Figure 6—figure supplement 1
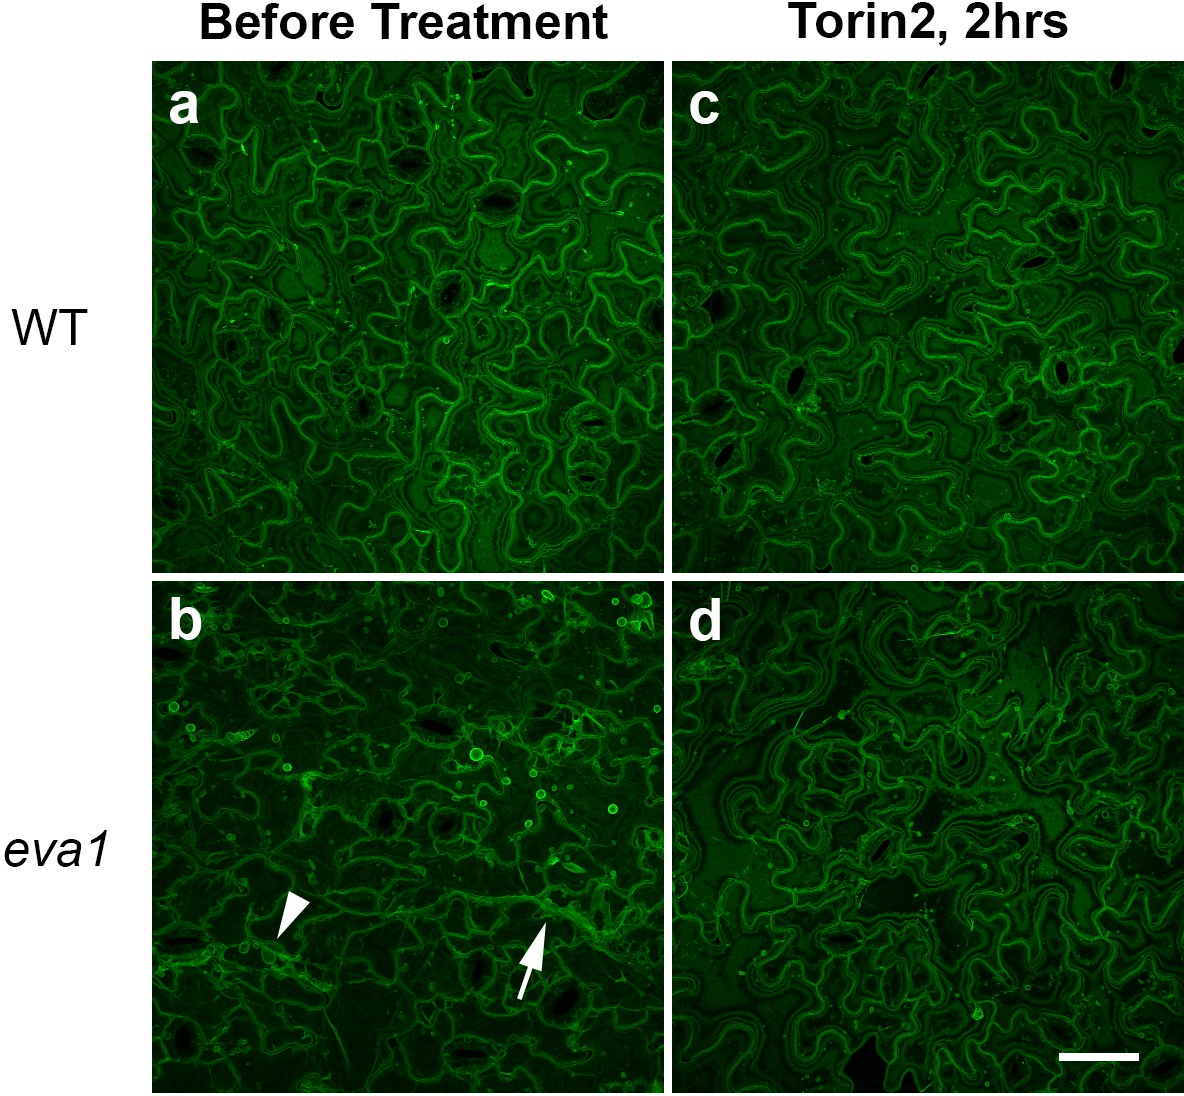
Another TOR inhibitor Torin2 exerts more potent effects on the vacuolar phenotypes of eva1.
Confocal images of cotyledon epidermal cells expressing tonoplast marker (GFP-δTIP) from 10 day old wild type (WT) or eva1 mutant. The images were acquired before (a and b) and after (c and d) 2 hr 1 μM Torin2 treatment of wild type (WT) and eva1 mutant. Arrowhead indicates presumably unfused vacuolar structures. Arrow suggests enhanced TVSs. Scale bar, 50 μm. All the images are Z-stack maximal projections.
Figure 6—figure supplement 2
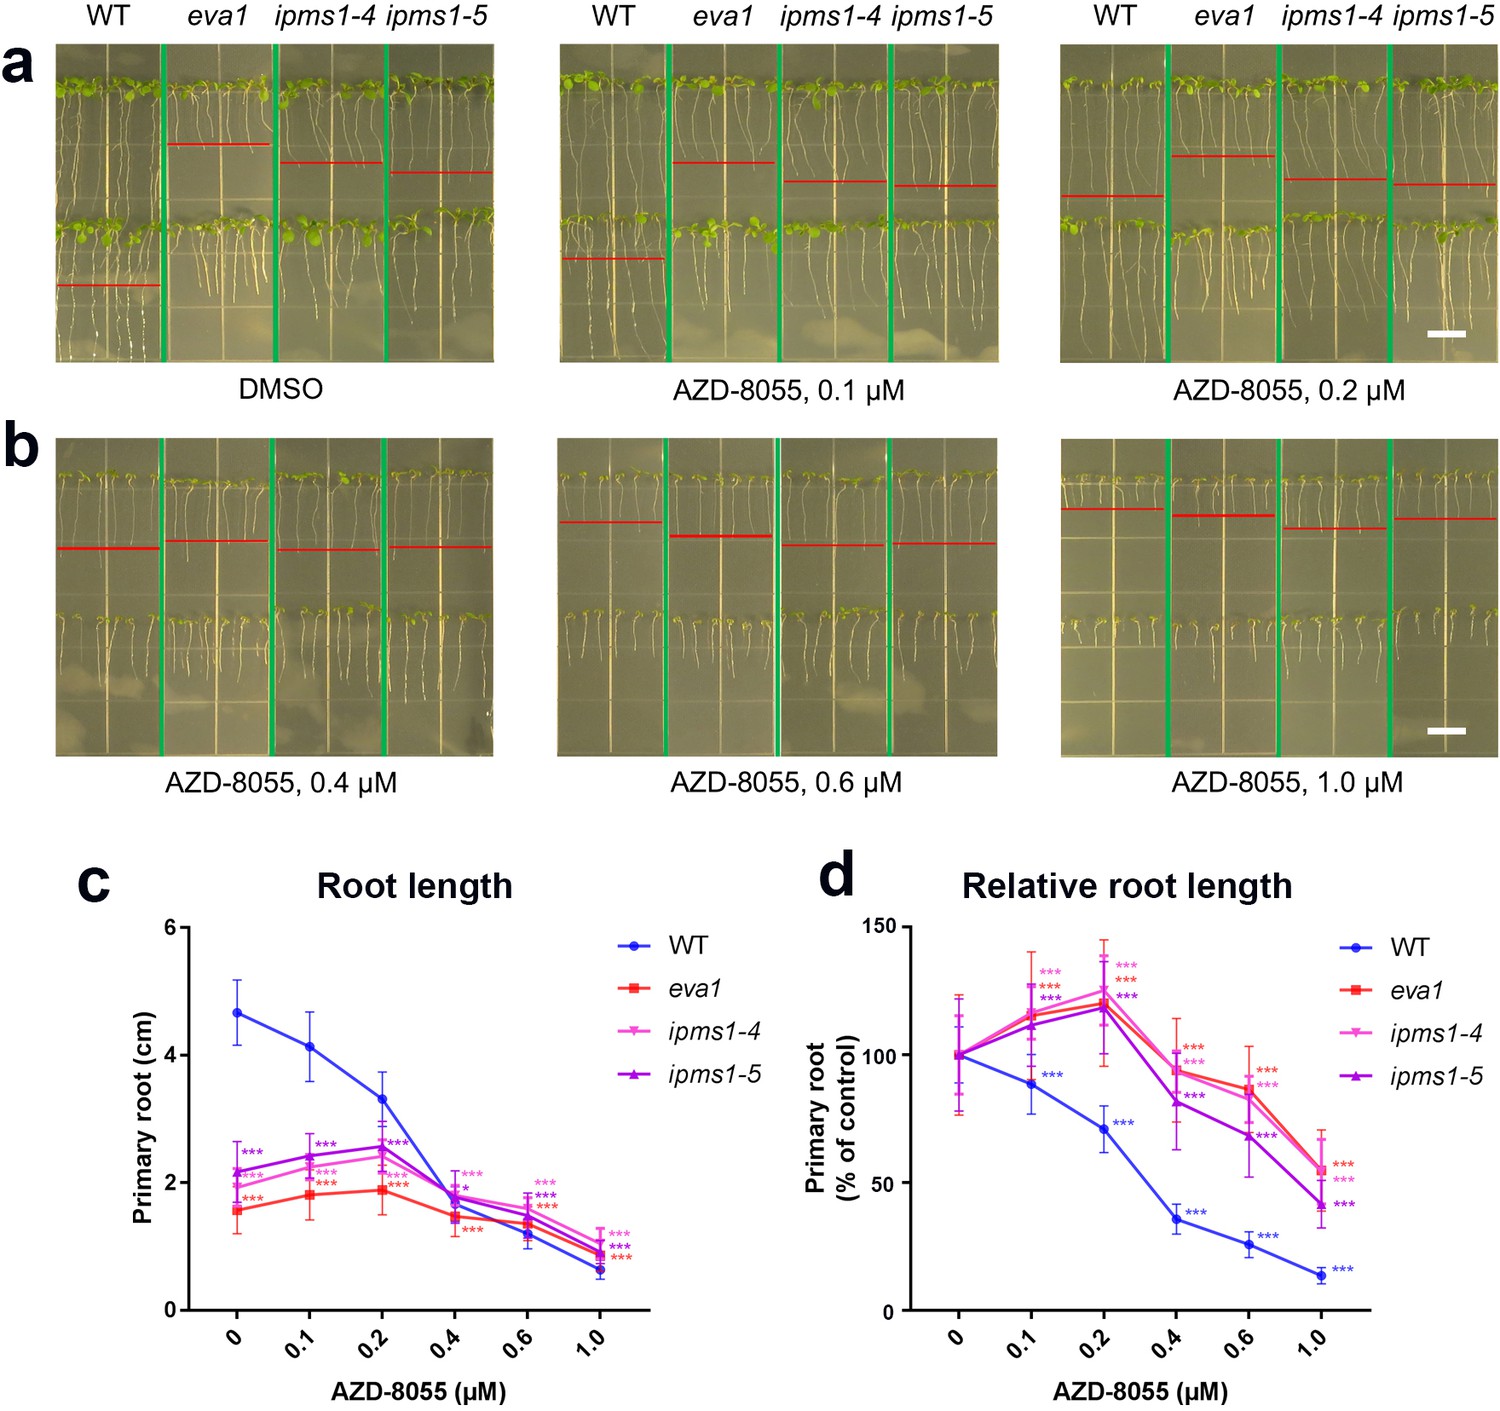
The effect of TOR inhibitor AZD-8055 on ipms1 primary root elongation is dose-dependent.
(a and b) ipms1 primary root elongation is promoted by lower concentrations (0.1 and 0.2 μM) of AZD-8055 (a), but inhibited by higher concentrations (0.4, 0.6 and 1.0 μM) of AZD-8055 (b). Photographs of 10 day old wild type (WT, Col-0), eva1, ipms1-4 and ipms1-5 seedlings germinated and grew on ½ LS and 1% sucrose medium containing DMSO or increasing concentrations of TOR inhibitor AZD-8055. Scale bars, 1 cm. (c and d) Quantification of primary root length (c) and change of root elongation (d), expressed as % of each AZD-8055 treatment versus control (DMSO solvent). Values are mean ± SD. The asterisks in (c) indicate significant differences compared to the wild type. The asterisks in (d) indicate significant differences compared to the DMSO control. n = 50 for WT, n = 100 for other genotypes on a specific medium; ***p≤0.001, *p≤0.05, unpaired t test.
Figure 6—figure supplement 3
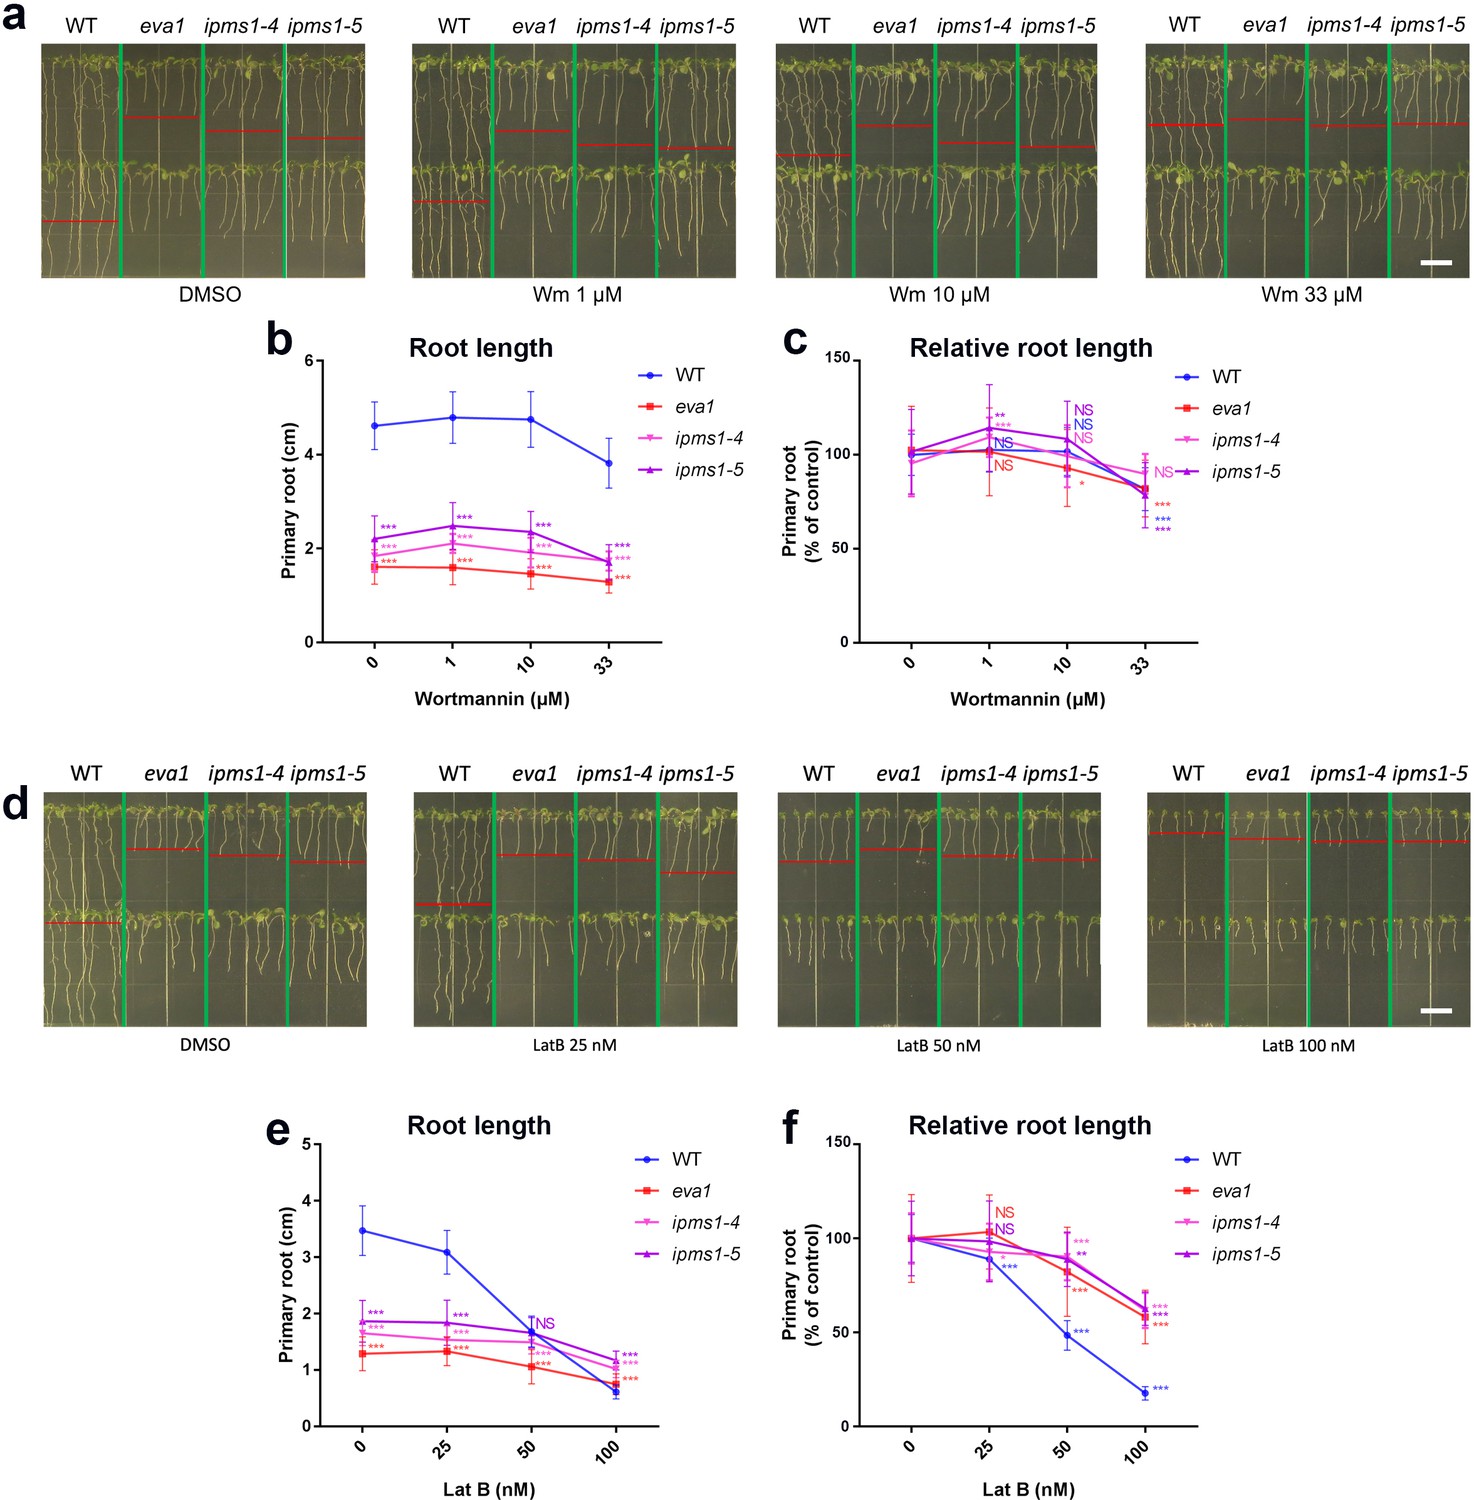
Effects of PI3K/TOR dual inhibitor wortmannin and F-actin depolymerizer Lat B on ipms1 primary root elongation.
(a) Wortmannin confers minimal impacts on ipms1 primary root elongation. Photographs of 10 day old wild type (WT, Col-0), eva1, ipms1-4 and ipms1-5 seedlings germinated and grew on medium containing DMSO or increasing concentrations of wortmannin. Scale bar, 1 cm. b), Compared to wild type, ipms1 primary root elongation is less sensitive to Lat B. Photographs of 9 day old wild type (WT, Col-0), eva1, ipms1-4 and ipms1-5 seedlings germinated and grew on medium containing DMSO or increasing concentrations of Lat B. Scale bar, 1 cm. (b), (c and e), (f), Quantification of primary root length (b and e) and change of root elongation (c and f), expressed as % of each inhibitor treatment versus control (DMSO solvent). Values are mean ± SD. The asterisks in (b and e) indicate significant differences compared to the wild type. The asterisks in (c and f) indicate significant differences compared to the DMSO control. n = 50 for WT, n = 100 for other genotypes on a specific medium; ***p≤0.001, **p≤0.01, *p≤0.05, NS, p>0.05 and not significant, unpaired t test.
Figure 7 with 2 supplements
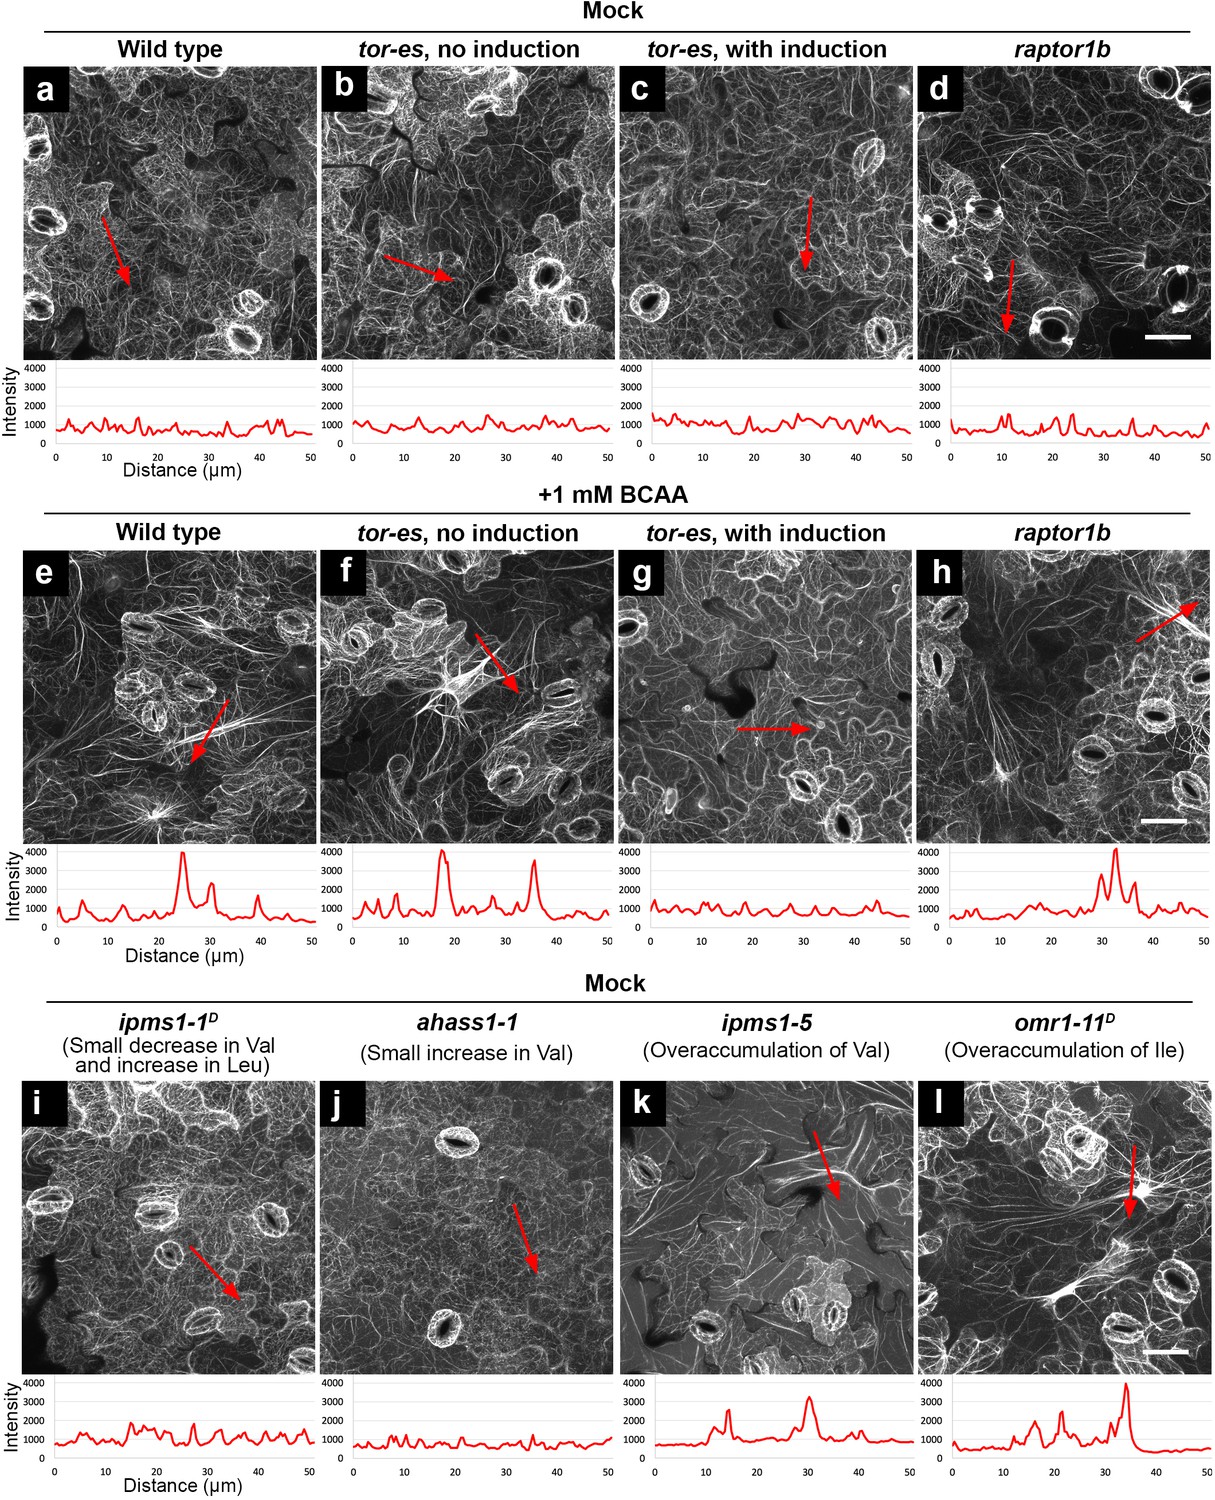
Feeding of exogenous BCAAs and over-accumulation of endogenous BCAAs induce actin bundling, which is dependent on functional TOR but not RAPTOR.
Organization of actin cytoskeleton presented by confocal images of cotyledon epidermal cells expressing F-actin marker YFP-ABD2. Higher fluorescence intensity of the actin marker suggests more bundling of actin filaments. Using ImageJ, we drew a 50 μm red arrowed line to detect the pixel fluorescence intensity beneath such a line. In each image, the red arrowed line is positioned where we detected the highest fluorescence intensity using non-saturating imaging settings. A chart beneath the image presents plotted fluorescence intensity along the red arrowed line. Without actin bundling, fine actin filaments have fluorescence intensity about 1000 (relative unit). In contrast, induced actin bundling show fluorescence intensity peaks of 3000–4000 (relative unit). (a – d) Without feeding of BCAAs (mock), wild type, tor-es with or without silencing, and raptor1b did not show induced actin bundling. (e – h) Feeding of 1 mM BCAAs induced striking actin bundling in wild type, tor-es without gene silencing and raptor1b (e, f, h), but not in tor-es with induction of TOR silencing (g). (i – l), Without feeding of BCAAs (mock), mutants with small changes of BCAAs did not show induced actin bundling (i and j); mutants with over-accumulation of endogenous BCAAs showed induced actin bundling (k and l). All the images are Z-stack maximal projections. Scale bars, 50 μm.
Figure 7—figure supplement 1
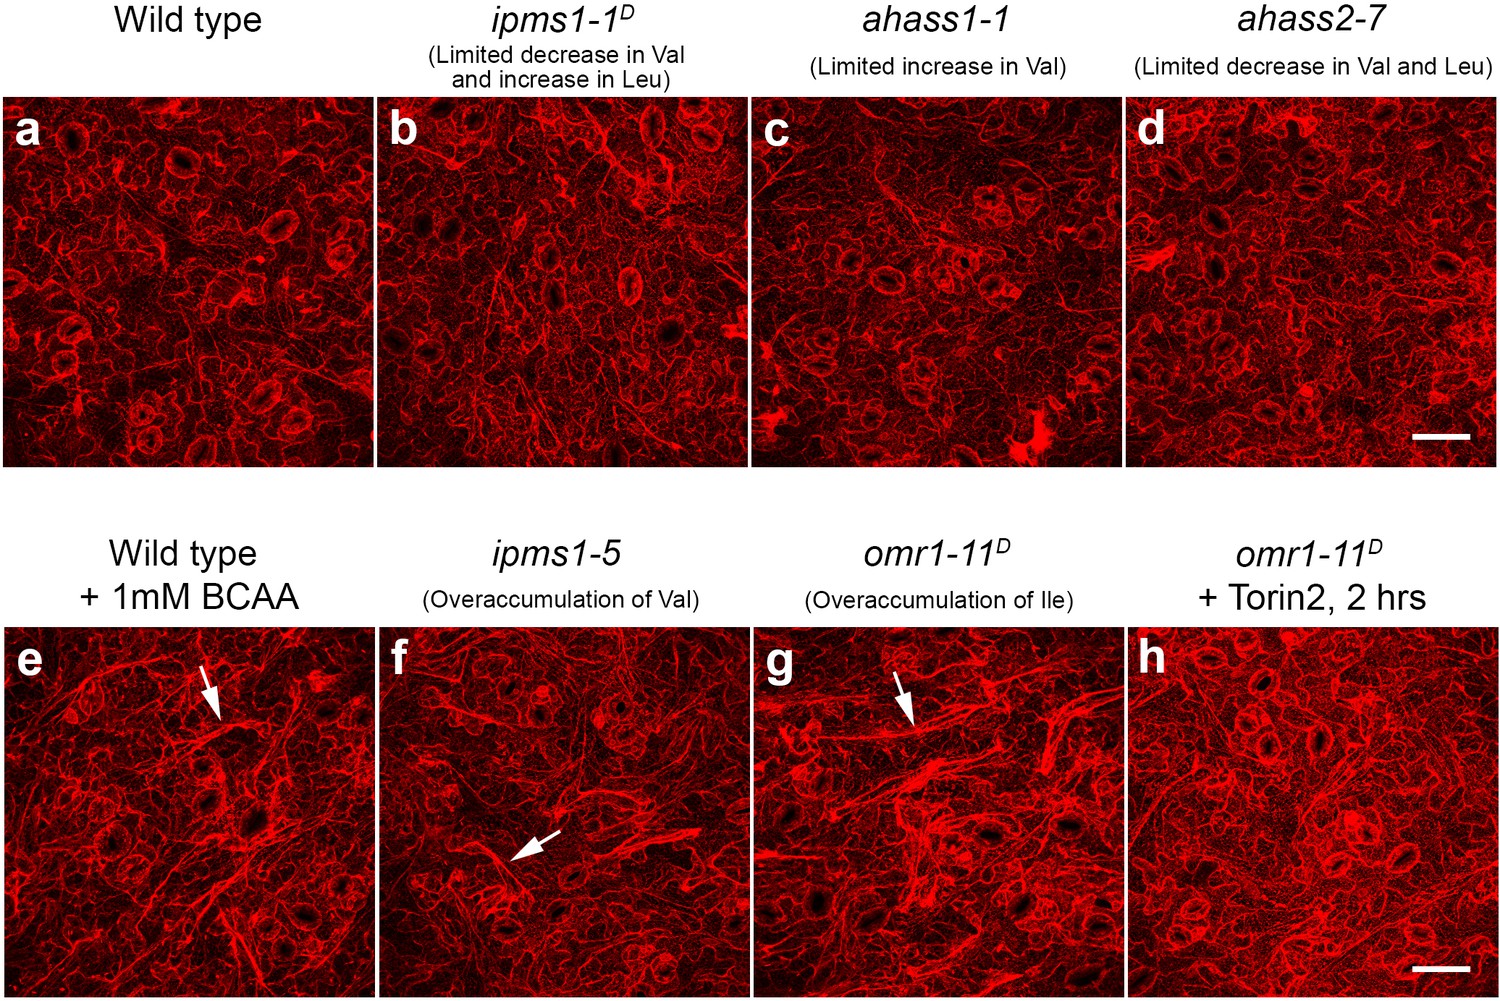
Exogeneous feeding of BCAAs or over-accumulation of BCAAs due to mutations of the BCAA biosynthetic pathway alters morphology of the ER network to form enhanced ER strands.
Architecture of the ER network presented by confocal images of cotyledon epidermal cells expressing ER marker ERYK in 10 day old wild type (Col-0) and mutants with distinct BCAA profiles, which were characterized by Xing and Last (2017). All the images are Z-stack maximal projections. (a – d) The ER morphology is not significantly altered in wild type (a) and mutants with limited alteration of BCAA levels (b – d) that were growing on normal Arabidopsis growth medium. Scale bar, 50 μm. (e – h) Disrupted ER morphology in wild type that was growing on medium supplemented with 1 mM BCAAs (e) and mutants that over-accumulate BCAAs (f and g). Arrows point to the enhanced ER strands. Enhancement of ER strands in omr1-11D mutant (g) was recovered by 2 hr treatment of 1 μM Torin2 (h). Scale bar, 50 μm.
Figure 7—figure supplement 2
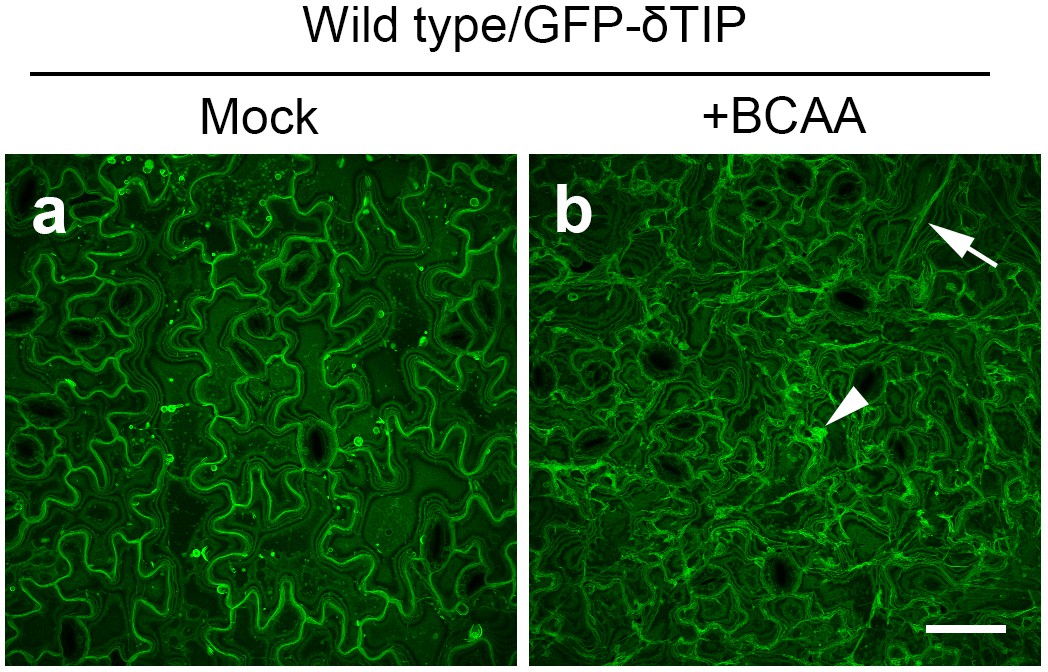
Exogeneous feeding of BCAAs affects morphology of the lytic vacuole.
Confocal images of cotyledon epidermal cells expressing tonoplast marker GFP-δTIP in 10 day old wild type that were growing on Arabidopsis growth medium without (a) or with (b) 1 mM BCAA supplementation. Arrowhead indicates presumably unfused vacuolar structures and arrow points to enhanced TVSs. Scale bar, 50 μm. Images are Z-stack maximal projections.
Figure 8

Working model of TOR-regulated subcellular processes.
Over-accumulation of BCAA Val, Leu and Ile stimulates TOR signaling. Except for the established downstream processes such as protein synthesis and cell proliferation, vacuole fusion and actin reorganization are indicated also regulated by TOR signaling, but the underlying mechanisms are unclear. Reorganization of the actin cytoskeleton is independent of TORC1, and prominent trans-vacuolar strands and ER strands are subsequently formed due to the strong interactions between the endomembranes and the F-actin in plant cells.
Tables
Key resources table
| Reagent type (species) or resource | Designation | Source or reference | Identifiers | Additional information |
|---|---|---|---|---|
| Gene (Arabidopsis thaliana) | AtIPMS1 | TAIR: AT1G18500 | ||
| Gene (Arabidopsis thaliana) | AtOMR1 | TAIR: AT3G10050 | ||
| Gene (Arabidopsis thaliana) | AtAHASS1 | TAIR: AT2G31810 | ||
| Gene (Arabidopsis thaliana) | AtAHASS2 | TAIR: AT5G16290 | ||
| Gene (Arabidopsis thaliana) | AtTOR | TAIR: AT1G50030 | ||
| Gene (Arabidopsis thaliana) | AtRaptor1B | TAIR: AT3G08850 | ||
| Genetic reagent (Arabidopsis thaliana) | eva1 | this paper | EMS line with a mutation of IPMS1 | |
| Genetic reagent (Arabidopsis thaliana) | ipms1-4 | Xing and Last, 2017 | SALK_101771 | |
| Genetic reagent (Arabidopsis thaliana) | ipms1-5 | Xing and Last, 2017 | WiscDsLoxHs221_05F | |
| Genetic reagent (Arabidopsis thaliana) | tfl111 (ipms1-1D) | Xing and Last, 2017 | TAIR: CS69734 | |
| Genetic reagent (Arabidopsis thaliana) | tfl102 (ipms1-1D) | Xing and Last, 2017 | TAIR: CS69733 | |
| Genetic reagent (Arabidopsis thaliana) | ahass1-1 | Xing and Last, 2017 | SALK_096207 | |
| Genetic reagent (Arabidopsis thaliana) | ahass2-7 | Xing and Last, 2017 | WiscDsLoxHs009_02G | |
| Genetic reagent (Arabidopsis thaliana) | ahass2-1D | Xing and Last, 2017 | TAIR: CS69724 | |
| Genetic reagent (Arabidopsis thaliana) | omr1-11D | Xing and Last, 2017 | TAIR: CS69720 | |
| Genetic reagent (Arabidopsis thaliana) | tor-es | Xiong and Sheen, 2012 | TAIR: CS69829 | |
| Genetic reagent (Arabidopsis thaliana) | raptor1b | Salem et al., 2017 | SALK_022096 | |
| Antibody | Anti-S6K (Rabbit polyclonal) | Agrisera | AS12 1855 | Western blotting (1:1000 dilution) |
| Antibody | Anti-S6K-phosphorylated (Rabbit polyclonal) | Abcam | ab207399 | Western blotting (1:1000 dilution) |
| Antibody | HRP conjugated anti-rabbit (Goat polyclonal) | Sigma-Aldrich | A0545 | Western blotting (1:10000 dilution) |
| Commercial assay or kit | Click-iT EdU Alexa Fluor 488 Imaging Kit | Invitrogen | C10337 |
Additional files
-
Supplementary file 1
LC gradient used for amino acid separation.
- https://cdn.elifesciences.org/articles/50747/elife-50747-supp1-v2.xlsx
-
Supplementary file 2
Primers used in this study.
- https://cdn.elifesciences.org/articles/50747/elife-50747-supp2-v2.xlsx
-
Transparent reporting form
- https://cdn.elifesciences.org/articles/50747/elife-50747-transrepform-v2.pdf
Download links
A two-part list of links to download the article, or parts of the article, in various formats.
Downloads (link to download the article as PDF)
Open citations (links to open the citations from this article in various online reference manager services)
Cite this article (links to download the citations from this article in formats compatible with various reference manager tools)
Homeostasis of branched-chain amino acids is critical for the activity of TOR signaling in Arabidopsis
eLife 8:e50747.
https://doi.org/10.7554/eLife.50747


