Direct comparison of clathrin-mediated endocytosis in budding and fission yeast reveals conserved and evolvable features
- University of California, Berkeley, United States
- Yale University, United States
Figures
Figure 1 with 3 supplements
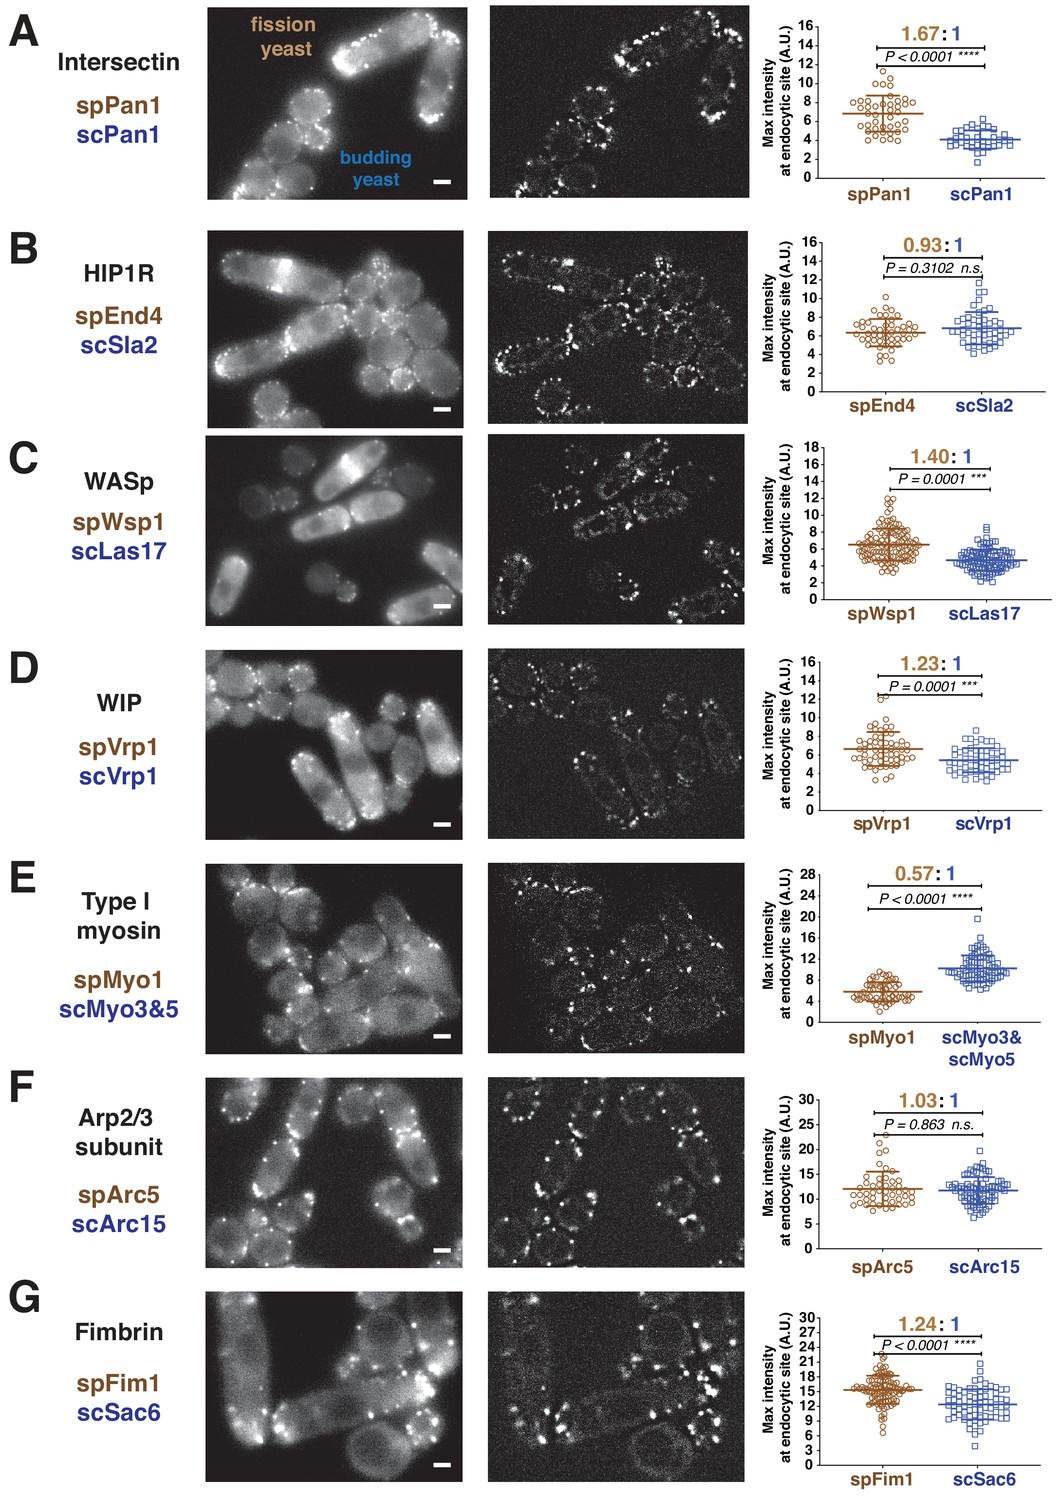
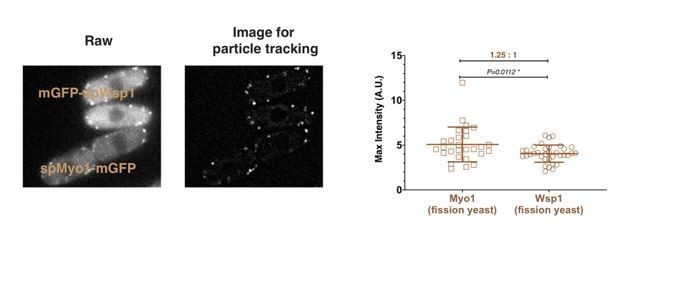
Quantitative side-by-side comparison of levels of homologous proteins at endocytic sites in budding and fission yeast.
Single frames from unprocessed (left panel) and processed (middle panel) movies for particle intensity quantification, and average maximum intensity of indicated proteins at endocytic sites (right panel). (A-G) Indicated endocytic protein homologues were tagged with GFP or mEGFP in budding yeast or fission yeast, respectively, at the endogenous loci. The maximum intensity for each tagged protein was determined from particle tracking data (see Figure 1—figure supplement 3 for details). mEGFP signal is 14% brighter than GFP (Coffman et al., 2011). The brightness difference was corrected throughout the data analysis. For most indicated proteins, at least 50 endocytic sites were examined. n.s. stands for ‘not significant’. Scale bars on the cell images are 2 µm.
-
Figure 1—source data 1
Figure 1A-G maximum intensity source data.
- https://cdn.elifesciences.org/articles/50749/elife-50749-fig1-data1-v1.xlsx
Figure 1—figure supplement 1
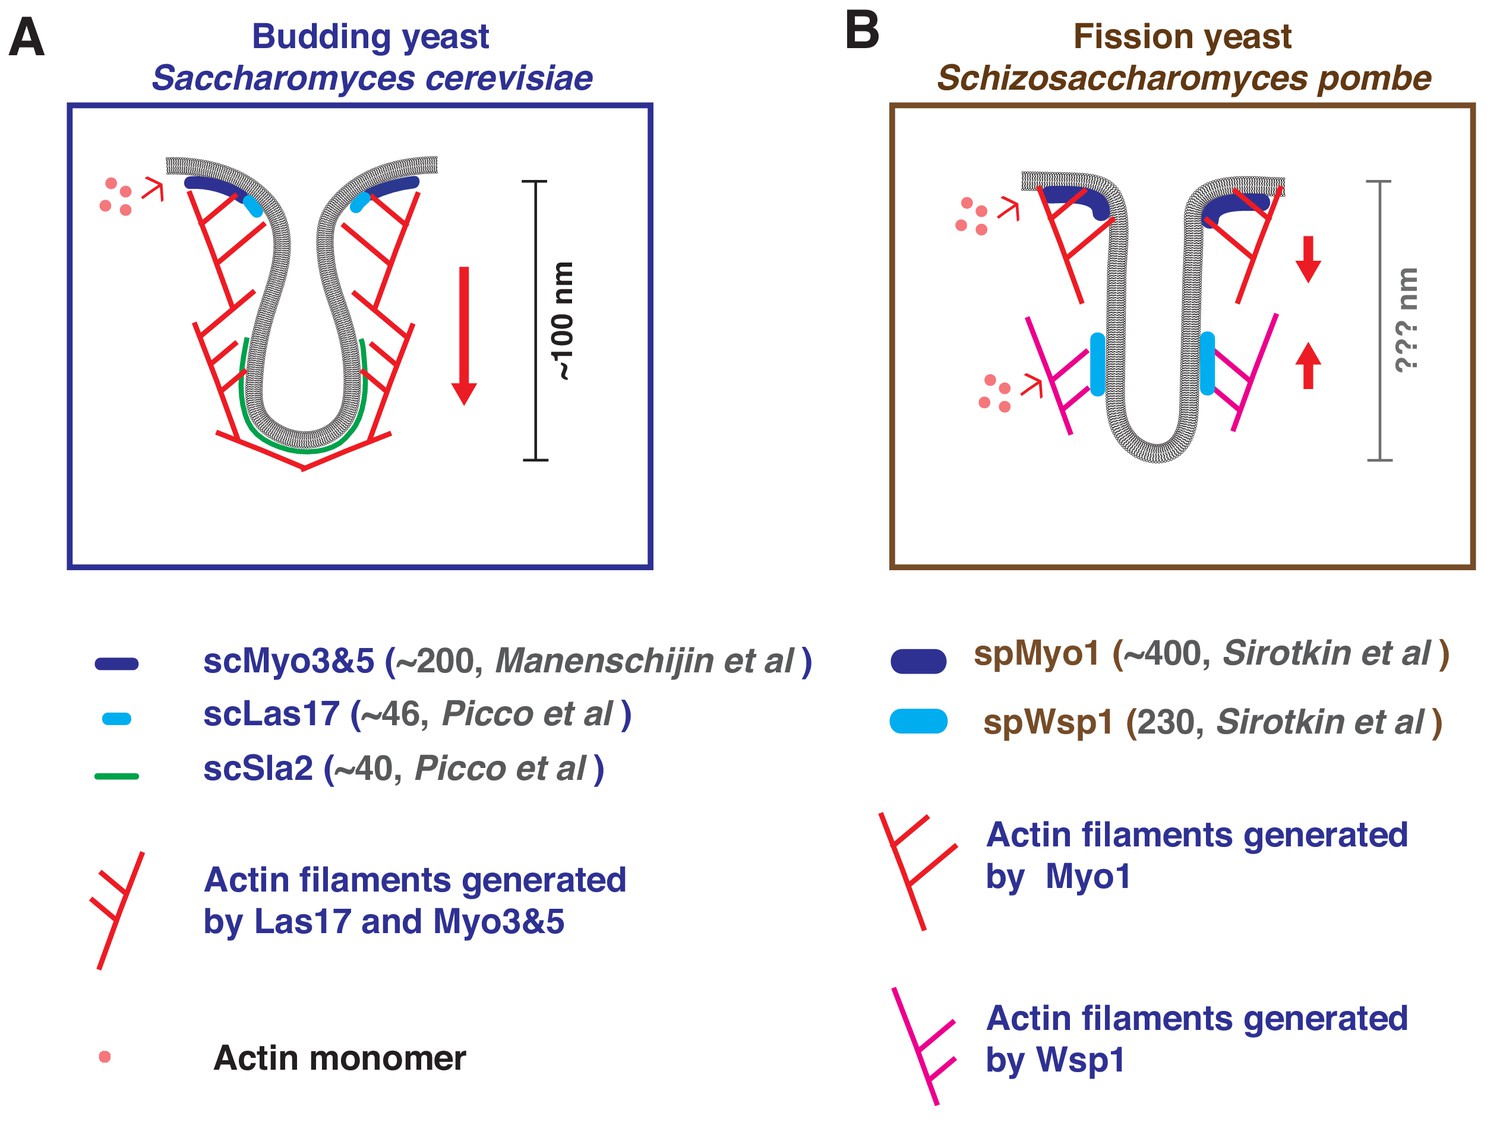
Endocytic sites in budding and fission yeast: A brief summary of what has been reported previously.
The endocytic actin machinery on invaginated membranes in budding (A) or fission (B) yeast. (A) In budding yeast, actin filaments are proposed to be nucleated near the base of the invagination. Continued polymerization driven by the nucleation promoting activity (NPF) of scMyo3/5 and scLas17 pushes the actin network toward cytoplasm (Sun et al., 2006). The endocytic membrane is coupled to the actin network by coat proteins such as Sla2 and is pulled inward with the actin network (Kaksonen et al., 2003; Sun et al., 2005). The membrane invagination is ~100 nm deep at the time of vesicle scission (Kukulski et al., 2012). Previously, HA-tagged Myo5 was observed not only at the base but also at the tip of endocytic membrane invaginations in chemically fixed budding yeast cells by immunoelectron microscopy (Idrissi et al., 2008; Idrissi et al., 2012). These results led to the proposal that two distinct endocytic actin networks exist in budding yeast. However, two independent live-cell imaging studies indicated that Myo5-GFP patches stay non-motile at the cell cortex during their lifetime (Galletta et al., 2008; Sun et al., 2006). Furthermore, super-resolution microscopy suggested that Myo5-GFP forms a Nano-template for actin nucleation at the membrane base (Mund et al., 2018). Together, these observations suggest that most if not all of the type I myosin is localized at the base of invaginated endocytic membranes. (B) In fission yeast, a two-zone model proposes that actin nucleation by spMyo1 and spWsp1generate two independent actin networks that push against each other and pull the tip of the invagination into the cytoplasm (Arasada and Pollard, 2011). The depth of the fission yeast membrane invagination is not clear. Note, some of the previously measured absolute molecular numbers of indicated protein homologues differ greatly between the two yeasts (Manenschijn et al., 2019; Picco et al., 2015; Sirotkin et al., 2010).
Figure 1—figure supplement 2
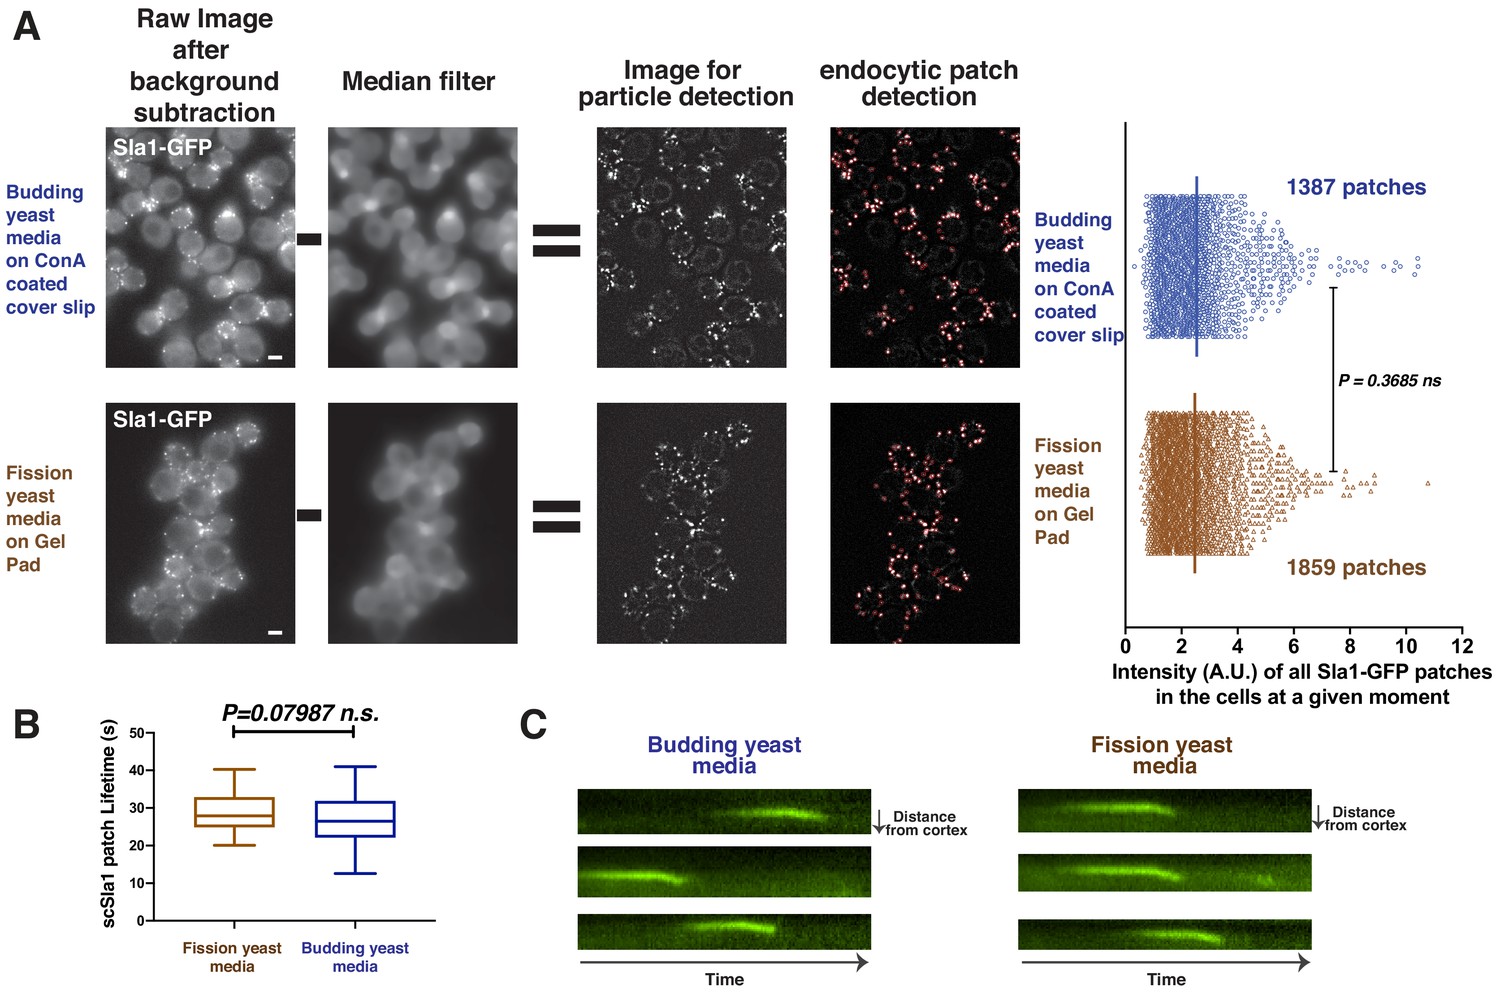
Quantitative comparison of fluorescently-tagged scSla1 in budding yeast cultured in different media.
(A) Budding yeast expressing Sla1-GFP were cultured in budding yeast (upper panel) or fission yeast (lower panel) media. The cells were then imaged by the Materials and methods commonly used for budding or fission yeast, respectively. The images were processed and analyzed using the Particle Tracker plugin in ImageJ software (see Materials and methods). To precisely compare the number of endocytic proteins at endocytic sites under these different growth conditions, local background correction by median filter subtraction (Picco and Kaksonen, 2017) was applied to the live cell images after general background subtraction and photobleaching correction. Red circles in right panels indicate the endocytic events automatically detected by the tracking program. The fluorescence intensities of all the detected events were measured and compared. Scale bars are 2 µm. (B) Lifetime of scSla1 patches in different media. (C) Radial kymograph of scSla1 patches in different media.
Figure 1—figure supplement 3
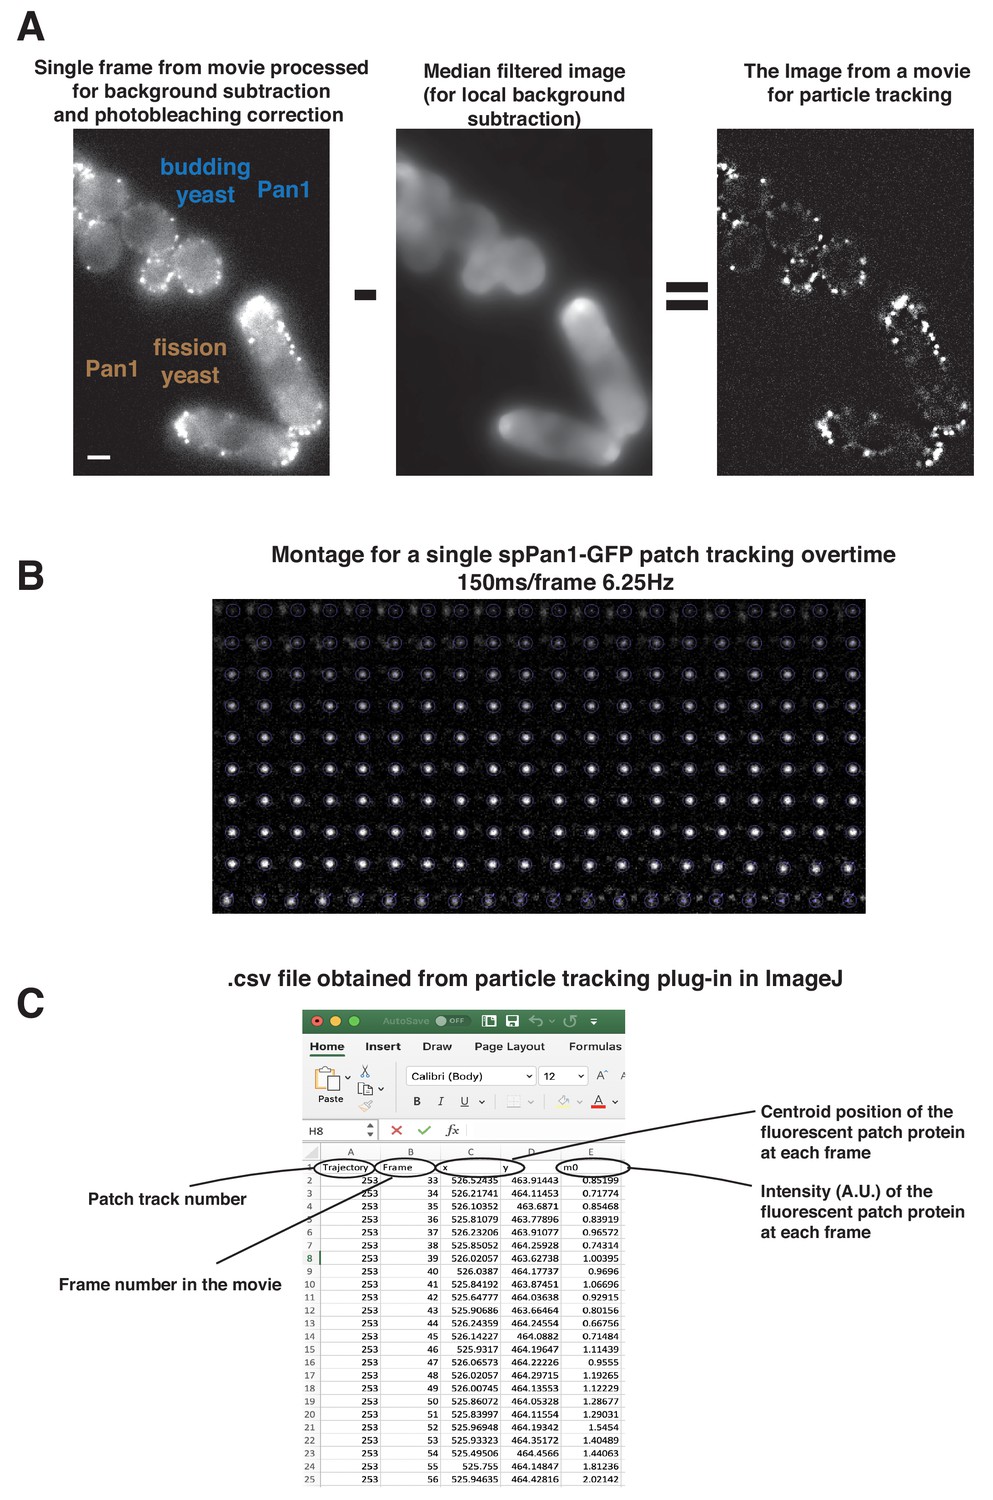
Live cell imaging data processing and analysis by Particle Tracker plugin.
(A) Single frame from movie processed for background subtraction and photobleaching correction (left panel). A median filter was used to compute the local background surrounding the endocytic patches (middle panel). The median filtered image was subtracted from the processed image, resulting in the image (right panel) for particle tracking. (B) Time series showing intensity and movement of a single endocytic event over its full lifetime using Particle Tracker. (C) The. csv file generated by particle tracking analysis. Scale bars are 2 µm.
Figure 2 with 3 supplements
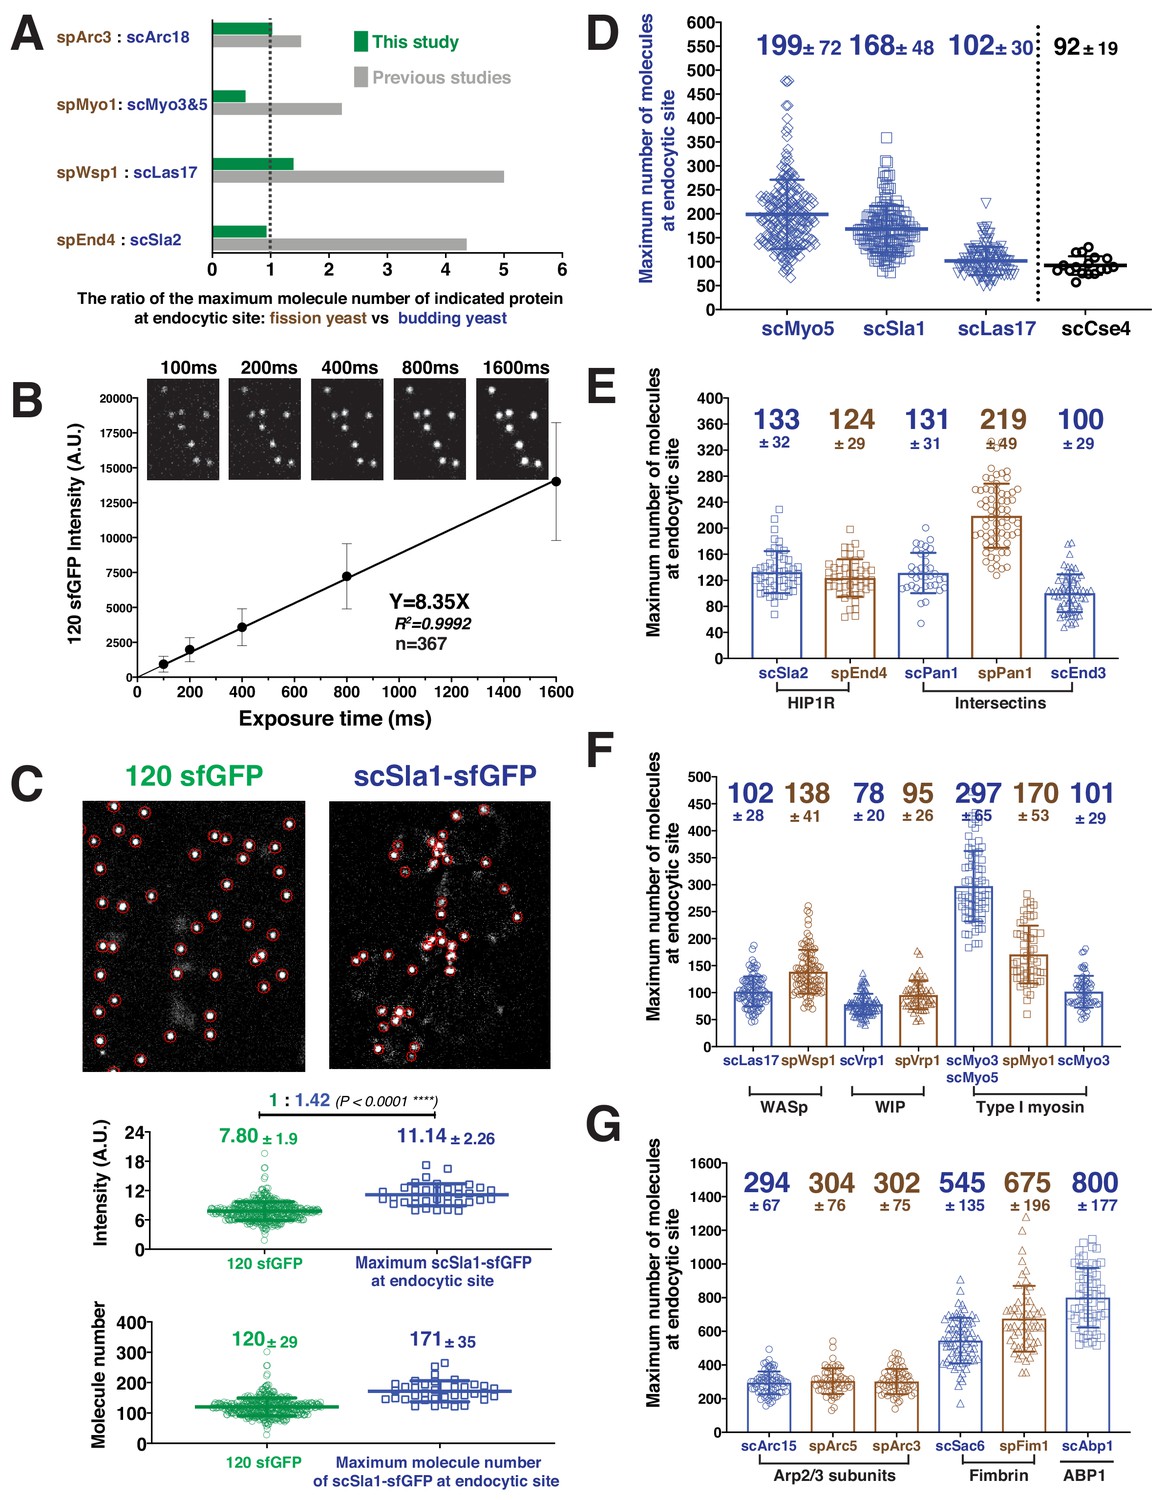
Determining the maximum number of fluorescently-tagged endocytic proteins at endocytic sties by ratiometric comparison of fluorescence intensities to the intensity of 120-sfGFP-tagged nanocages.
(A) Comparison of ratios of maximum protein levels at endocytic sites for the two yeasts in this study (green) vs in previous studies (gray). (B) The mean fluorescence intensity of 120-sfGFP- tagged nanocages (n = 367) is linearly proportional to exposure time. Images obtained for indicated exposure times are presented at the top of the graph. (C) Ratiometric comparison between the fluorescence intensity of 120-sfGFP-tagged nanocages (n = 305) and maximum intensity of scSla1-sfGFP at endocytic sites (n = 58). Left panel, image of 120-sfGFP-tagged nanocages. Right panel, single frame from a processed movie of scSLA1-sfGFP cells. The nanocage image and the scSLA1-sfGFP movie has been imaged using the same imaging system and the images were processed and analyzed using the same particle tracking parameters. Red circles indicate the sites automatically detected by the tracking program. The intensity (middle) and molecular numbers (bottom) were determined and plotted. (D) Maximum molecular number of scMyo5 (n = 210), scSla1 (n = 152) and scLas17 (n = 112) at endocytic sites as well as the molecular number of scCse4 (n = 17) on the kinetochore clusters. The molecular numbers were calculated by the ratiometric fluorescence intensity comparison of the indicated sfGFP-tagged proteins and 120-sfGFP-tagged nanocages. (E-G) Maximum molecular numbers for indicated proteins at endocytic sites in budding (blue) and fission (brown) yeast. The molecular numbers were calculated by the ratiometric fluorescence intensity comparisons using scSla1, scLas17, or scMyo5 as standards (Figure 2—figure supplement 2, Table 2). For each indicated protein, at least 50 endocytic sites were examined. The scale bars on the images are 2 µm.
-
Figure 2—source data 1
Figure 2D maximum protein number source data.
- https://cdn.elifesciences.org/articles/50749/elife-50749-fig2-data1-v1.xlsx
Figure 2—figure supplement 1
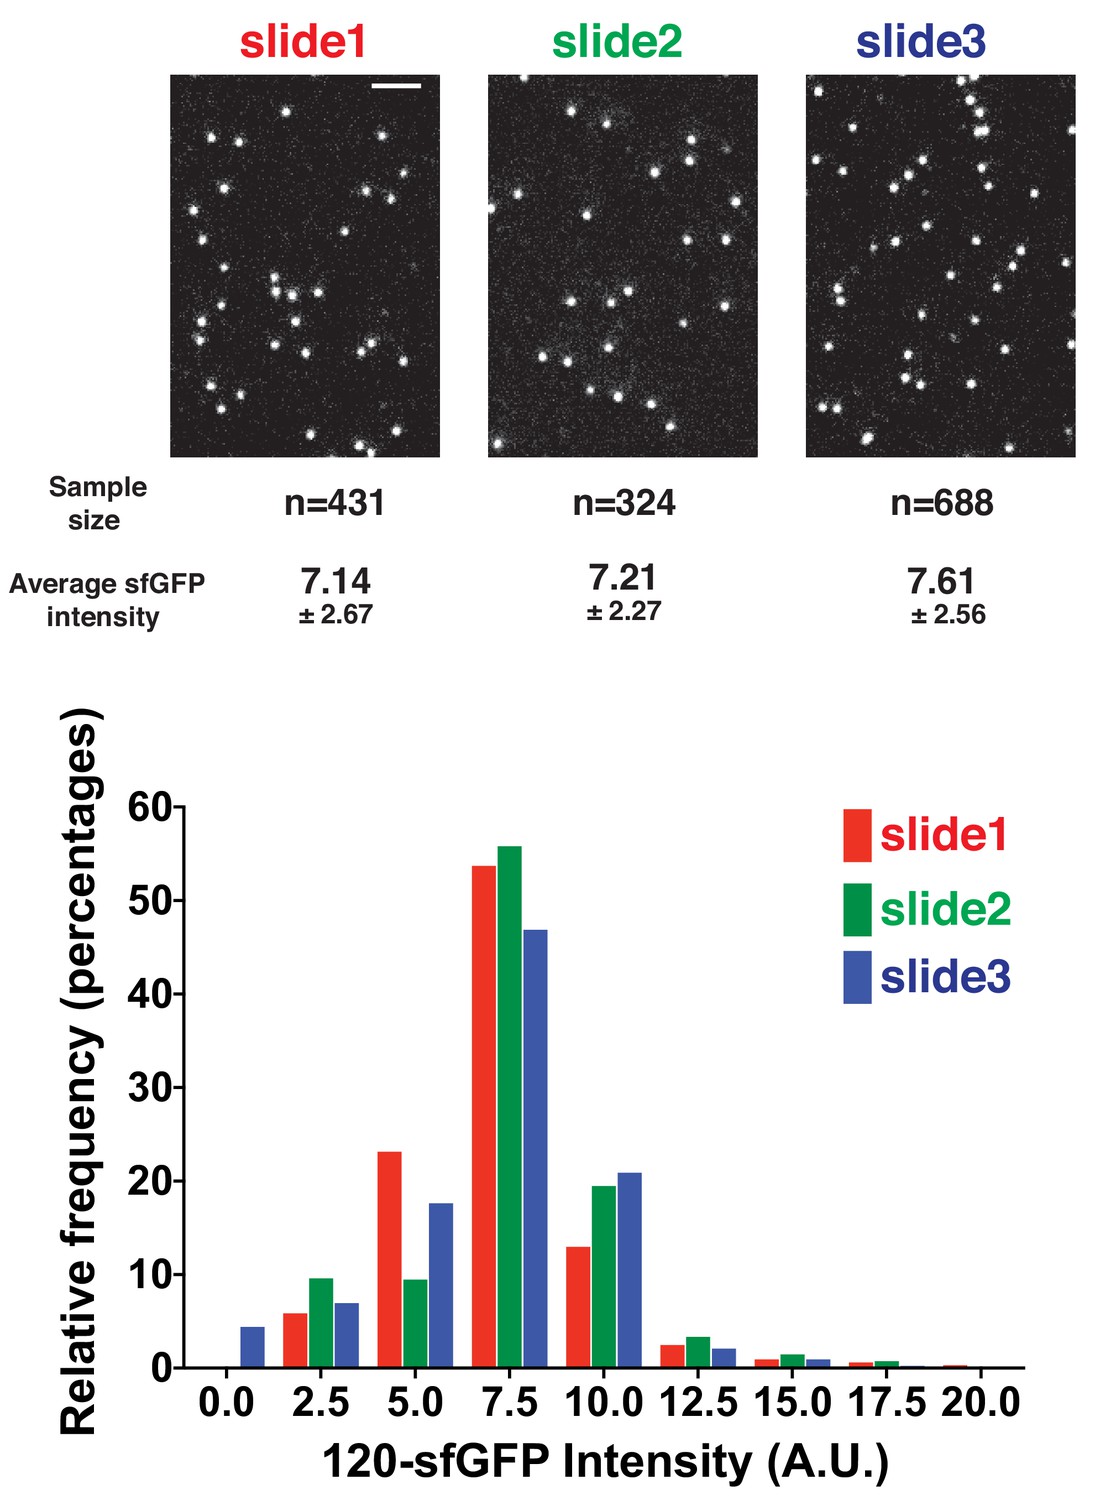
Quantitative comparison of 120-sfGFP-tagged nanocages prepared on different days.
120-sfGFP-tagged nanocages were prepared and imaged three different days using the same method and conditions. The fluorescence intensities of the 120-sfGFP-tagged nanocages were measured and compared. Scale bars are 2 µm.
Figure 2—figure supplement 2
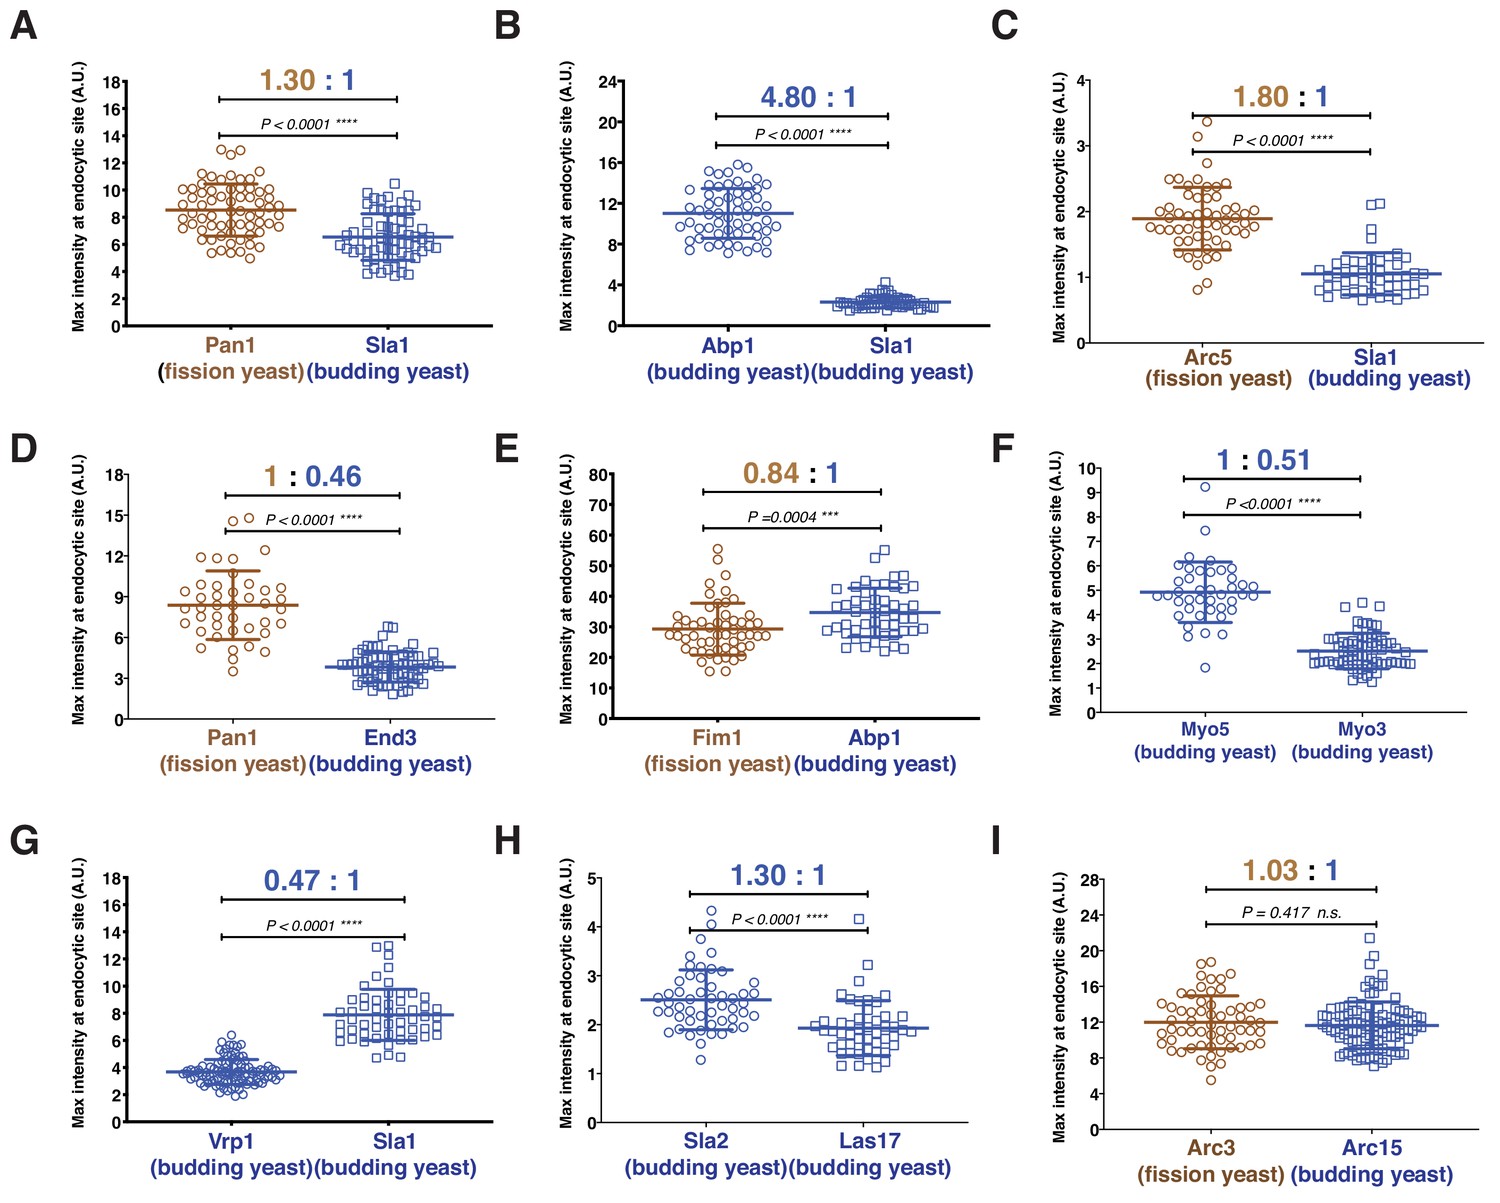
Quantitative comparison of the maximum number of homologous proteins at endocytic sites in budding and fission yeast.
(A-I) Cells expressing indicated proteins were mixed and then imaged over time. The resulting movies were analyzed using a particle tracking program. The maximum fluorescence intensities were measured and compared for the indicated protein pairs.
Figure 2—figure supplement 3
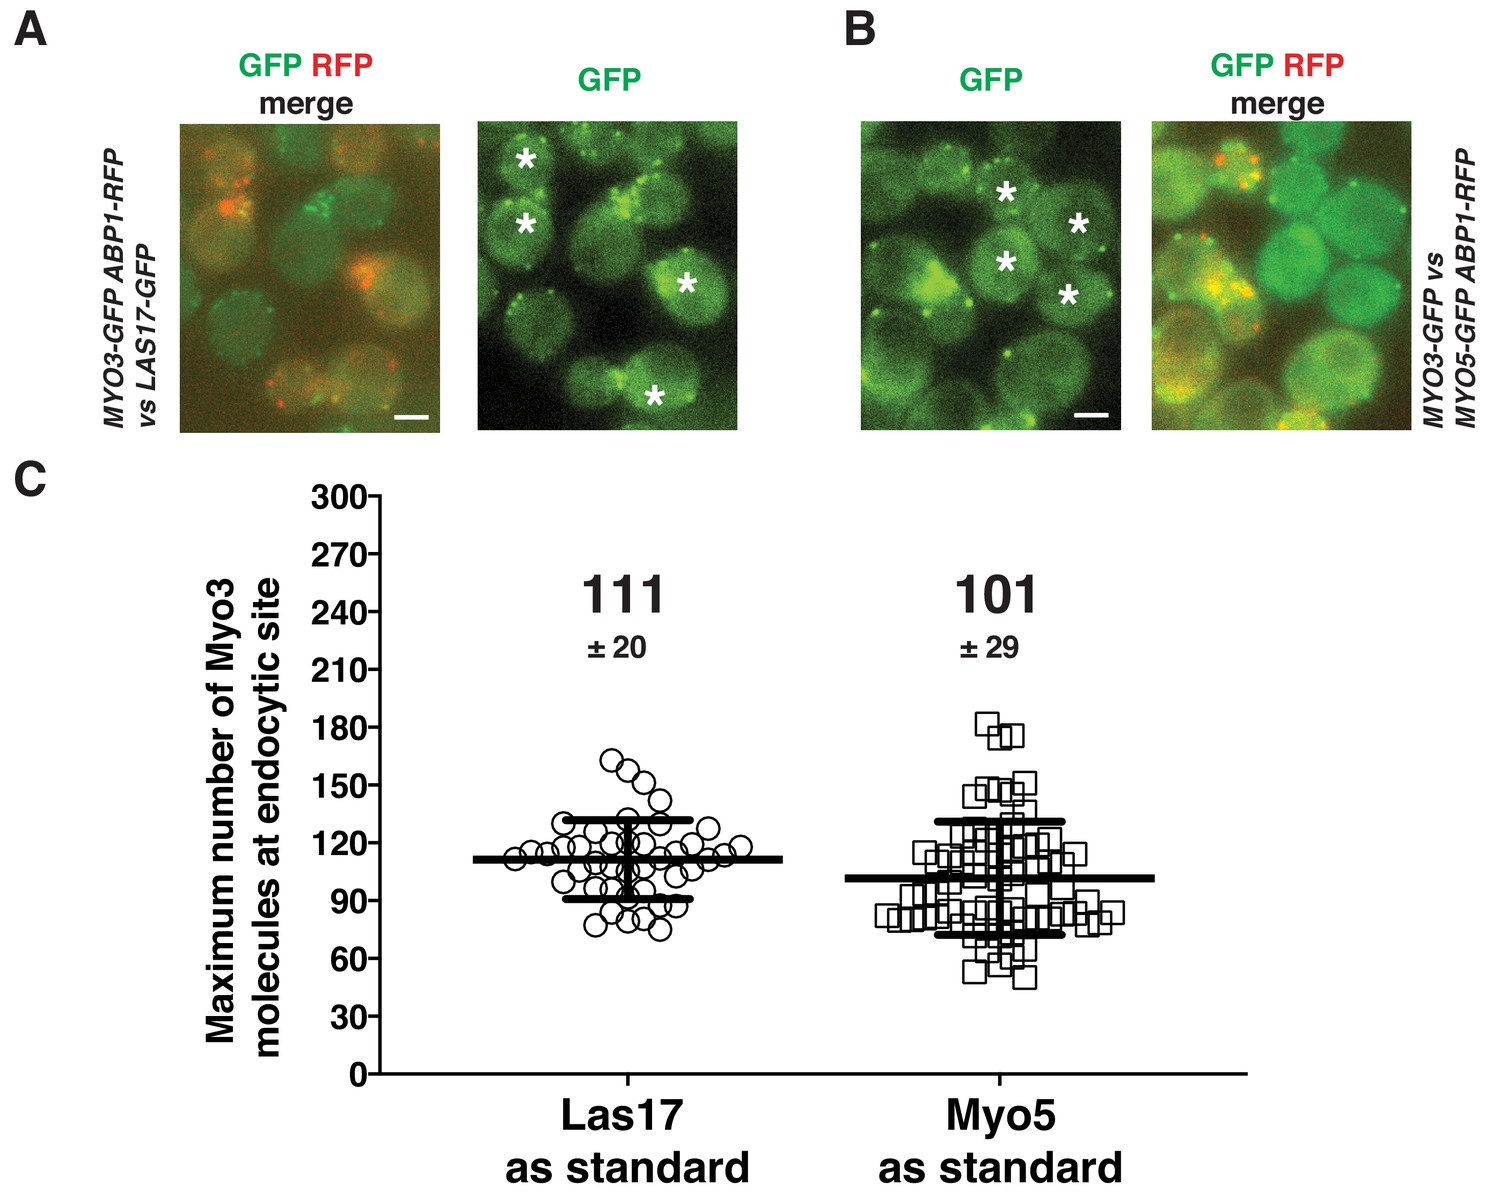
Determining the maximum number of Myo3-GFP molecules using Sla1-GFP and Las17-GFP as standards.
(A) Determining the maximum number of Myo3-GFP molecules using Las17-GFP as a standard. Two-color image of MYO3-GFP ABP1-RFP cells and LAS17-GFP cells (left panel). Single frame of a movie of MYO3-GFP ABP1-RFP cells and LAS17-GFP cells simultaneously imaged in the GFP channel (right panel). The dynamics of GFP-labeled protein patches were analyzed using the Particle Tracker plugin in ImageJ software and the maximum fluorescence intensity was measured and compared between the indicated proteins (C). (B) Determining the maximum protein numbers of scMyo3-GFP using scMyo5-GFP molecules as a standard. Two-color image of MYO5-GFP ABP1-RFP cells and MYO3-GFP cells (left panel). Single frame from a movie of MYO5-GFP ABP1-RFP and MYO3-GFP cells imaged simultaneously in the GFP channel (right panel). The dynamics of GFP-labeled protein patches were analyzed using the Particle Tracker plugin in ImageJ software and the maximum fluorescence intensity was measured and compared between the indicated proteins (C). (C) The molecular numbers were calculated by ratiometric fluorescence intensity comparison using data acquired in A and B. The asterisks represent LAS17-GFP cells in (A) and represent MYO3-GFP cells in (B). Scale bars are 2 µm.
Figure 3 with 1 supplement
Quantitative comparison of endocytic actin dynamics in budding and fission yeast.
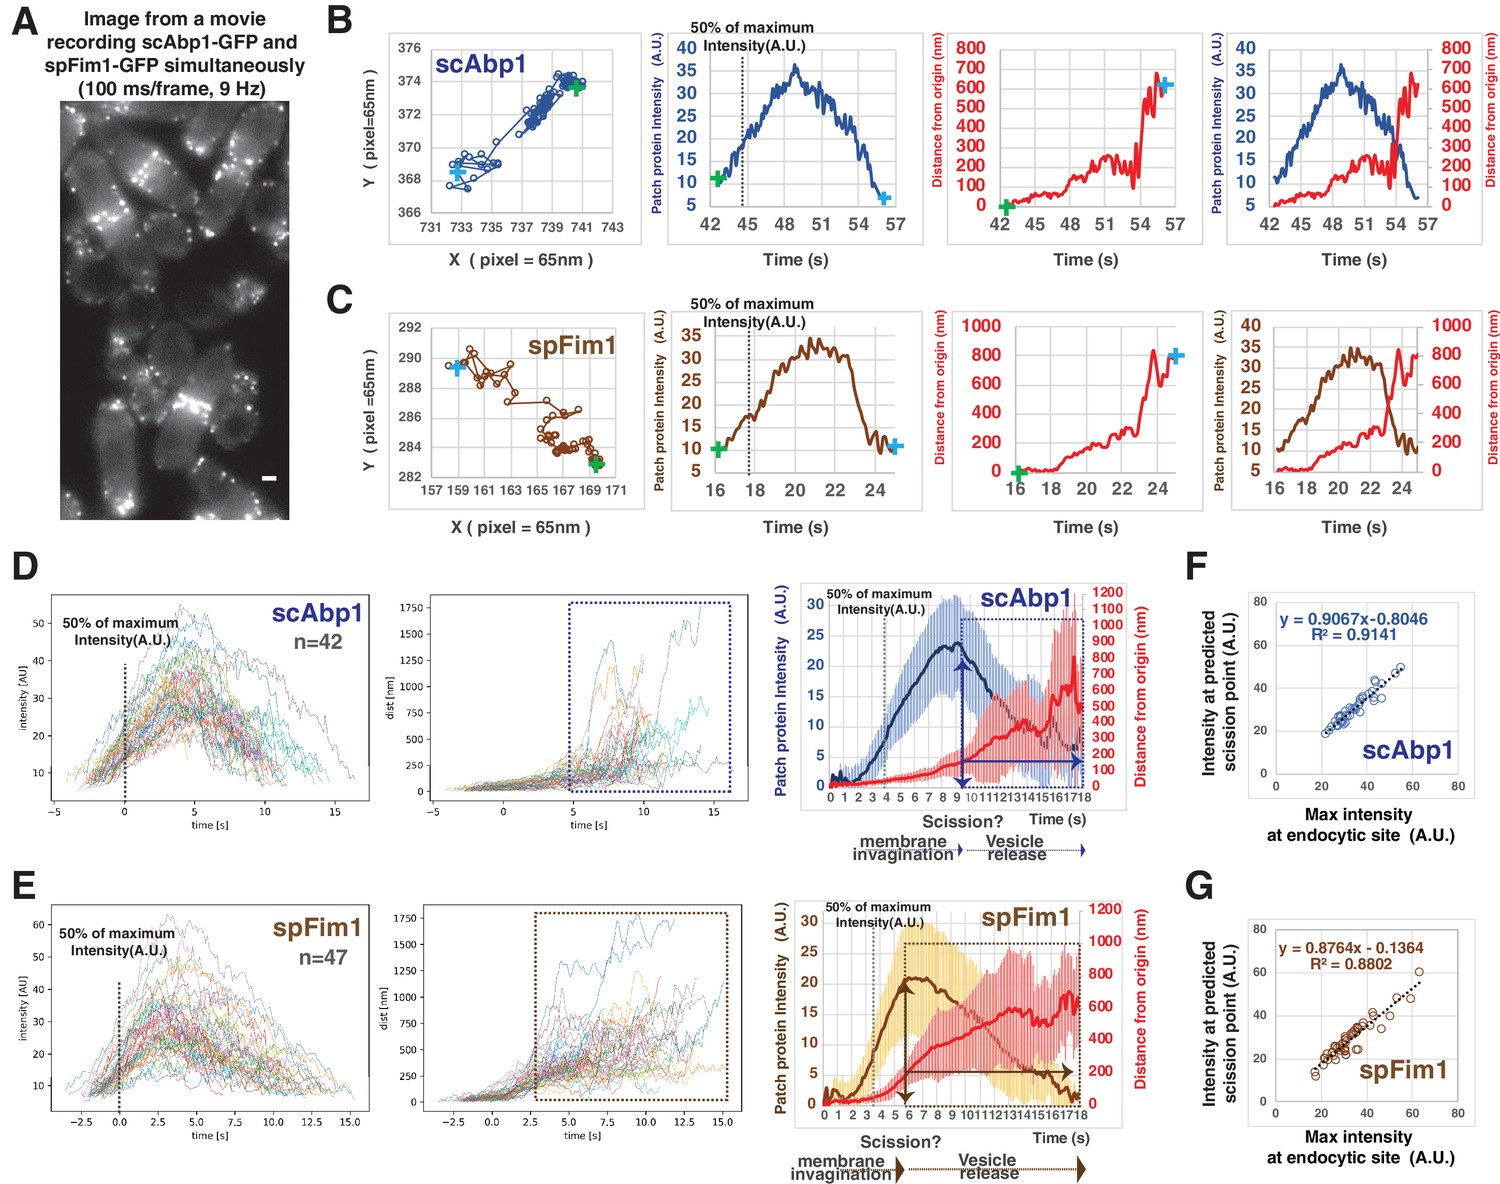
(A) Single frame from a movie of simultaneously imaged scABP1-GFP in budding yeast and spfim1-mEGFP in fission yeast. (B and C) Single endocytic events represented by scAbp1 in budding yeast (B) and by spFim1 in fission yeast (C) were tracked and then analyzed using our custom software. Graphs from left to right: (Left) Protein patch centroid position over time. Consecutive positions are connected by lines. '+' in green or in blue indicates the first or the last position, respectively. (Left Center) Fluorescence intensity over time. Dotted line indicates the time point when fluorescence intensity reaches 50% of its maximum intensity. (Right Center) Displacement over time. Displacement from the origin is the distance from the position of each time point to the starting position ('+' in green). (Right) Fluorescence intensity and displacement over time. (D and F) Numerous endocytic events tracked by imaging fluorescent scAbp1 (D) or spFim1 (E) were analyzed and aligned. Graphs from left to right: numerous endocytic events aligned to the point of 50% of maximum intensity (indicated by dotted line); displacement data for same cells as in right panel aligned according to 50% maximum intensity point (boxed areas represent inferred movement after scission); combined average results from graphs on the left (note that time and intensity are rescaled on the averaged data graphs). Dotted line indicates the time point when fluorescence intensity reaches to 50%. Vertical line with arrow indicates the inferred moment of scission predicted by the dramatic increase in standard deviation (Figure 3—figure supplement 1). Standard deviation is represented by the shadow around the average line. (F and G) Inferred endocytic scission is tightly correlated with the time when endocytic actin assembly reaches its maximum for budding (F) and fission yeast (G). The scale bars on cell pictures are 2 µm.
Figure 3—figure supplement 1
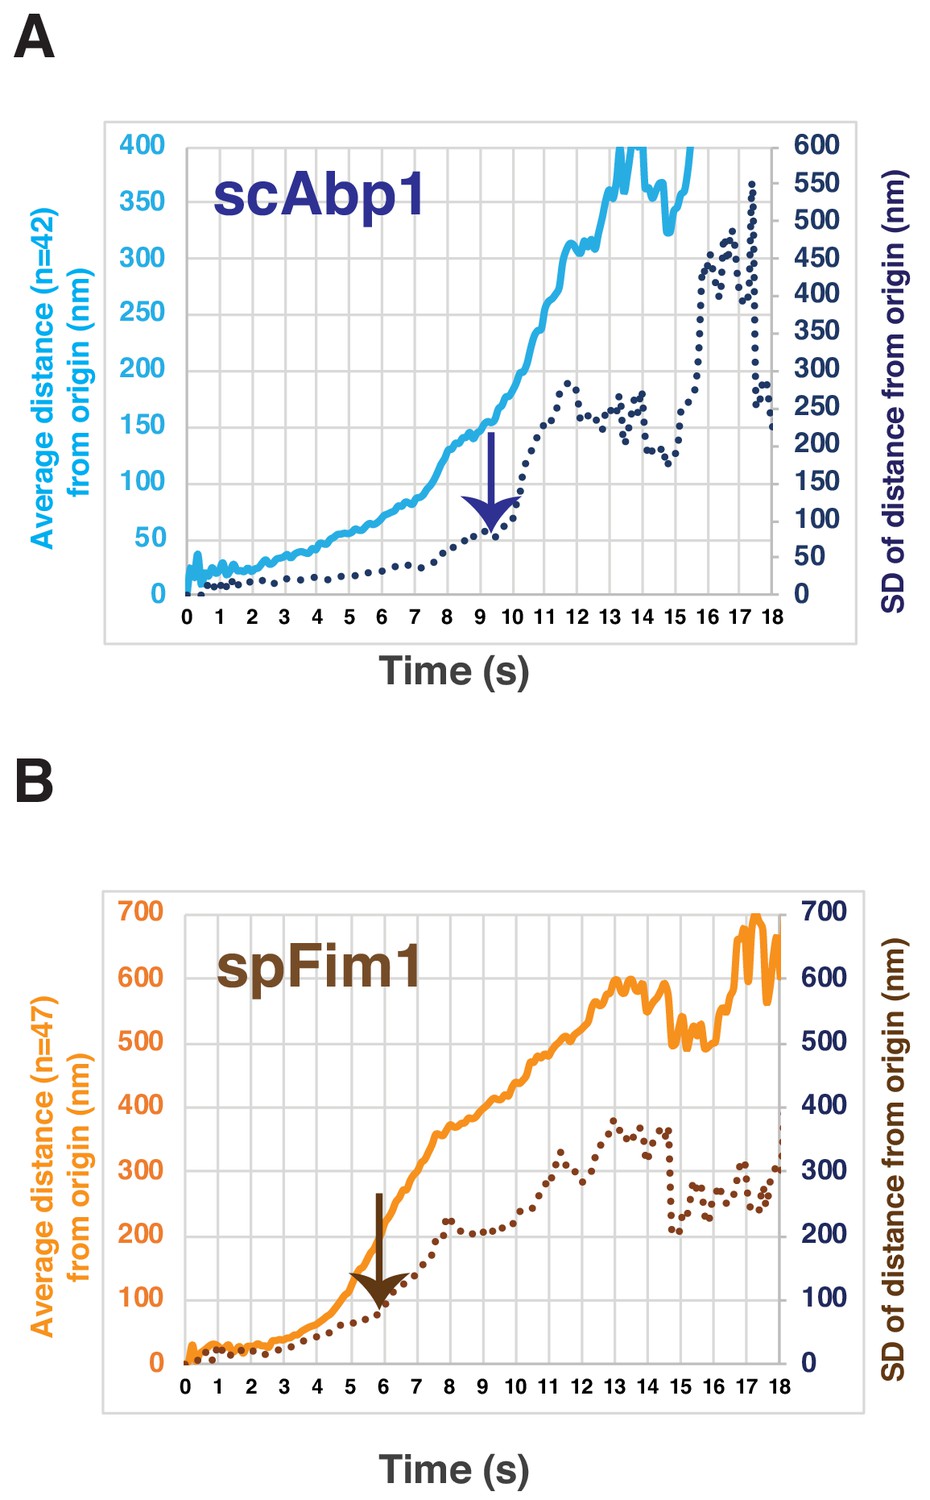
Predicting the timing of endocytic vesicle scission by the changes of the standard deviation of actin patch displacement.
(A) The standard deviation (SD) of actin patch displacement starts to greatly increase when scAbp1 patches move ~125 nm away from their origin. The light blue line represents the average displacement from the origin. The dark blue dotted line represents the SD of displacement from the origin. The arrow indicates the timing of the predicted scission event. (B) The SD of actin patch displacement starts to greatly increase when spFim1 patches move ~200 nm away from their origin. The light brown line represents the average displacement from the origin. The dark brown dotted line represents the SD of displacement from the origin. The arrow indicates the timing of the predicted scission event.
Figure 4
Quantitative comparison of endocytic coat dynamics for budding and fission yeast.
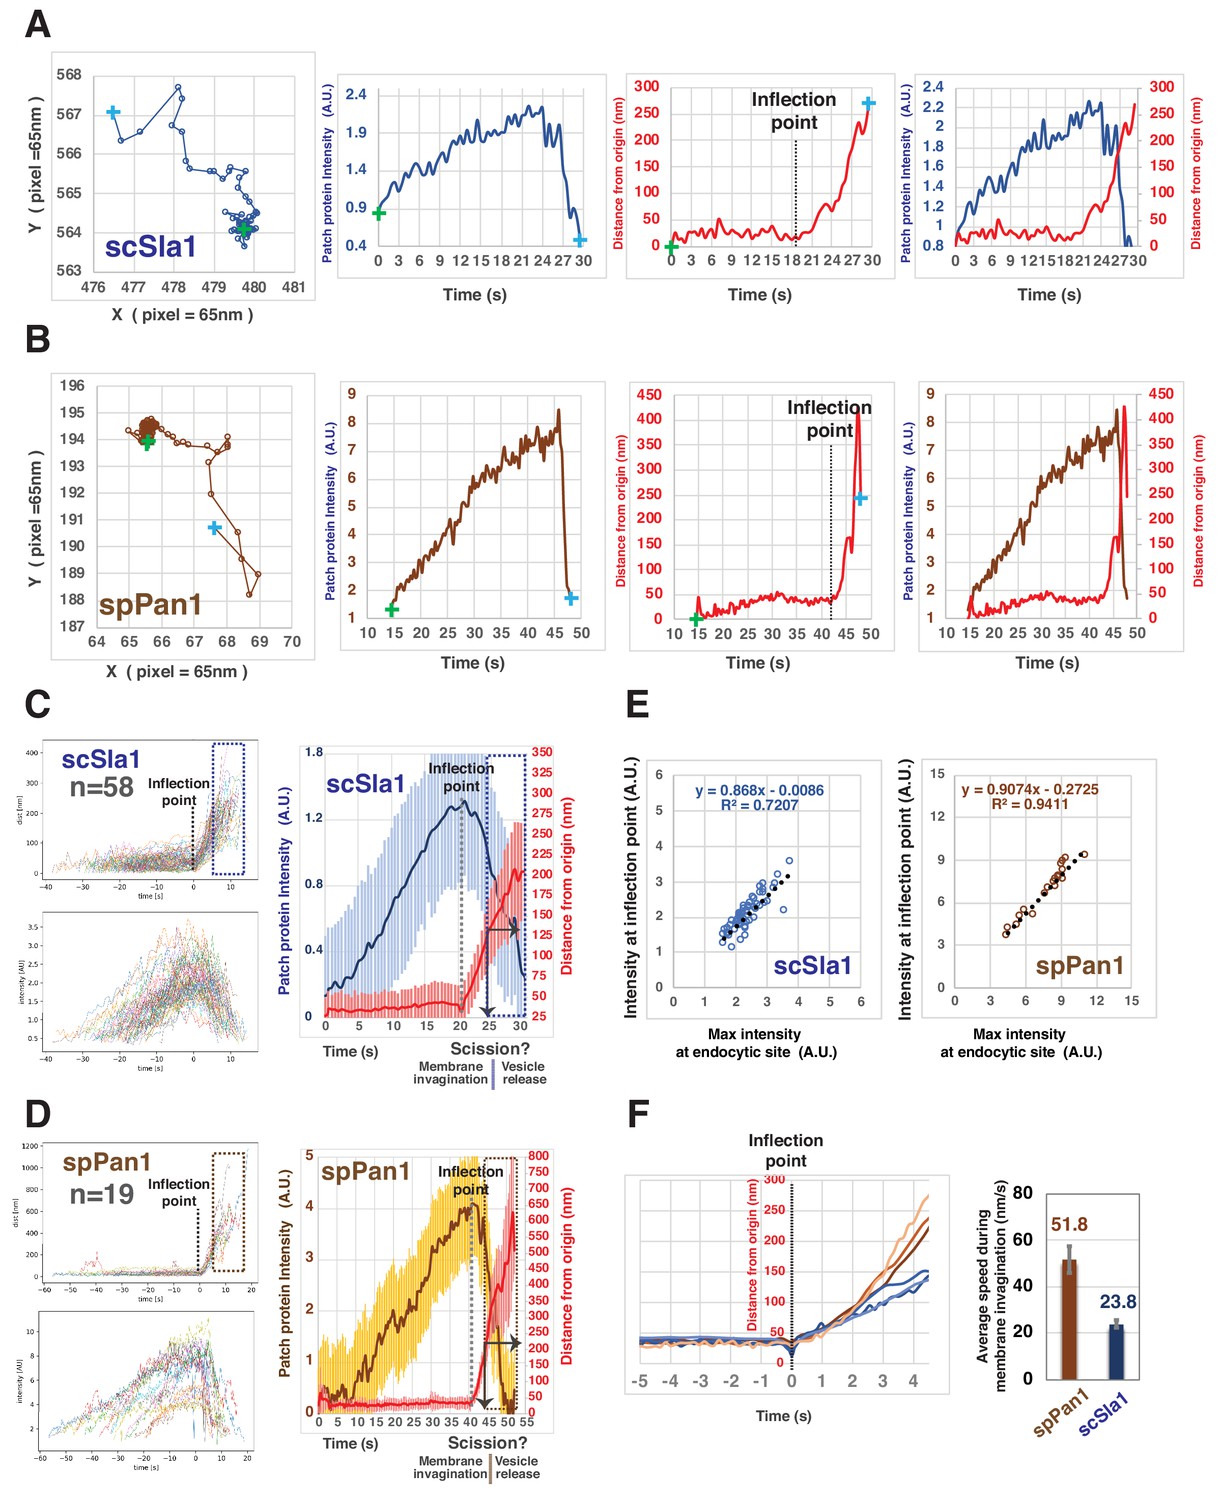
(A and B) Single endocytic event detected by tracking fluorescent scSla1 in budding yeast (A) or spPan1 in fission yeast (B). Graphs from left to right: protein patch centroid position over time, '+' in green or in blue indicate the first and last positions, respectively; fluorescence intensity over time; displacement over time ('+' in green and blue indicate starting and end points, respectively while the dotted line indicates the inflection point at which time the coat protein begins to move; fluorescence intensity and displacement over time. (C and D) Numerous endocytic events detected by tracking fluorescent scSla1 (C) or by spPan1 (D) were analyzed and aligned. Graphs from left to right: numerous endocytic events aligned at inflection points indicated by the dotted line, the boxed area represents movement after inferred scission event; fluorescence intensity aligned by the movement inflection point; combined average results from the two graphs on the left (note that time and intensity are rescaled in the average graph and that the dotted line indicates inflection point), vertical line with arrow indicates the moment of scission predicted by the dramatic standard deviation increase. Standard deviation is represented by the shadow around the average line. (E) Initiation of endocytic membrane invagination is tightly correlated with the time when the endocytic coat reaches its maximum amount in budding and fission yeast. (F) Speed of coat protein movement during the inferred invagination process prior to scission. Each of the brownish or bluish lines represents the average displacement of spPan1 or scSla1, respectively, over time from one experiment. Three independent experiments were performed for the indicated proteins. Bar graphs show rates for coat proteins.
Figure 5 with 2 supplements
Spatial-temporal relationship of coat proteins, scission proteins and the actin network at fission yeast endocytic sites.
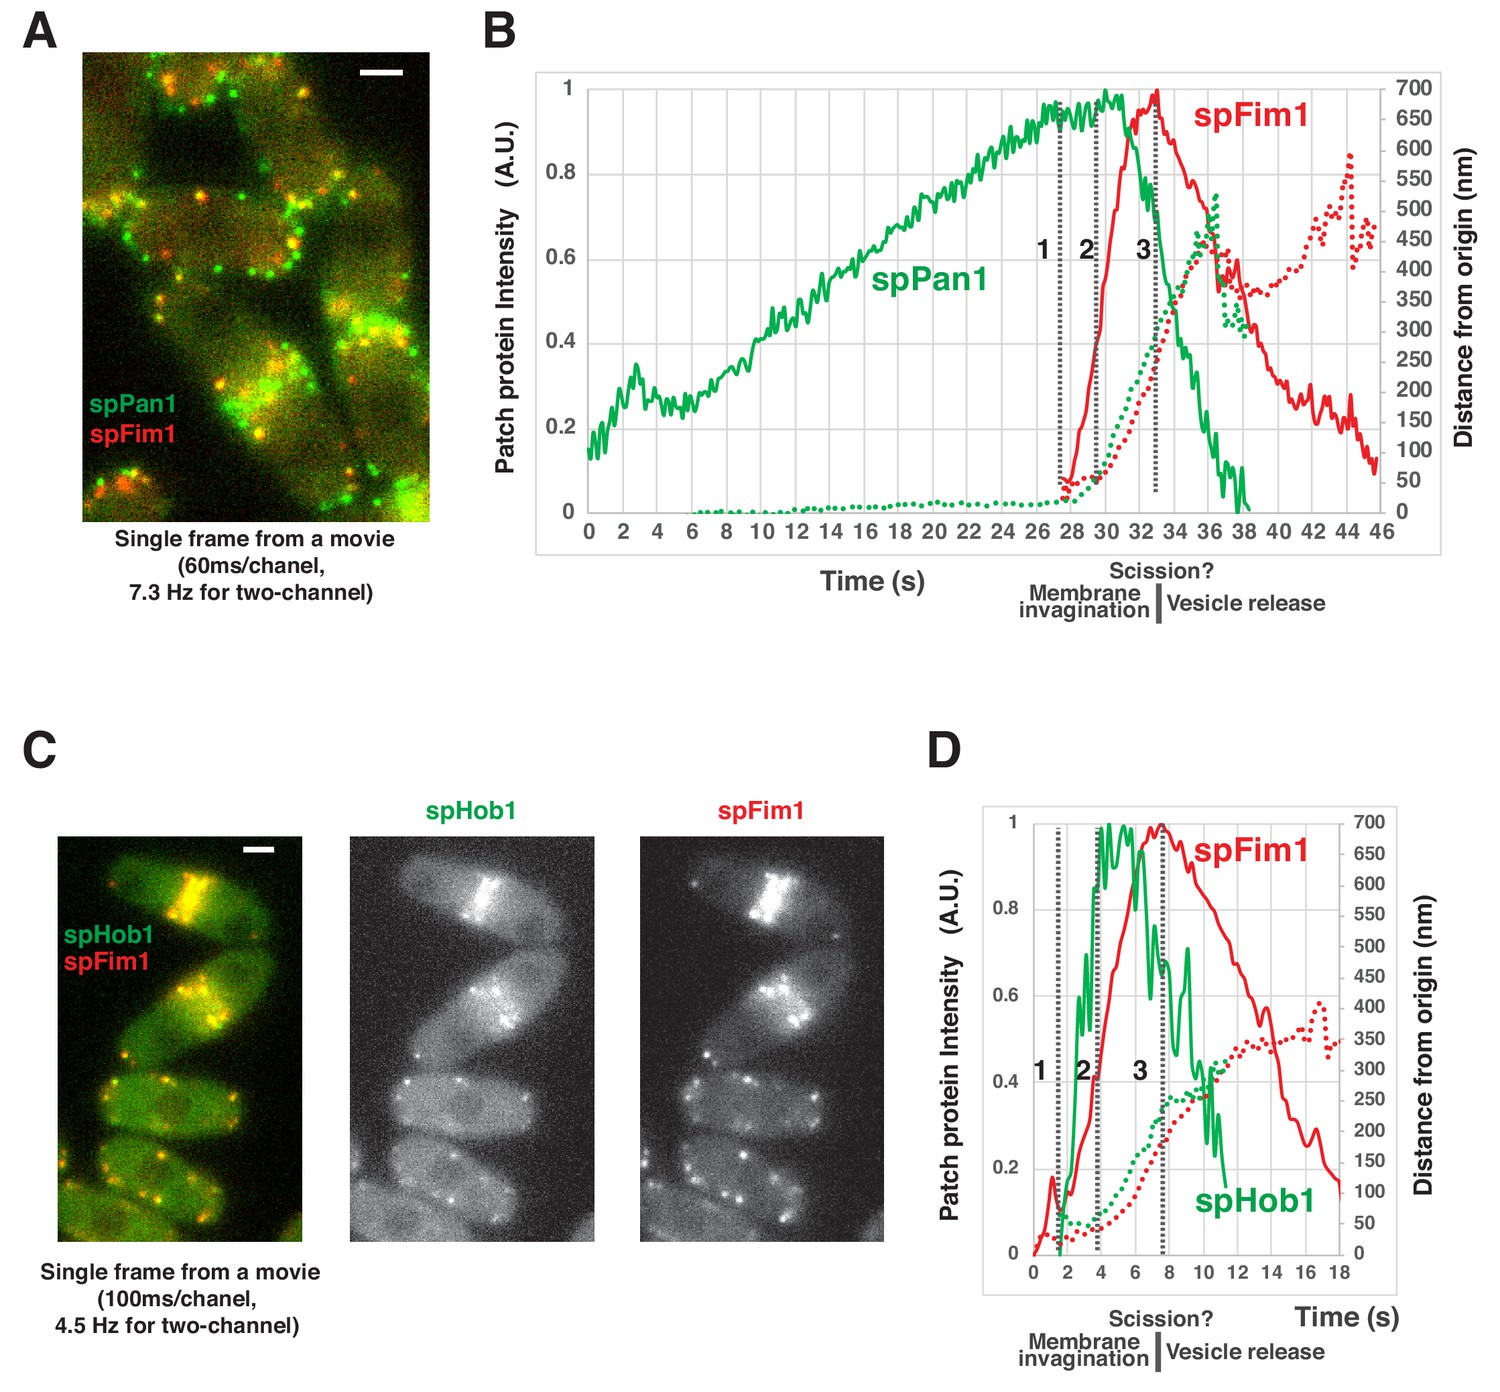
(A) Single frame from a movie of spPan1-mEGFP and spFim1-mCherry expressed in fission yeast cells. (B) Alignment of average intensity (solid lines) and displacement (dotted lines) of spPan1-mEGFP (coat) and spFim1-mCherry (actin cytoskeleton) patches (n = 15) (Figure 5—figure supplement 1 for details). Vertical dotted line one indicates the time when actin assembly is first detected. Vertical dotted line two marks the inferred initiation of membrane invagination. Vertical dotted line three indicates the inferred scission event. (C) Single frame from a movie of spHob1-GFP spFim1-mCherry expressed in fission yeast cells. (D) Alignment of average intensity (solid lines) and displacement (dotted lines) of spHob1-GFP (scission protein) and spFim1-mCherry (actin cytoskeleton) patches (n = 23) (Figure 5—figure supplement 2 for details). Vertical dotted line one indicates the time when spHob1-GFP is first detected. Vertical dotted line two marks inferred initiation of membrane invagination. Vertical dotted line three indicates inferred scission event. Scale bars on cell pictures are 2 µm.
Figure 5—figure supplement 1
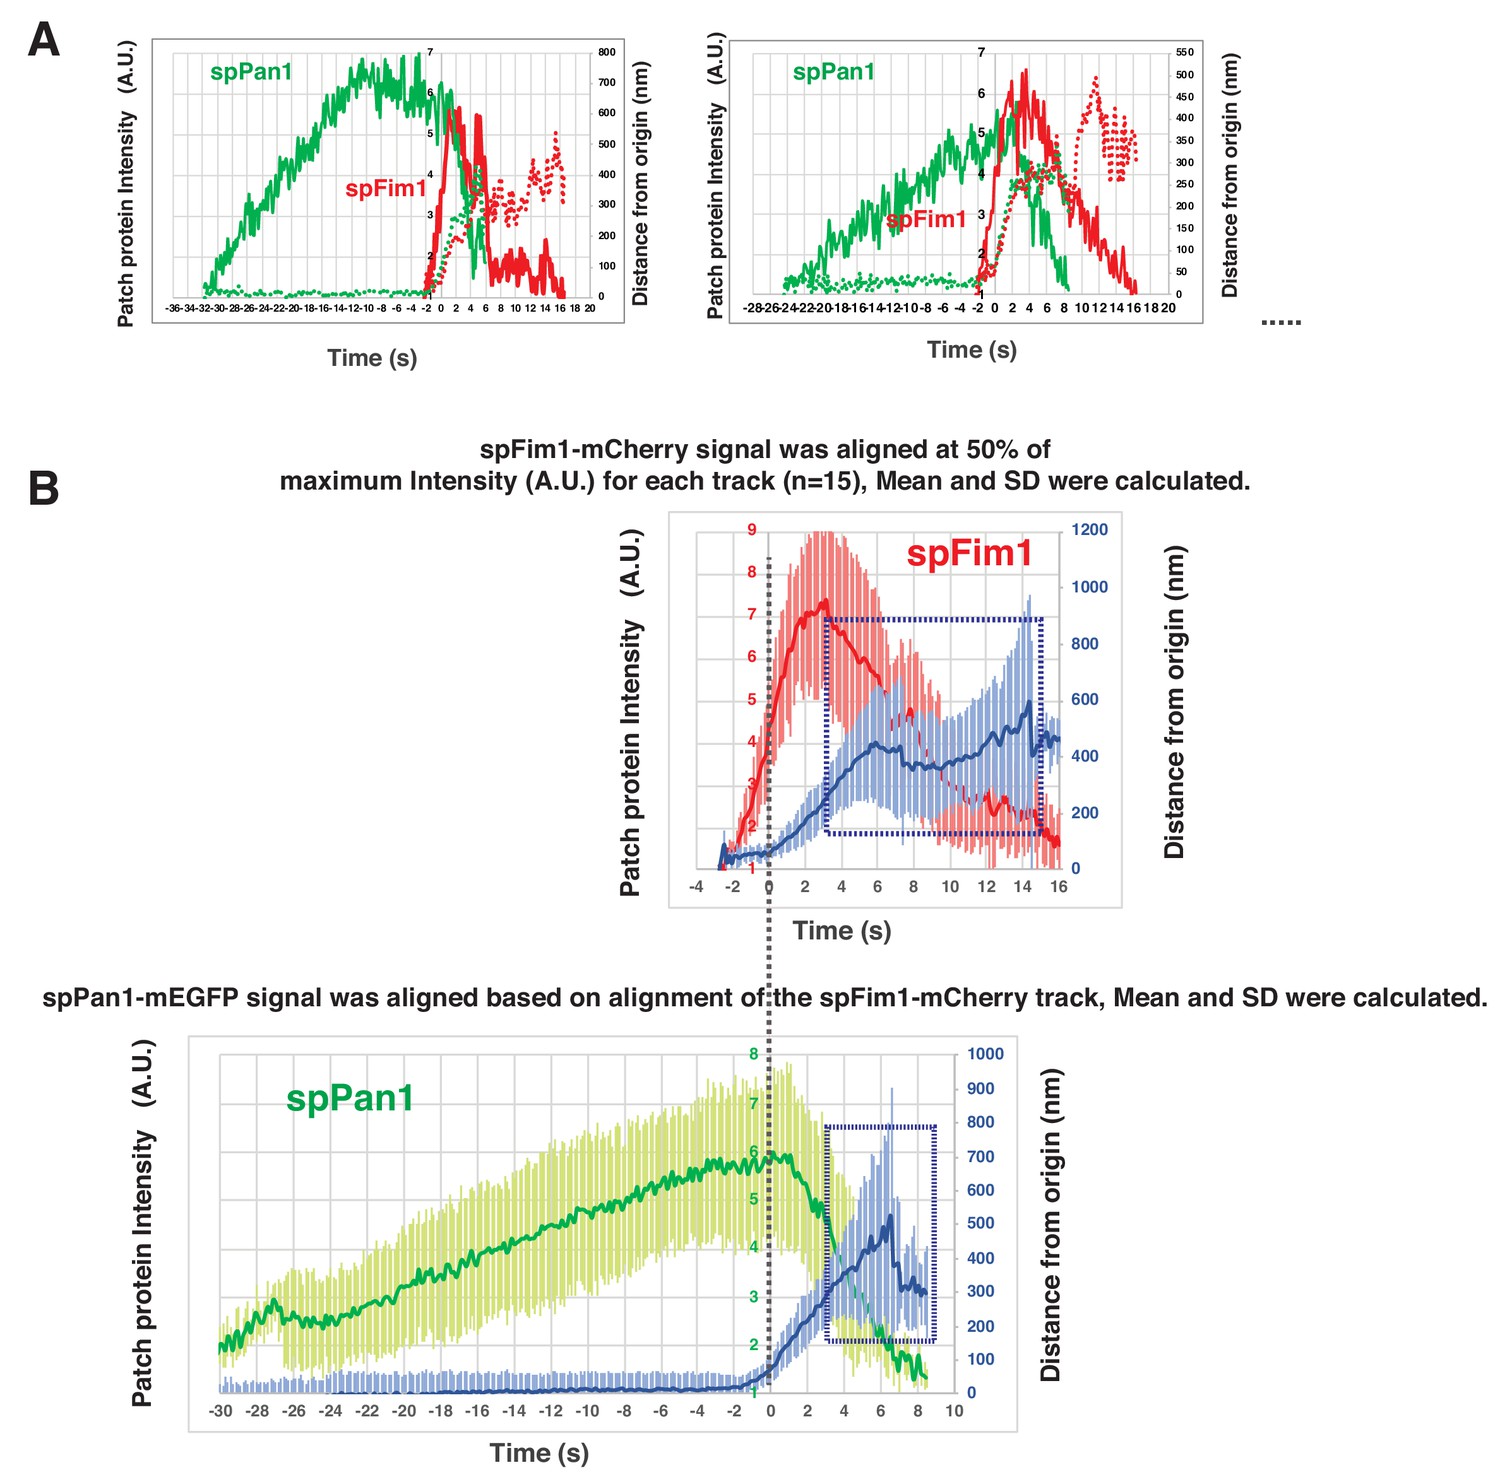
Alignment and quantification of average trajectories for spFim1-mCherry and spPan1-mEGFP in fission yeast.
(A) Alignment of intensity and displacement of spPan1-mEGFP and spFim1-mCherry for a single endocytic event. Two examples are presented. (B) Alignment of average intensity and displacement plots for spFim1-mCherry (upper graph) and spPan1-mEGFP (lower graph) patches. Dotted vertical line aligns two graphs. Dotted boxes indicate inferred movement after scission. Time and intensity are rescaled in the average graph shown in Figure 5B.
Figure 5—figure supplement 2
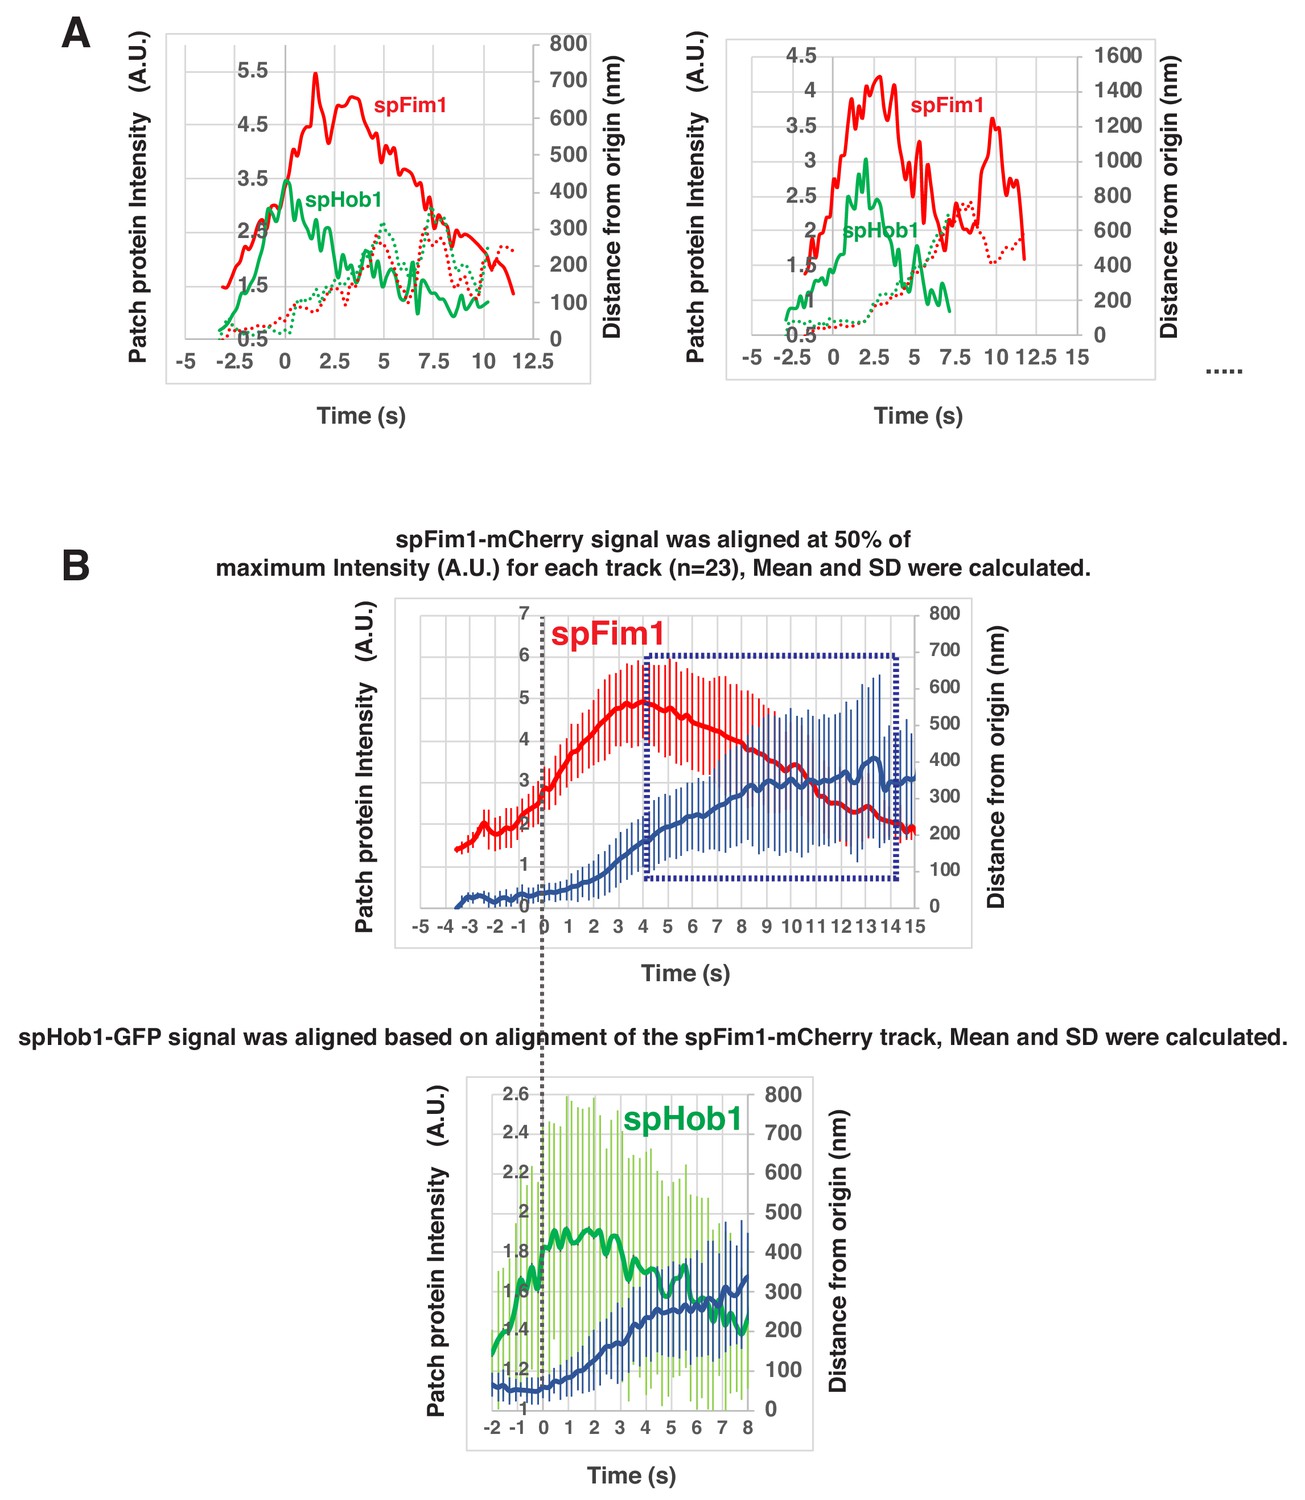
Alignment and quantification of average trajectories for spFim1-mCherry and spHob1-GFP in fission yeast.
(A) Alignment of intensity and displacement of spHob1-GFP and spFim1-mCherry for a single endocytic event. Two examples are presented. (B) Alignment of average intensity and displacement plots for spFim1-mCherry (upper graph) and spHob1-GFP (lower graph) patches. Dotted vertical line aligns two graphs. Dotted boxes indicate inferred movement after scission. Time and intensity are rescaled in the average graph shown in Figure 5D.
Figure 6 with 1 supplement
3D-STORM imaging of coat protein and the actin network at fission yeast endocytic sites.
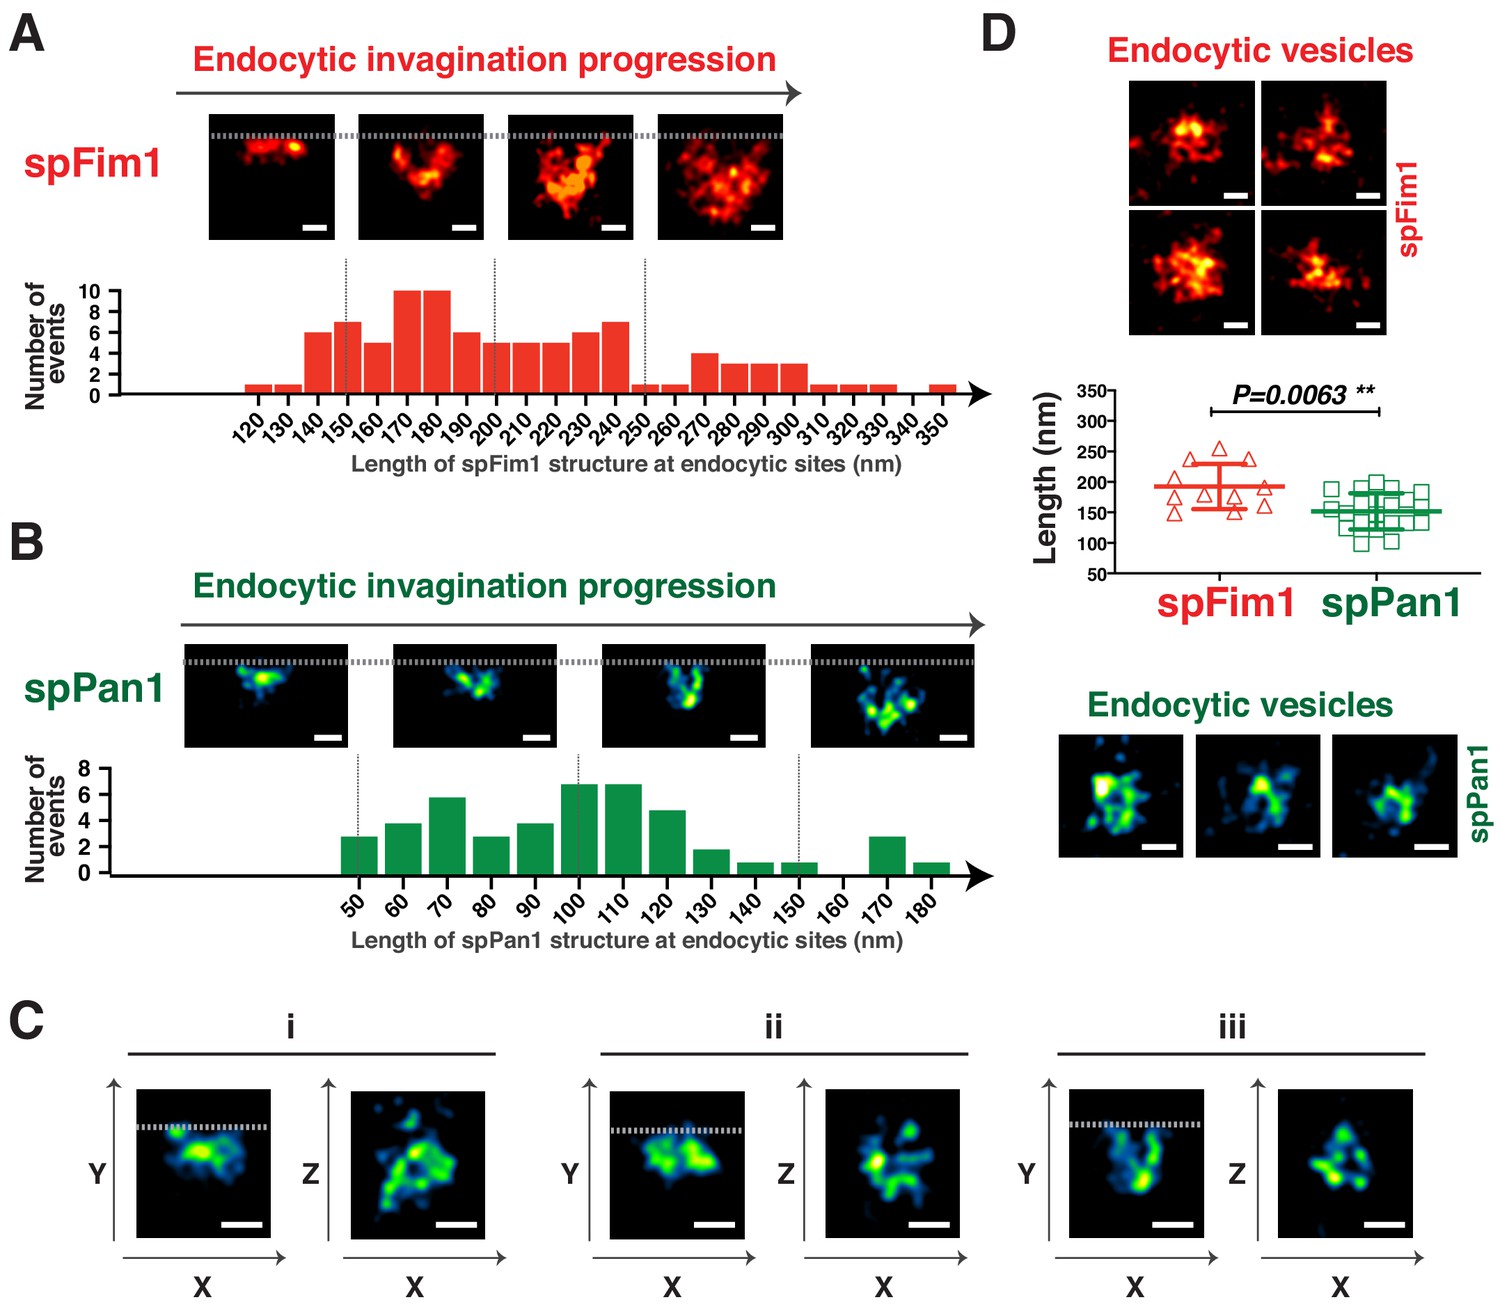
(A and B) The length of nanoscale structures of spFim1 (n = 92) or spPan1 (n = 46) at endocytic sites revealed by STORM analysis was measured and plotted. Representative STORM images of different length and quantitative analysis of spFim1 (A) and spPan1 (B). The histogram shows the frequency distribution of observed endocytic structure lengths. C, 3D-STORM image analysis reveals ring-like Pan1 organization in the XZ dimensions. D, Representative images of presumed endocytic vesicles in the cytoplasm. The length of longest axis of each presumed vesicle was measured and plotted. Fim1-labeled structures were pseudo-colored red hot (A and D) and Pan1-labeled structures were pseudo-colored green fire blue (B, C, D). The scale bars on STORM images are 100 nm.
Figure 6—figure supplement 1
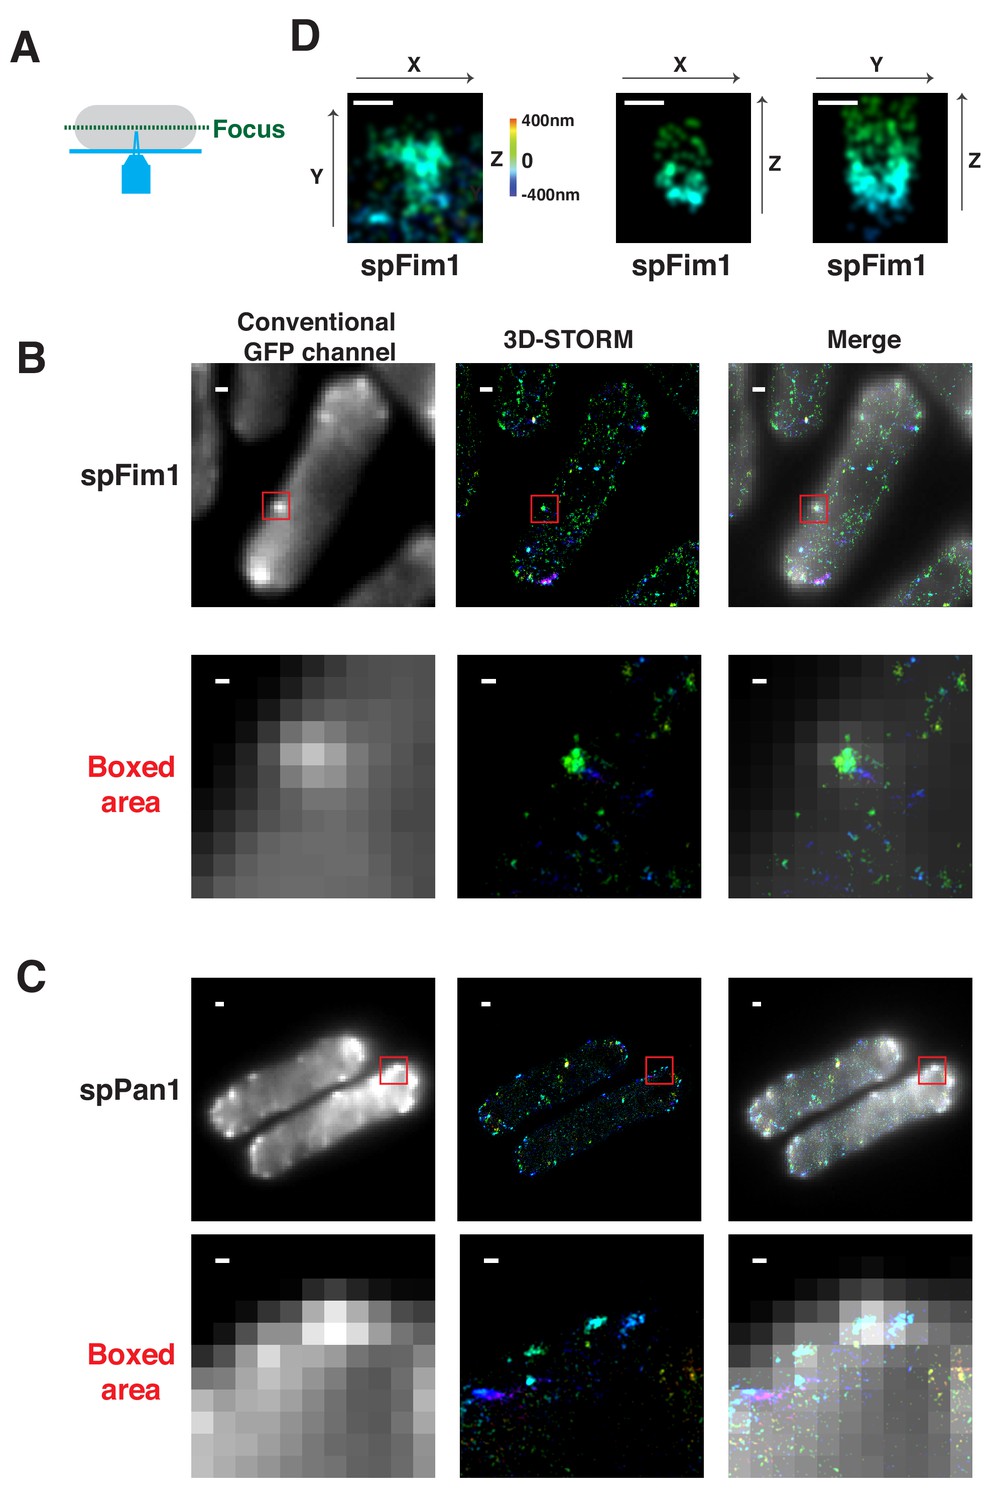
3D-STORM imaging of spFim1 and spPan1.
(A) Chemically fixed fission yeast cells expressing mEGFP-tagged proteins were labeled with AF647-conjugated anti-GFP nanobodies and imaged at the equatorial plane. (B) Conventional and 3D-STORM image for a fixed fission yeast cell expressing spFim1-mEGFP and labeled using AF647-conjugated anti-GFP nanobodies. (C) Conventional and 3D-STORM image of fixed fission yeast cell expressing spPan1-mEGFP and labeled using AF647-conjugated anti-GFP nanobodies. (D) 3D-STORM image of spFim1-mEGFP at an individual endocytic site. Images represent XY, XZ, or YZ dimensions. Note, the Z-axis information is represented by rainbow color. The scale bars on the images of whole cells are 1 µm. The other scale bars in the boxed areas and D are 100 nm.
Figure 7 with 3 supplements
Spatio-temporal relationship between two major NPFs and endocytic actin assembly in fission yeast.
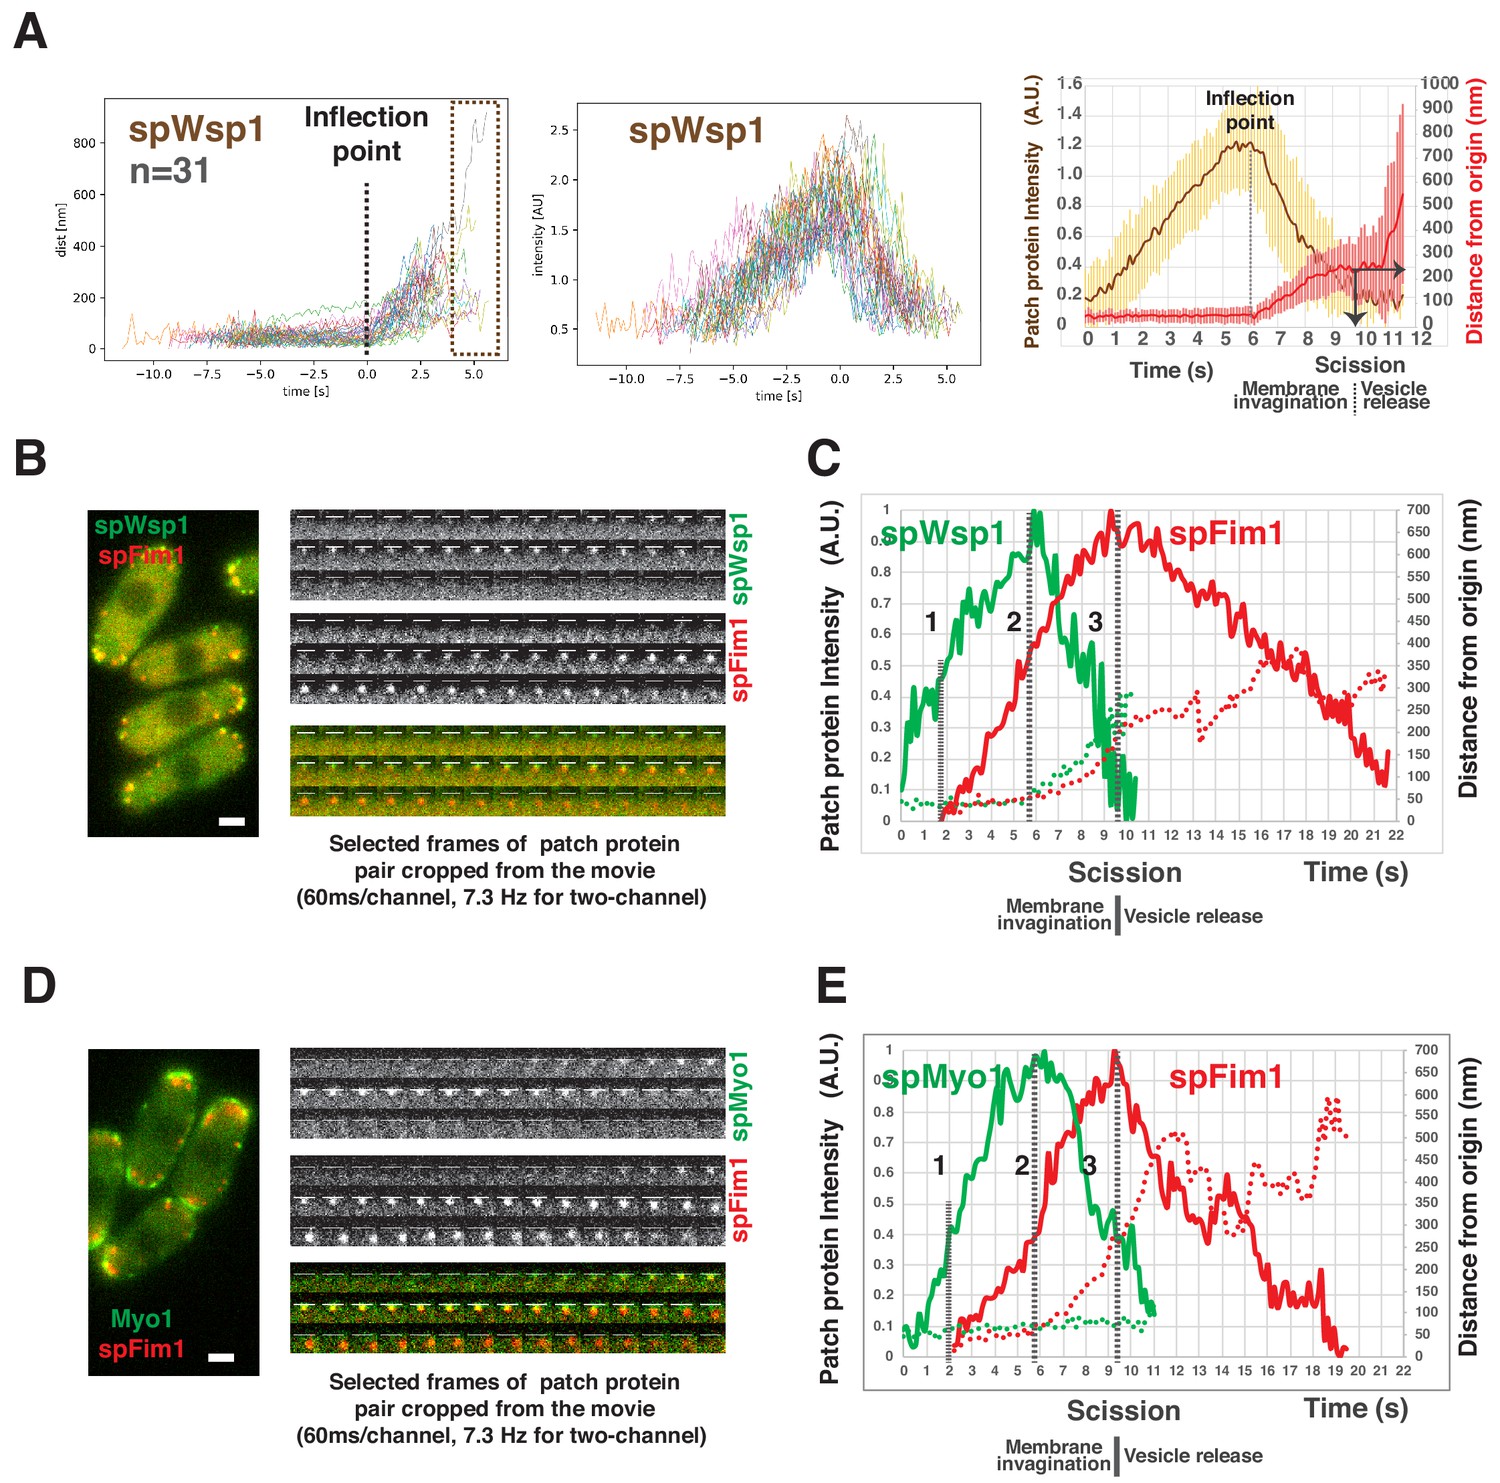
(A) Dynamics of spWsp1. Numerous endocytic events represented by mEGFP-spWsp1 were analyzed and aligned. Graphs from left to right: (right) Protein position vs time for endocytic events (n = 31) aligned at inflection points indicated by the dotted line. The boxed area represents movement after presumed scission event. (middle) Fluorescence intensity aligned on basis of alignment in right graph. (left) Averaged results from data in two graphs on the left. Note that time and intensity are rescaled in this graph. The dotted line indicates inflection point. Vertical solid line with arrow indicates the moment of scission predicted by the dramatic standard deviation increase. (B) Single frame from a movie of fission yeast expressing mEGFP-spWsp1 spFim1-mCherry (left panel). Time series showing composition of a single endocytic site (right panels). (C) Alignment of average intensity and displacement for mEGFP-spWsp1 and spFim1-mCherry patches (n = 8) (Figure 7—figure supplement 2 for details). Dotted line one indicates actin assembly initiation. Dotted line two indicates initiation of membrane invagination. Dotted line three indicates inferred scission. (D) Single frame from a movie of fission yeast expressing mEGFP-Myo1 and spFim1-mCherry (left panel). Time series showing composition of a single endocytic site (right panels). (E) Alignment of average intensity and displacement for mEGFP-spMyo1 and spFim1-mCherry patches (n = 9) (Figure 7—figure supplement 3 for details). Dotted line one indicates actin assembly initiation. Dotted line two indicates initiation of membrane invagination. Dotted line three indicates inferred scission. Scale bars are 2 µm.
Figure 7—figure supplement 1
Dynamics of GFP-scLas17 and scLas17-GFP in budding yeast.
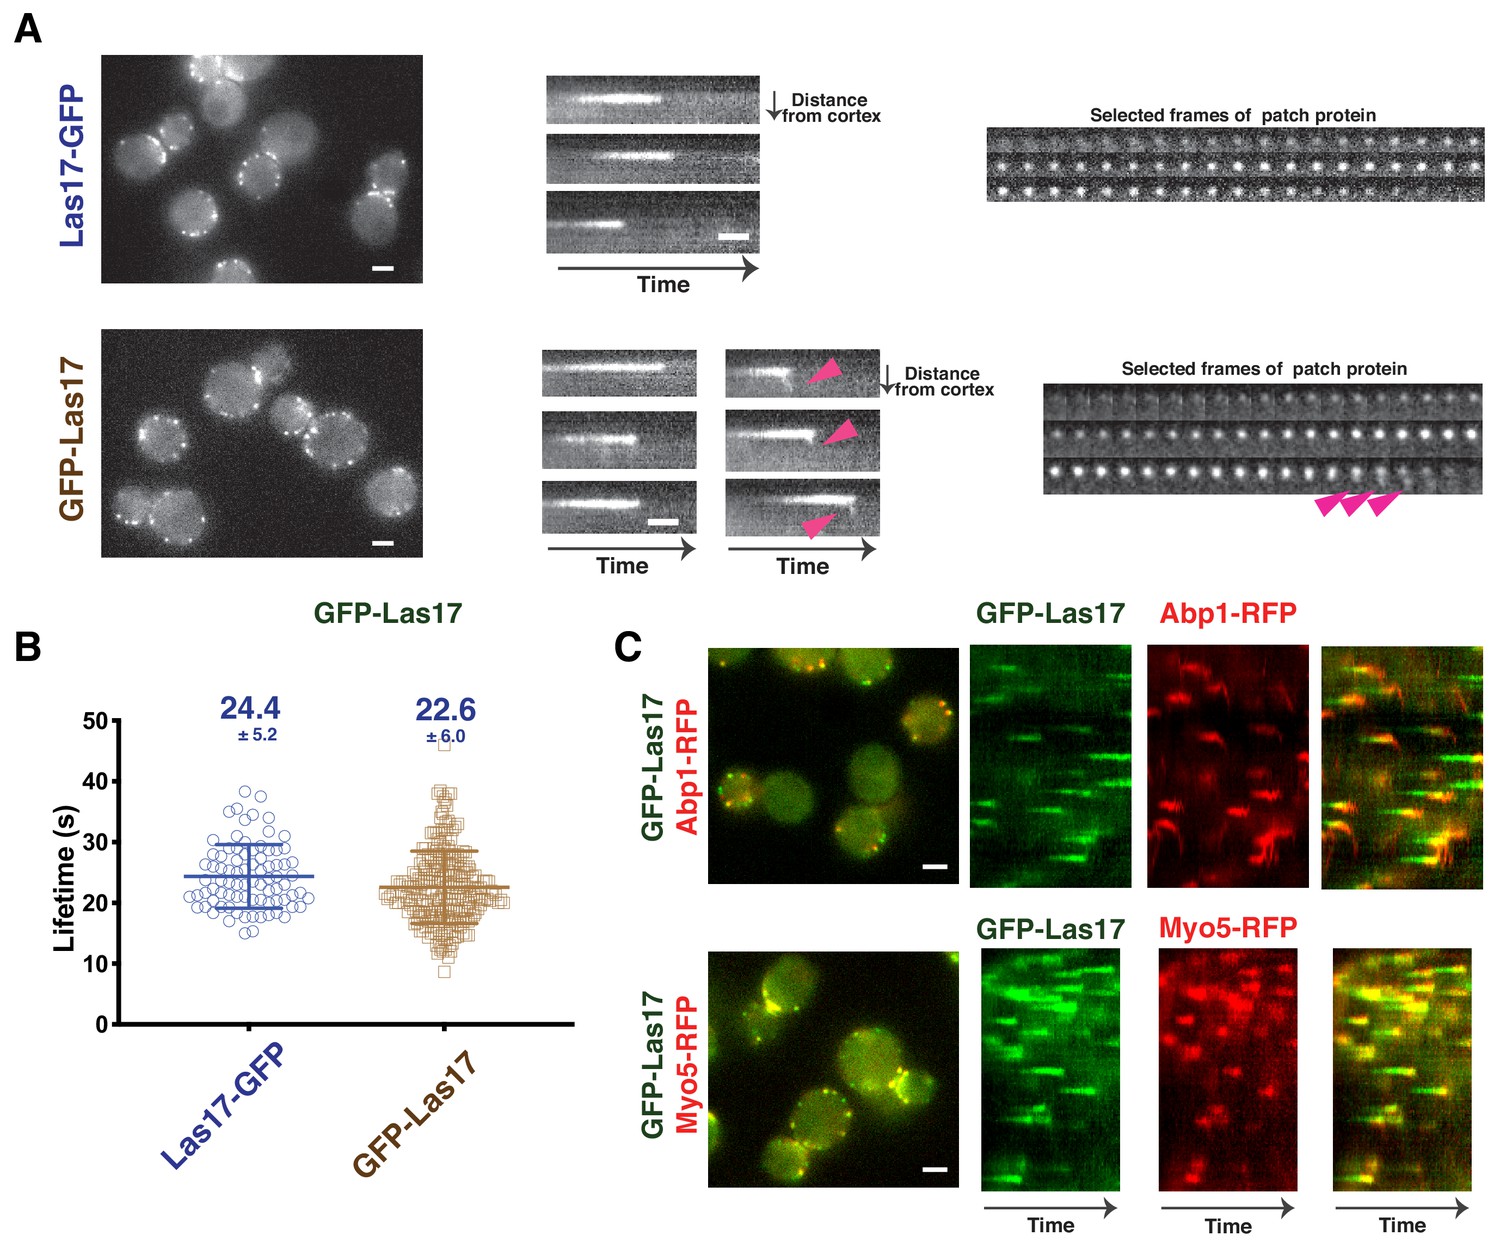
(A) Dynamics of scLas17-GFP and GFP-scLas17. Single frames (left) from movies, radial kymograph representations (Sun et al., 2017) (middle), and time series showing progression of a single endocytic event (right) for scLas17-GFP (upper panel) and GFP-scLas17 (lower panel). The arrowheads indicate that a small amount of GFP-scLas17 signal splits from the majority of the signal at the end of its lifetime. (B) Lifetimes of scLas17-GFP and GFP-scLas17 at endocytic sites. (C) Single frames (left) from movies and circumferential kymograph representations (Sun et al., 2017) of GFP-LAS17 ABP1-RFP cells (upper panel) and GFP-LAS17 MYO5-RFP cells (lower panel). Scale bars are 2 µm. Scale bars on kymograph are 10 s.
Figure 7—figure supplement 2
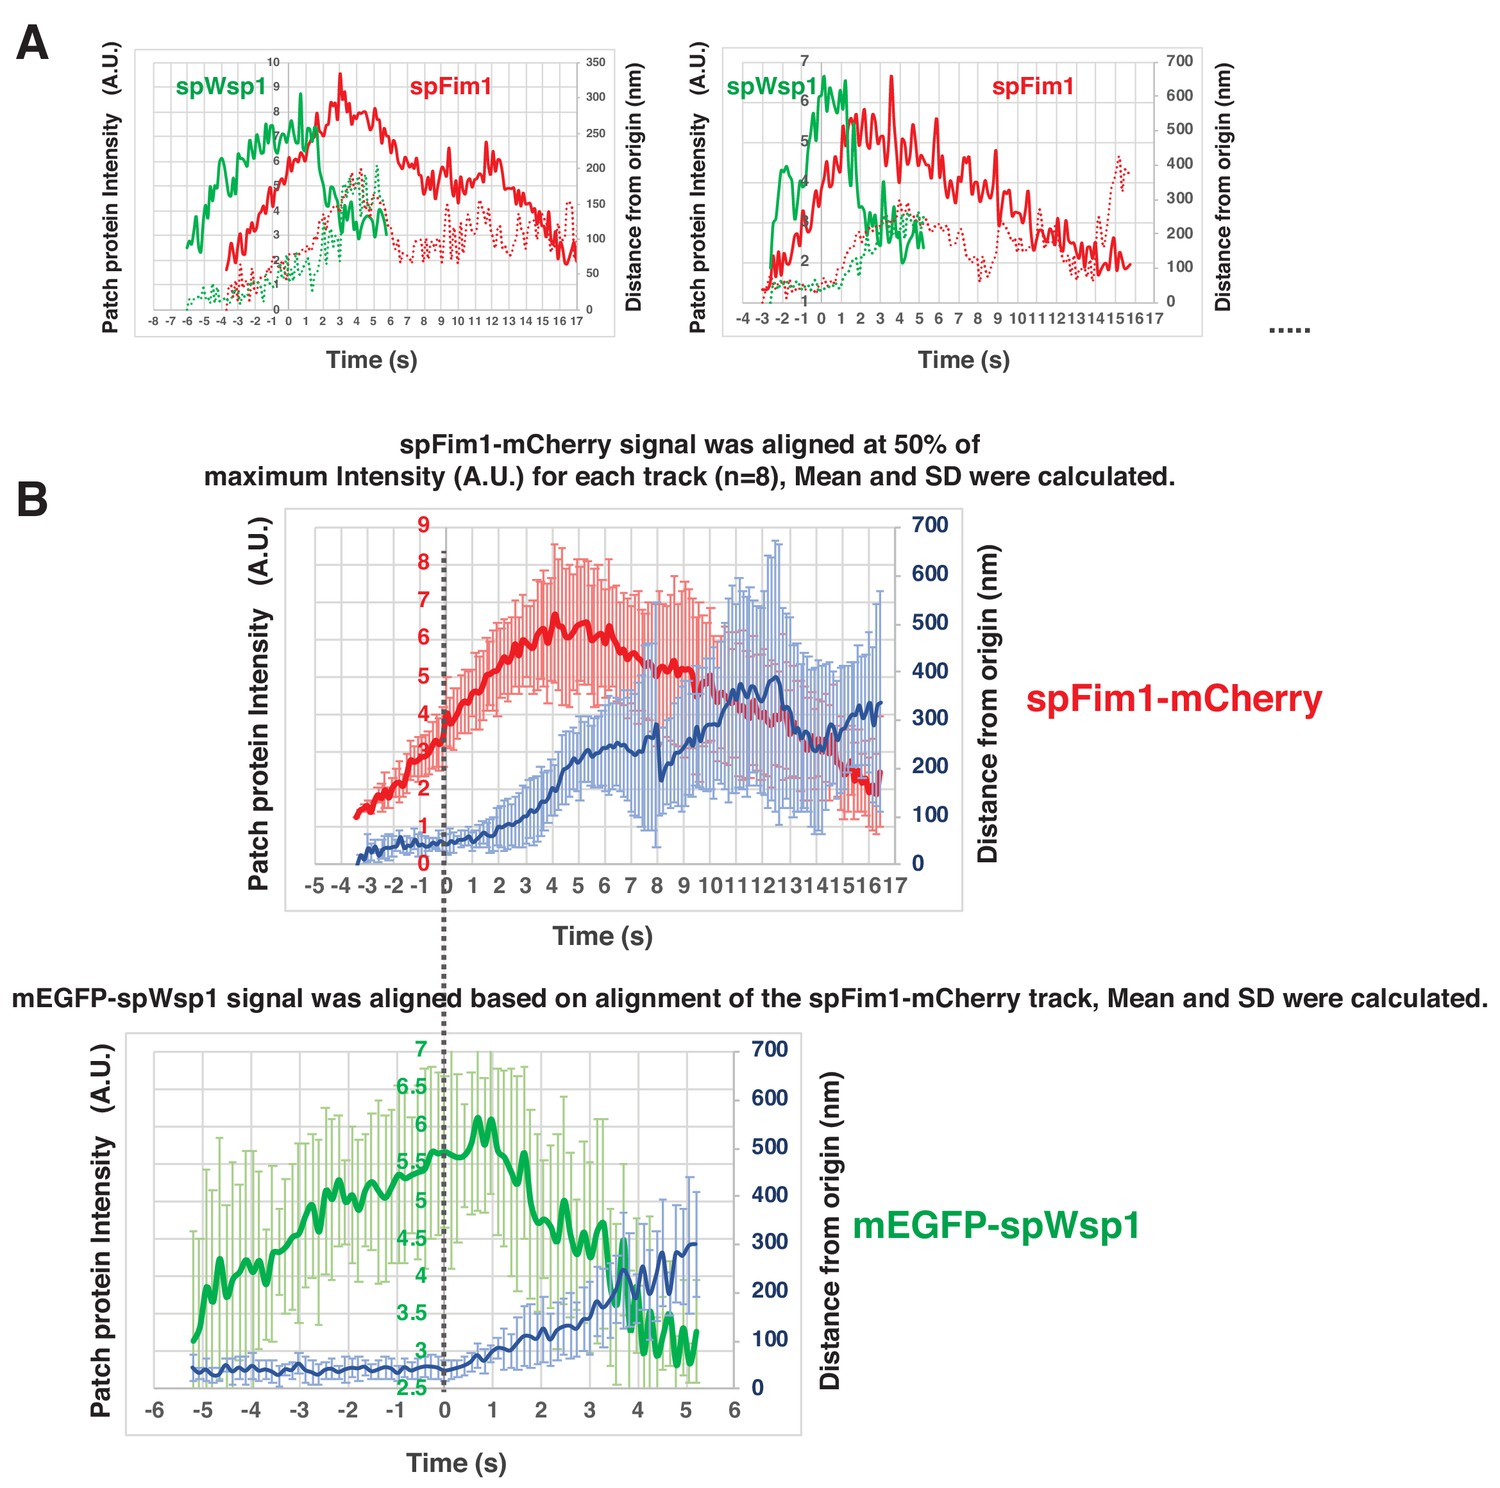
Alignment and quantification for average trajectories for spFim1-mCherry and mEGFP-spWsp1 in fission yeast.
(A) Alignment of intensity and displacement for mEGFP-spWsp1 and spFim1-mCherry for a single endocytic event. Two examples are presented. (B) Alignment of average intensity and displacement of mEGFP-spWsp1 and spFim1-mCherry patches. Time and intensity are rescaled in the average graph shown in Figure 7C.
Figure 7—figure supplement 3
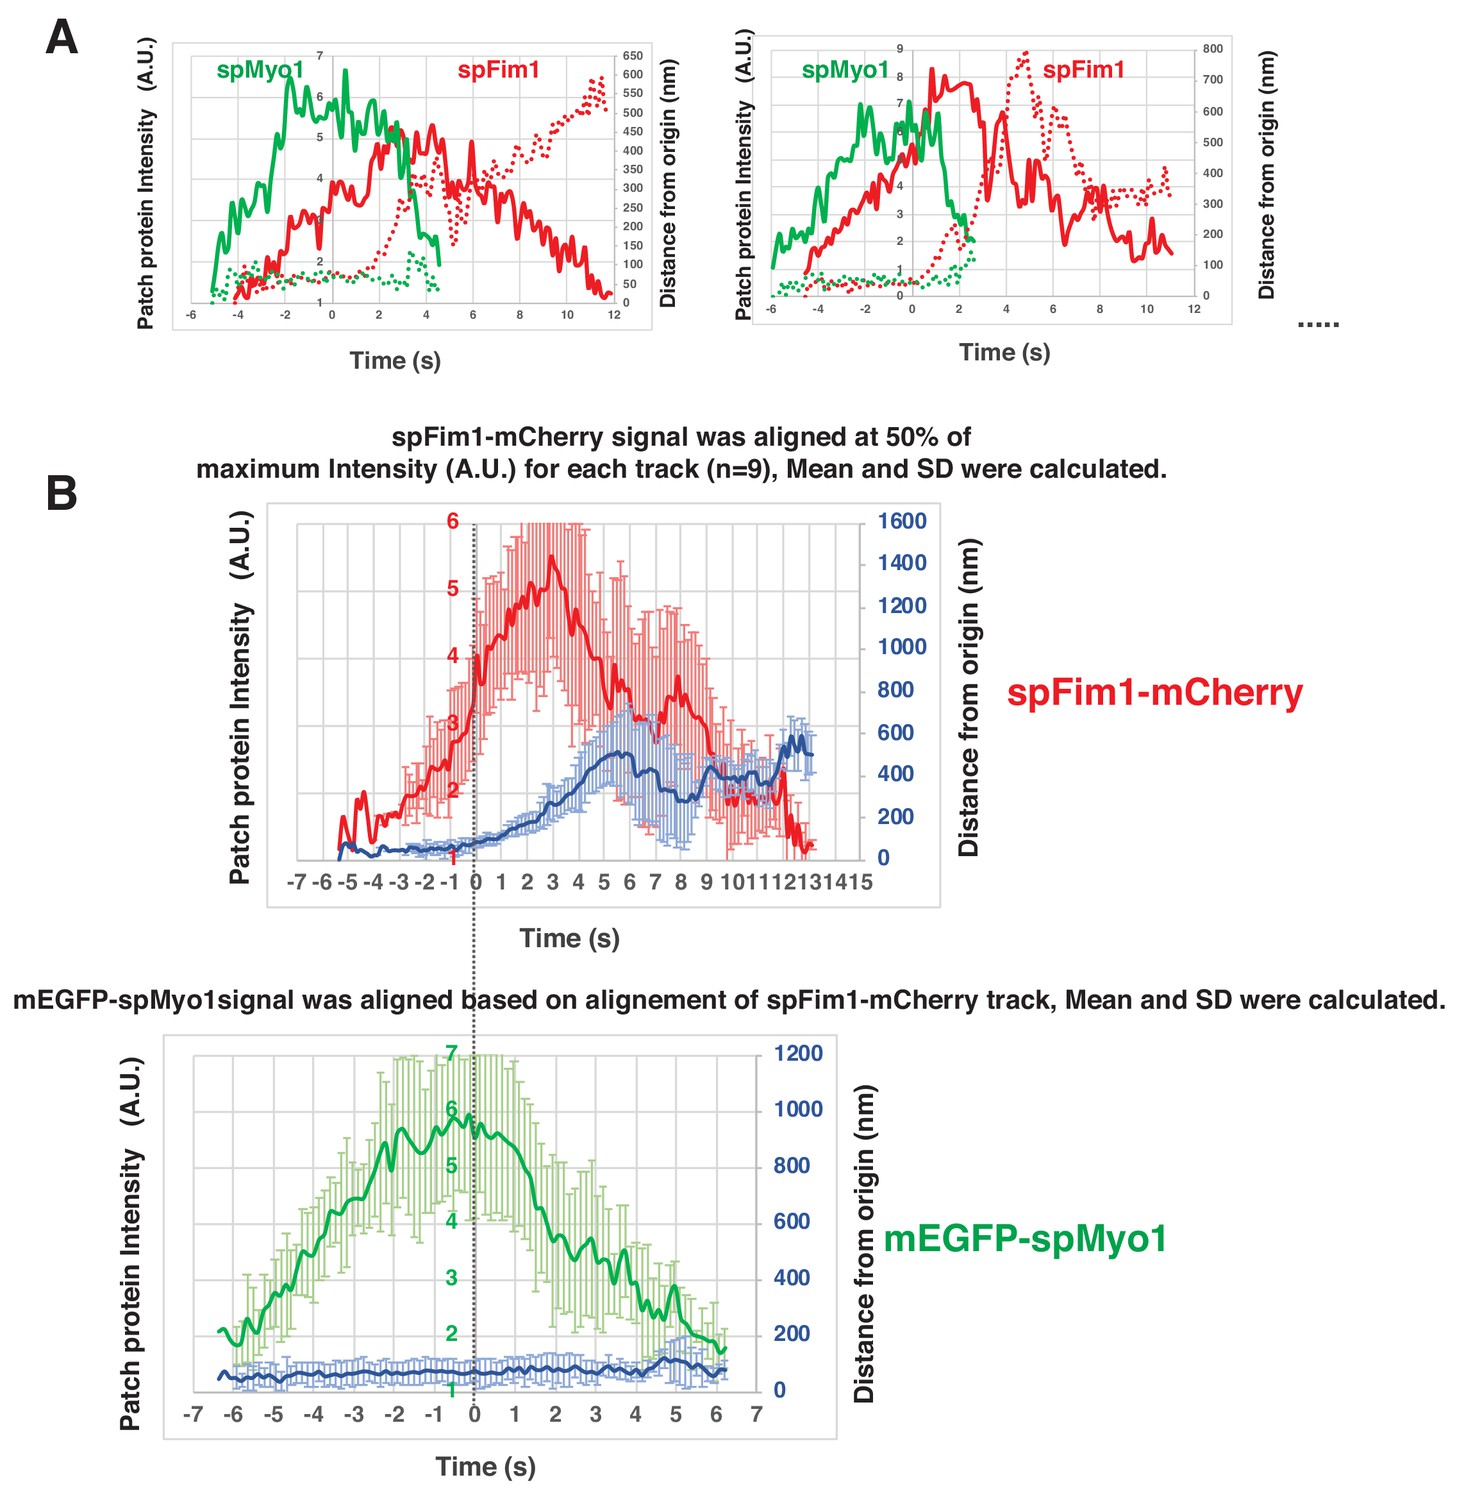
Alignment and quantification for average trajectories for spFim1-mCherry and mEGFP-spMyo1- in fission yeast.
(A) Alignment of intensity and displacement for mEGFP-spMyo1 and spFim1-mCherry for a single endocytic event. Two examples are presented. (B) Alignment of average intensity and displacement for mEGFP-spMyo1 and spFim1-mCherry patches. Time and intensity are rescaled in the average graph shown in Figure 7E.
Figure 8

Functional analysis of CA domains in two fission yeast nucleation promoting factors.
(A) Dynamics of spWsp1CA∆-GFP patches. Single frame from movie of cells expressing mEGFP-spWsp1 (left upper panel) or spWsp1-CA∆-GFP (left bottom panel). Alignment of average intensity and displacement for spWsp1-CA∆-GFP patches (n = 53) (right panel). Dotted line indicates 50% maximum fluorescence intensity. (B) Patch protein lifetimes for indicated proteins. (C and D) Endocytic internalization is severely impaired in spwsp1-CA∆ mutants. A single frame (upper left) and Maximum intensity projection of all frames (lower left) from a movie of cells expressing mEGFP-spWsp1 spFim1-mCherry (C) or spWsp1-CA∆-GFP spFim1-mCherry (D). The maximum intensity projections reveal extent of patch protein movement over time. Enlarged views of the boxed-areas shown in left panels are shown on right. E and F, Endocytic internalization appears unaffected by the spmyo1-CA∆ mutation. A single frame (upper left) and maximum intensity projection of all frames (lower left) from a movie of cells expressing mEGFP-spMyo1 spFim1-mCherry (E) or spMyo1-CA∆-GFP spFim1-mCherry (F). The maximum intensity projections reveal the extent of patch protein movement over time. Enlarged views of the boxed-areas shown in left panels are shown on the right. Scale bars are 2 µm.
Figure 9
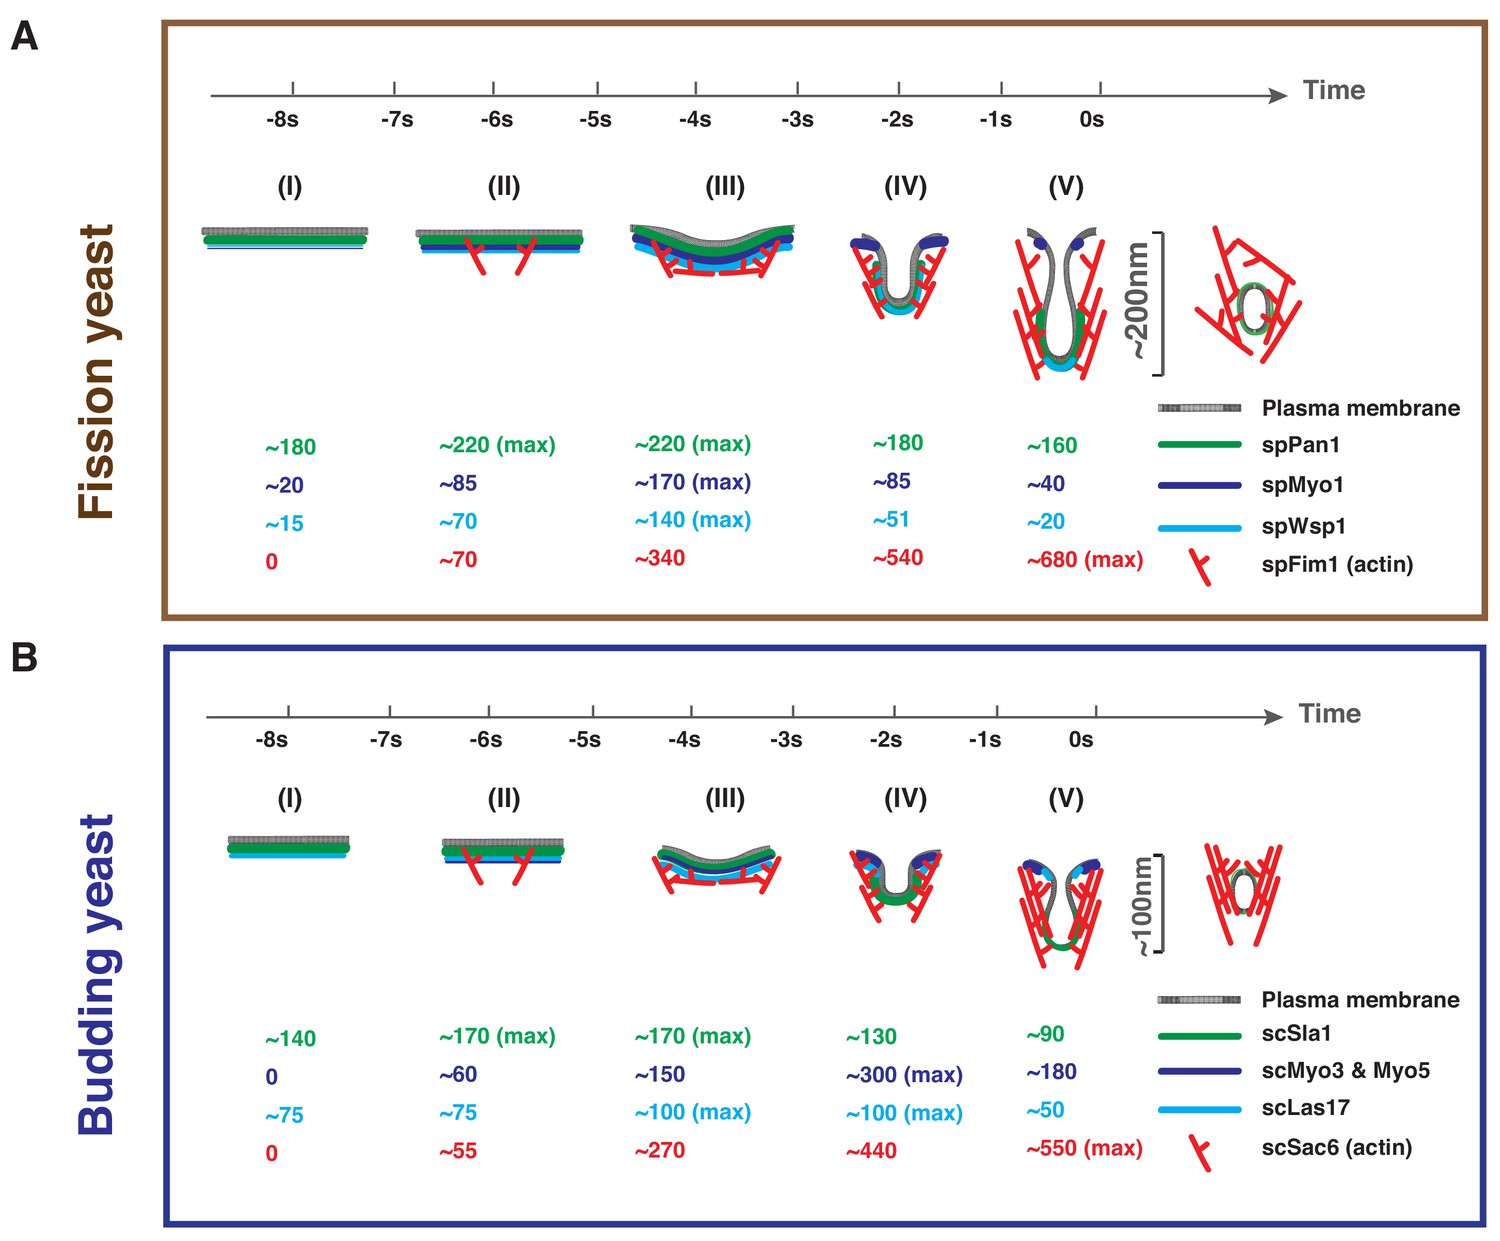
Comparison of endocytic vesicle formation in fission and budding yeast.
Timeline and summary of the average molecule numbers for indicated coat proteins and actin machinery components in fission (A) and budding yeast (B) endocytosis. Scission occurs at the time 0. Steps (I) through (V) represent the full process from membrane invagination initiation to vesicle scission. See text (last section in Discussion) for detailed key similarities and differences in fission yeast and budding yeast in terms of protein numbers, architecture and function of the endocytic coat and associated actin machinery.
Author response image 1
Author response image 2

Videos
Video 1
Dynamics of mEGFP-spWsp1 and spFim1-mCherry in mEGFP-spwsp1 spfim1-mCherry S. pombe cells.
Time to acquire one image pair was 136 ms. Interval between frames is 548 ms.
Video 2
Dynamics of spwsp1CA∆-GFP and spFim1-mCherry in spwsp1-CA∆-GFP spfim1-mCherry S. pombe cells.
Time to acquire one image pair was 400 ms. Interval between frames is 460 ms.
Video 3
Dynamics of mEGFP-spMyo1 and spFim1-mCherry in mEGFP-myo1 spfim1-mCherry S. pombe cells.
Time to acquire one image pair was 200 ms. Interval between frames is 222 ms.
Video 4
Dynamics of spMyo1CA∆-GFP and spFim1-mCherry in spmyo1CA∆-GFP spfim1-mCherry S. pombe cells.
Time to acquire one image pair was 200 ms. Interval between frames is 222 ms.
Tables
Table 1
Comparison of peak protein numbers in actin patches.
Calibration methods: Sirotkin, Arasada, Chen, Epstein, MacQuarrie: a range of internal standards tagged with YFP or GFP; Basu: comparison with actin patches in other cells marked with Arp2/3 complex subunit mYFP-arc5 assumed to be 330 molecules per patch from Sirotkin et al. (2010); Sun: External standard nanoparticle with 120 eGFPs; Galletta: internal Cse4 standard; Picco, Manenschijin: internal Nuf2 standard which was calibrated as a ratio with Cse4.
| Protein | S. pombe | S. cerevisiae | ||||||
|---|---|---|---|---|---|---|---|---|
| Sirotkin et al. (2010)a; Arasada and Pollard (2011)b; Chen and Pollard (2013)c; Epstein et al. (2018)d | Basu and Chang (2011) | MacQuarrie et al. (2019) | Sun This study | Sun This study | Picco et al. (2015) Rvs167 125 | Manenschijn et al. (2019) | Galletta et al. (2012) | |
| Actin | 7500 a; 4050 b | 3563 | ||||||
| Arp2/3 complex subunits | 320, 320, 320 a | ~150 | 304 (302) | 294 | 210 | 247 | 300 | |
| WASp/Las17 | 230 a; 140 b; 135 c | 125 | ~150 | 138 | 102 | 46 | ||
| WIP/Vrp1 | 140 a | 95 | 78 | |||||
| Myosin-I/ Myo3, Myo5 | 400 a; 170 b; 240 c | ~350 | 170 | Myo5: 200 Myo3: 100 | Myo5: 132 | Myo5: ~130 Myo3: ~60 | ||
| Fimbrin/Sac6 | 910 a; 800 c; 1000, 1600 d | 675 | 545 | 455 | ||||
| End4/Sla2 (HIP1R) | 160 a; 70 c | 124 | 133 | 37, 47 | ~40 | |||
| Pan1/End3 (Intersectin) | Pan1: 260a; 160 c | Pan1: 219 | Pan1: 131 End3: 100 | End3: 60 | ||||
| Sla1 | 168 | 91 | ~90 | |||||
| ABP1 | 800 | 423 | 515 | 810 | ||||
| Clathrin HC | 40 a | |||||||
| Clathrin LC | 40, 30 a | ~40 | ||||||
| Capping protein | 230 a | 197 | 200 | |||||
| App1 | 150 a | |||||||
| Coronin | 490 a; 320 b | |||||||
| Twinfillin | 210 a | |||||||
| F-BAR Cdc15 | 125 b | ~70 | ||||||
| F-BAR Bzz1 | 90 b | |||||||
| Dip1 | 20 | |||||||
| Bbc1 | ~50 | |||||||
| Amphiphysin | Rvs167 125 | |||||||
Table 2
The ratio of peak fluorescence intensities between various fluorescently tagged proteins.
| GFP-tagged protein pair | The ratio of peak fluorescence intensities |
|---|---|
| spPan1: scSla1 | 1.30: 1 |
| spPan1: scPan1 | 1.67: 1 |
| scEnd3: spPan1 | 0.46: 1 |
| scSla2: scLas17 | 1.30: 1 |
| spEnd4: scSla2 | 0.93: 1 |
| spWsp: scLas17 | 1.40: 1 |
| scVrp1: scSla1 | 0.47: 1 |
| spVrp1: scVrp1 | 1.23: 1 |
| scMyo3: scMyo5 | 0.51: 1 |
| spMyo1: scMyo3 and scMyo5 | 0.57: 1 |
| spArc5: scSla1 | 1.80: 1 |
| spArc5: scArc15 | 1.03: 1 |
| spArc3: scArc15 | 1.03: 1 |
| scAbp1: scSla1 | 4.80: 1 |
| spFim1: scAbp1 | 0.84: 1 |
| spFim1: scSac6 | 1.24: 1 |
Table 3
Peak molecules per patch vs total molecules per cell for various endocytic proteins in budding and fission yeast.
| A. Peak molecules per patch vs total molecules per cell in budding yeast | |||
|---|---|---|---|
| S. cerevisiae Protein | Total molecules per cell | Peak molecules per patch | Ratio |
| Ho et al. (2018) | Sun (This study) | ||
| Arp2/3 complex subunits | 12,784, | 294 | 0.023 |
| WASp/Las17 | 3134 | 102 | 0.033 |
| WIP/Vrp1 | 3559 | 78 | 0.021 |
| Myosin-I/ Myo3 and Myo5 | Myo5, 6051 Myo3, 4222 | Myo5:200 Myo3:100 | 0.033 0.024 |
| Fimbrin/Sac6 | 24,543 | 545 | 0.022 |
| HIP1R/Sla2 | 8879 | 133 | 0.015 |
| Intersectin /Pan1 and End3 | Pan1:9830 End3:6064 | Pan1: 131 End3:100 | 0.013 0.016 |
| Sla1 | 8776 | 91 | 0.010 |
| Abp1 | 18,301 | 800 | 0.044 |
| B. Peak molecules per patch vs total molecules per cell in fission yeast | |||
| S. pombe Protein | Total molecules per cell | Peak molecules per patch | Ratio |
| Sirotkin et al., 2010; Wu and Pollard, 2005 | Sun (This study) | ||
| Arp2/3 complex subunits | ~40,000 | 304 (302) | 0.008 |
| WASp/Wsp1 | 68,000 | 138 | 0.002 |
| WIP/Vrp1 | 19,000 | 95 | 0.005 |
| Myosin-I | 63,000 | 170 | 0.003 |
| Fimbrin/Fim1 | 87,000 | 675 | 0.008 |
| HIP1R/End4 | 22,000 | 124 | 0.006 |
| Intersectin/Pan1 | 27,000 | 219 | 0.008 |
Table 4
Strains used in this study.
| DDY2733* | MATa his3-∆200 leu2-3, 112 lys2-801 ura3-52 ABP1-GFP::HIS3 |
| DDY2734* | MATa his3-∆200 leu2-3, 112 lys2-801 ura3-52 SLA1-GFP::HIS3 |
| DDY2735* | MATα his3-∆200 leu2-3, 112 lys2-801 ura3-52 PAN1-GFP::HIS3 |
| DDY2795* | MATa his3-∆200 leu2-3, 112 lys2-801 ura3-52 SLA2-GFP::HIS3 |
| DDY2736* | MATa his3-∆200 leu2-3, 112 lys2-801 ura3-52 LAS17-GFP::HIS3 |
| DDY3201* | MATa his3-∆200 leu2-3, 112 lys2-801 ura3-52 VRP1-GFP::HIS3 |
| DDY2752* | MATα his3-∆200 leu2-3, 112 lys2-801 ura3-52 ARC15-GFP::HIS3 |
| DDY2960* | MATα his3-∆200 leu2-3, 112 lys2-801 ura3-52 SAC6-GFP::HIS3 |
| YSY4303 | MATα his3-∆200 leu2-3, 112 lys2-801 ura3-52 LAS17-sfGFP::HIS3 |
| YSY4305 | MATα his3-∆200 leu2-3, 112 lys2-801 ura3-52 MYO5-sfGFP::HIS3 |
| YSY4307 | MATα his3-∆200 leu2-3, 112 lys2-801 ura3-52 SLA1-sfGFP::HIS3 |
| YSY4315 | MATα his3-∆200 leu2-3, 112 lys2-801 ura3-52 CSE4-sfGFP::HIS3 |
| YSY4218 | MATα his3-∆200 leu2-3, 112 lys2-801 ura3-52 MYO3-GFP::HIS3 |
| YSY4299 | MAT a his3-∆200 leu2-3, 112 lys2-801 ura3-52 MYO3-GFP::HIS, ABP1-RFP::HygMX |
| YSY4300 | MAT α his3-∆200 leu2-3, 112 lys2-801 ura3-52 MYO5-GFP::HIS, ABP1-RFP::HygMX |
| YSY4125 | MAT a his3-∆200 leu2-3, 112 lys2-801 ura3-52 GFP-LAS17::KanMX6, ABP1-RFP::HygMX |
| YSY4126 | MAT α his3-∆200 leu2-3, 112 lys2-801 ura3-52 GFP-LAS17::KanMX6, MYO5-RFP::HIS |
| YSY4291 | MAT α his3-∆200 leu2-3, 112 lys2-801 ura3-52 Myo5-GFP::KanMX6, MYO3-GFP::HIS |
| YSY4120 | MAT α his3-∆200 leu2-3, 112 lys2-801 ura3-52 GFP-LAS17::KanMX6 |
| YSY4257 | h+ leu1-32 ura4-D18 his3-D1 ade6-M210 pan1-mEGFP-kanMX6 fim1mcherry-natRMX6 |
| YSY4266 | h- or h+ leu1-32 ura4-D18 his3-D1 ade6 kanMX6- Pwsp1-mEGFP-wsp1 fim1mcherry-natRMX6 |
| YSY4269 | h- or h+ leu1-32 ura4-D18 his3-D1 ade6 kanMX6- Pmyo1-mEGFP-myo1 fim1mcherry-natRMX6 |
| YSY4335 | h+ leu1-32 ura4-D18 his3-D1 ade6-M210 fim1mcherry-natRMX6 wsp1-CA∆-GFP-kanMX6 |
| YSY4345 | h- or h+ leu1-32 ura4-D18 his3-D1 ade6-M210 myo1-ca∆-GFP-kanMX6 fim1-mcherry-natRMX6 |
| YSY4346 | h- leu1-32 ura4-D18 his3-D1 ade6-M210 fim1mcherry-natRMX6, hob1-GFP-kanMX6 |
| YSY4346 | h+ leu1-32 ura4-D18 his3-D1 ade6-M210 hob1-GFP-kanMX6 |
| TP401** | h+ leu1-32 ura4-D18 his3-D1 ade6-M210 pan1-mEGFP-kanMX6 |
| TP398** | h+ leu1-32 ura4-D18 his3-D1 ade6-M210 end4-mEGFP-kanMX6 |
| TP203** | h- leu1-32 ura4-D18 his3-D1 ade6-M210 kanMX6- Pwsp1-mEGFP-wsp1 |
| TP186** | h- or h+ leu1-32 ura4-D18 his3-D1 ade6-M210 vrp1-EGFP-kanMX6 |
| TP198** | h- leu1-32 ura4-D18 his3-D1 ade6-M210 kanMX6-myo1-mEGFP |
| TP226** | h- leu1-32 ura4-D18 his3-D1 ade6-M210 arpc5-mEGFP-kanMX6 |
| TP347** | h- leu1-32 ura4-D18 ade6-M210 fim1-mEGFP-kanMX |
| * | from Kaksonen et al. (2003) or Sun et al. (2006) |
| ** | from Sirotkin et al. (2005) or Wu and Pollard (2005) |
| otherwise | This study |
Additional files
Download links
A two-part list of links to download the article, or parts of the article, in various formats.
Downloads (link to download the article as PDF)
Open citations (links to open the citations from this article in various online reference manager services)
Cite this article (links to download the citations from this article in formats compatible with various reference manager tools)
Direct comparison of clathrin-mediated endocytosis in budding and fission yeast reveals conserved and evolvable features
eLife 8:e50749.
https://doi.org/10.7554/eLife.50749


