Direct binding of phosphatidylglycerol at specific sites modulates desensitization of a ligand-gated ion channel
- Washington University, United States
- Weill Cornell Medical College, United States
- Rutgers University, United States
Figures
Figure 1 with 4 supplements
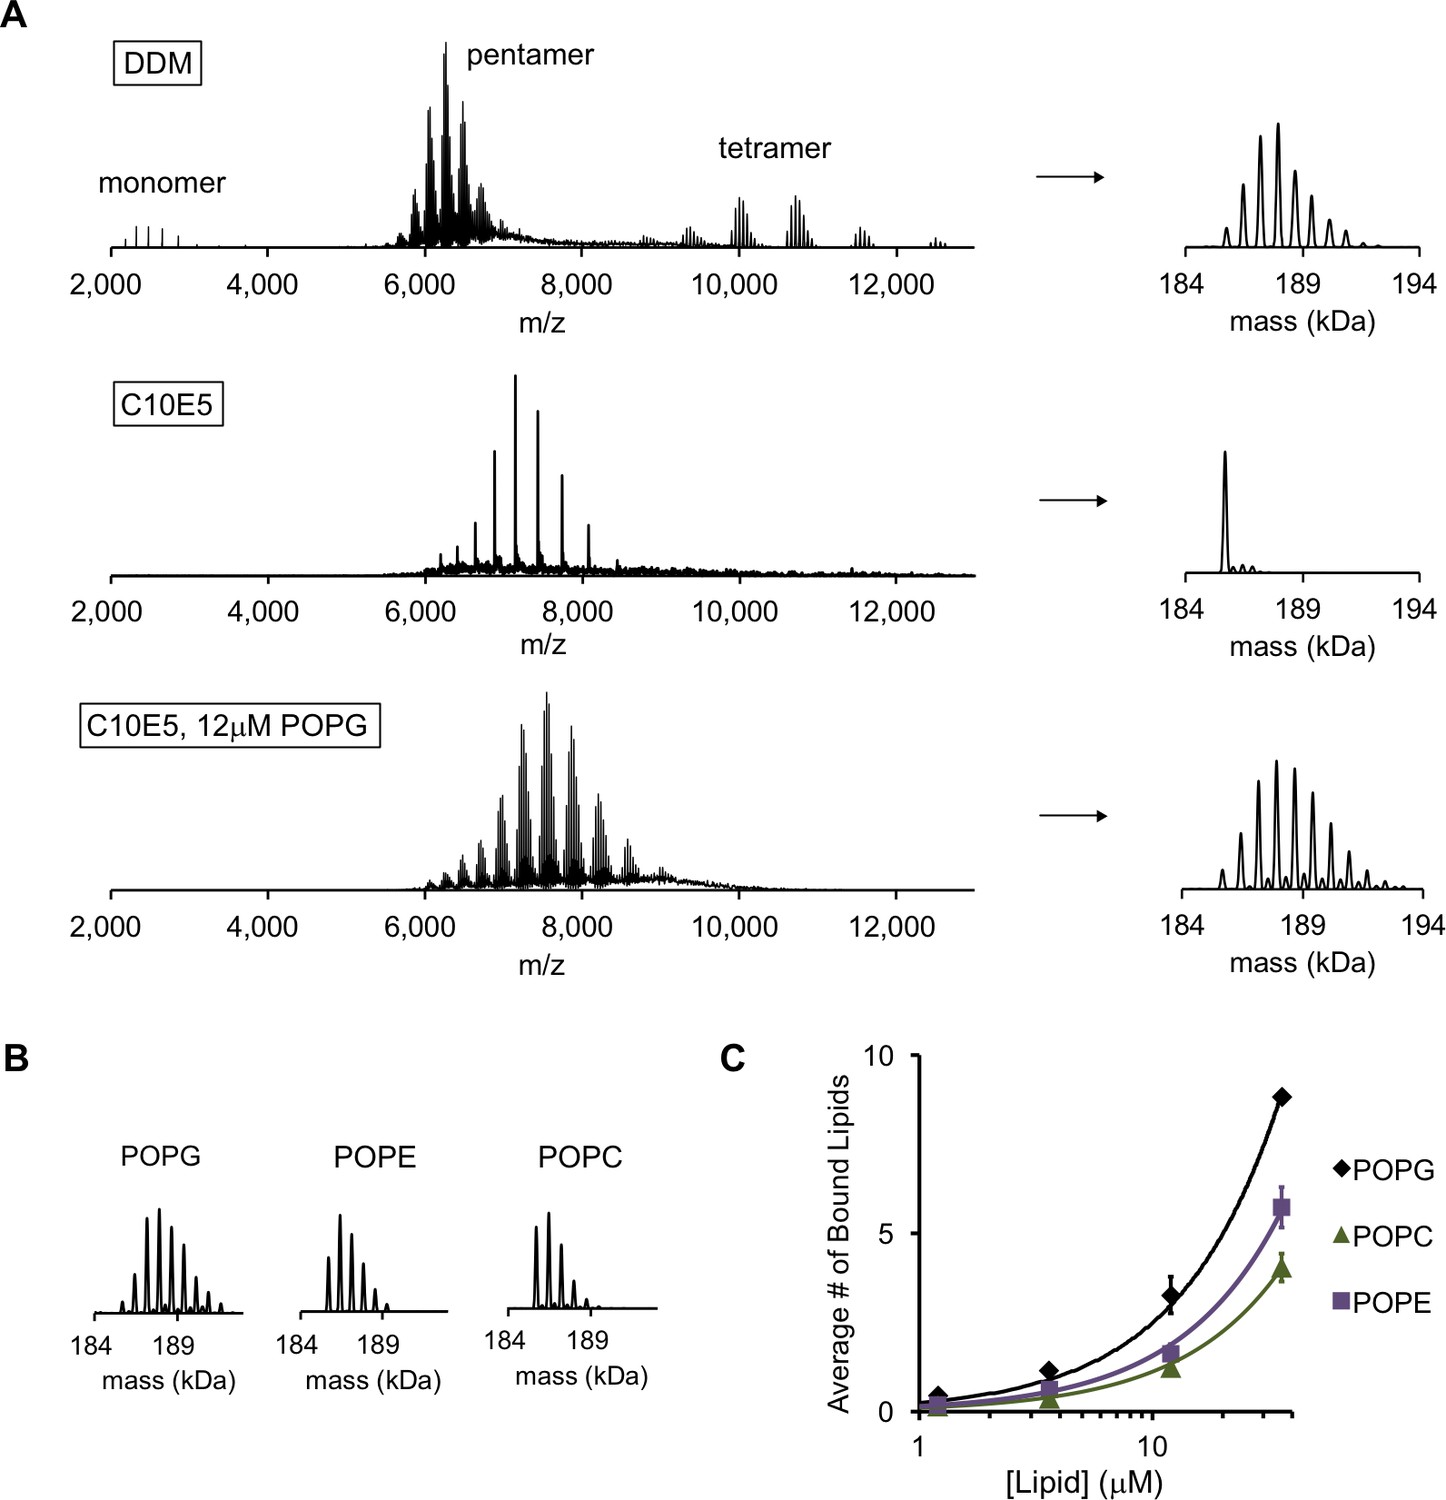
POPG binds selectively to ELIC.
(A) Native MS spectra of ELIC in DDM, C10E5, and C10E5 with 12 μM POPG. Left: full spectra; right: deconvoluted spectra. (B) Deconvoluted spectra of ELIC in 12 μM of the indicated phospholipid. (C) Plot of the average number of bound phospholipids per pentamer at varying concentrations of POPG, POPE, and POPC (n = 3–6, ± SD).
Figure 1—figure supplement 1
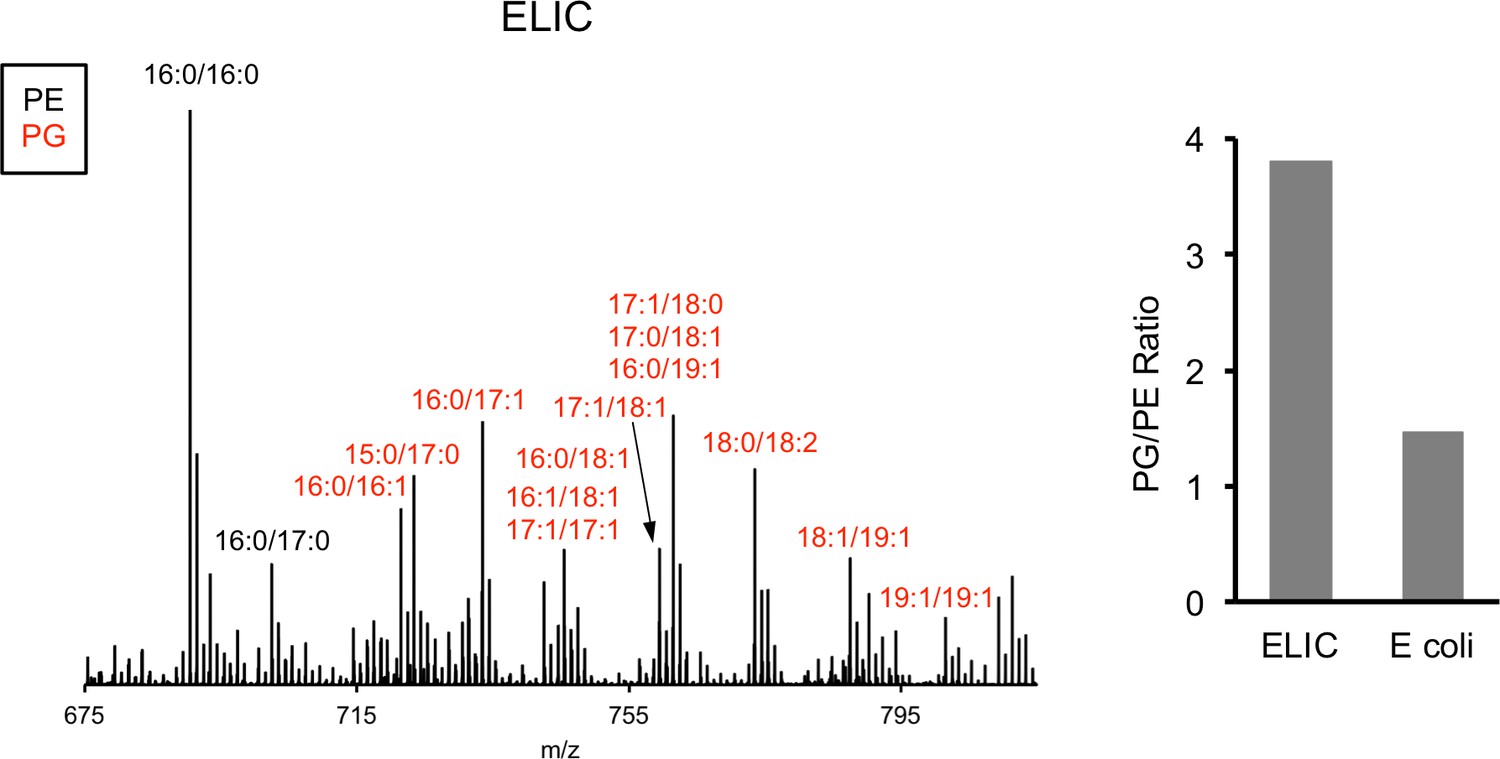
MS1 spectra of lipid extract from purified ELIC in DDM and E. coli membranes.
Labeled peaks correspond to PG (red) and PE (black) phospholipids with specific acyl chain combinations determined from MS2 fragmentation. Right: Graph shows quantification of the intensity of all PG species relative to PE species for ELIC and E. coli membrane samples.
Figure 1—figure supplement 2
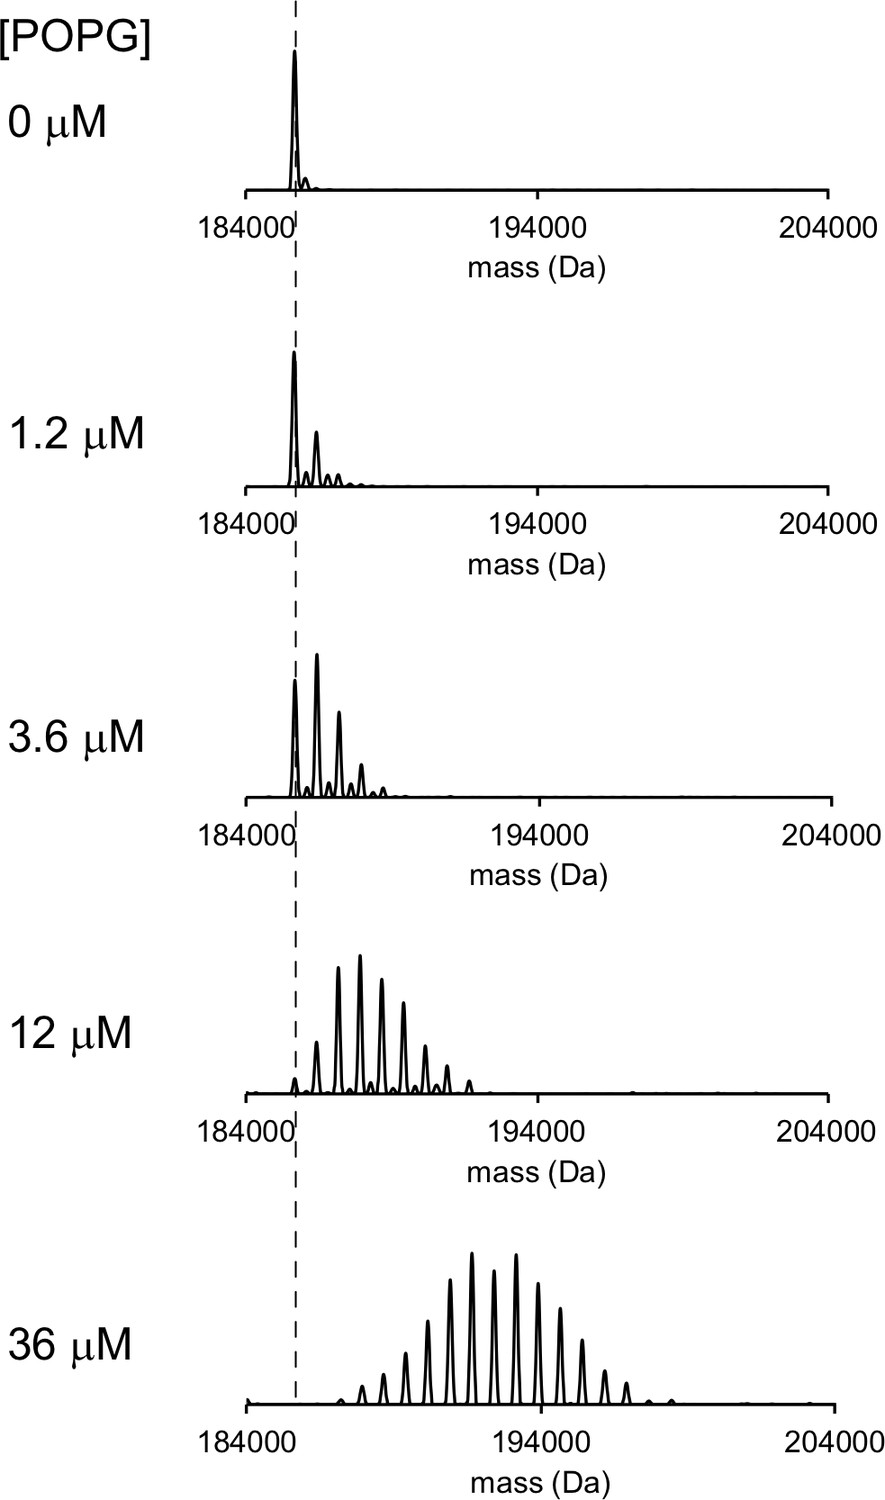
Representative deconvoluted spectra of 1 μM ELIC in C10E5 with increasing concentration of POPG.
Dashed line indicates mass of apo ELIC.
Figure 1—figure supplement 3
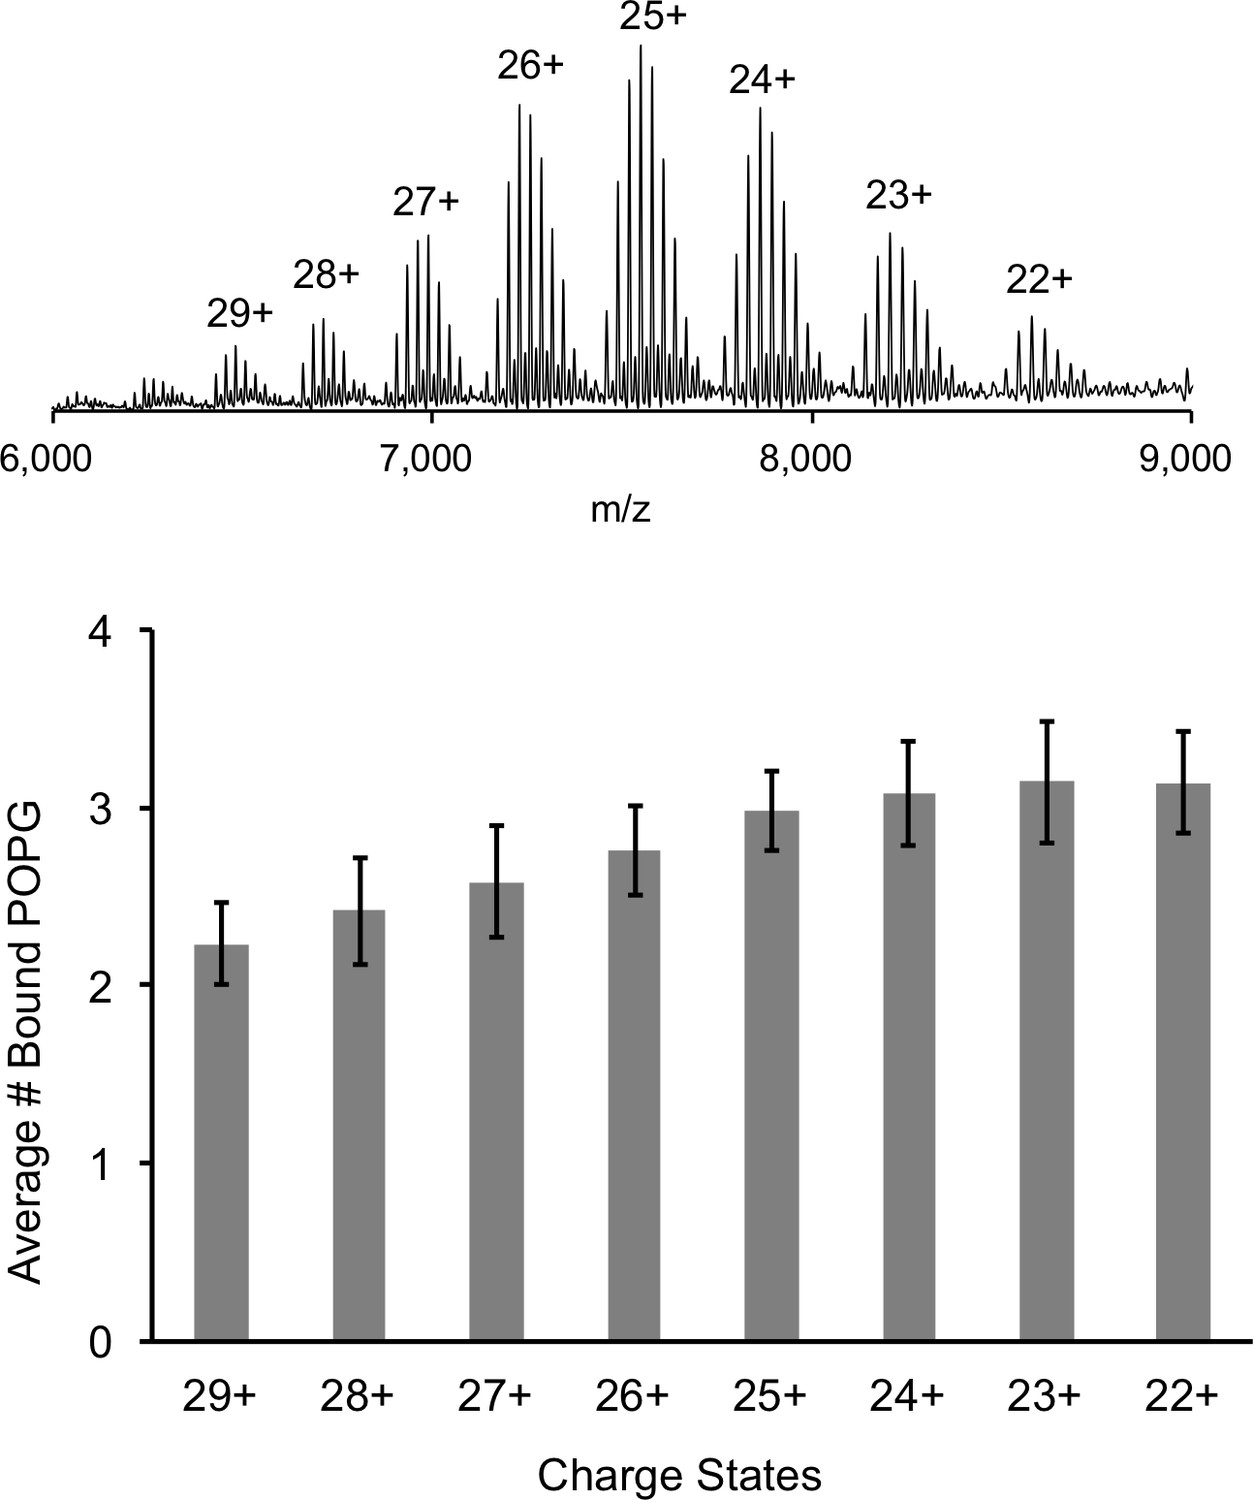
Comparison of lipid binding at different charge states.
Top: Representative full native spectrum of the ELIC pentamer with 12 μM POPG with each charge state labeled. Bottom: Quantification of the average number of bound POPG to the ELIC pentamer at each charge state (n = 13, ± SD).
Figure 1—figure supplement 4
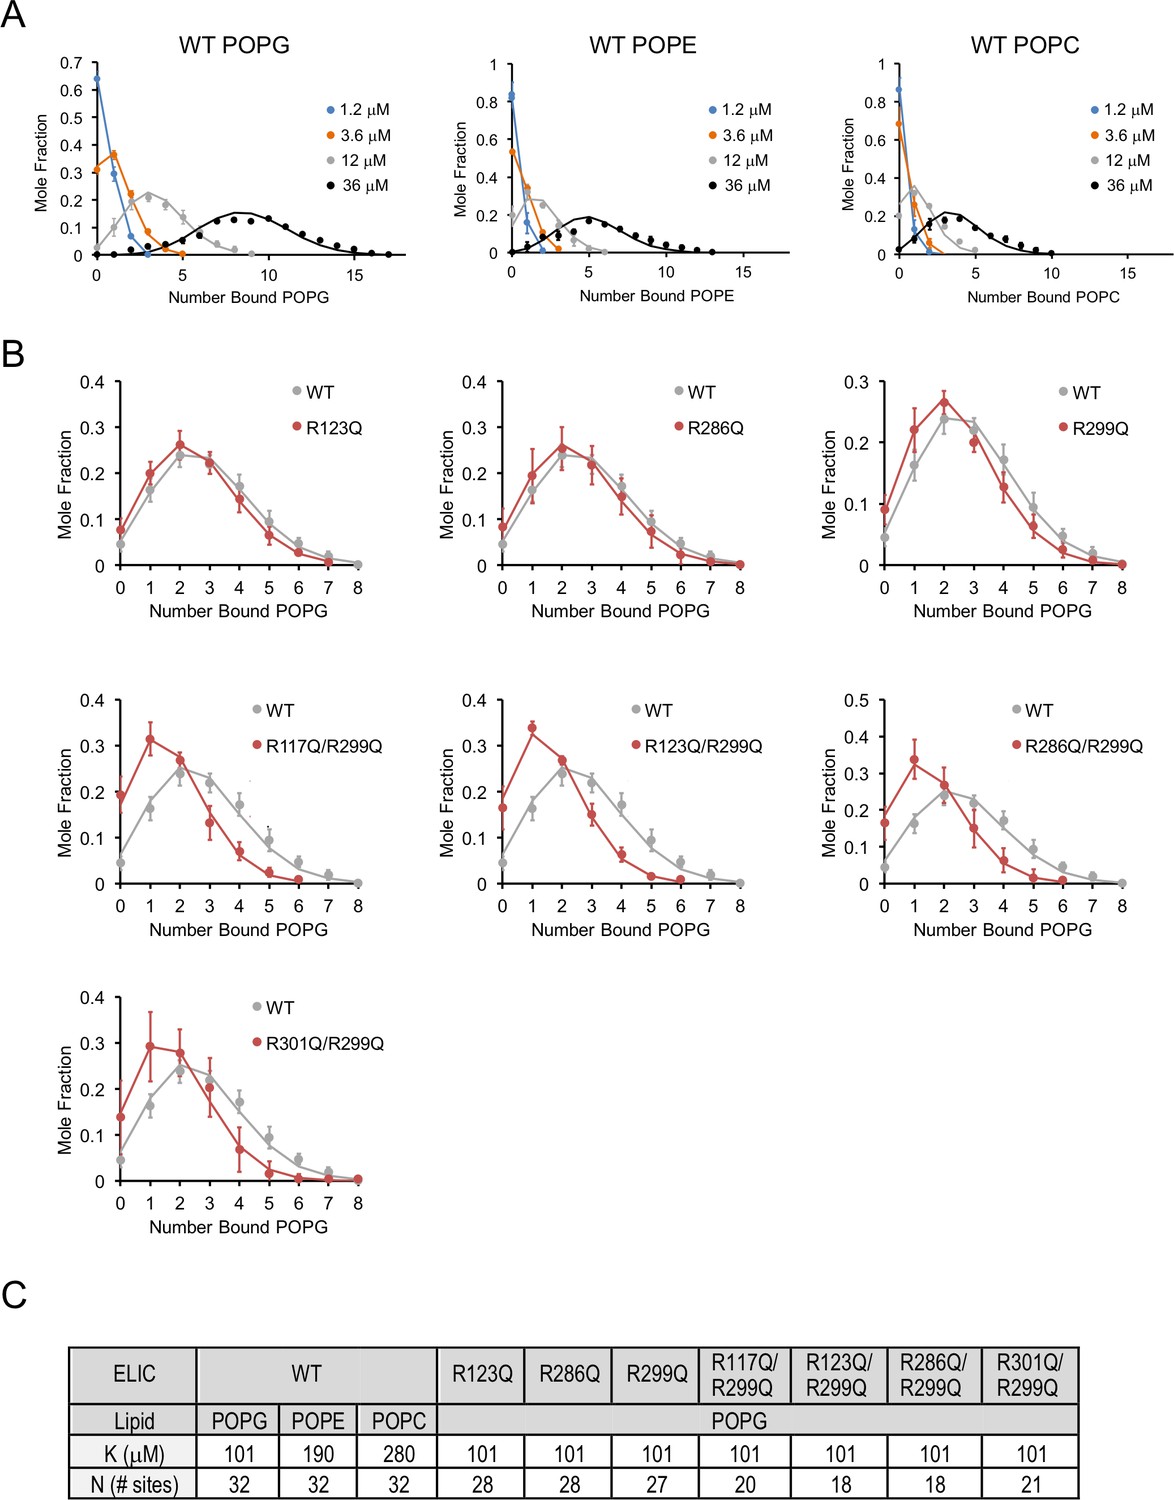
Lipid binding data fit to binomial distributions.
(A) Plots of mole fraction of phospholipid-bound ELIC derived from native MS experiments with varying concentrations of phospholipid (circles, n = 3–6, ± SD). Solid lines show global fits from a binding model based on a binomial distribution with 32 sites (N) of equal affinity (K) using K as shown in (C). (B) Plots of mole fraction of POPG-bound ELIC WT and mutants at 12 μM POPG (circles, n = 3–6, ± SD). Solid lines show fits as in (A) in which K is held constant at 102 μM and N is varied as indicated in (C). (C) Table showing dissociation constants (K) and number of sites (N) used in fits shown in (A) and (B).
Figure 2
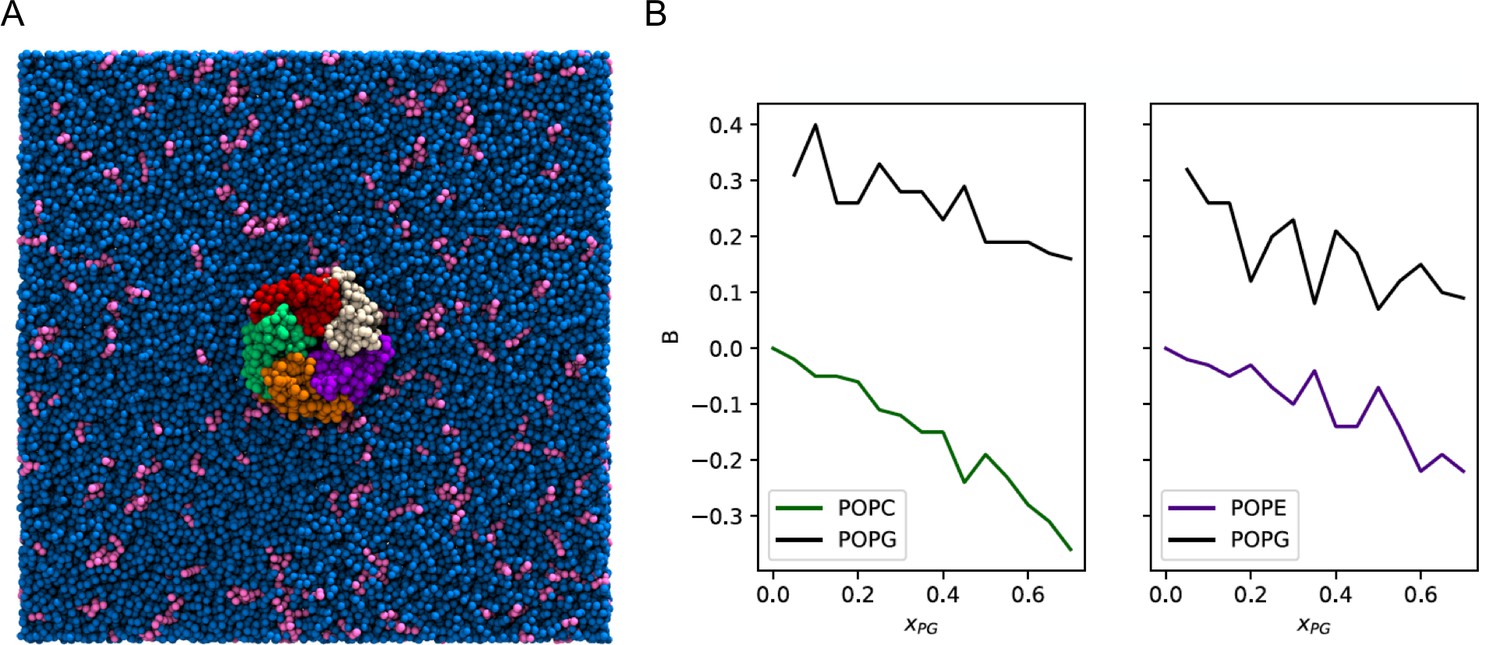
Enrichment of POPG among ELIC boundary phospholipids from coarse-grained simulations.
(A) Image of the simulation model of ELIC embedded in a membrane consisting of 10% POPG (pink) and 90% POPC (blue). The view is from the extracellular side of ELIC perpendicular to the membrane. (B) The boundary enrichment metric, B, is shown for phospholipid species in POPC/POPG membranes (left) or POPE/POPG membranes (right) over a range of POPG mole fractions (). B is defined in Equation 8 (see Materials and methods) and reflects the fractional difference between the amount of a lipid species found in the boundary and the bulk membrane: B > 0 indicates enrichment, B < 0 indicates depletion, and B = 0 indicates no difference in mole fraction between the bulk and the boundary.
Figure 3 with 2 supplements
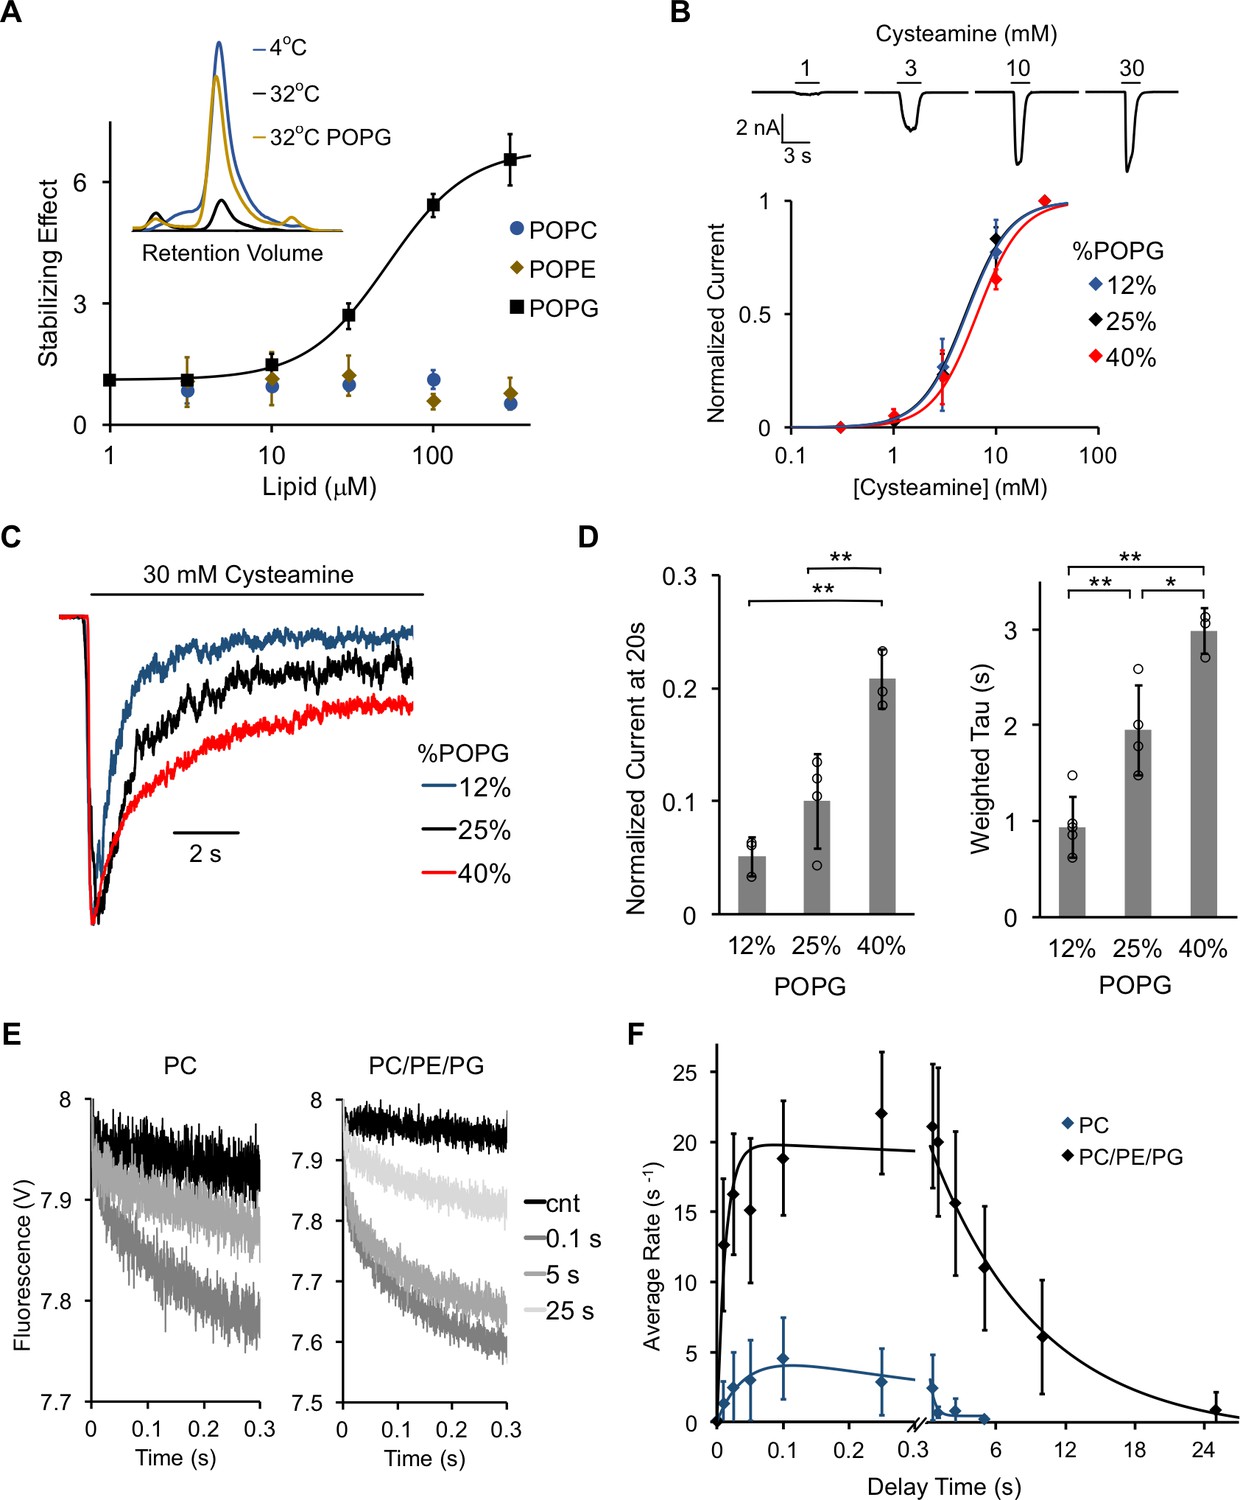
POPG selectively thermally stabilizes ELIC and decreases ELIC desensitization.
(A) Plot of stabilizing effect (defined as the ELIC pentamer peak height with phospholipid relative to control after heating) versus phospholipid concentration (n = 3, ± SD; EC50 = 52 μM, Hill n = 1.7). Inset shows size exclusion chromatography (SEC) profile in absorbance units of the ELIC pentamer treated at 4°C, 32°C, and 32°C with 100 μM POPG. (B) Top: Representative ELIC current responses to 30 mM cysteamine in 25 mole% POPG liposomes. Bottom: Normalized plots of peak current responses of ELIC to cysteamine in giant liposomes with varying mole% POPG (n = 3–5, ± SD). Data are fit to Hill equation with n = 2. (C) Representative ELIC currents in response to 30 mM cysteamine in liposomes with varying mole% POPG. (D) Left: ELIC currents 20 s after application of 30 mM cysteamine normalized to peak response at varying mole% POPG (n = 4–5, ± SD, **p<0.01). Right: Weighted tau (time constants) of ELIC desensitization at varying mole% POPG (n = 3–5, ± SD, **p<0.01, *p<0.05). (E) Representative fluorescence-quench time courses from sequential mixing stopped-flow experiments of ELIC in POPC liposomes or 2:1:1 POPC:POPE:POPG liposomes. Proteoliposomes were mixed with no cysteamine (cnt) or 5 mM cysteamine with a 0.1, 5, and 25 s delay prior to mixing with Tl+. (F) Rate constants extracted from quench kinetics as shown in (E) as a function of the incubation time with cysteamine. Data are fit with a double exponential yielding activation and desensitization time constants (n = 3, ± SD).
Figure 3—figure supplement 1
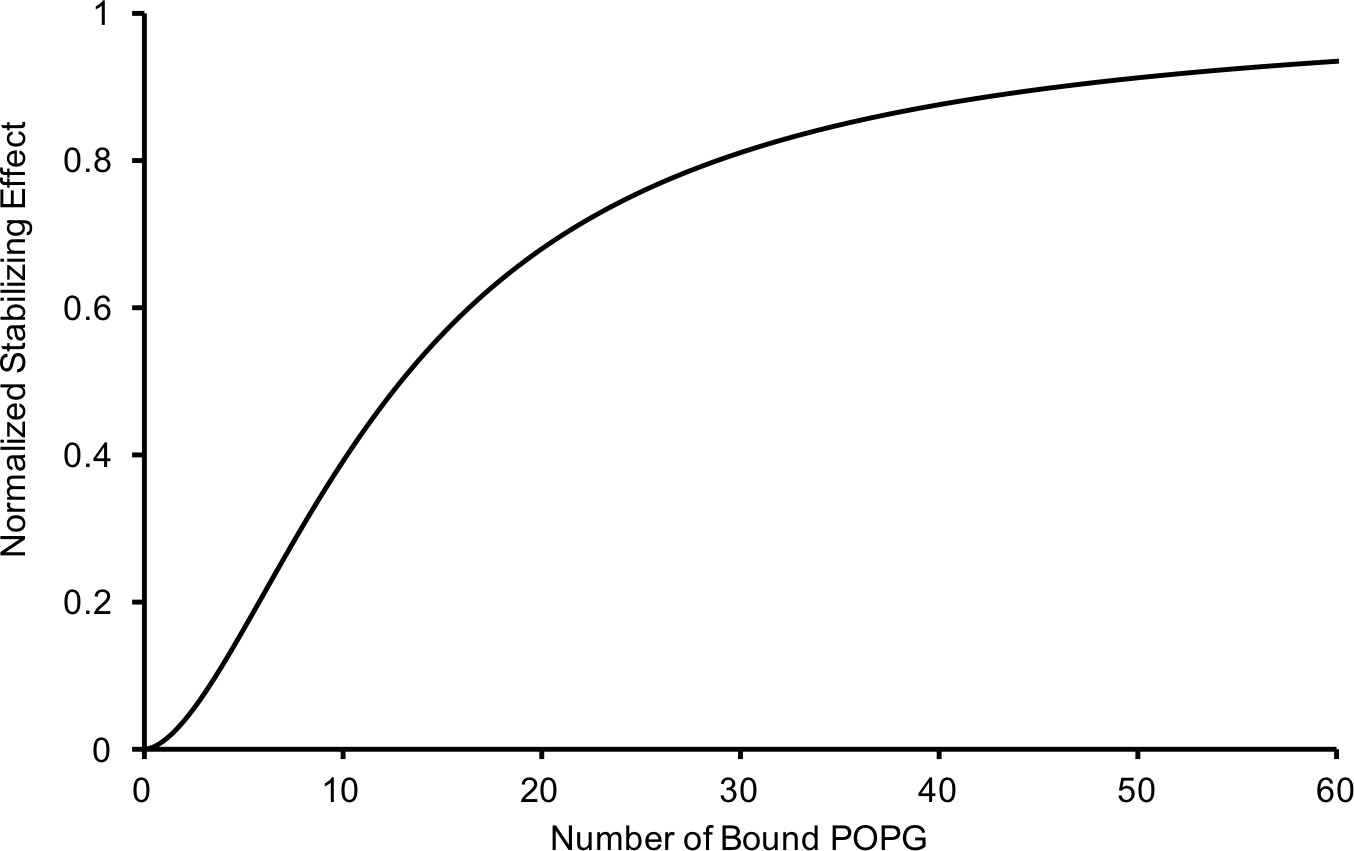
Relationship of the thermal stabilizing effect of POPG vs the average number of bound POPG derived from equating concentration of POPG from the sigmoid functions used to fit the POPG binding (Figure 1B) and thermal stability data (Figure 3A).
The resulting relationship is: , where P is the average number of bound POPG and S is the normalized thermal stabilizing effect.
Figure 3—figure supplement 2
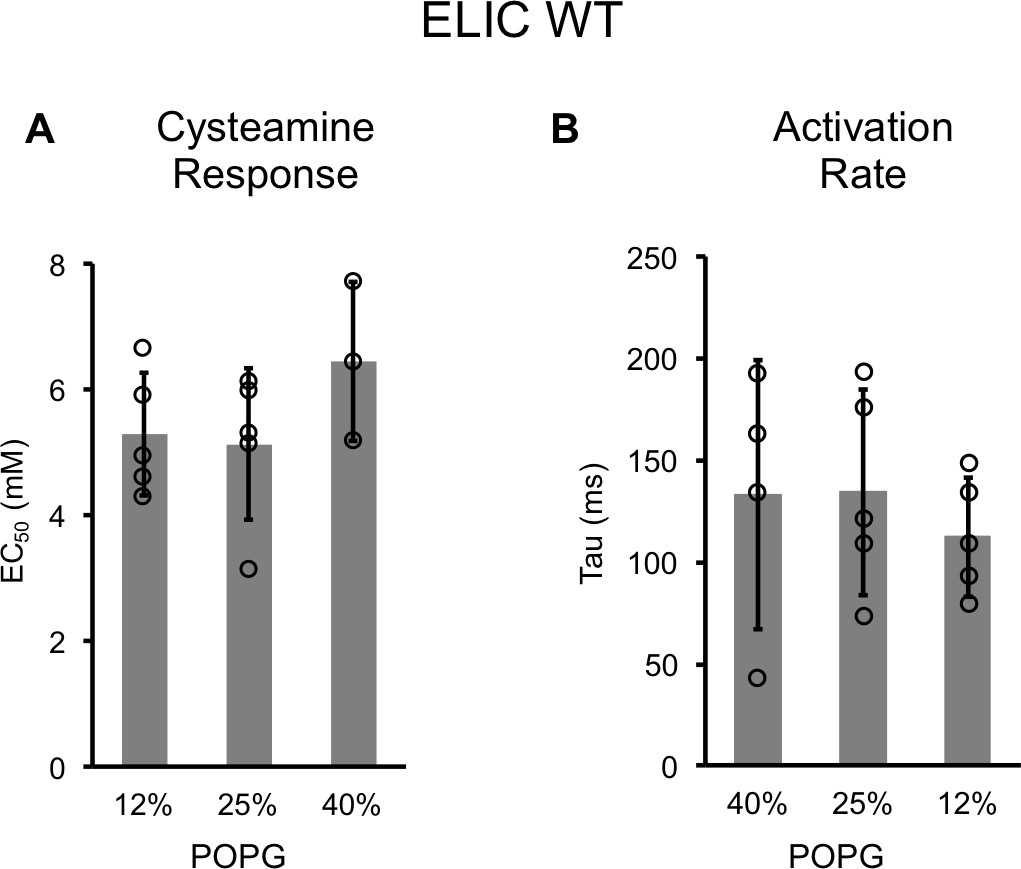
Channel properties of WT ELIC responses to cysteamine by patch-clamping.
(A) EC50 for peak responses to cysteamine of WT ELIC by patch-clamping giant liposomes of varying mole% POPG (n = 3–5, ± SD). (B) Activation time constants (τ) derived from single exponential fits of WT ELIC in response to 30 mM cysteamine in giant liposomes of varying mole% POPG (n = 4–5, ± SD).
Figure 4
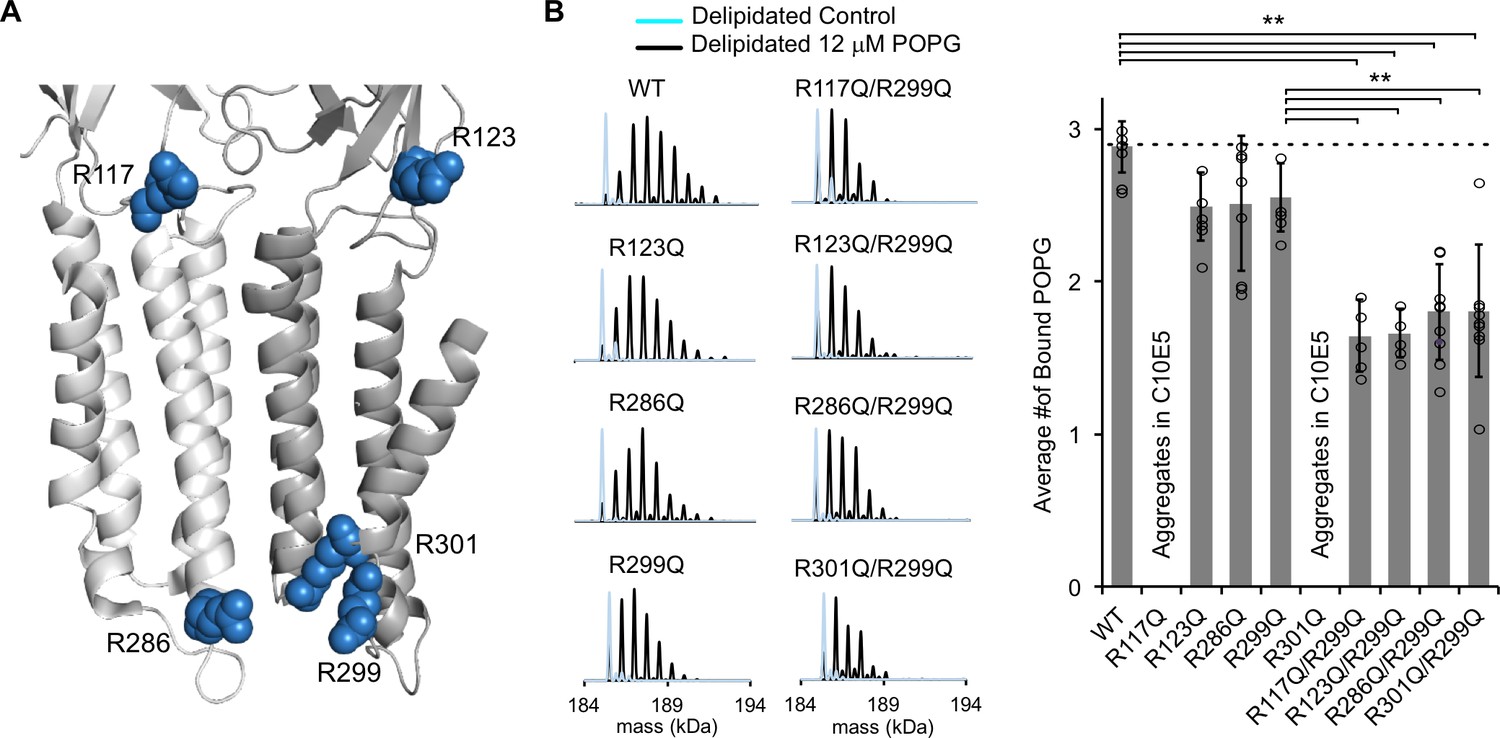
Mutations of five interfacial arginines reduce POPG binding.
(A) Structure of ELIC showing two adjacent subunits and five arginine side chains that were mutated to glutamine. (B) Left: Representative deconvoluted spectra of ELIC WT and indicated mutants. Blue indicates spectra of delipidated ELIC in C10E5. Black indicates spectra of delipidated ELIC in C10E5 with 12 μM POPG. Right: Plot of average number of bound POPG for ELIC WT and mutants, delipidated in C10E5, with 12 μM POPG (n = 5–8, ± SD, **p<0.01).
Figure 5
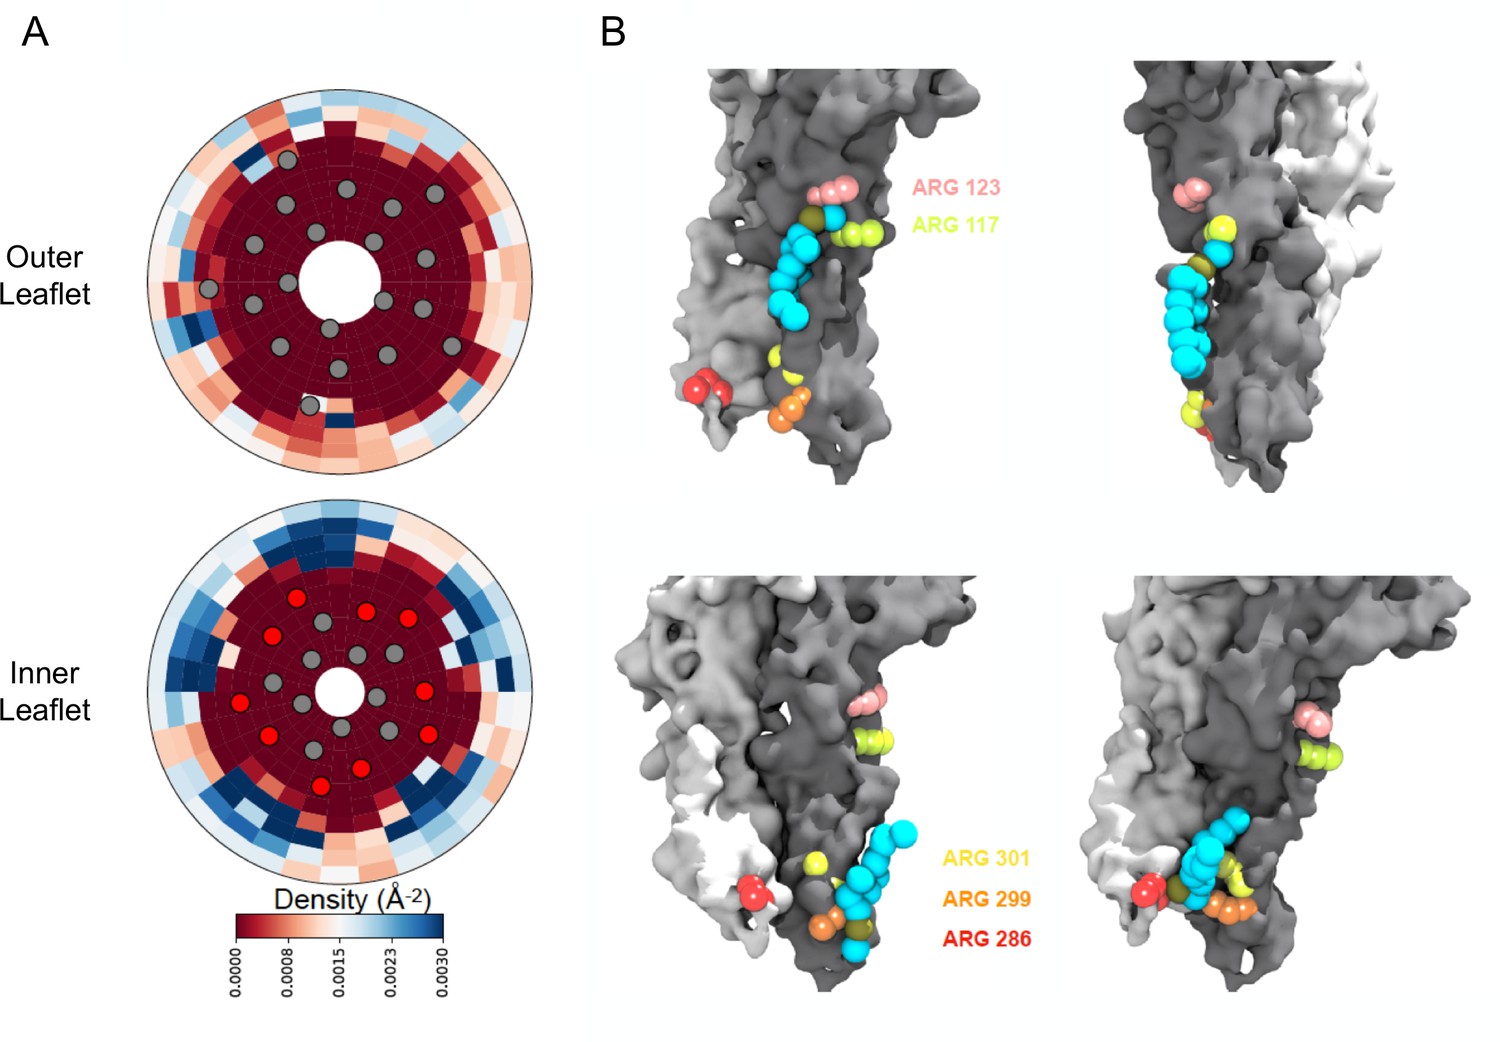
Density calculations of lipids in binary membranes and visualization of direct POPG-ELIC interactions at 10% POPG.
(A) Distribution of POPG density in a POPG-POPC membrane, within 40 Å from the ELIC pore over the last half of a 15 µs simulation, for both the outer leaflet (top) and the inner leaflet (bottom). Density is colored according to the color bar, where red and blue represent low and high POPG density, respectively. Circles represent the ELIC transmembrane backbone center of mass, with the helices containing the interfacial arginines colored in red. (B) Representative frames after ~9 µs of simulation, showing multiple POPG binding modes associated with high density areas in (A). Two adjacent subunits of ELIC are shown in gray and white, while arginine side chains of interest are colored in peach, lime-yellow, orange, yellow, and red. POPG phosphate is colored in tan with the rest of the lipid in cyan.
Figure 6 with 1 supplement
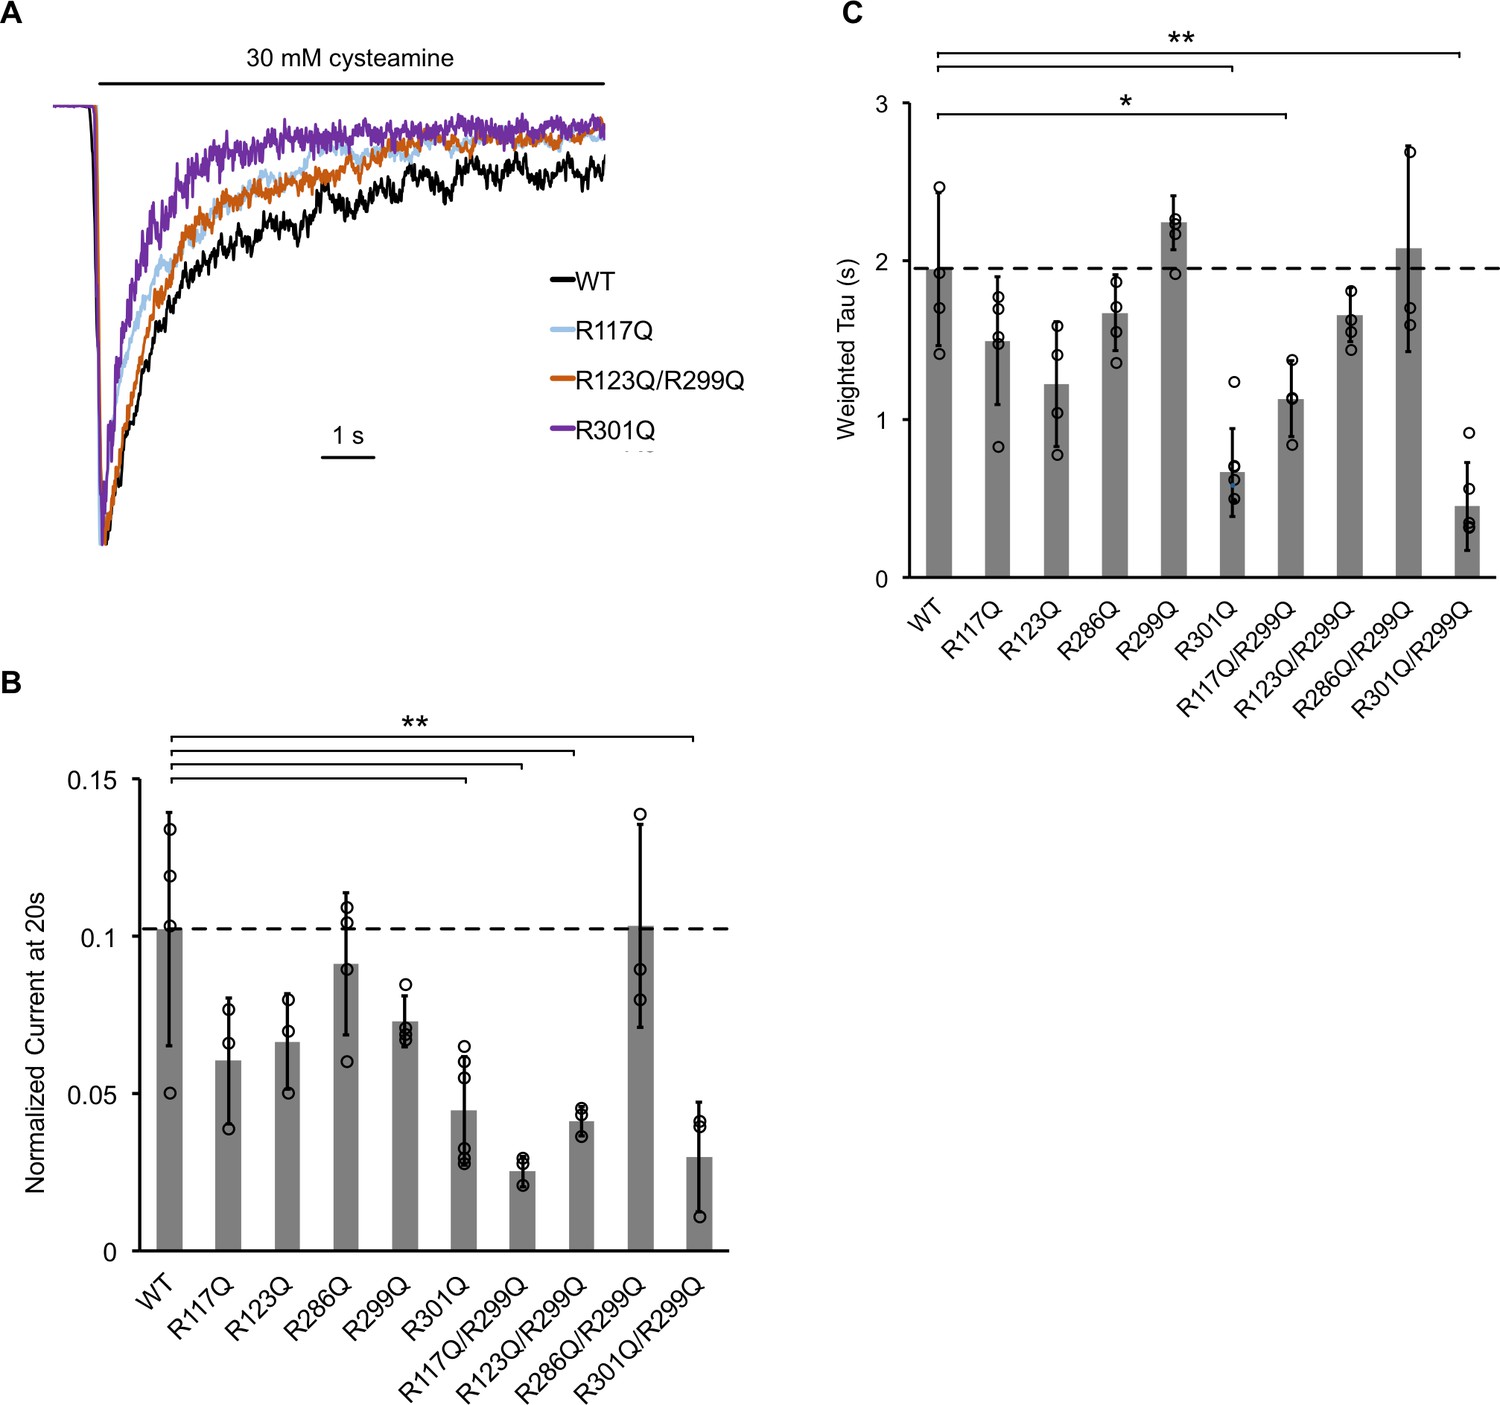
The effect of ELIC mutants on desensitization.
(A) Normalized ELIC WT and mutant current responses to 30 mM cysteamine in 25 mole% POPG liposomes. (B) Graph of ELIC WT and mutant currents 20 s after application of 30 mM cysteamine normalized to peak response in 25 mole% POPG liposomes (n = 3–7, ± SD, **p<0.01, *p<0.05). (C) Same as (B) for weighted tau (time constants) of desensitization.
Figure 6—figure supplement 1
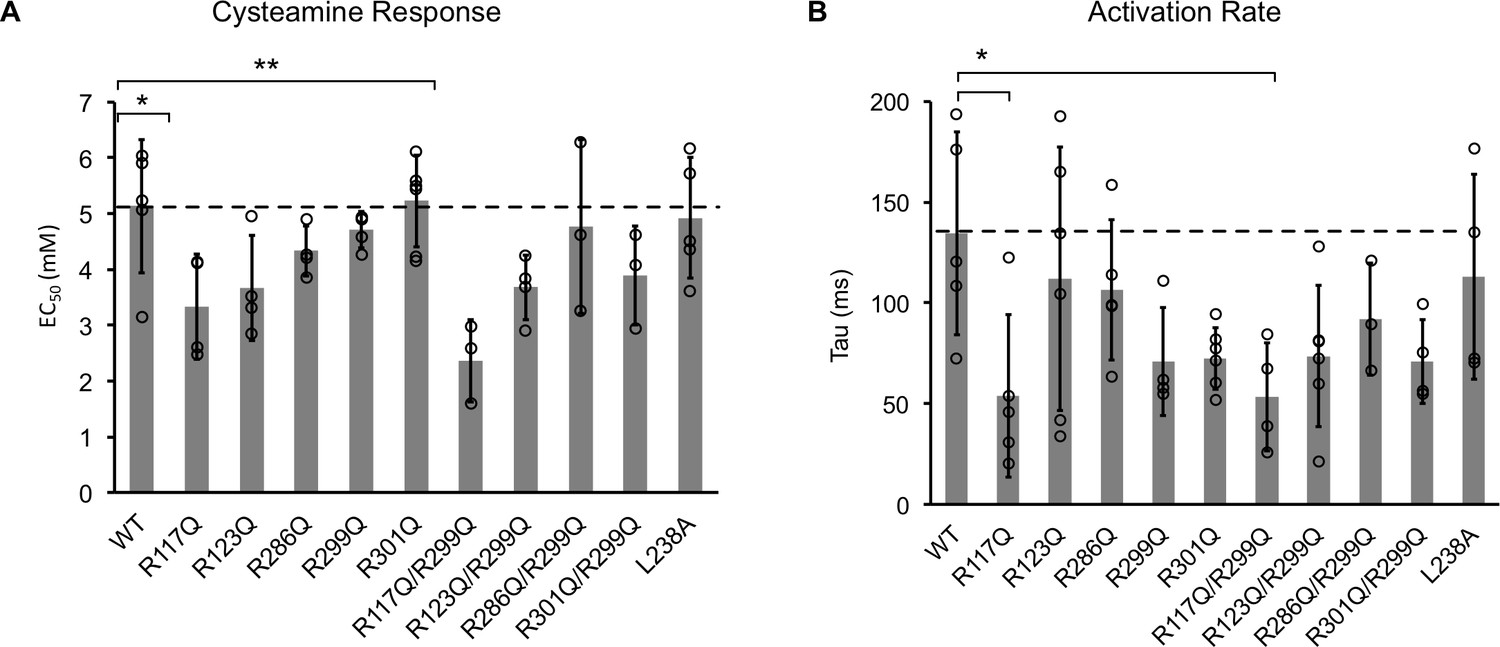
Channel properties of ELIC WT and mutant responses to cysteamine b giant liposomes of 25 mole% POPG.
(A) Graph of EC50 for peak responses to cysteamine of ELIC WT and mutants (n = 4–7, ± SD, *p<0.05, **p<0.01). (B) Activation time constants (tau) of ELIC WT and mutants in response to 30 mM cysteamine (n = 4–7, ± SD, *p<0.05).
Figure 7
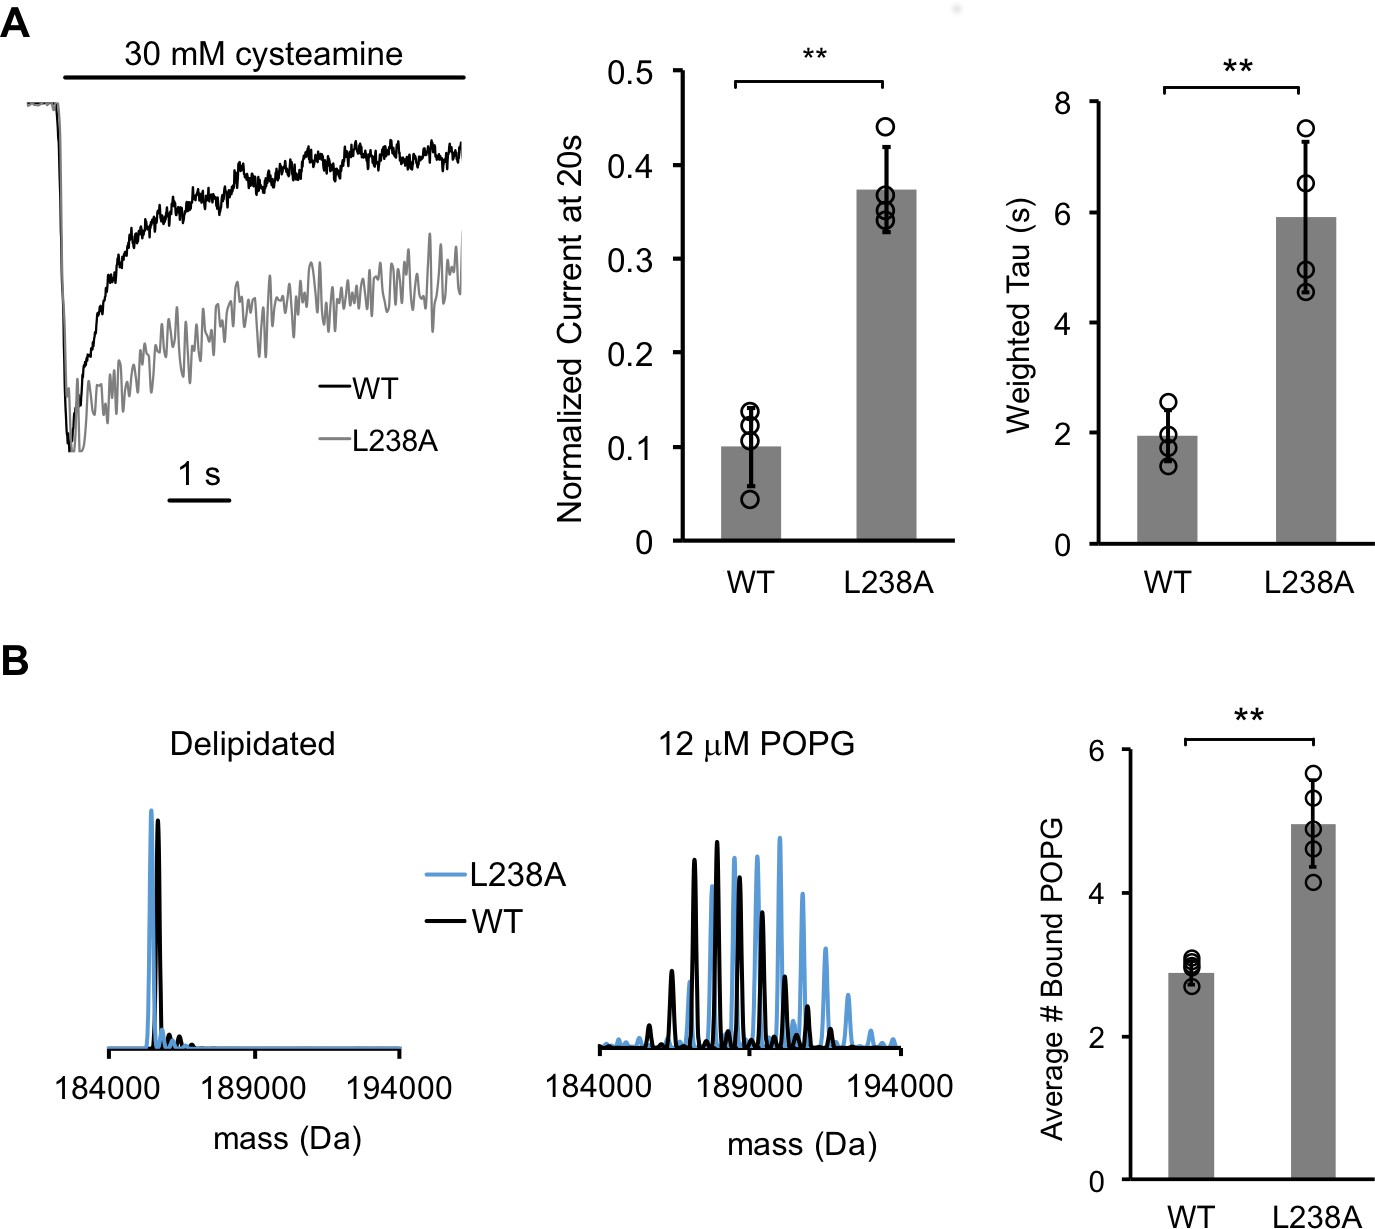
A mutantion, which decreases desensitization, increases POPG binding.
(A) Left: Normalized ELIC WT and L238A current responses to 30 mM cysteamine in 25% POPG liposomes. Middle: ELIC WT and L238A currents 20 s after application of 30 mM cysteamine normalized to peak response at 25 mole% POPG (n = 4–5, ± SD, **p<0.01). Right: Weighted tau (time constants) of ELIC WT and L238A desensitization time courses at 25 mole% POPG (n = 4–5, ± SD, **p<0.01). (B) Left: Representative deconvoluted spectra of ELIC WT (black) and L238A (blue) showing ELIC delipidated in C10E5 without and with 12 μM POPG. Right: Graph of average number of bound POPG for ELIC WT and L238A, delipidated in C10E5, with 12 μM POPG (n = 4–5, ± SD, **p<0.01).
Figure 8
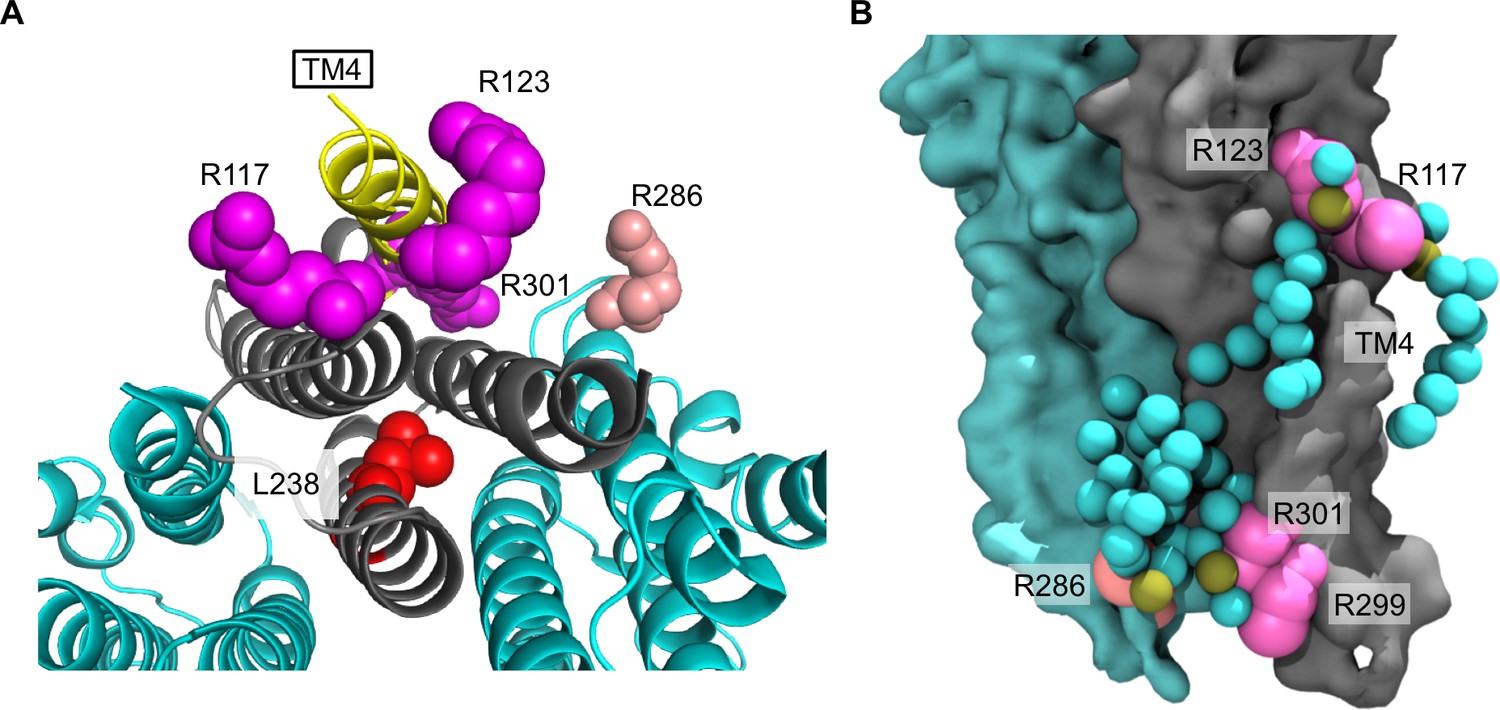
Arginines involved in POPG binding and ELIC desensitization.
(A) Top view of ELIC highlighting TM4 (yellow) and showing the side chains of R117, R123, and R301 (magenta) adjacent to TM4, which increase ELIC desensitization, and R286 at the subunit interface (salmon), which has no effect on desensitization. The L238 side chain is shown in red. (B) Image from coarse-grained simulations with 50% POPG showing two adjacent ELIC subunits and the mutated arginine side chains (R117, R123, R299, and R301 in magenta; R286 in salmon). Also shown are all POPG lipids making contacts with the TMD in this snapshot.
Tables
Table 1
ELIC WT channel properties by patch-clamping giant liposomes composed of varying mole% POPG.
The rate and extent of desensitization are reported as weighted time constants (τ), and the current after 20 s of 30 mM cysteamine application normalized to peak response. Also shown are activation time constants (τ) in response to 30 mM cysteamine and EC50s for cysteamine activation (n = 3–5, ± SD).
| Desensitization | Activation | Dose response | ||
|---|---|---|---|---|
| POPG | Weighted τ (s) | Norm current at 20 s | τ (ms) | EC50 (mM cysteamine) |
| 12% | 0.93 ± 0.32 | 0.05 ± 0.02 | 112 ± 29 | 5.3 ± 1.0 |
| 25% | 1.95 ± 0.47 | 0.10 ± 0.04 | 134 ± 50 | 5.1 ± 1.2 |
| 40% | 2.98 ± 0.24 | 0.21 ± 0.03 | 133 ± 66 | 6.5 ± 1.3 |
Table 2
ELIC WT activation and desensitization time constants (τ) derived from a double exponential fit to the entire time course of flux in Figure 3F (n = 3, ± SD). The fast component describes activation and the slow component desensitization.
https://doi.org/10.7554/eLife.50766.012| Activation τ (ms) | Desensitization τ (s) | |
|---|---|---|
| POPC | 39 ± 17 | 0.42 ± 0.05 ** |
| POPC:POPE:POPG (2:1:1) | 13 ± 3 | 9.2 ± 3.2 ** |
-
** indicates a significant difference between desensitization time constants in POPC compared to POPC:POPE:POPG (p<0.01).
Table 3
ELIC WT and mutant channel properties by patch-clamping giant liposomes composed of 25 mole% POPG (n = 3–7, ± SD).
Shown are weighted time constants (τ) for desensitization and currents 20 s after application of 30 mM cysteamine normalized to peak response. Also shown are activation time constants and EC50 of cysteamine response. Light gray indicates mutant values which are significantly different from WT (blue) (**p<0.01, *p<0.05).
| Desensitization | Activation | Cysteamine response | ||
|---|---|---|---|---|
| Weighted τ (s) | Norm current at 20 s | τ (ms) | EC50 (mM cysteamine) | |
| WT | 1.95 ± 0.48 | 0.100 ± 0.041 | 134 ± 50 | 5.1 ± 1.2 |
| R117Q | 1.49 ± 0.40 | 0.060 ± 0.020 | 54 ± 40 * | 3.3 ± 0.9 * |
| R123Q | 1.20 ± 0.39 | 0.067 ± 0.015 | 112 ± 65 | 3.7 ± 0.9 |
| R286Q | 1.67 ± 0.24 | 0.091 ± 0.023 | 106 ± 34 | 4.3 ± 0.4 |
| R299Q | 2.2 ± 0.17 | 0.074 ± 0.008 | 71 ± 27 | 4.7 ± 0.3 |
| R301Q | 0.66 ± 0.28 ** | 0.045 ± 0.017 ** | 72 ± 15 | 5.2 ± 0.8 |
| R117Q/R299Q | 1.13 ± 0.24 * | 0.025 ± 0.004 ** | 54 ± 26 * | 2.4 ± 0.7 ** |
| R123Q/R299Q | 1.66 ± 0.17 | 0.041 ± 0.005 ** | 74 ± 35 | 3.7 ± 0.6 |
| R286Q/R299Q | 2.08 ± 0.65 | 0.103 ± 0.032 | 92 ± 27 | 4.7 ± 1.5 |
| R301Q/R299Q | 0.45 ± 0.28 ** | 0.030 ± 0.017 ** | 71 ± 21 | 3.9 ± 0.9 |
| L238A | 5.90 ± 1.37 ** | 0.374 ± 0.045 ** | 113 ± 51 | 4.9 ± 1.1 |
Additional files
-
Supplementary file 1
Phophatidylethanolamine and phosphatidylglycerol species identified in lipid extracts by MS/MS.
Table shows m/z, intensity, mass, and mass accuracy of each phospholipid species.
- https://doi.org/10.7554/eLife.50766.020
-
Transparent reporting form
- https://doi.org/10.7554/eLife.50766.021
Download links
A two-part list of links to download the article, or parts of the article, in various formats.
Downloads (link to download the article as PDF)
Open citations (links to open the citations from this article in various online reference manager services)
Cite this article (links to download the citations from this article in formats compatible with various reference manager tools)
Direct binding of phosphatidylglycerol at specific sites modulates desensitization of a ligand-gated ion channel
eLife 8:e50766.
https://doi.org/10.7554/eLife.50766


