DNA damage checkpoint activation impairs chromatin homeostasis and promotes mitotic catastrophe during aging
- University of Washington, United States
Figures
Figure 1 with 5 supplements
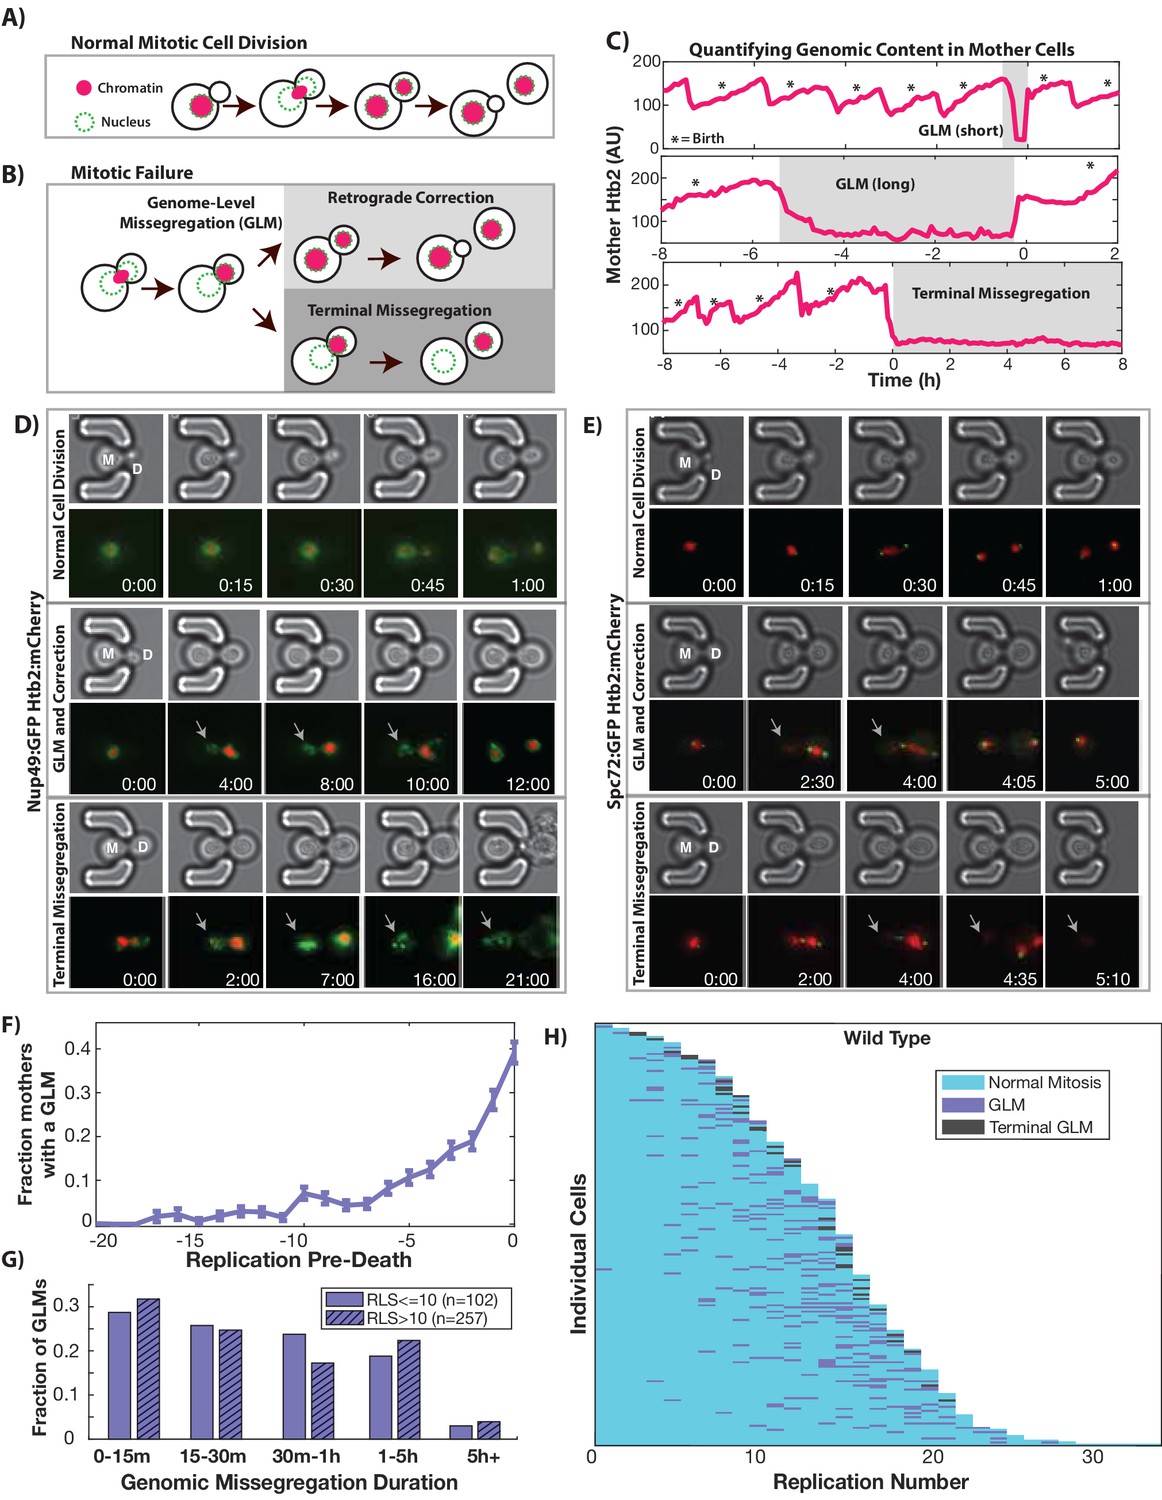
During replicative aging cells frequently undergo dramatic genomic missegregation events.
(A) Schematic showing the process of a normal cell division where chromatin (red) doubles during S-phase and is divided between mother and daughter during mitosis. (B) Aging cells frequently experience Genome Level Missegregation (GLM) events where most genomic material enters the daughter while the nuclear envelope appears in both cells. Usually this missegregation is corrected through retrograde transport of genomic material back into the mother cell (top), allowing mother cells to go on to divide and produce more daughters. If not corrected and cytokinesis occurs (bottom), this becomes a terminal event wherein mother cells replicatively senesce. (C) Representative single cell traces of mother Htb2 levels showing missegregation (shaded) and active retrograde correction events. GLMs can be resolved quickly (top) or resolution can take hours (middle). A GLM becomes terminal (bottom) if it is not corrected. (*) indicates the formation of new buds, and both cells where the GLM is corrected produce additional daughters. AU indicates arbitrary units. (D) Time-lapse dynamics showing a normal cell division (top, mother cell replicative age 6), a GLM that is corrected (middle, mother cell replicative age 14) and a terminal missegregation (bottom, mother cell replicative age 12) in cells co-expressing Htb2:mCherry and Nup49:GFP. During both GLMs the nuclear envelope is clearly visible in both mother (M) and daughter (D) cells. See Video 1. (E) Time-lapse dynamics showing a normal cell division (top, mother cell replicative age 12), a GLM that is corrected (middle, mother cell replicative age 13) and a terminal missegregation (bottom, mother cell replicative age 16) in cells expressing Htb2:mCherry and Spc72:GFP. Both spindle poles can be seen to enter the daughter (D) during these events, and during the correction event a spindle pole returns to the mother (M). In the terminal missegregation, the spindle pole fails to reenter the mother cell. See Video 2. Times are indicated in hours:mins from the start of the displayed time-lapse, not the start of the experiment. Arrows indicate mother cells which have lost DNA via a GLM. (F) Missegregation probabilities increase dramatically near the end of replicative lifespan. n = 410 mother cells examined, and error bars are SEM. (G) Many GLMs are corrected within an hour, but some events can last several hours, and the duration of events is not influenced by the replicative age of the mother cell (p>0.05, Student’s t-test). Terminal missegregation events were excluded from the analysis. (H) Survival curve showing the dynamics of individual wild-type mother cells. Each row is a separate mother cell, and the color indicates whether a cell experienced a normal cell cycle, GLM or terminal missegregation (n = 200 randomly selected cells).
Figure 1—figure supplement 1
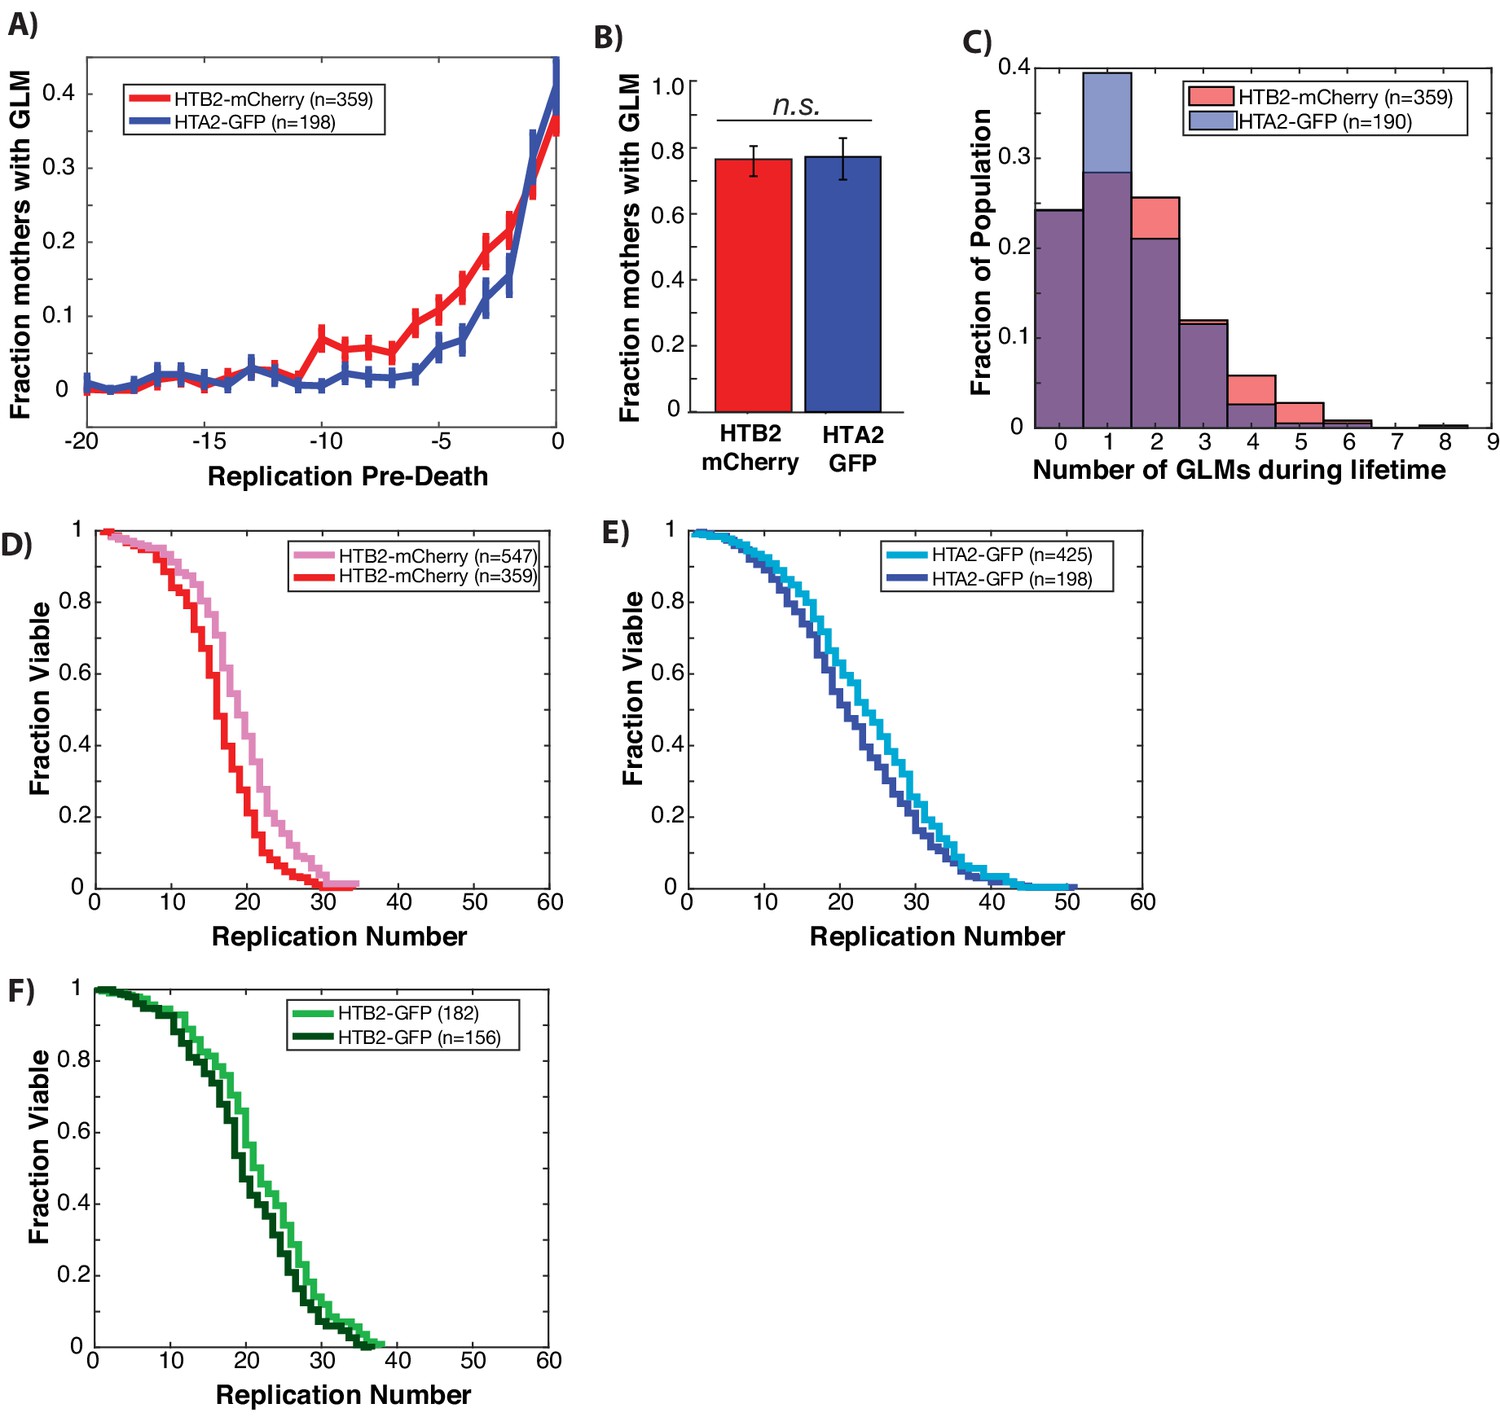
GLMs increase at end of life regardless of histone tagged and fluorophore used.
(A) Both Htb2:mCherry and Hta2:GFP strains experience a dramatic increase in the probability of GLM events in the 5–6 divisions preceding death. Error bars are standard error. (B) There is no difference between Htb2:mCherry and Hta2:GFP with respect to the fraction of cells that experience GLM events. Error bars are 95% confidence intervals from bootstrapping over individual cells and bars that do not overlap indicate significance at the p=0.05 level. (C) The distribution of the number of GLM events that cells experience over their lifetime is similar between the strains but statistically different (p=0.02 two-tailed t-test), with Htb2:mCherry cells experiencing, on average, more events over their lifetime. (D) Replicative lifespan curves for Htb2:mCherry including censored cells (pink, median RLS=17) and excluding (red, median RLS=15). (E) Replicative lifespan curves for Hta2:GFP including censored cells (light blue, median RLS=23) and excluding (blue, median RLS=18). (F) Replicative lifespan curves for Htb2:GFP including censored cells (light green, median RLS=21) and excluding (green, median RLS=18).
Figure 1—figure supplement 2
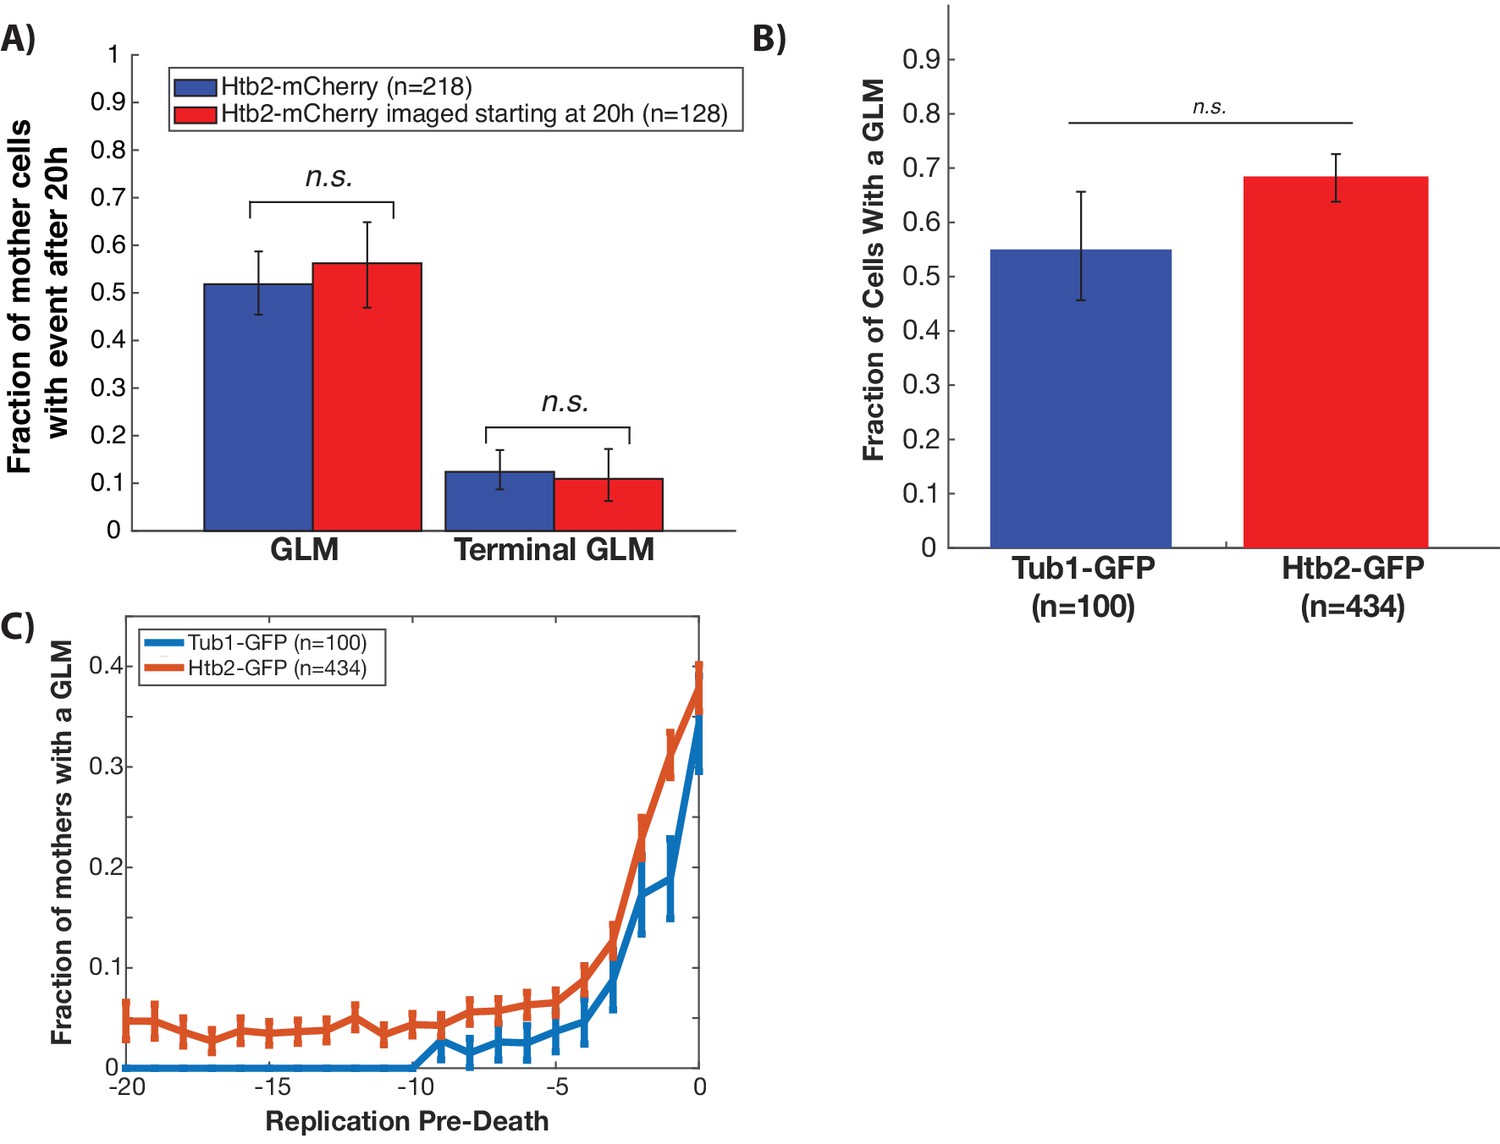
GLMs are not caused by experimental conditions.
(A) To determine whether GLMs were caused by the cumulative exposure to fluorescence excitation energy, we compared GLM rates in cells imaged over their entire lifespans (blue) with those only imaged after they were already a median replicative age of 16 generations, or 20 hr (red). This is equivalent to ~75% of the median lifespan of this strain. To compare these cells to the control, we only quantified GLMs that occurred after 20 hr. Error bars are 95% confidence intervals generated by bootstrapping with replacement over all cells. No difference was found in either the fraction of cells with GLMs or the fraction of cells with terminal GLMs. This indicates that with our experimental conditions there is no cumulative effect of the fluorescence excitation light on the frequency of GLMs or the ability of cells to correct these GLMs. (B) GFP microtubules were tagged with GFP and used to determine whether cells were undergoing a GLM in a given cell cycle. Given the inability to directly observe chromatin in the Tub1:GFP strain, the criteria for a GLM was >80% of the labeled microtubules had to enter the daughter cell during mitosis. This criteria likely resulted in undercounting of GLM events. Error bars generated by bootstrapping with replacement so that non-overlapping error bars show significance at the p=0.05 level. (C) Both Htb2:mCherry and Tub1:GFP strains experience a dramatic increase in the probability of GLM events in the 5–6 divisions preceding death. This indicates the age related increase in events as cells approach death is not caused by labeling of the histones. Error bars are standard error.
Figure 1—figure supplement 3
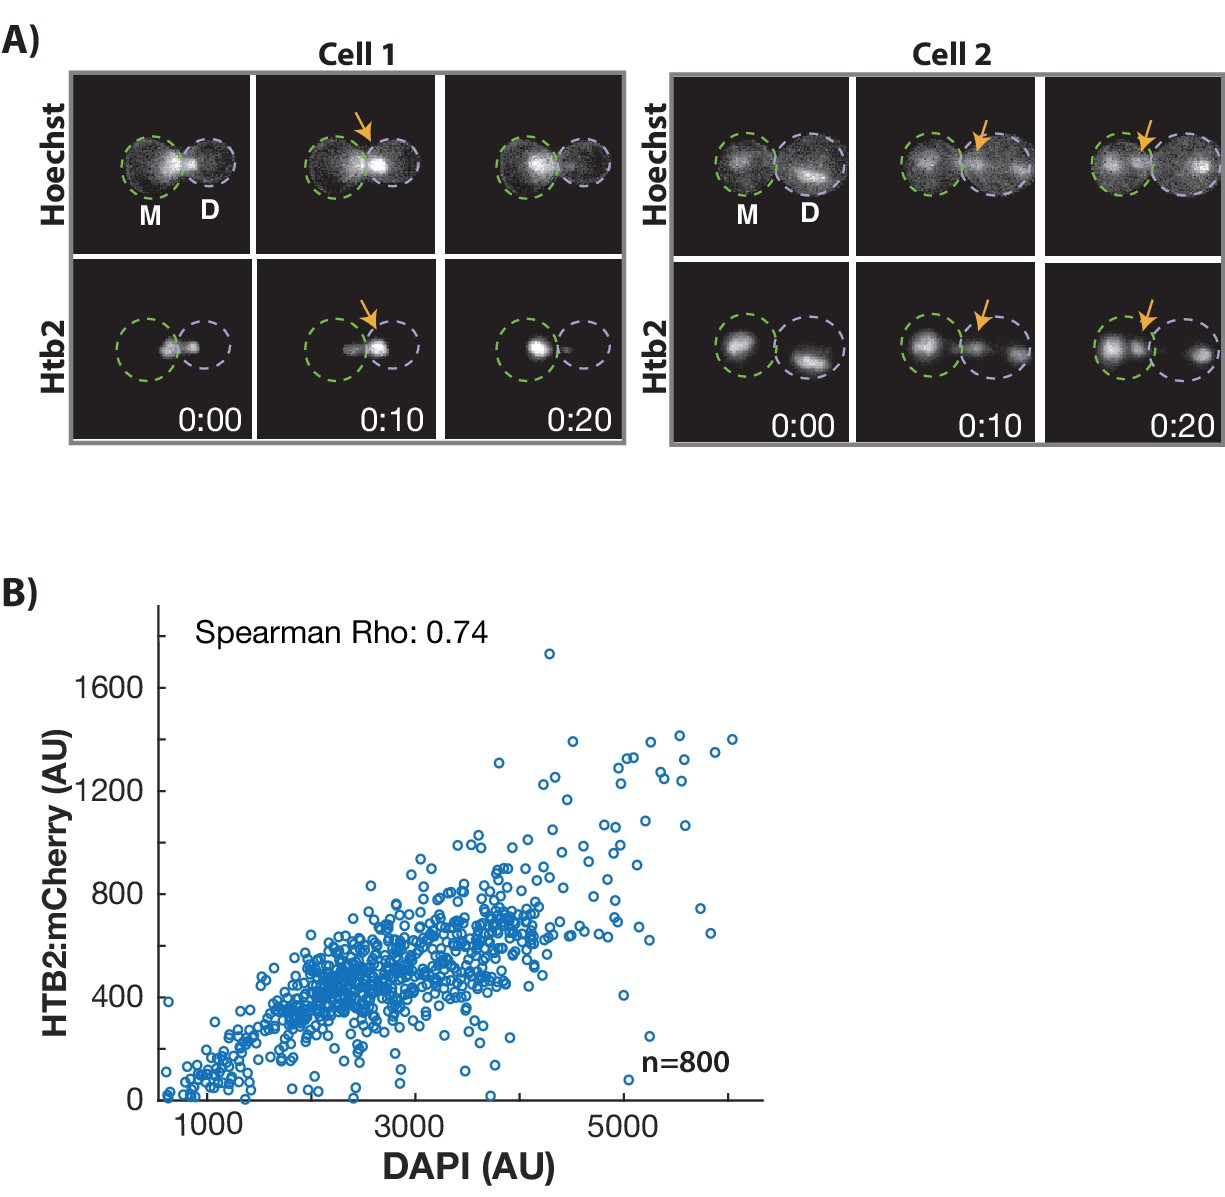
DNA moves in concert with histones during GLM events and are correlated with histone levels at the single cell level.
(A) Genomic DNA and histones co-localize during GLM events. Two cells expressing Htb2:mCherry and stained with a live DNA dye Hoechst 3342. Histones and DNA can be seen to move in concert between both mother (M) and daughter (D) cells. See Video 5. (B) Wild-type cells were grown in the microfluidic device for 16 hr, and then fixed. Cells had a median replicative age of 13 divisions. The level of Htb2:mCherry is highly correlated (p<0.0001) with the level of DAPI staining at the single cell level in individual cells. This is true across the entire range of Htb2:mCherry fluorescence, as even cells that have the highest Htb2:mCherry levels have correspondingly high DAPI staining. N = 800 individual mother cells.
Figure 1—figure supplement 4
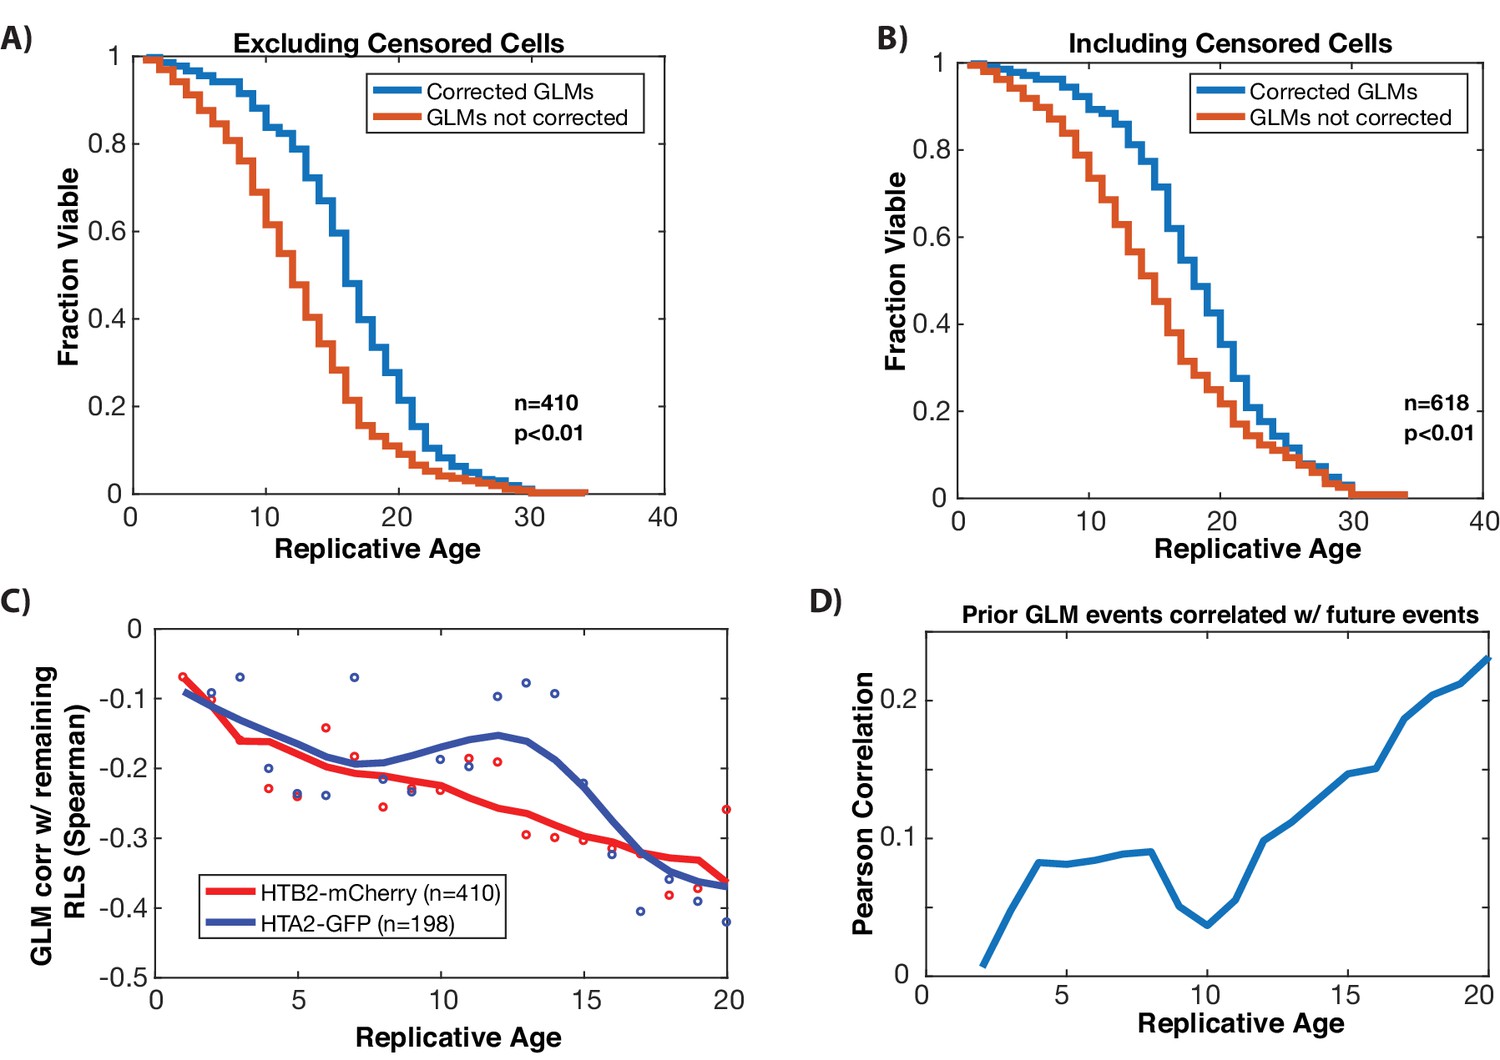
Resolution of GLMs is important to achieve a full lifespan, and GLMs are anti-correlated with remaining lifespan.
(A) Correcting GLM events significantly increase replicative life span. Comparison of experimentally observed replicative lifespan (where cells can correct GLMs), to expected lifespan if all GLMs were terminal (not corrected) for wild type cells. To generate the GLM not corrected lifespan, the first GLM event for each mother cell was assumed to be terminal, and the lifespan was truncated accordingly. This plot uses only cells that die in the device. Correcting GLM events results in an increase of median lifespan by 33% (p<0.001). (B) Same as in panel A, but including cells that are censored. The increase in median lifespan is 29% (p<0.001). (C) At the single cell level, GLM events are correlated with impending mortality (anti-correlated with remaining lifespan, as shown), and become more predictive (more strongly anti-correlated, as shown) with increasing replicative age. The strength of the anti-correlation with age is similar regardless of the fluorophore used or histone protein tagged. Dots show correlation between an individual histone and the remaining lifespan at that replicative age. To show trends, these have been smoothed with a moving average (solid line). (D) GLM events are not stochastic, but past history of events is predictive of future GLM events. At each replicative age, cells that have had prior GLM events are more likely to have them. Shown is the Pearson correlation at the single cell level, between the number of prior GLM events prior to that age, and the occurrence of an event at that age. The positive correlation indicates that prior events are predictive that cells will experience a GLM at a given age. This suggests that GLM events could be linked to an underlying cellular state linked to the occurrence of DNA damage, or reduced repair ability.
Figure 1—figure supplement 5
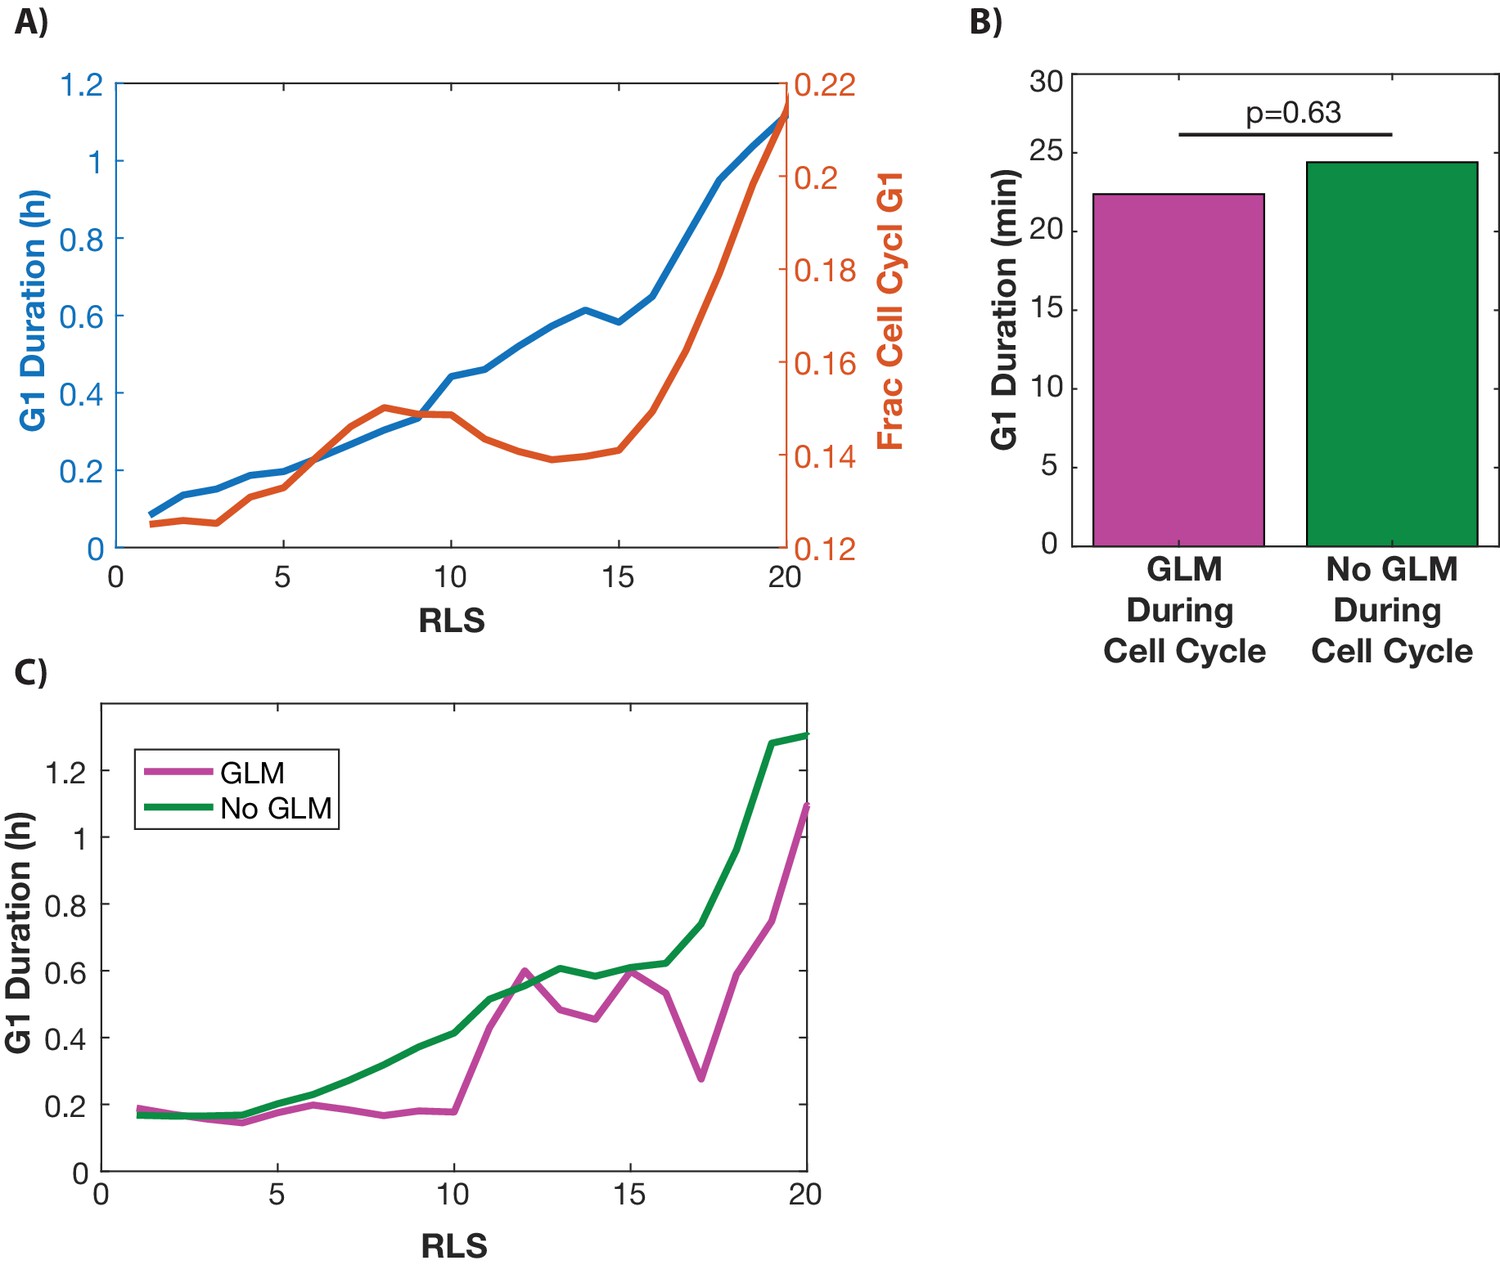
G1 duration is not linked to GLM events at the single cell level.
(A) Cells with WHI5:GFP and HTB2:mCherry were imaged for their whole life. Single cells. (B) From birth until the replicative age 15, fob1∆ cells experience on average fewer GLMs than wild-type. Over their whole replicative lifespan, however, fob1∆ cells experience on average the same number of GLMs as wild-type cells. Error bars generated by bootstrapping with replacement so that non-overlapping error bars show significance at the p=0.05 level, and ** indicates significance at the p<0.01 level.
Figure 2 with 2 supplements
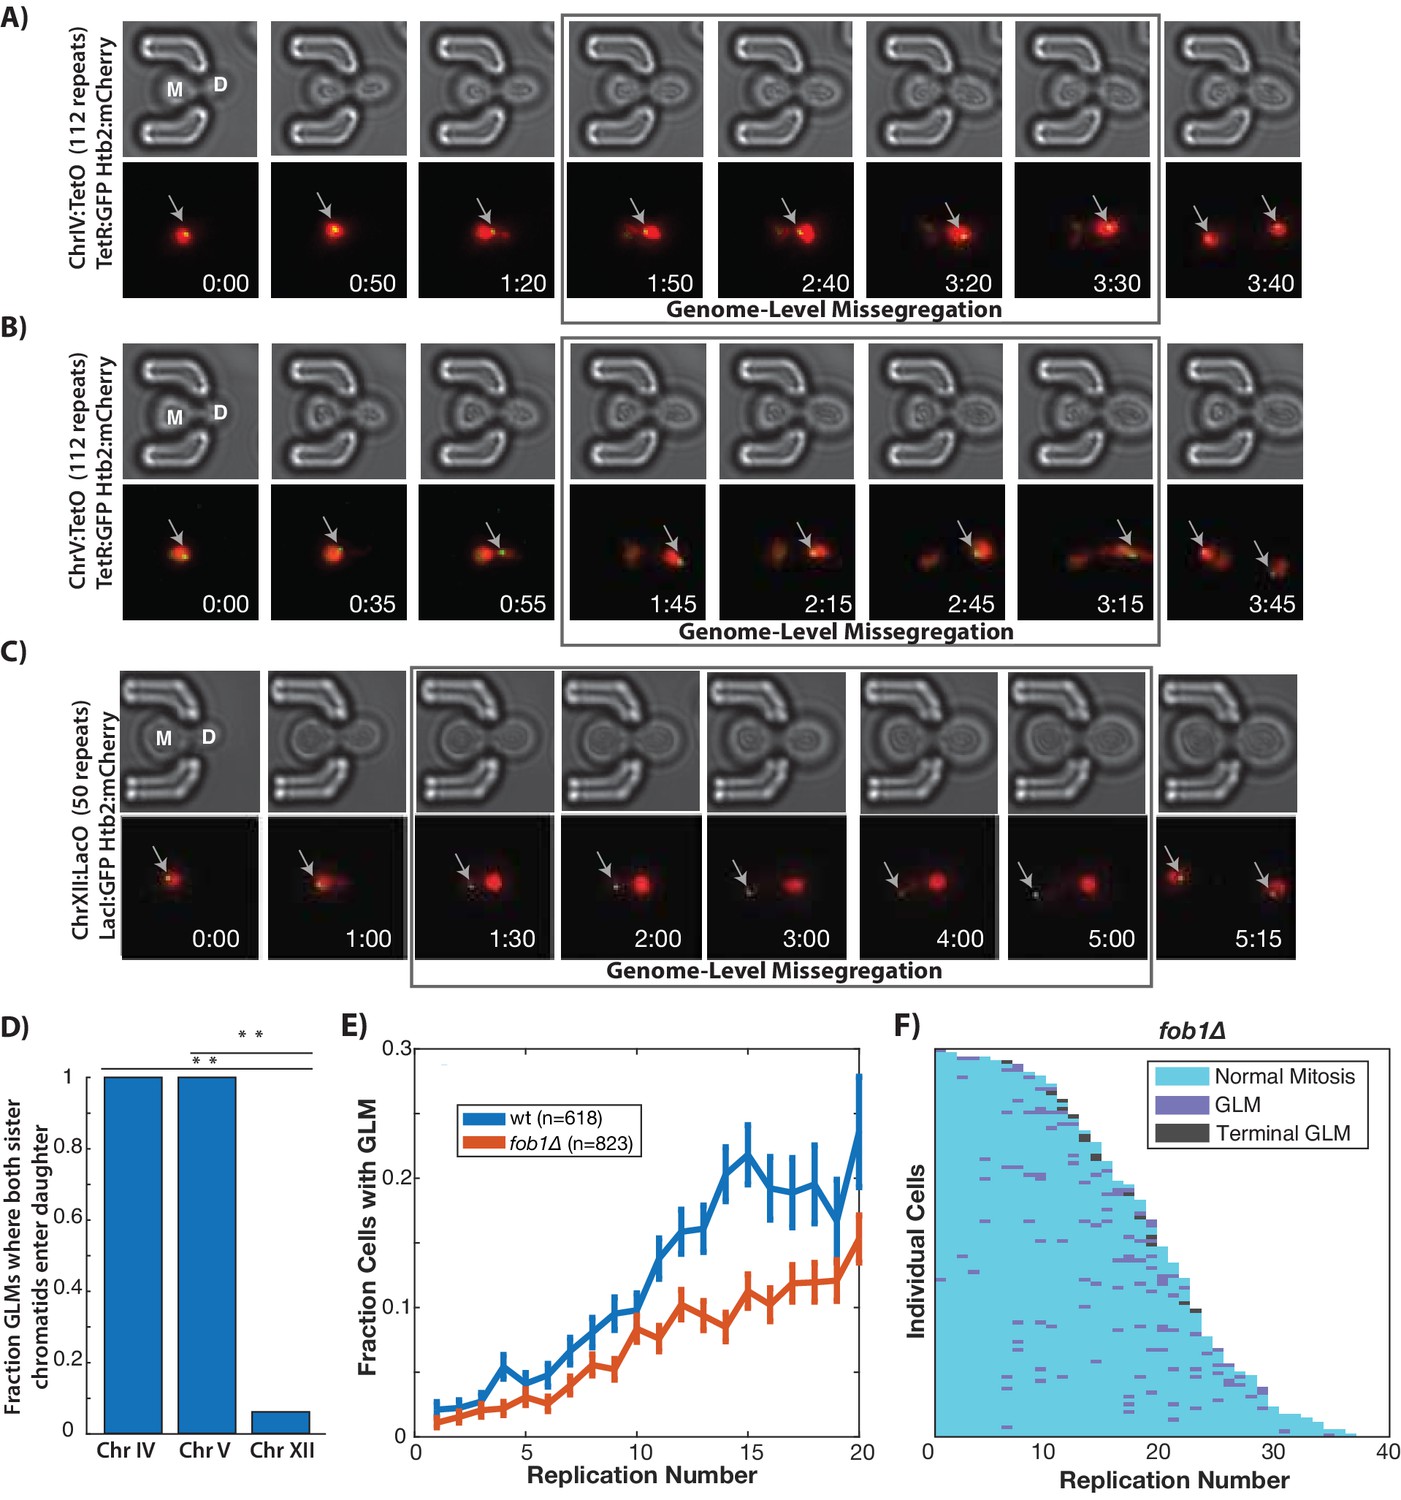
GLMs are linked to rDNA instability.
(A) Direct observation of Chr IV using TetR:GFP and TetO repeats on Chr IV. When the cell experiences a GLM, both chromatids of Chr IV move to the daughter along with the majority of the chromatin. Following correction and anaphase, a single green dot can be seen in both mother (M) and daughter (D) cells. Mother cell replicative age equals five at the beginning of this timelapse. GFP contains an NLS to increase the nuclear concentration, and is only localized to a dot at the site of the chromosome. (B) Direct observation of Chr V using TetR:GFP and TetO repeats on Chr V. When the cell experiences a GLM, both chromatids of Chr V move to the daughter along with the majority of the chromatin. Following the correction, a single green dot can be seen in both mother and daughter cells. Mother cell replicative age equals 19 at the beginning of this timelapse. (C) Direct observation of Chr XII using LacI:GFP and LacO repeats on Chr XII. Unlike the other chromosomes, when the cell experiences a missegregation event, both chromatids of Chr XII remain behind in the mother. Following correction, a single green dot can be seen in both mother and daughter cells. Mother cell replicative age equals eight at the beginning of this timelapse. The gray arrows mark the location of the labeled chromosomes. Times are indicated in hours:mins. (D) Quantification of the fraction of observed GLM events where each chromosome pair entered the daughter or remained in the mother (p<0.001 using bootstrapping with replacement). (E) Removal of FOB1 increases stability at the rDNA and reduces GLM rates, but fails to abolish an increase in GLMs during aging (curve shows mean and error bars are SEM, p<0.05 determined by Cochran Q-test). (F) Survival curve showing the GLM dynamics in individual fob1∆ mother cells. Each row is a separate mother cell, and the color indicates whether a cell experienced a normal cell cycle, GLM or terminal missegregation (n = 100 randomly selected cells).
Figure 2—figure supplement 1
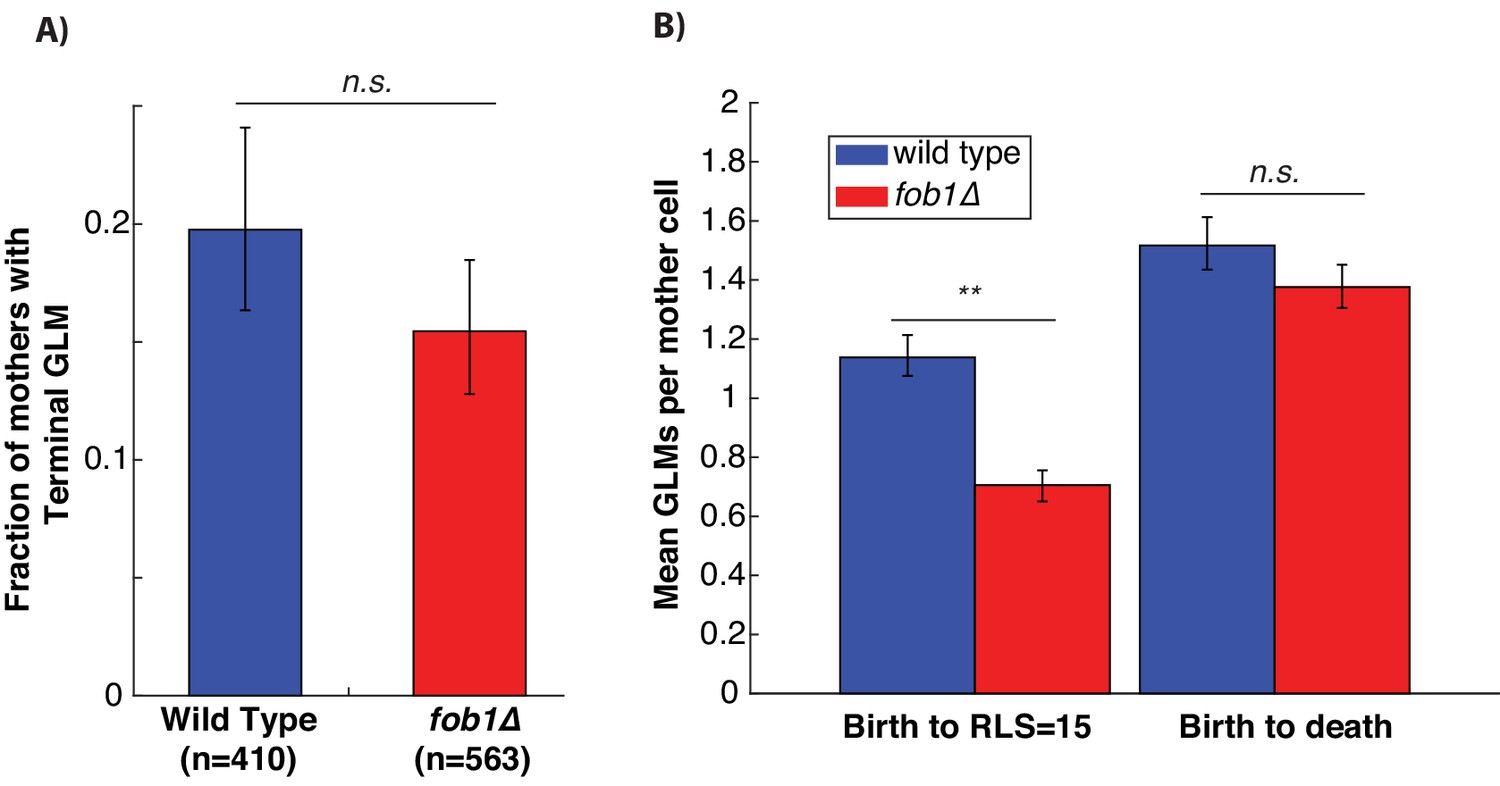
Stabilizing the rDNA by removing FOB1 doesn’t reduce the fraction of cells that experience terminal GLMs.
(A) The fraction of cells that undergoes a GLM that becomes terminal is unchanged between wild-type cells and fob1∆. Error bars generated by bootstrapping with replacement so that non-overlapping error bars show significance at the p=0.05 level. (B) From birth until the replicative age 15, fob1∆ cells experience on average fewer GLMs than wild-type. Over their whole replicative lifespan, however, fob1∆ cells experience on average the same number of GLMs as wild-type cells. Error bars generated by bootstrapping with replacement so that non-overlapping error bars show significance at the p=0.05 level, and ** indicates significance at the p<0.01 level.
Figure 2—figure supplement 2
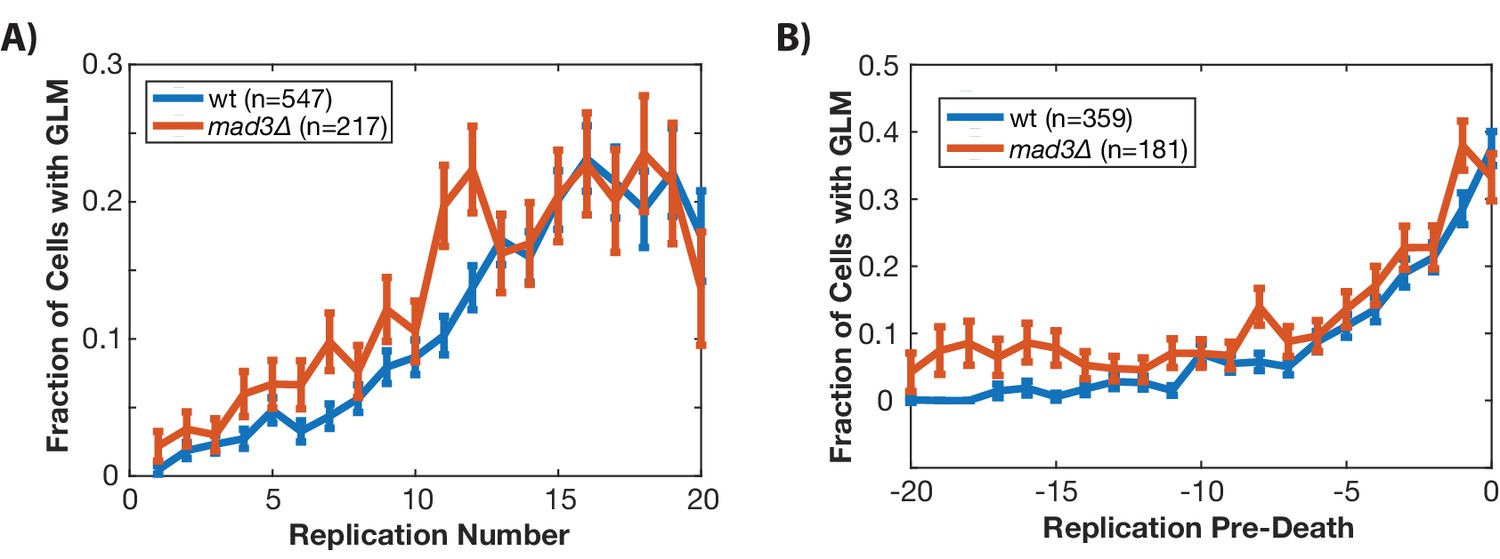
Removing MAD3 (mammalian BubR1) fails to eliminate the age-related increase in missegregation rate.
(A) Wild-type and mad3∆ cells experience a similar increase in genome level missegregation (GLM) events with age when looking at all cells. (B) The increase in GLM rate is similar when only comparing cells that die or senesce in the device and are aligned by death. All error bars are standard error.
Figure 3 with 1 supplement
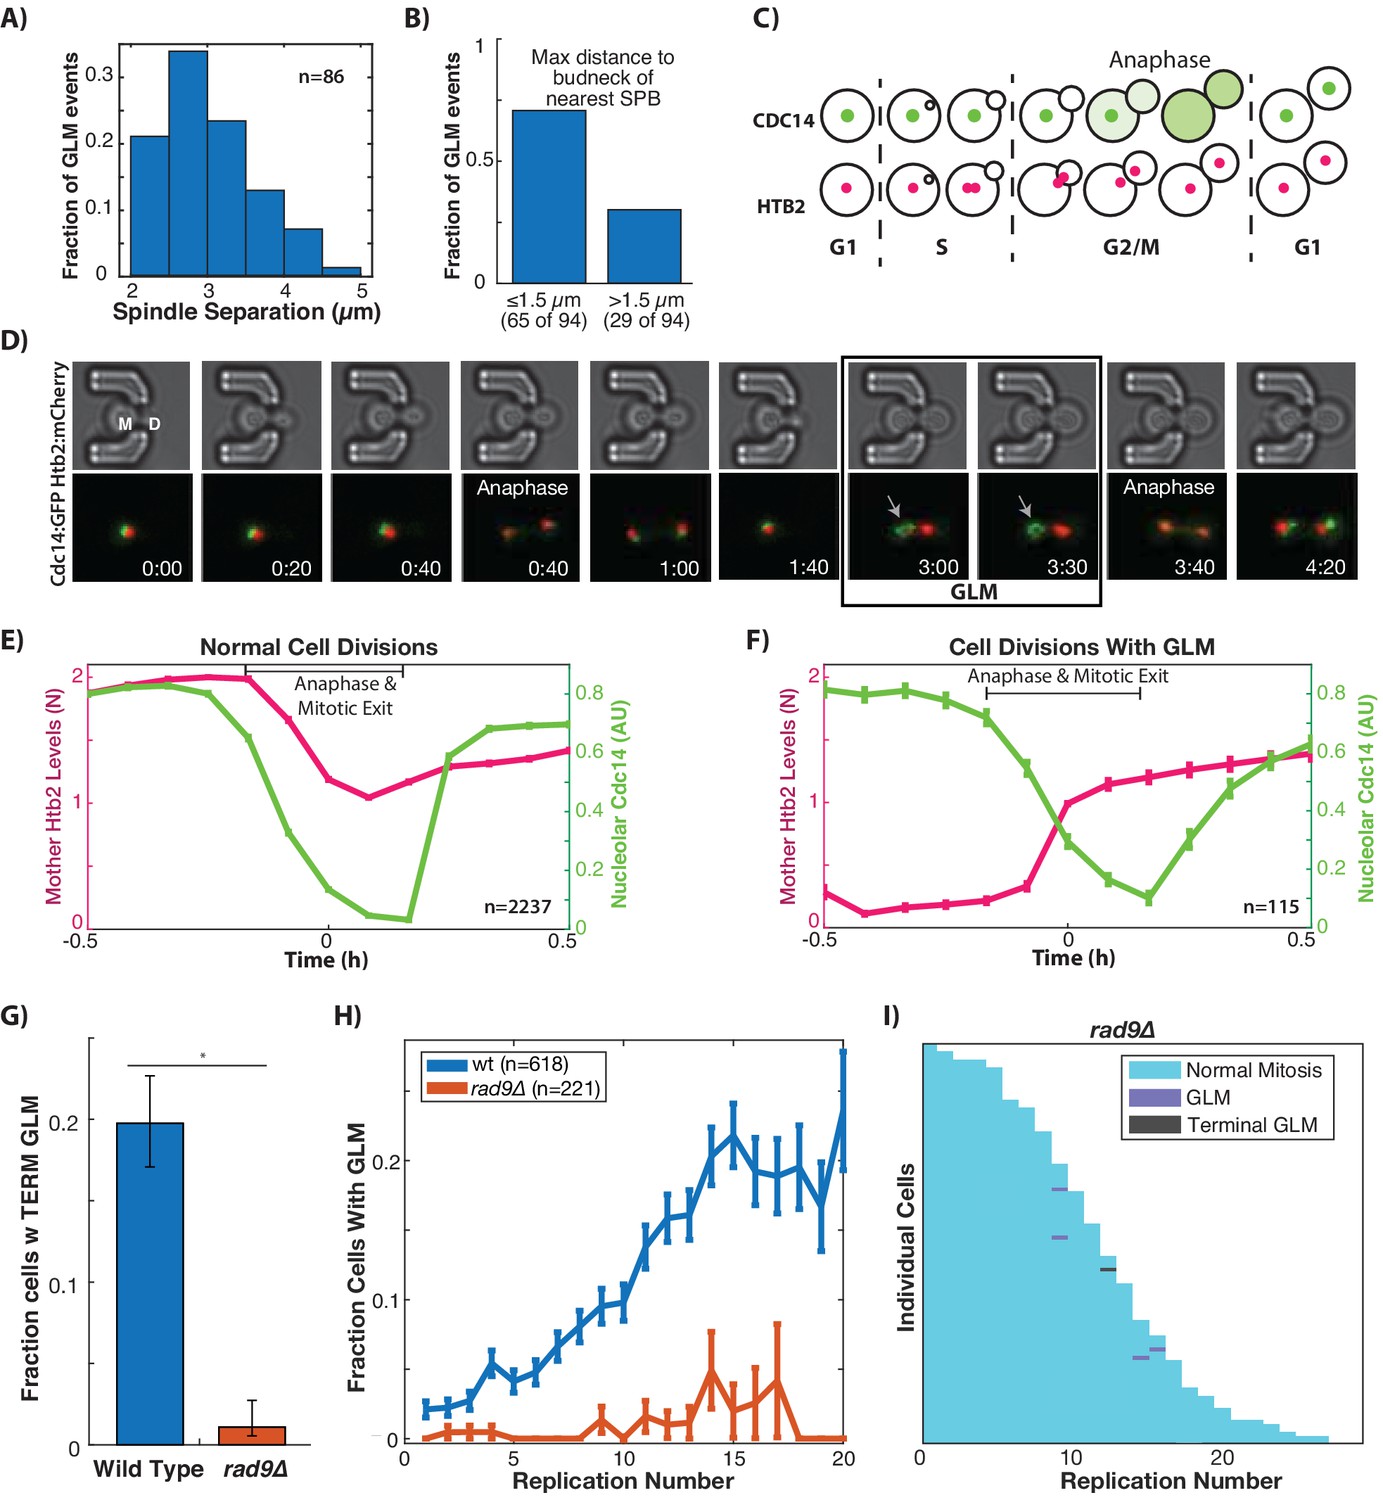
GLMs occur during arrest at the metaphase DNA checkpoint.
(A) Histogram of spindle pole separation for cells arrested during GLMs. Separation was measured at three timepoints for each cell, and the average for each cell was used for the histogram (n = 86). (B) Distance from nearest spindle pole body (SPB) to the bud neck during the GLM. Both SPB are in the daughter during these events. (C) Schematic showing Cdc14 dynamics during the cell cycle. Cdc14 is localized to the nucleolus, except during anaphase. (D) Timelapse images of a single cell containing Cdc14:GFP and Htb2:mCherry that goes through a normal division and then a division with a GLM. The arrow points to nucleolar localized Cdc14 during the GLM that is released to allow anaphase entry. See Video 7. Time is hours:minutes. (E) Plot shows average of single cell traces of cells undergoing normal cell divisions where both Cdc14 and Htb2 were imaged. Htb2 levels were normalized at the single cell level, so 1 is 1N, and cells cycles were aligned using Cdc14 dynamics. (F) Quantification of nucleolar Cdc14 in populations of cells confirms that anaphase entry is delayed in cells experiencing a GLM. Individual cells were aligned to time of correction event. Only GLMs that lasted >30 min were used, and error bars are standard error. (G) Mutants with compromised DNA damage checkpoint (rad9∆) have significantly reduced rates of terminal missegregations (H) Mutants with compromised DNA damage checkpoint (rad9∆) have no age-related increase in the GLM rate (p>0.05 determined by Cochran Q-test, plot shows mean and error bars are SEM). (I) Survival curve showing the significant reduction in GLM rates in individual rad9∆ mother cells. Each row is a separate mother cell, and the color indicates whether a cell experienced a normal cell cycle, GLM or terminal missegregation (n = 100 randomly selected cells).
Figure 3—figure supplement 1
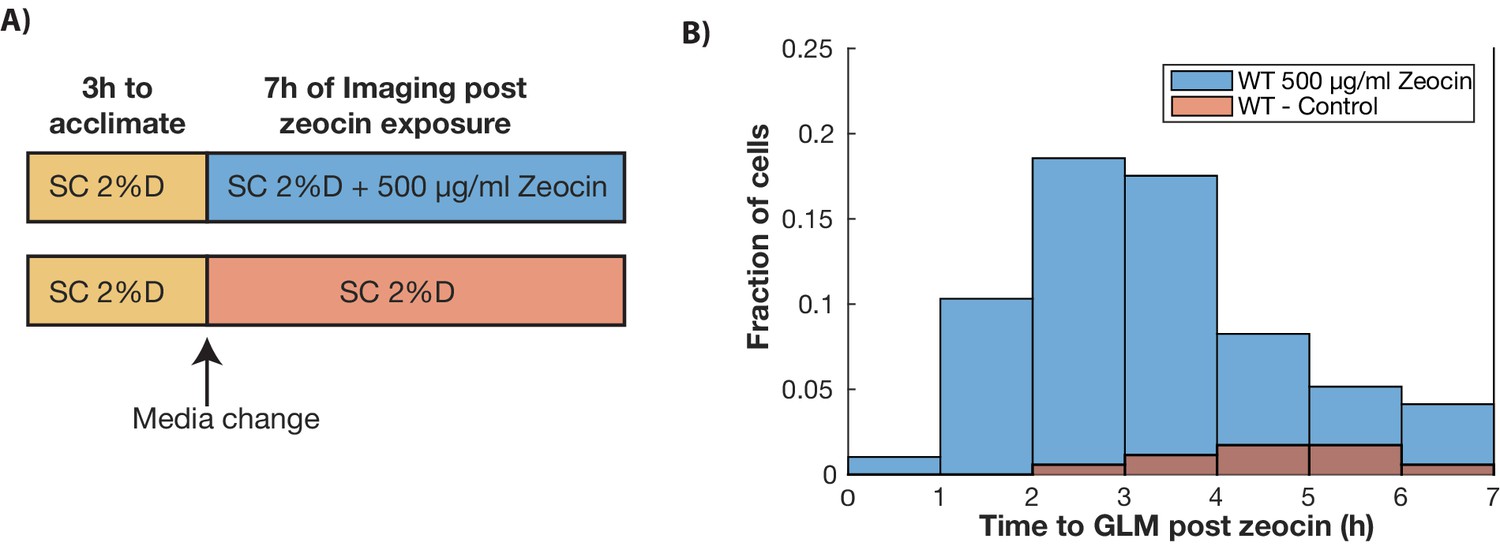
DNA damage in young cells results in GLMs.
(A) Experiment design. Wildtype cells expressing Htb2:mCherry were allowed to adjust to the device for 3 hr, and then exposed to 500 µg/ml of zeocin. Cells were then imaged for the following 7 hr. (B) Distribution of the times to the start of a GLM following exposure to either 500 µg/ml of zeocin (n = 99), or control (n = 175). Distributions are statistically different (p<0.01 using Student’s t-test).
Figure 4 with 1 supplement
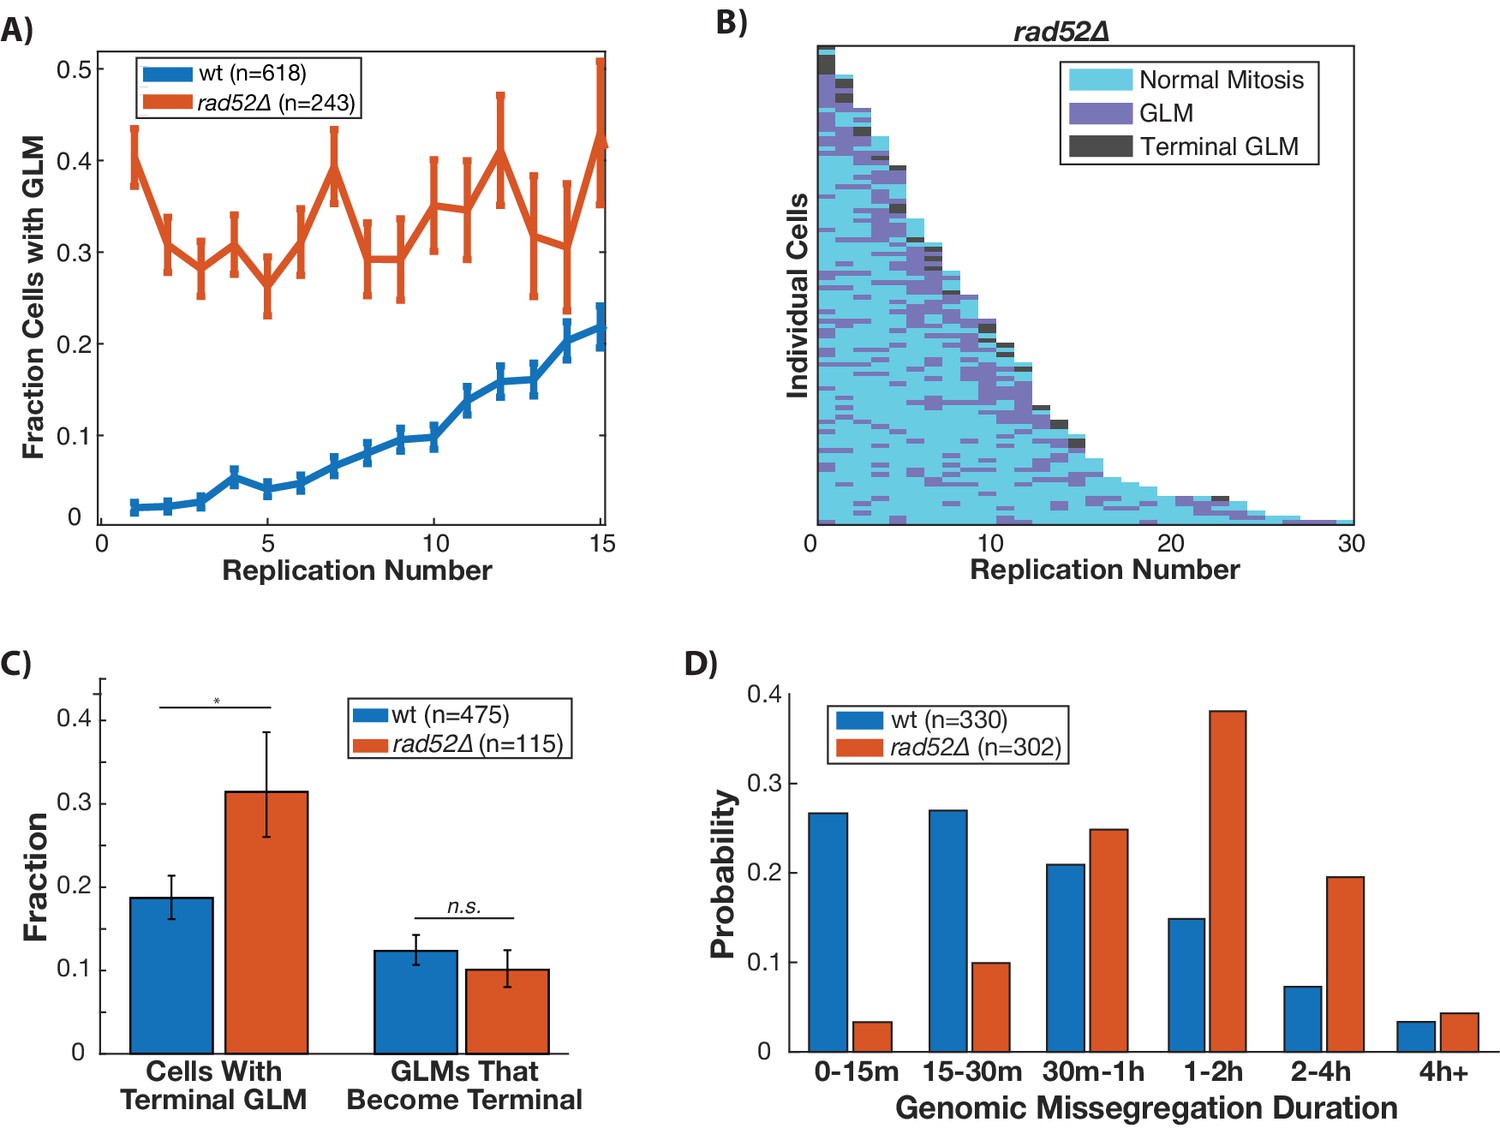
Disruption of homologous repair by deletion of RAD52 causes constant high rate of GLMs during aging.
(A) Rad52∆ mutants have a constant high rate of GLMs but do not show a significant age-related increase in GLMs (p>0.05 cochran q test). Lifespan only shown 0–15 divisions due to reduced lifespan of rad52∆ mutants. (B) Survival curve showing the significant increase in GLM rates in individual rad52∆ mother cells. Each row is a separate mother cell, and the color indicates whether a cell experienced a normal cell cycle, GLM or terminal missegregation (n = 100 randomly selected cells). (C) Rad52∆ cells are more likely than wild-type to experience a terminal GLM, but any individual GLM is not more likely to result a terminal missegregation. This suggests Rad52 is important for preventing GLMs, but not for ensuring genomic content is properly segregated. (D) Cells lacking RAD52 have a statistically significant increase in the length of time a GLM lasts relative to wild-type cells (n is the number of cell cycles quantified, p<0.01 Students t-test).
Figure 4—figure supplement 1
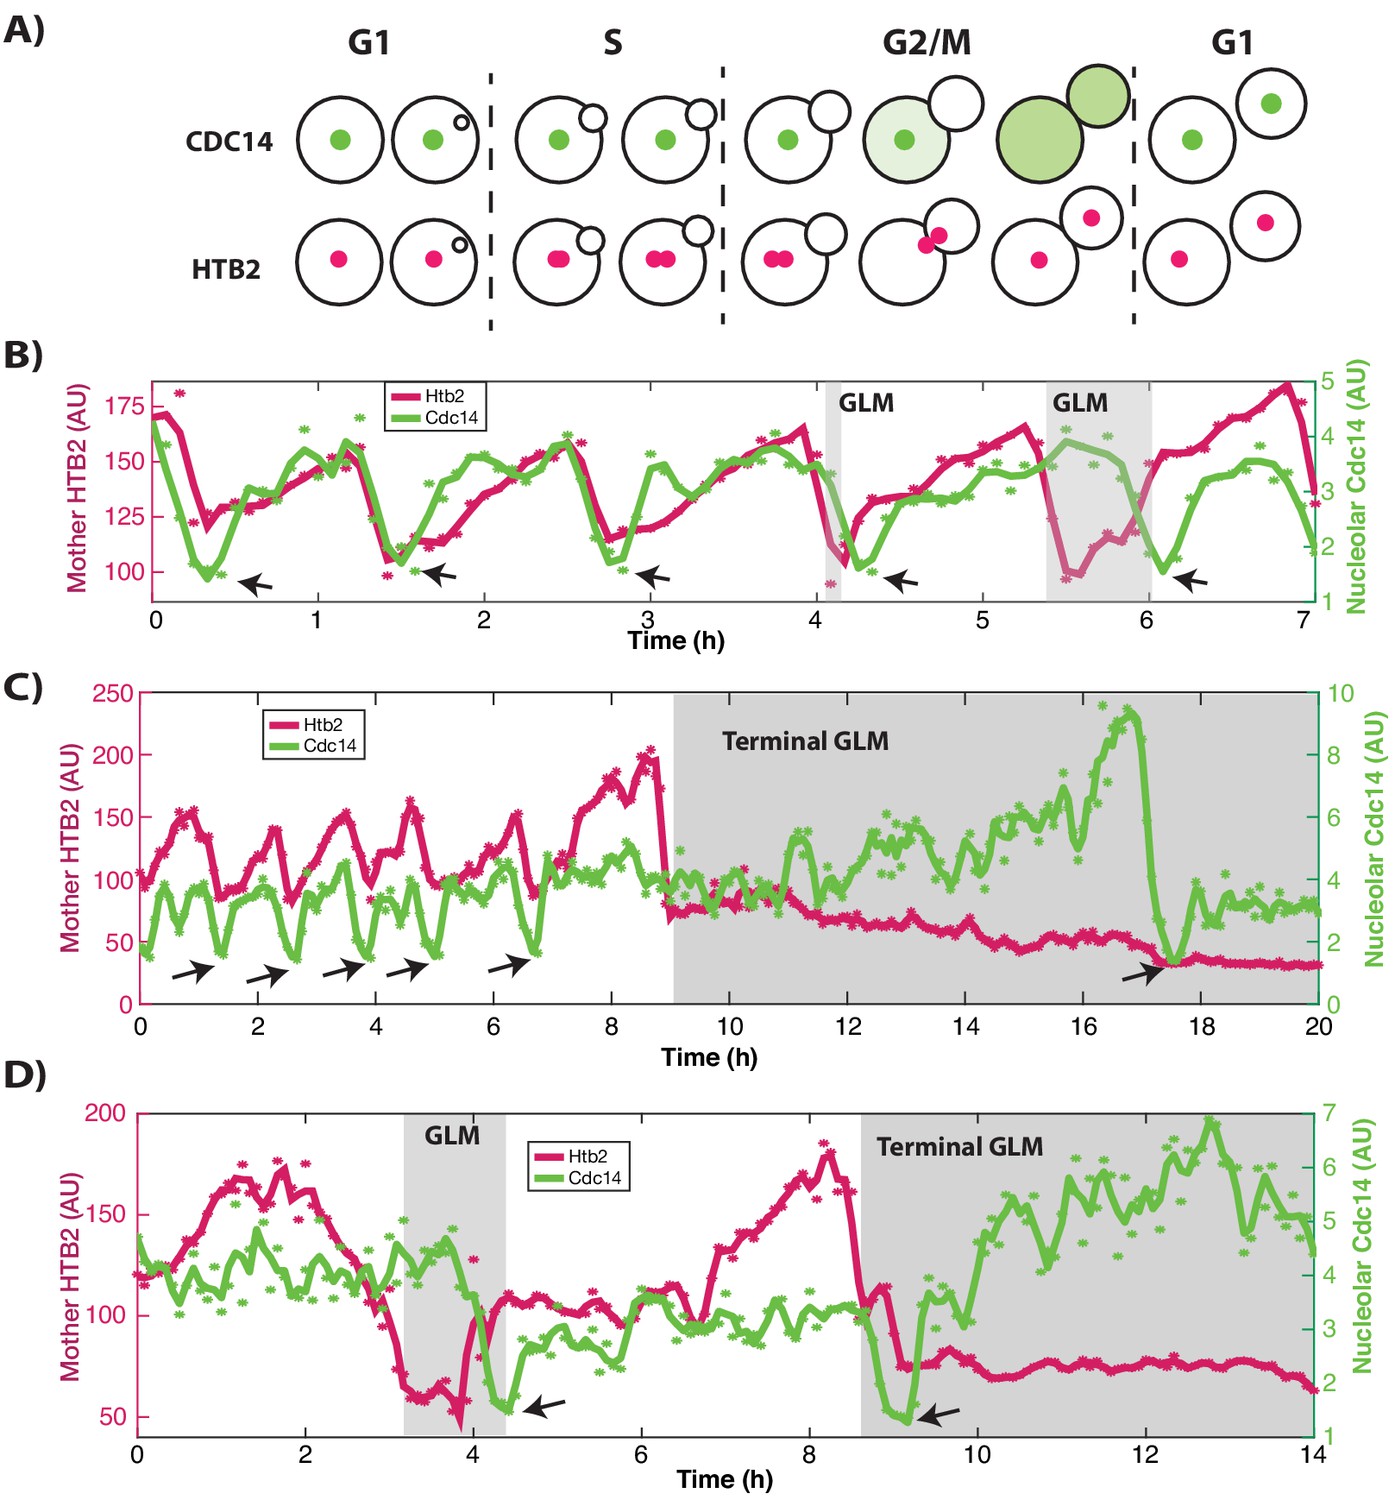
Cdc14 single cell traces showing terminal and corrected GLM events.
(A) Schematic showing cell cycle dynamics. Cdc14 is localized to the nucleolus during the majority of the cell cycle and exits it in two stages during mitosis to initiate anaphase. Cdc14 re-enters the nucleolus at the end of mitosis. (B) A representative trace of a single cell expressing Htb2:mCherry and Cdc14:GFP showing normal divisions and GLMs that are corrected. Histone levels (pink) increase, and then fall during mitosis. Arrows indicate the timepoints where Cdc14 is at a minima in the nucleolus. In normal divisions this coincides with the Htb2 minima. (*) indicate raw Htb2 and Cdc14 measurements, which were smoothed using a moving average and Savitzky-Golay smoothing respectively for legibility (solid lines). In the last two divisions, GLMs can be observed. (C) Representative trace of a single cell expressing Htb2:mCherry and Cdc14:GFP showing a terminal GLM. Cdc14 exits the nucleolus nearly eight hours after the GLM. (D) Representative trace of a single cell expressing Htb2:mCherry and Cdc14:GFP showing a GLM that is corrected (4 hr) and then a terminal GLM (9 hr).
Figure 5
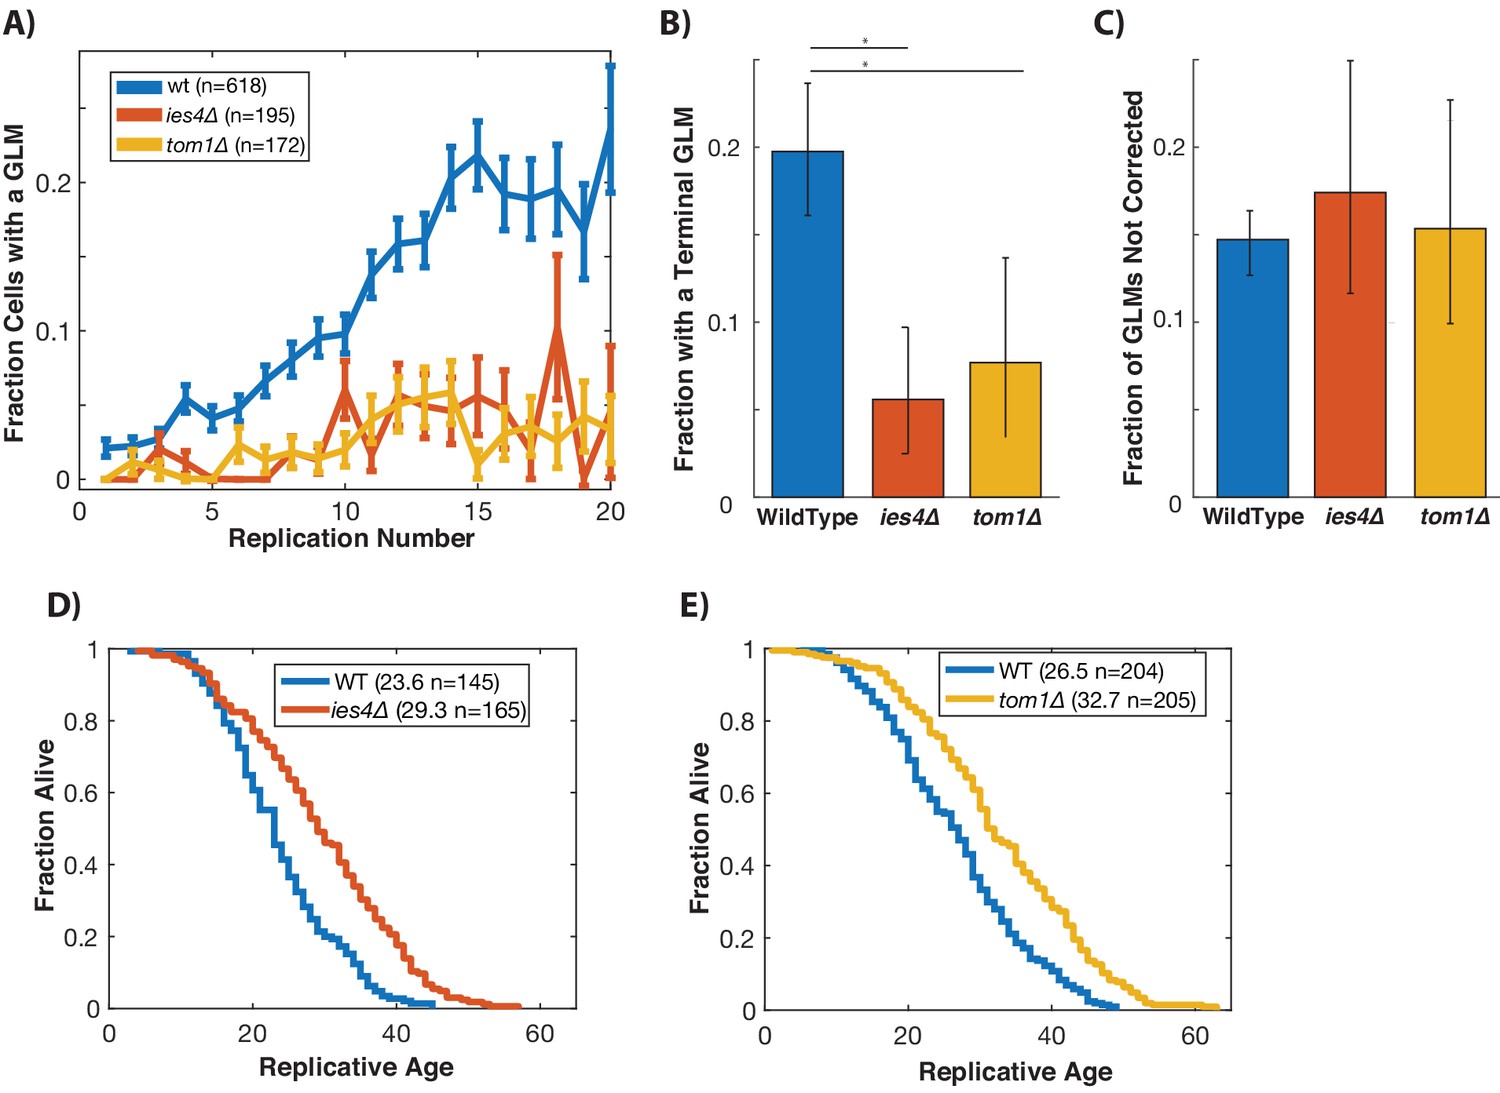
Preventing damage-induced histone degradation reduces age-associated GLMs.
(A) Cells with reduced ability to degrade histone proteins (ies4∆ and tom1∆) but do not show a significant age-related increase in GLMs (curve shows mean and error bars are SEM, p>0.05 both strains determined by Cochran Q-test). (B) The reduction in GLM rates also results in a reduction in the total number of cells that undergo a terminal missegregation. Error bars are confidence intervals generated by bootstrapping with replacement generated so that non-overlapping bars indicate confidence at the p=0.05 threshold. (C) The fraction of GLM events that are not corrected is unchanged in ies4∆ and tom1∆ cells. Error bars are confidence intervals generated by bootstrapping with replacement generated so that non-overlapping bars indicate confidence at the p=0.05 threshold. (D) Eliminating IES4 results in an increased replicative lifespan (p<0.001 log-rank). Legend shows mean RLS and number of cells measured by microdissection. E)As has been previously reported, deleting TOM1 results in an increased replicative lifespan (p<0.001 log-rank). Legend shows mean RLS and number of cells measured by microdissection.
Figure 6
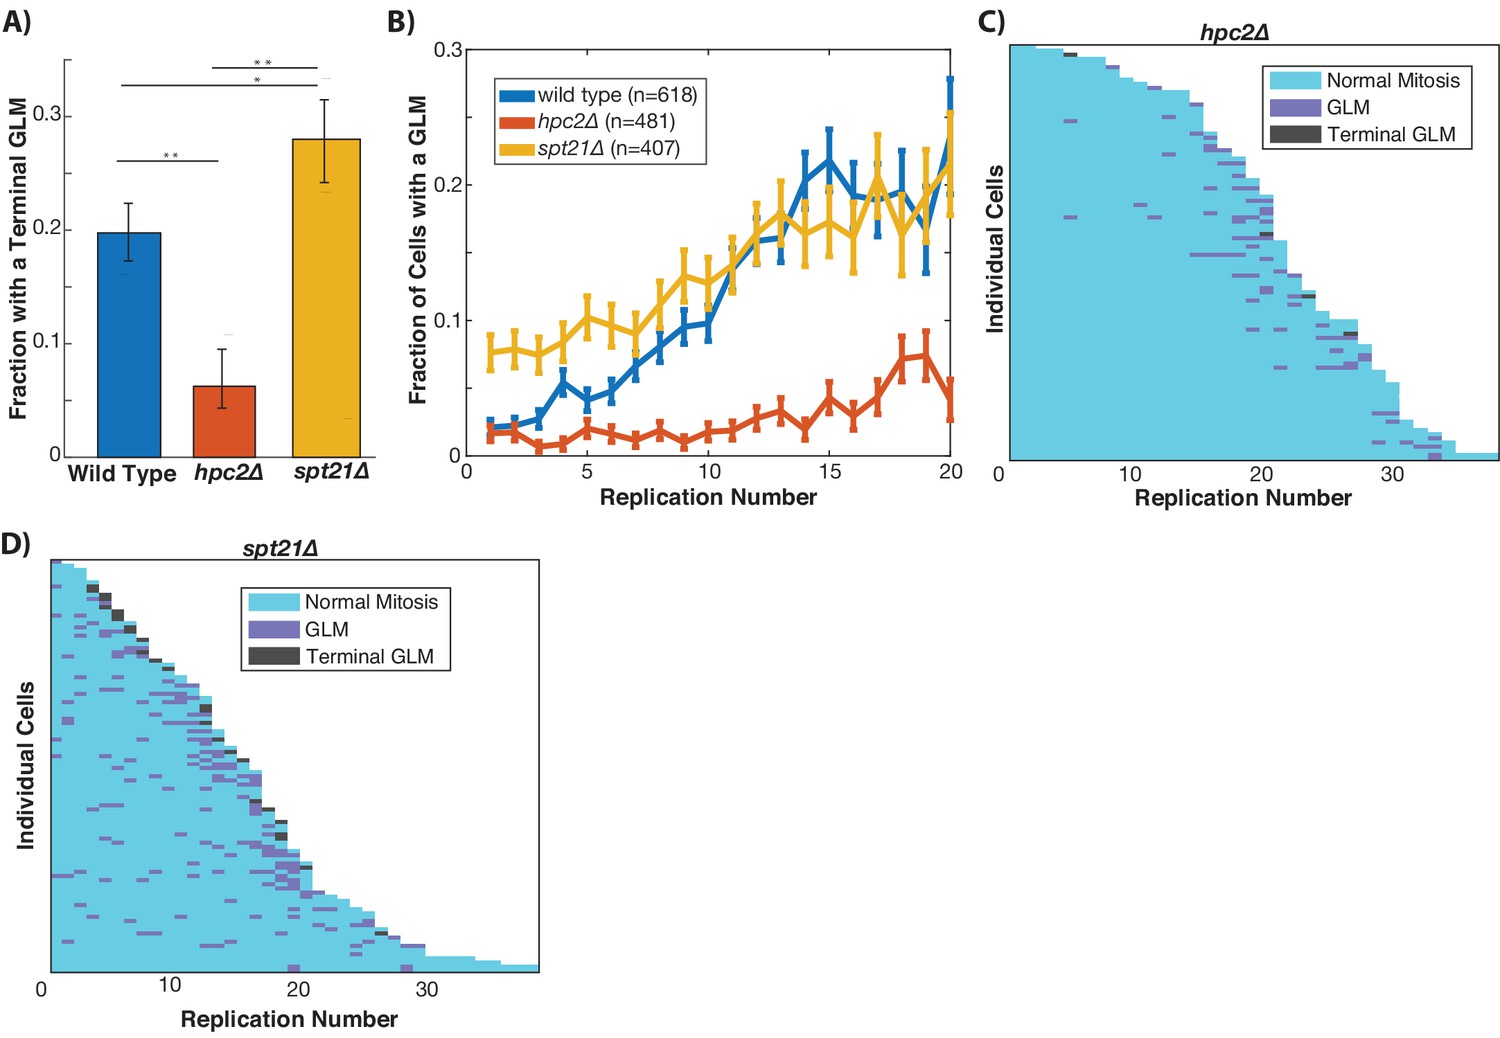
Histone transcription influences GLMs rates.
(A) Constitutive histone transcription (hpc2∆) significantly reduces GLM rates at the population level when compared with wild-type (p<0.001, **), while cells with reduced ability to transcribe histones (spt21∆) experience increased rates (p<0.05, *) compared with wild type cells. Error bars are confidence intervals generated by bootstrapping with replacement generated so that non-overlapping bars indicate confidence at the p=0.05 threshold. (B) At a population level, manipulating histone transcription affects GLM rates and cells with increased histone transcription (hpc2∆) do not show a significant age-related increase in GLMs (curve shows mean and error bars are SEM, p>0.05 for hpc2∆ determined by Cochran Q-test). Error bars are standard error. (C) Survival curve showing the significant reduction in GLM rates in individual hpc2∆ mother cells. Each row is a separate mother cell, and the color indicates whether a cell experienced a normal cell cycle, GLM or terminal missegregation (n = 100 randomly selected cells). (D) Survival curve showing the significant increase in GLM rates in individual hpc2∆ mother cells (n = 100 randomly selected).
Figure 7
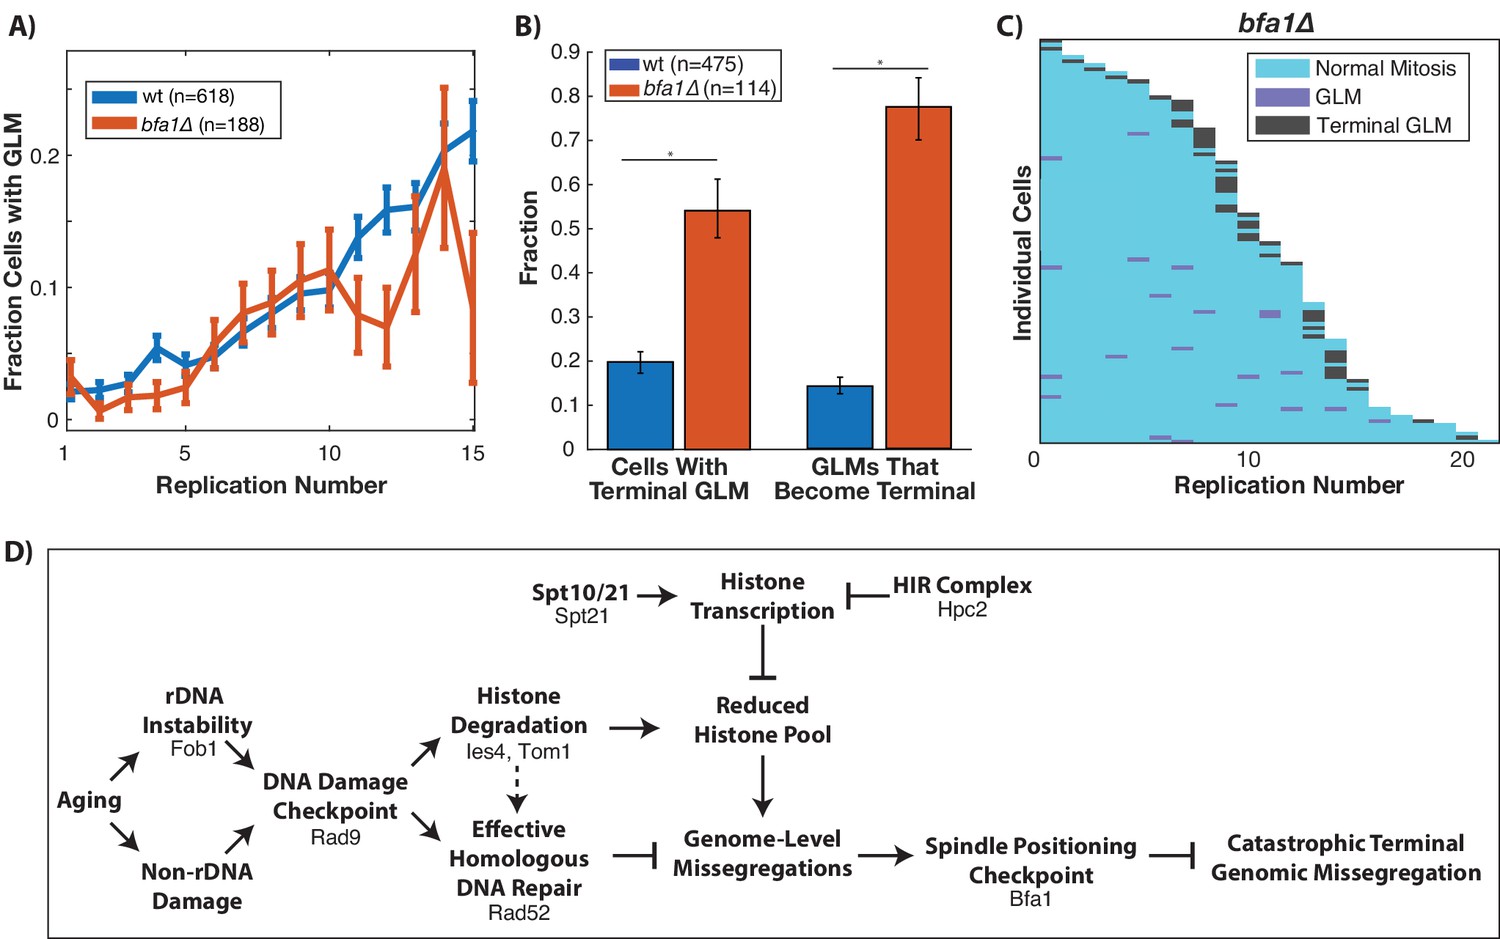
Correction of GLM events requires the spindle positioning checkpoint.
(A) Removal of BFA1 disrupts the spindle positioning checkpoint, but fails to abolish an increase in GLMs during aging (curve shows mean and error bars are SEM, p<0.05 determined by Cochran Q-test). Lifespan only shown 0–15 divisions due to reduced lifespan of bfa1∆ mutants. (B) Compared with wildtype, a bfa1∆ strain has significant increases in both the fraction of cells that experience terminal missegregations and the likelihood that an individual GLM will become terminal. Error bars that do not overlap show significance at the p=0.05 level and were generated by bootstrapping with replacement. N values are number of cells. (C) The difference in bfa1∆ GLM dynamics is stark at the single cell level where most GLMs result in terminal missegregations and most mother cells die because of terminal GLMs. Each row is a separate mother cell, and the color indicates whether a cell experienced a normal cell cycle, GLM or terminal missegregation (n = 100 randomly selected cells). (D) Model for age-associated GLMs that links age associated changes in DNA damage to failures during mitosis. Proteins included in the diagram at each stage are those that have been genetically perturbed in this work.
Videos
Video 1
Normal divisions and GLM dynamics in a strain expressing Htb2:mCherry and Nup49:GFP.
Cell 1: This cell undergoes six divisions, with histone and nuclear envelope behavior that is characteristic of young, healthy cells. Cell 2: Corrected GLM. initial GLM can be seen at timepoint 3 hr:30 min, and the correction at 8 hr:30 min. Following correction, the mother cell is able to bud again at 12 hr, but the nuclear morphology of the daughter (for example, at 16 hr) is significantly altered. Cell 3: Terminal GLM. At 3 hr, the mother cell can be seen to undergo a missegregation event. At 15 hr:30 min, the daughter cell buds and can be seen to undergo mitosis, indicating that the daughter cell has separated from the mother. The mother cell eventually dies at 40 hr. The blue arrow points to the mother cell during timepoints where it is experiencing the GLM event. Timestamp is Hours:Min.
Video 2
Normal divisions and GLM dynamics in strain expressing Htb2:mCherry and Spc72:GFP.
Cell 1: Spindle pole dynamics during normal cell divisions. Cell 2: A normal healthy division, followed by GLM that is corrected. The two green dots indicate the spindle poles, and at numerous timepoints both poles enter the daughter cell. Cell 3: Terminal GLM. The two green dots indicate the spindle poles, and both poles enter the daughter around 2h40m. The poles move around and are highly active, with one at times reentering the mother cell. Finally, at 5 hr:20 m, the daughter cell is washed away indicating it has fully separated from the mother and that this is a terminal GLM. The blue arrow points to the mother cell during timepoints where it is experiencing the GLM. Timestamp is Hours:Min.
Video 3
Normal divisions followed and GLMs in a strain expressing Htb2:mCherry and Myo1:GFP.
Cell1: The mother cell undergoes four normal divisions, and on the fifth (at timepoint 7 hr:35 min), it experiences a GLM. The bud neck is clearly maintained until the retrograde transport occurs at 12 hr. Following this event, the bud neck is quickly removed, and is completely gone by 12 hr:15 min. Cell 2: The bud neck is clearly maintained until the retrograde transport occurs at 2 hr:40 min. Following this event, the bud neck is quickly removed, and is completely gone by 2 hr:55 min. The blue arrow points to the mother cell during timepoints where it is experiencing a GLM. Timestamp is Hours:Min.
Video 4
Normal divisions and GLM dynamics in a strain expressing Htb2:mCherry and Tub1:GFP.
Cell 1: The mother cell undergoes four divisions normally and on the fifth, at timepoint 7 hr:50 min it experiences a missegregation event that is resolved correctly at 10 hr:30 min. Cell 2: Terminal GLM. At timepoint 3 hr:15 min the mother experiences a missegregation event, and both the chromatin and microtubules can be seen entering the daughter cell. At 7 hr:25 min the daughter cell is washed away indicating the cell has completed cytokinesis. The blue arrow points to the mother cell during timepoints where it is experiencing the GLM. Timestamp is Hours:Min.
Video 5
DNA co-localizes with tagged histones through mitosis and during a GLM.
Cells expressing Htb2:mCherry were stained with Hoechst 3342, a live DNA stain. The first part of the video shows an overlay of red (Htb2:mCherry) and blue (Hoechst 3342), and the second shows the channels separated. Cell 1: In a normal cell cycle, the histones co-localize with the DNA, and both increase or decrease in fluorescence in the mother cell simultaneously. Cell 2: During a GLM the histones co-localize with the DNA, and both increase or decrease in fluorescence in the mother cell simultaneously.
Video 6
Chromosome dynamics during GLMs.
Cell 1: ChrIV dynamics during a GLM. Cell is expressing Htb2:mCherry and TetR:GFP, and has TetO repeats inserted into ChrIV. The Chromosome IV sister chromatids clearly move into the daughter with the majority of the genome. Cell 2: ChrV dynamics during a GLM. Cell is expressing Htb2:mCherry and TetR:GFP, and has TetO repeats inserted into ChrV. The Chromosome V sister chromatids clearly move into the daughter with the majority of the genome. Cells 3 and 4: ChrXII dynamics during a GLM. Cell is expressing Htb2:mCherry and LacI:GFP, and has LacO repeats inserted into ChrXII. The Chromosome XII sister chromatids clearly remain behind despite the majority of the genome entering the daughter cell. For all movies and cells, sister chromatids separate simultaneous with anaphase initiation and correction of the GLM. Sister chromatids can then be identified in both mother and daughter cells. The blue arrow points to the mother cell during timepoints where it is experiencing the GLM. Timestamp is Hours:Min.
Video 7
Normal divisions and GLM dynamics in a strain expressing Htb2:mCherry and Cdc14:GFP.
Cell 1: Cdc14 dynamics during normal cell divisions. Cell 2: Cdc14 remains remains localized to the nucleolus even when the cell experiences a GLM. The exit of Cdc14:GFP from the nucleolus at 2 hr coincides with the correction. The blue arrow points to the mother cell during timepoints where it is experiencing the GLM. Timestamp is Hours:Min.
Additional files
-
Supplementary file 1
List of strains and genotypes used in this study.
- https://doi.org/10.7554/eLife.50778.025
-
Supplementary file 2
List of replicative lifespans for strains used.
- https://doi.org/10.7554/eLife.50778.026
-
Transparent reporting form
- https://doi.org/10.7554/eLife.50778.027
Download links
A two-part list of links to download the article, or parts of the article, in various formats.
Downloads (link to download the article as PDF)
Open citations (links to open the citations from this article in various online reference manager services)
Cite this article (links to download the citations from this article in formats compatible with various reference manager tools)
DNA damage checkpoint activation impairs chromatin homeostasis and promotes mitotic catastrophe during aging
eLife 8:e50778.
https://doi.org/10.7554/eLife.50778


