Amyloid and tau accumulate across distinct spatial networks and are differentially associated with brain connectivity
- Karolinska Institute, Sweden
- Lund University, Sweden
- Alzheimer Center, VU University Medical Center, Netherlands
- Skåne University Hospital, Sweden
- Memory Clinic, Skåne University Hospital, Sweden
Figures
Figure 1
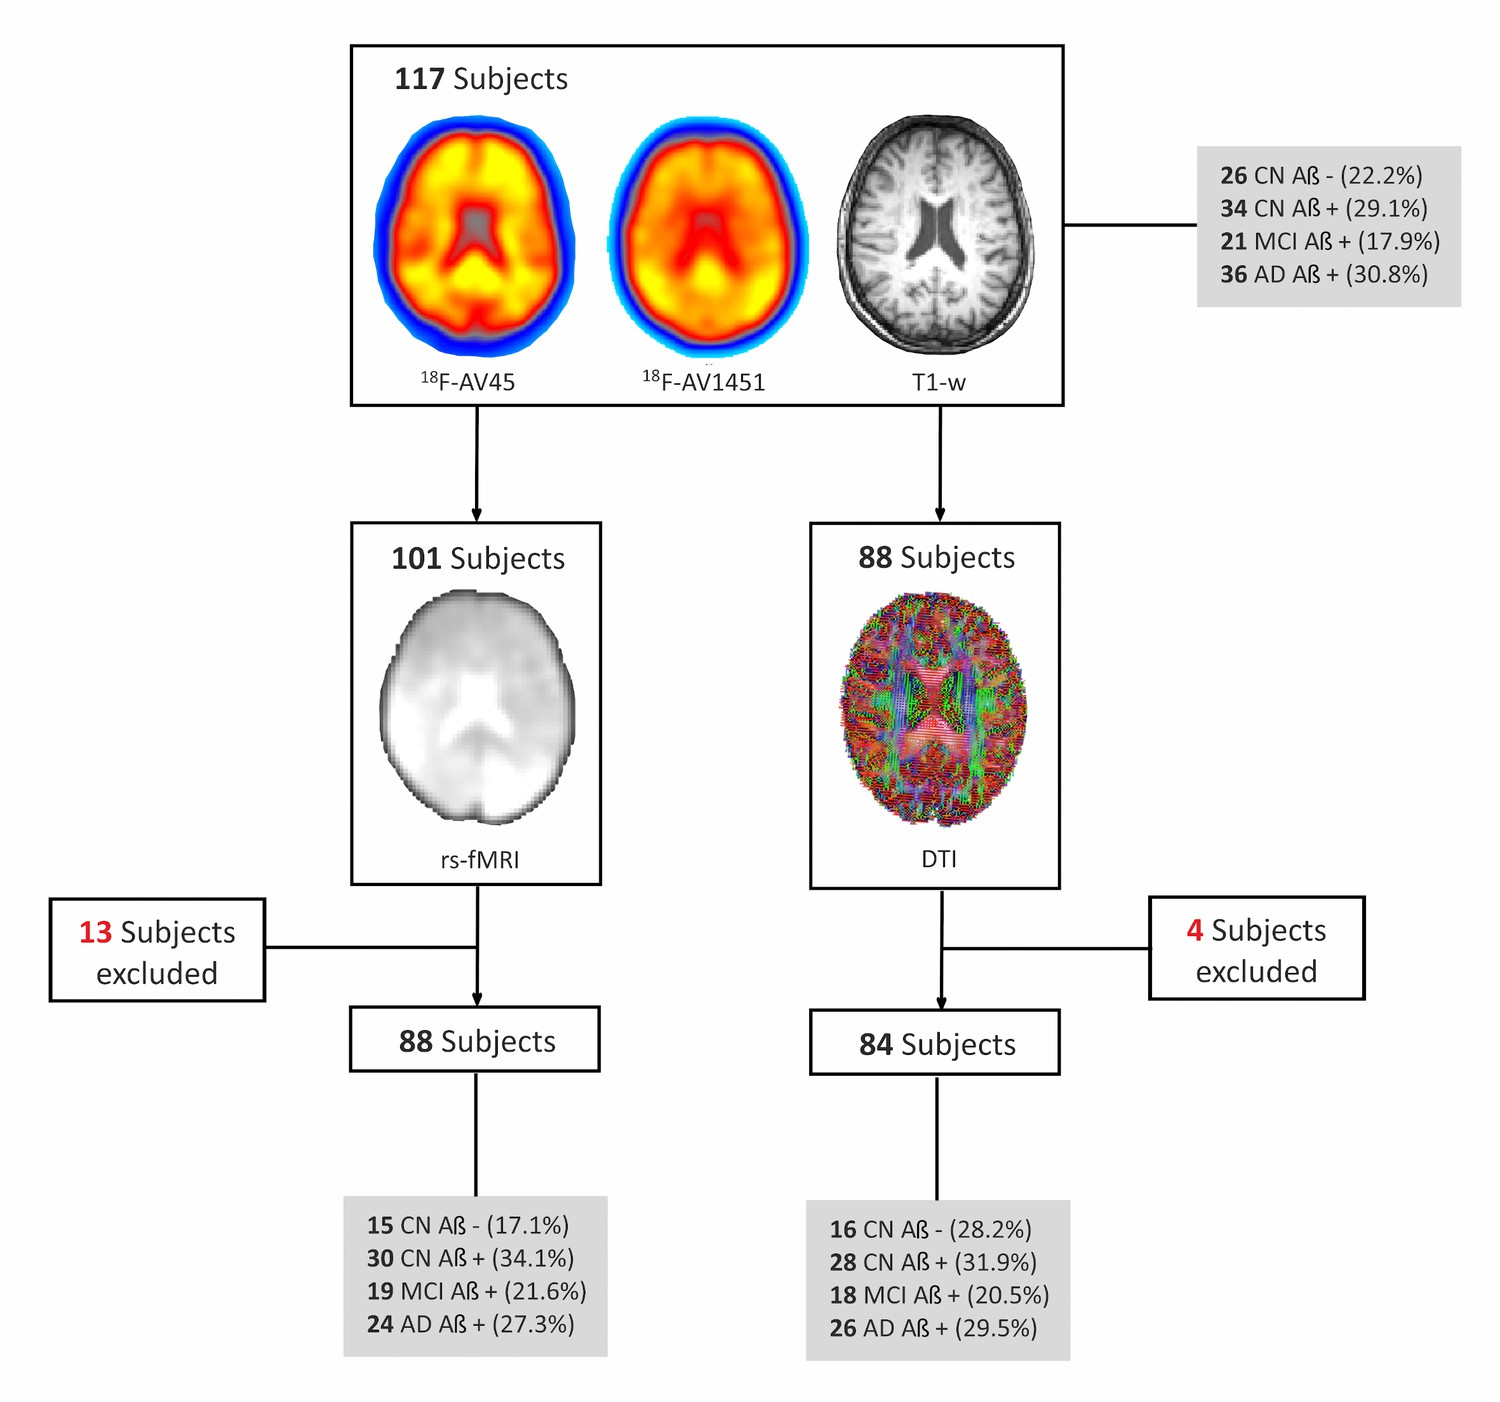
Flow-chart of imaging sequences available for the whole cohort.
All subjects included in the study had a 18F-Flutemetamol PET, 18F-Flortaucipir (18F-AV1451) PET and T1-weighted (T1–w) MRI scans. In addition, a subsample (n = 101) also underwent resting-state functional MRI (rs-fMRI), of which 13 had to be excluded due to errors in spatial normalization or excessive head motion (see Materials and methods) so the final sample with rs-fMRI was 88 subjects. Finally, a subsample of subjects (n = 88) that had 18F-Flutemetamol PET, 18F-AV1451 PET and T1-w scans also underwent diffusion tensor imaging (DTI). Four subjects were excluded from the DTI subsample given they were outliers in white matter integrity measures. CN, cognitively normal; MCI, mild cognitive impairment; AD, Alzheimer’s disease; amyloid negative (Aβ-); amyloid positive (Aβ+).
Figure 2 with 4 supplements
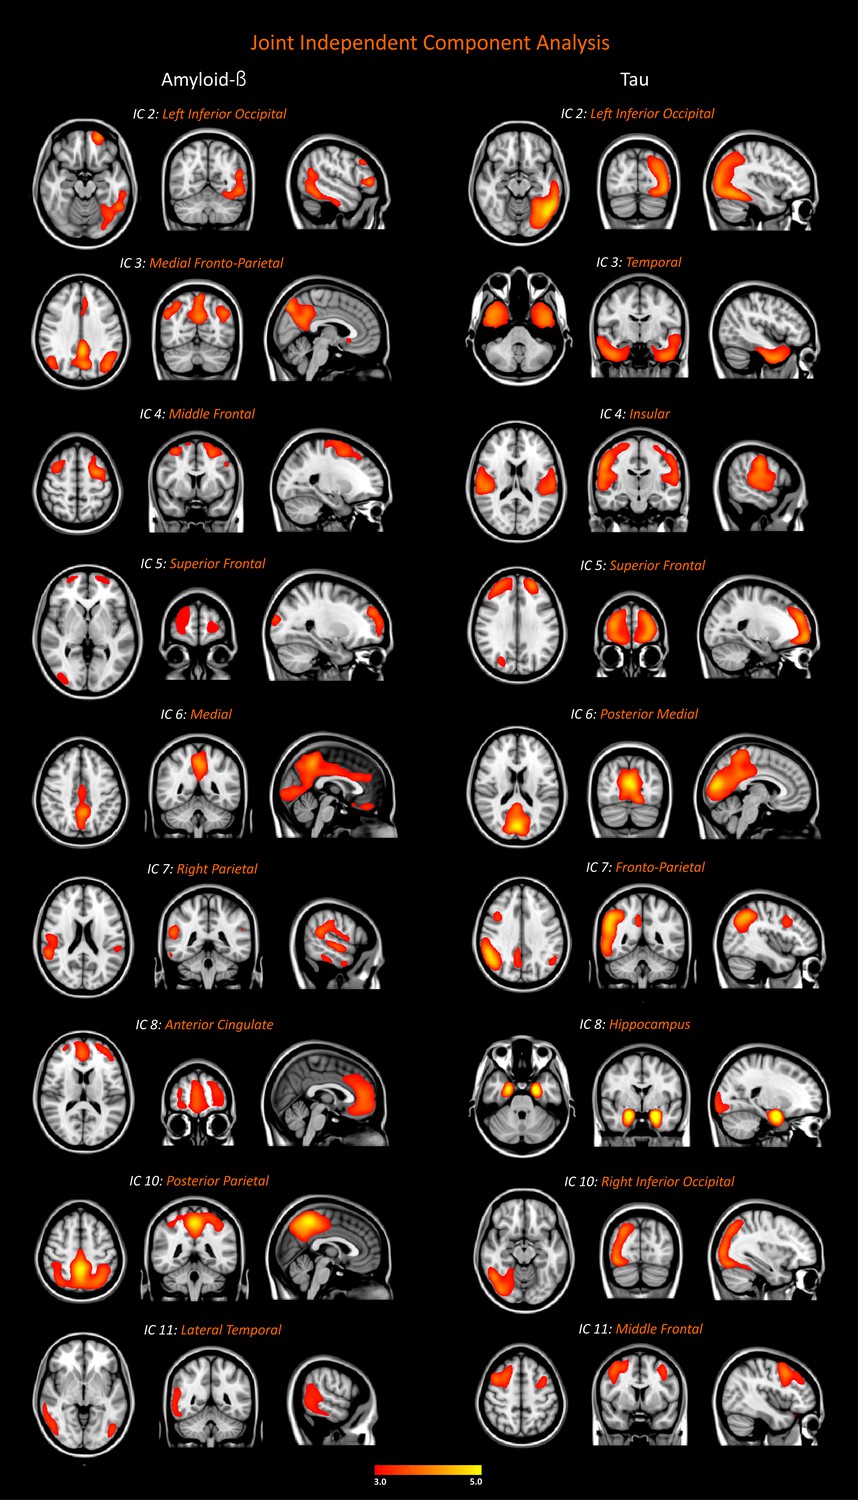
Networks of amyloid-β and tau accumulation in the whole cohort.
We identified nine joint independent components (ICs) for amyloid-β and tau in the analyses of 18F-Flutemetamol and 18F-Flortaucipir PET data in the entire sample of 117 subjects (26 amyloid-β negative cognitively normal subjects, 34 amyloid-β positive cognitively normal subjects, 21 patients with mild cognitive impairment, 36 patients with Alzheimer’s disease). These components were thresholded with a z-score >2.0, which corresponds to a two-tailed significance value of p<0.05. Inclusion and exclusion criteria for the subjects included in this analysis can be found in Materials and methods.
Figure 2—figure supplement 1

Excluded amyloid-β and tau components.
The components were thresholded with a z-score >2.0.
Figure 2—figure supplement 2
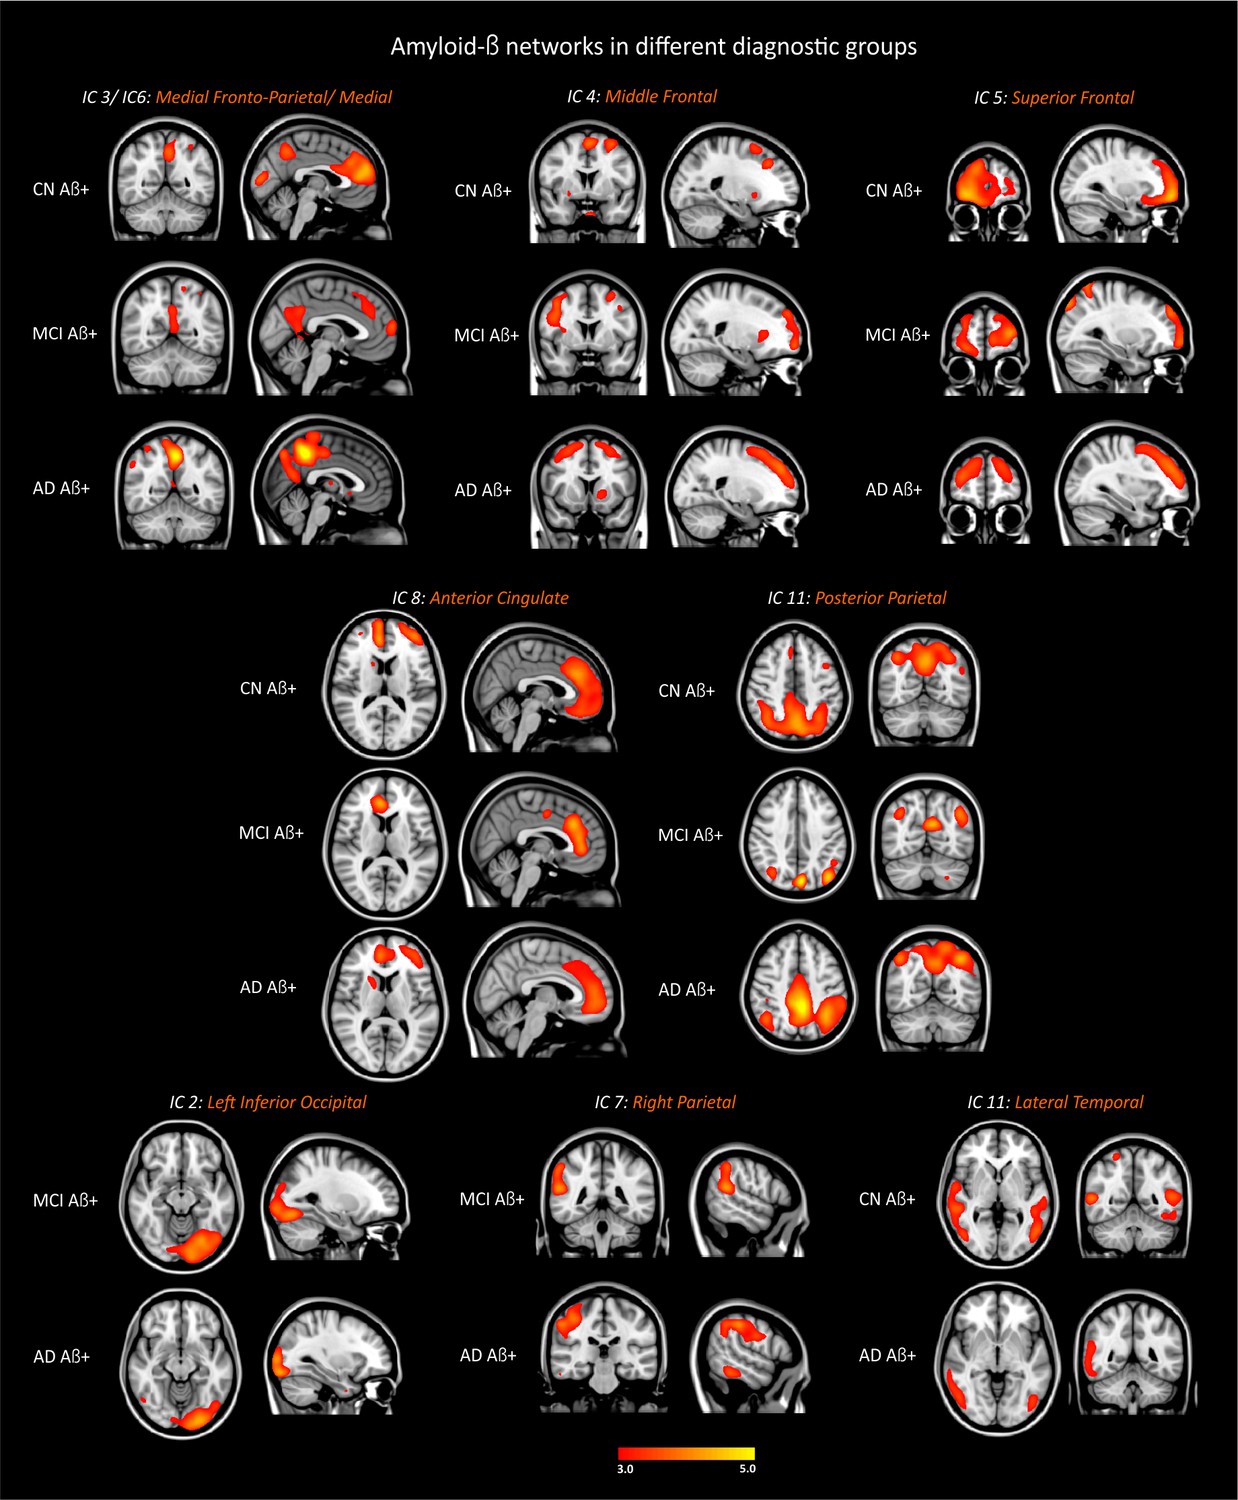
Amyloid-β networks in different groups.
CN Aβ+, cognitively normal subjects with amyloid pathology (n = 34); MCI Aβ+, mild cognitive impairment patients with amyloid pathology (n = 21); AD Aβ+, patients with Alzheimer’s disease dementia with amyloid pathology (n = 36). The components were thresholded with a z-score >2.0.
Figure 2—figure supplement 3
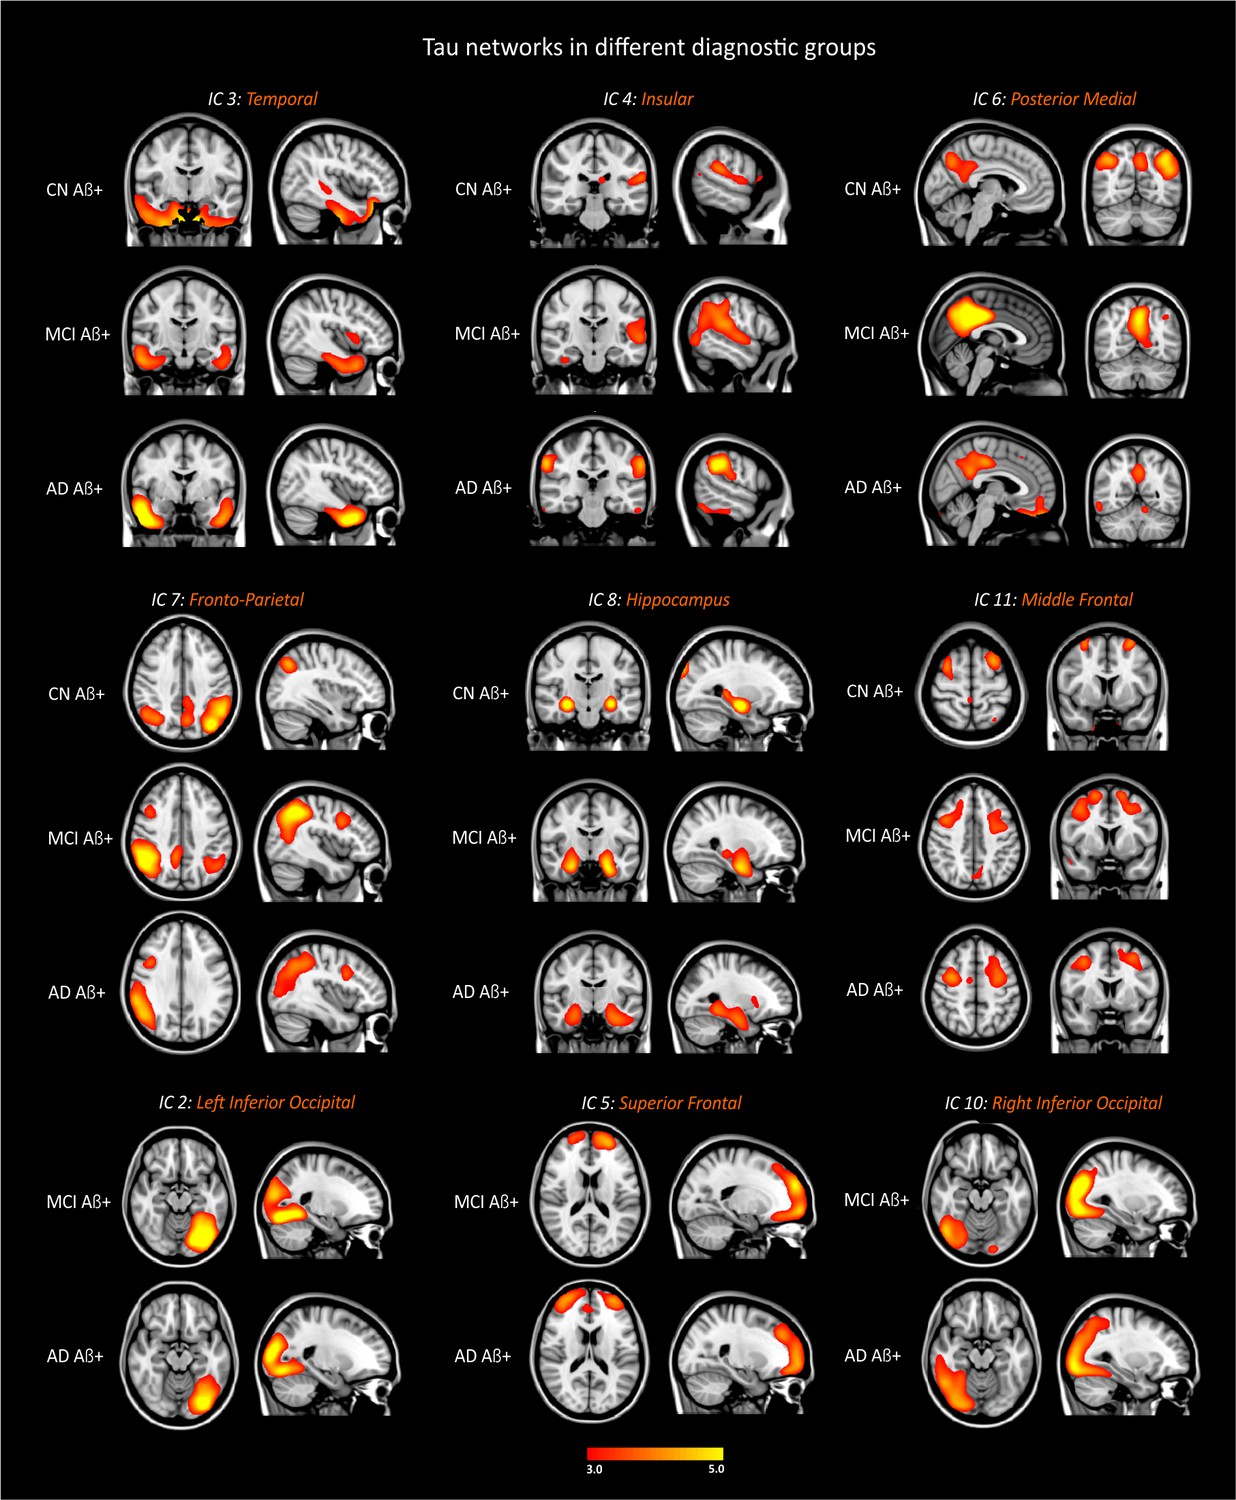
Tau networks in different groups.
CN Aβ+, cognitively normal subjects with amyloid pathology (n = 34); MCI Aβ+, mild cognitive impairment patients with amyloid pathology (n = 21); AD Aβ+, patients with Alzheimer’s disease dementia with amyloid pathology (n = 36). The components were thresholded with a z-score >2.0.
Figure 2—figure supplement 4
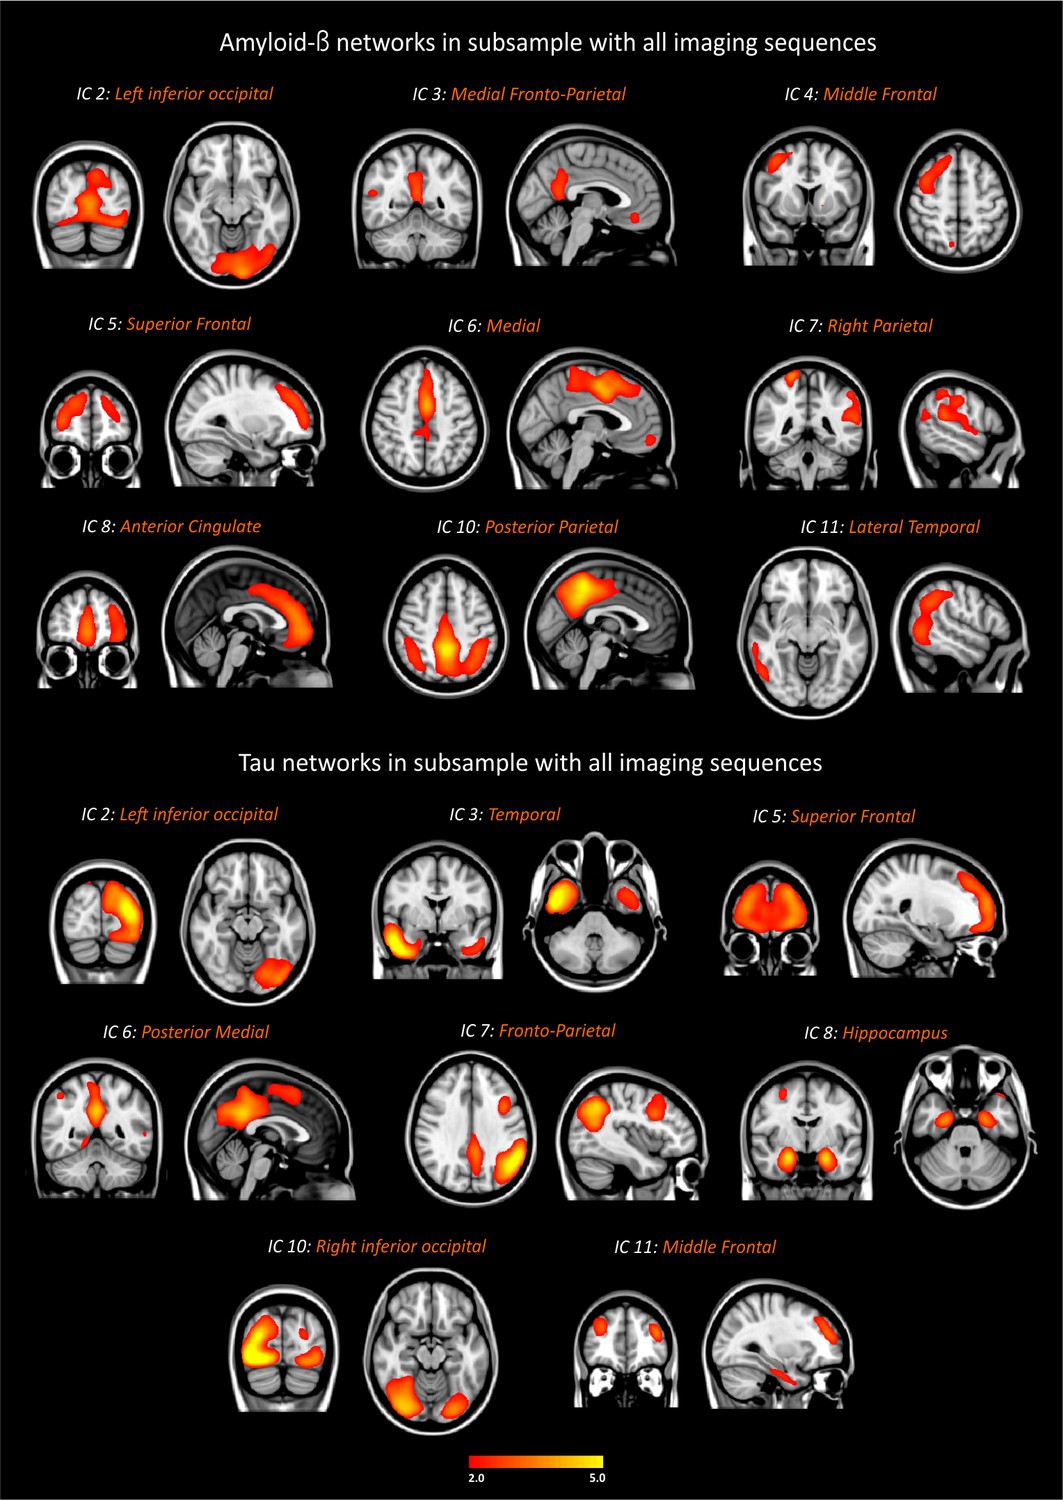
Amyloid-β and tau networks in subsample with functional MRI and diffusion tensor imaging data.
These analyses were carried out using the subsample with all imaging modalities (n = 67): 10 amyloid-β negative cognitively normal subjects (CN Aβ-), 24 amyloid-β positive cognitively normal subjects (CN Aβ+), 14 patients with mild cognitive impairment (MCI Aβ+), and 19 patients with Alzheimer’s disease (AD Aβ+). The components were thresholded with a z-score >2.0.
Figure 3
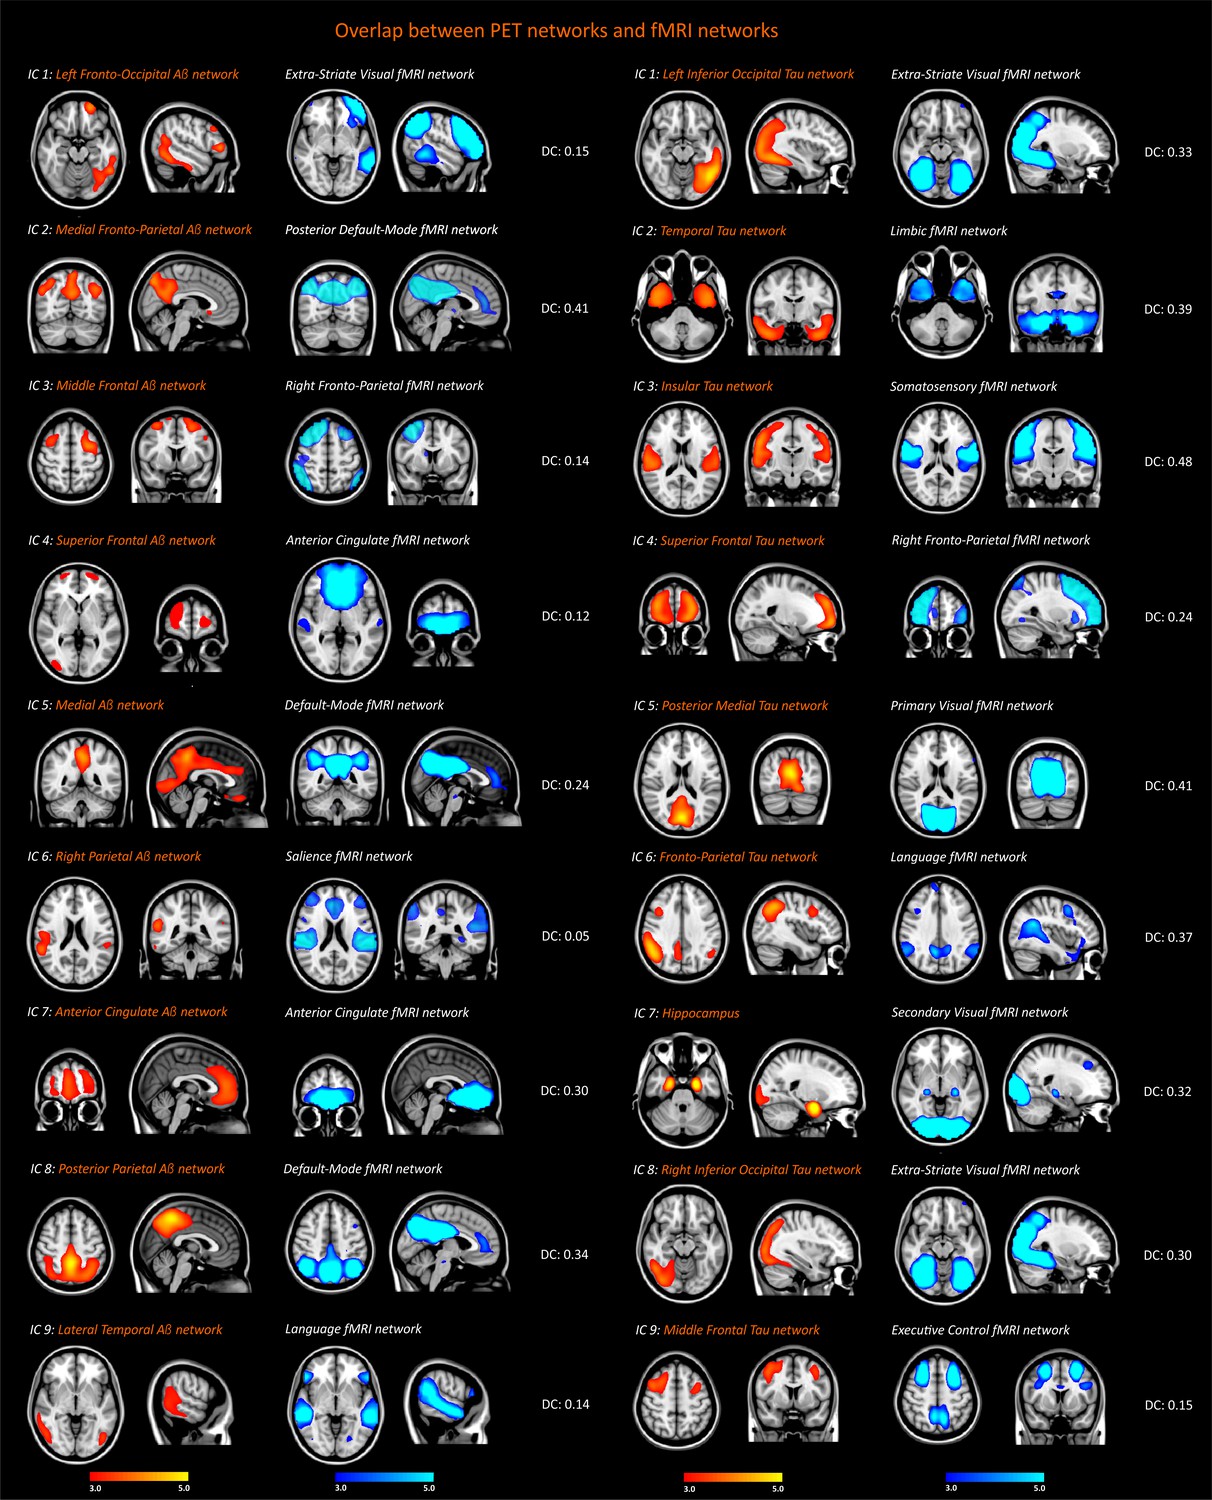
Spatial overlap between the functional MRI, amyloid-β and tau networks.
Resting-state functional networks that overlapped best with the amyloid-β and tau networks identified in the entire sample of 117 subjects (26 amyloid-β negative cognitively normal subjects, 34 amyloid-β cognitively normal subjects, 21 patients with mild cognitive impairment, 36 patients with Alzheimer’s disease). The Dice coefficients (DC) between these networks indicated poor (<0.2), fair (0.2–0.4) or moderate (0.4–0.6) overlap.
Figure 4
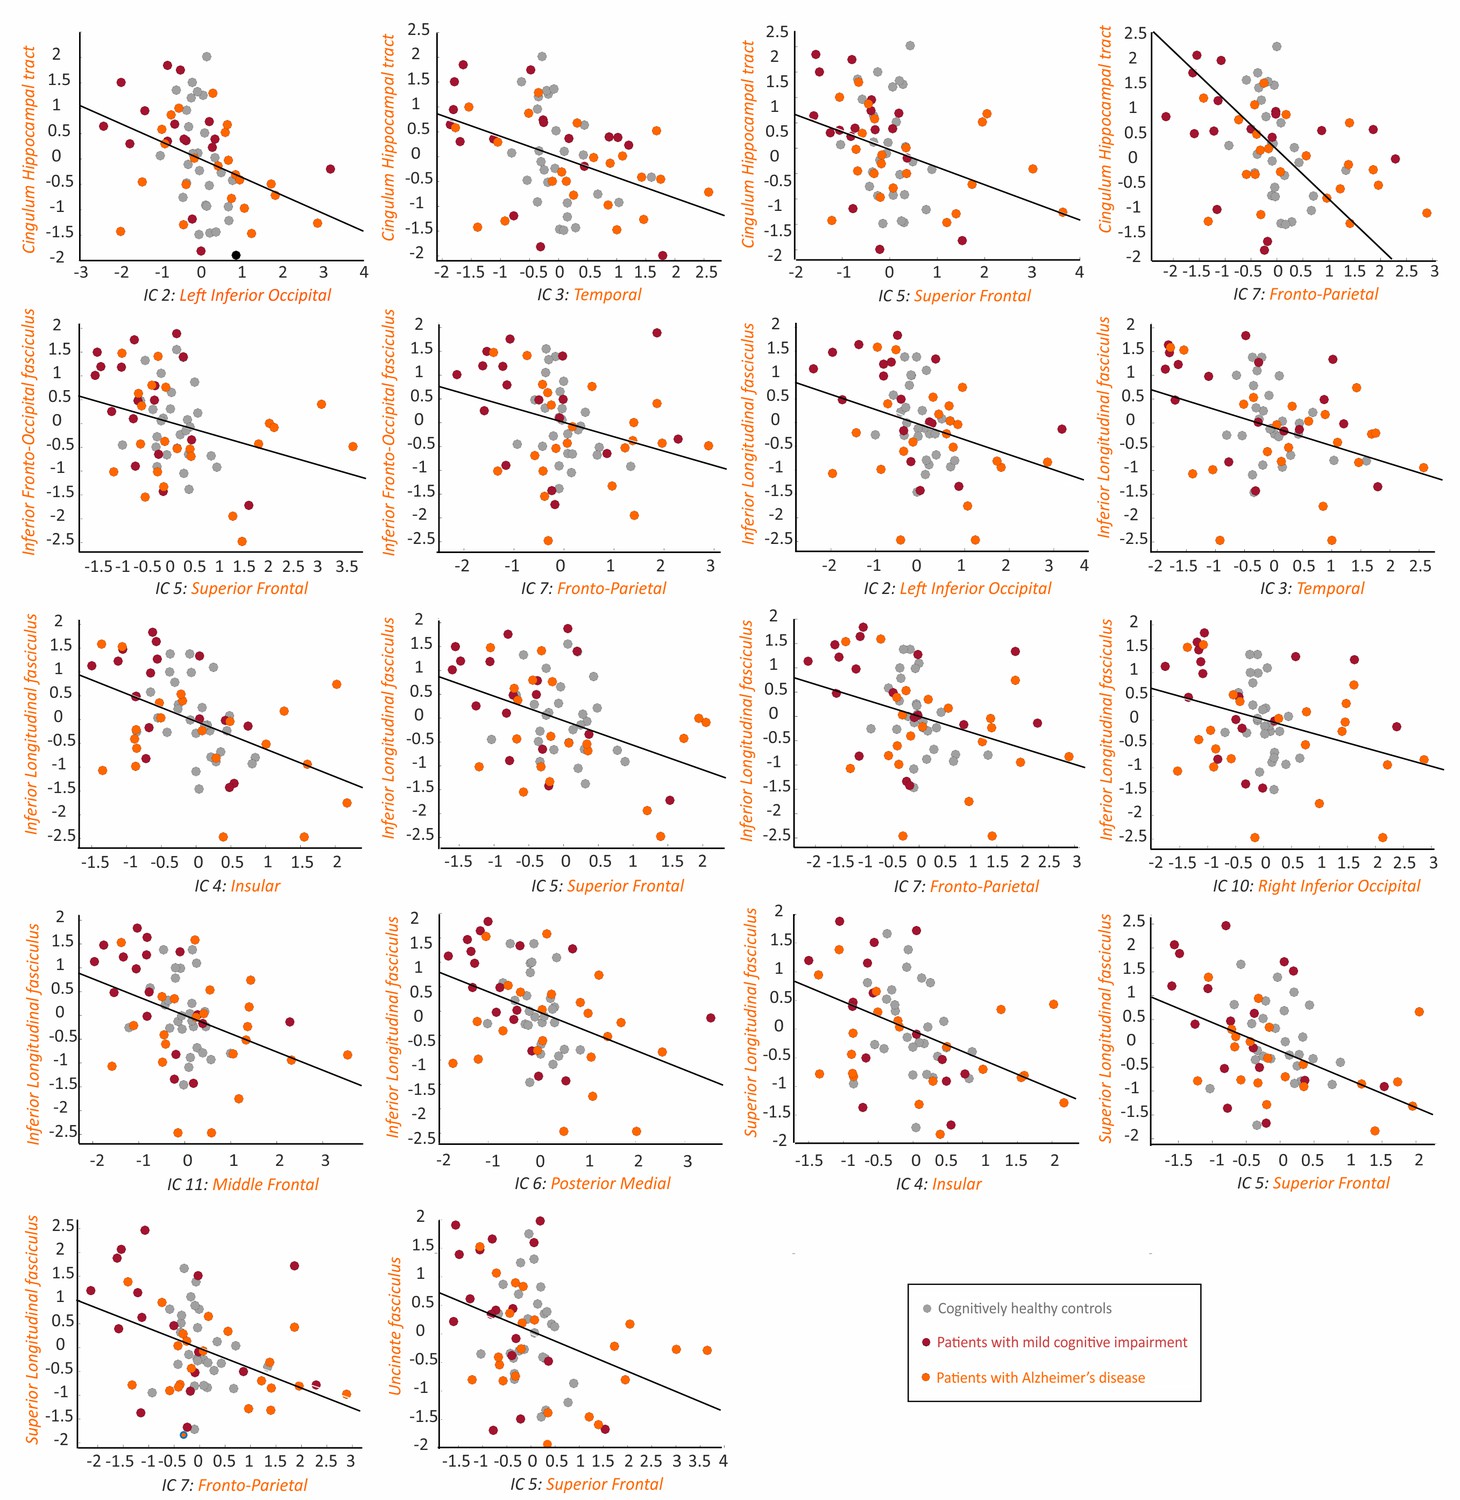
Association between the tau networks and fractional anisotropy of white matter tracts.
The plots show significant correlations between the SUVRs of different tau networks and fractional anisotropy values of white matter tracts in 66 amyloid-β positive subjects with both imaging modalities, after regressing out the effects of age, gender and cognitive impairment, and adjusting for multiple comparisons using FDR corrections (q < 0.05). Three outliers were excluded: 2 AD patients and 1 MCI patient.
-
Figure 4—source data 1
Association between the tau networks and fractional anisotropy of white matter tracts.
Values for the tau networks and fractional anisotropy of white matter tracts that were significantly correlated with each other, after regressing out the effects of age, sex and presence of cognitive impairment.
- https://cdn.elifesciences.org/articles/50830/elife-50830-fig4-data1-v2.xlsx
Figure 5
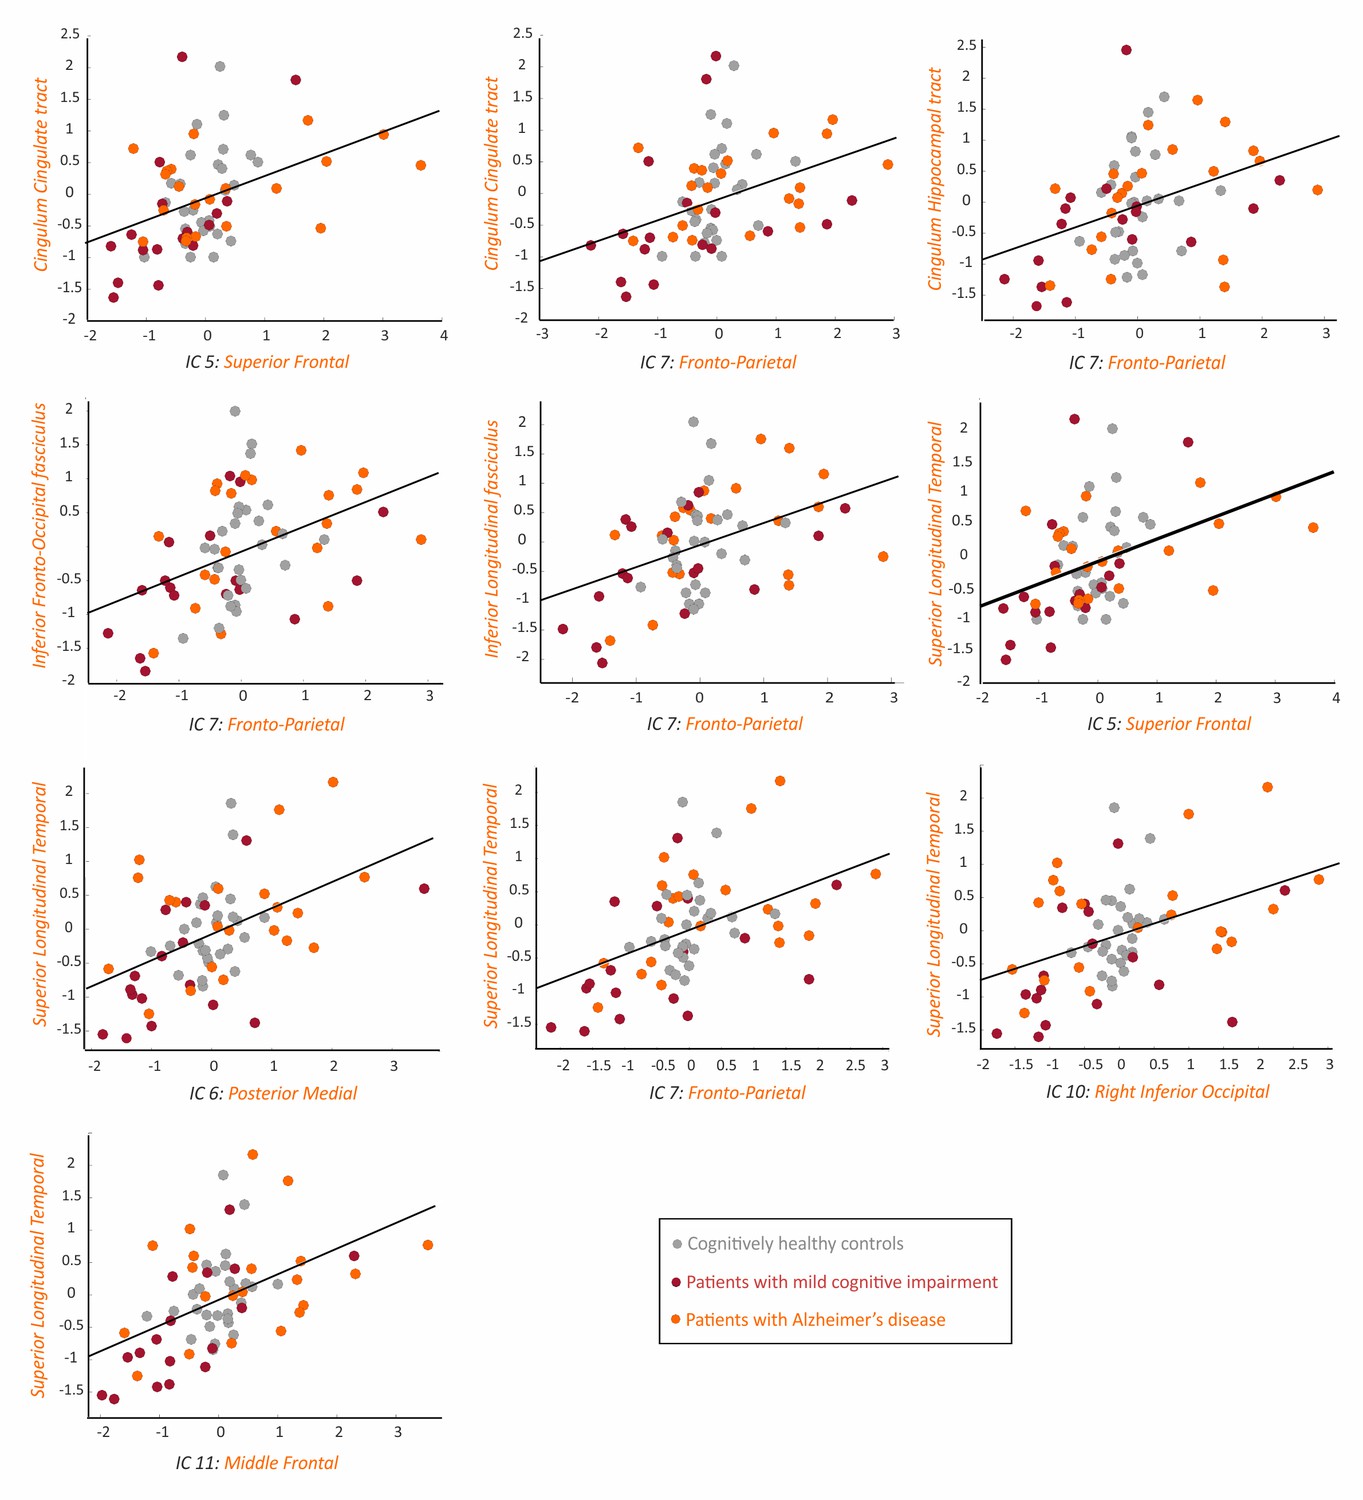
Association between the tau networks and mean diffusivity of white matter tracts.
The plots show significant correlations between the SUVRs of different tau networks and mean diffusivity values of white matter tracts in 66 amyloid-β positive subjects with both imaging modalities, after regressing out the effects of age, gender and cognitive impairment, and adjusting for multiple comparisons using FDR corrections (q < 0.05). One AD patient with high mean diffusivity values in white matter tracts was excluded from all plots.
-
Figure 5—source data 1
Association between the tau networks and mean diffusivity of white matter tracts.
Values for the tau networks and mean diffusivity of white matter tracts that were significantly correlated with each other, after regressing out the effects of age, sex and presence of cognitive impairment.
- https://cdn.elifesciences.org/articles/50830/elife-50830-fig5-data1-v2.xlsx
Tables
Table 1
Characteristics of the sample.
The values presented in the table correspond to means followed by (standard deviations). MMSE, mini-mental state examination. Amyloid positivity (Amyloid-β+) was established using a composite cortical region normalized by the whole cerebellum on 18F-Flutemetamol PET with a cut-off of >0.693. Subjects with values below this cut-off were classified as amyloid negative (Amyloid-β−). P values were calculated using Chi-square tests (to assess differences in sex) or Mann-Whitney tests (to assess differences in all other variables).
| Cognitively normal (CN) | Mild cognitive impairment (MCI) | Alzheimer’s disease (AD) | ||
|---|---|---|---|---|
| amyloid-β − (n = 26) | amyloid-β+ (n = 34) | All amyloid-β+ (n = 21) | All amyloid-β+ (n = 36) | |
| Age (years) | 74.9 (5.7) | 75.2 (6.1) | 72.3 (6.9) | 70.6 (8.2)b, d |
| Sex (m/f) | 15/11 | 14/20 | 14/7 | 20/16 |
| Education (years) | 12.2 (3.5) | 11.7 (3.7) | 12.1 (3.5) | 12.2 (3.4) |
| MMSE | 28.8 (1.1) | 29.1 (1.1) | 26.0 (2.7)a, c | 20.6 (5.3)b, d, e |
| Delayed recall | 2.2 (1.7) | 2.6 (2.2) | 5.9 (2.4) a,c | 8.3 (2.0)b, d, e |
| Trail making test A | 44.4 (15.4) | 51.6 (19.5) | 59.4 (18.9)a | 83.4 (54.1)b, d |
| Clock-drawing test | 2.71 (1.19) | 2.80 (1.52) | 5.09 (1.08)a, c | 6.18 (1.58)b, d |
-
a Significant differences between amyloid negative controls and mild cognitive impairment patients (p<0.05).
b Significant differences between amyloid negative controls and Alzheimer’s disease dementia patients (p<0.05).
-
c Significant differences between amyloid positive controls and mild cognitive impairment patients (p<0.05).
d Significant differences between amyloid positive controls and Alzheimer’s disease dementia patients (p<0.05).
-
e Significant differences between mild cognitive impairment and Alzheimer’s disease dementia patients (p<0.05).
Table 2
Differences between groups in amyloid-β and tau networks.
The values presented in the table correspond to means followed by (standard deviations) or p values calculated using non-parametric permutation tests to assess differences between groups in amyloid-β and tau networks, while controlling for age and sex. Values in bold correspond to significant group differences after adjusting for multiple comparisons with false discovery rate corrections (FDR) (q < 0.05). The entire sample of 117 subjects were included in this analysis: 26 amyloid-β negative cognitively normal subjects, in addition to 34 amyloid-β positive cognitively normal subjects, 21 patients with mild cognitive impairment and 36 patients with Alzheimer’s disease. Amyloid negative (Aβ-); amyloid positive (Aβ+). Amyloid positivity (β+) was established using a composite cortical region normalized by the whole cerebellum on 18F-Flutemetamol PET with a cut-off of >0.693.
| Cognitively normal (CN) | Mild cognitive impairment (MCI) | Alzheimer’s disease (AD) | CN β− vs CN β+ | CN β− vs MCI | CN β− vs AD | CN β+ vs MCI | CN β+ vs AD | MCI vs AD | ||
|---|---|---|---|---|---|---|---|---|---|---|
| amyloid-β− | amyloid-β+ | All amyloid-β+ | All amyloid-β+ | P value | P value | P value | P value | P value | P value | |
| amyloid-β networks | ||||||||||
| IC 2: Left Inferior Occipital | 0.71 (0.04) | 0.92 (0.14) | 1.10 (0.10) | 1.13 (0.13) | <0.001 | <0.001 | <0.001 | <0.001 | <0.001 | 0.287 |
| IC 3: Medial Fronto-Parietal | 0.67 (0.04) | 0.98 (0.16) | 1.15 (0.13) | 1.19 (0.14) | <0.001 | <0.001 | <0.001 | <0.001 | <0.001 | 0.244 |
| IC 4: Middle Frontal | 0.74 (0.06) | 0.89 (0.12) | 0.94 (0.11) | 1.02 (0.16) | <0.001 | <0.001 | <0.001 | 0.159 | 0.004 | 0.048 |
| IC 5: Superior Frontal | 0.68 (0.05) | 0.91 (0.14) | 1.02 (0.11) | 1.08 (0.16) | <0.001 | <0.001 | <0.001 | 0.014 | <0.001 | 0.101 |
| IC 6: Medial | 0.64 (0.04) | 0.92 (0.14) | 1.07 (0.13) | 1.13 (0.14) | <0.001 | <0.001 | <0.001 | <0.001 | <0.001 | 0.112 |
| IC 7: Right Parietal | 0.69 (0.06) | 0.88 (0.14) | 1.00 (0.11) | 1.11 (0.12) | <0.001 | <0.001 | <0.001 | 0.003 | <0.001 | 0.001 |
| IC 8: Anterior Cingulate | 0.67 (0.05) | 0.99 (0.17) | 1.16 (0.14) | 1.23 (0.16) | <0.001 | <0.001 | <0.001 | 0.003 | <0.001 | 0.080 |
| IC 10: Posterior Parietal | 0.67 (0.05) | 0.95 (0.17) | 1.11 (0.16) | 1.15 (0.15) | <0.001 | <0.001 | <0.001 | 0.002 | <0.001 | 0.226 |
| IC 11: Lateral Temporal | 0.70 (0.04) | 0.95 (0.17) | 1.09 (0.14) | 1.18 (0.16) | <0.001 | <0.001 | <0.001 | 0.006 | <0.001 | 0.033 |
| tau networks | ||||||||||
| IC 2: Left Inferior Occipital | 1.15 (0.07) | 1.21 (0.10) | 1.76 (0.62) | 2.03 (0.58) | 0.112 | <0.001 | <0.001 | <0.001 | <0.001 | 0.061 |
| IC 3: Temporal | 1.15 (0.06) | 1.22 (0.13) | 1.65 (0.42) | 1.83 (0.34) | 0.020 | <0.001 | <0.001 | <0.001 | <0.001 | 0.057 |
| IC 4: Insular | 1.00 (0.07) | 1.02 (0.07) | 1.17 (0.20) | 1.39 (0.48) | 0.151 | 0.030 | <0.001 | 0.115 | <0.001 | 0.010 |
| IC 5: Superior Frontal | 1.11 (0.08) | 1.14 (0.07) | 1.32 (0.34) | 1.58 (0.48) | 0.267 | 0.038 | <0.001 | 0.060 | <0.001 | 0.014 |
| IC 6: Posterior Medial | 1.05 (0.06) | 1.09 (0.07) | 1.30 (0.34) | 1.57 (0.57) | 0.157 | 0.019 | <0.001 | 0.066 | <0.001 | 0.015 |
| IC 7 Fronto-Parietal | 1.13 (0.07) | 1.20 (0.13) | 1.63 (0.60) | 1.97 (0.60) | 0.498 | 0.001 | <0.001 | 0.002 | <0.001 | 0.020 |
| IC 8: Hippo-campus | 1.11 (0.06) | 1.18 (0.12) | 1.46 (0.30) | 1.67 (0.39) | 0.018 | <0.001 | <0.001 | 0.002 | <0.001 | 0.012 |
| IC 10: Right Inferior Occipital | 1.12 (0.07) | 1.16 (0.08) | 1.57 (0.57) | 1.91 (0.68) | 0.143 | 0.001 | <0.001 | 0.004 | <0.001 | 0.034 |
| IC 11: Middle Frontal | 1.07 (0.07) | 1.10 (0.08) | 1.39 (0.34) | 1.71 (0.51) | 0.188 | 0.001 | <0.001 | 0.003 | <0.001 | 0.003 |
Table 3
Association between the integrity of white matter tracts and the PET networks.
The values presented in the table correspond to Spearman’s Rho followed by (p values) for the correlations between the fractional anisotropy or mean diffusivity of white matter tracts and PET networks SUVRs, while controlling for age, sex and presence of cognitive impairment. Values in bold correspond to significant group differences after adjusting for multiple comparisons with false discovery rate corrections (FDR) (q < 0.05). Correlations were carried out in all amyloid-β positive individuals: 28 amyloid-β positive cognitively normal subjects (CN Aβ+), 18 patients with mild cognitive impairment (MCI Aβ+) and 26 patients with Alzheimer’s disease (AD Aβ+). Three AD patients and 1 MCI patient were excluded due to being outliers in white matter measures. ATR, anterior thalamic radiation; CST, cortico-spinal tract; CCT, cingulate cingulum tract; HCT, hippocampal cingulum tract; FMAJ, forceps major; FMIN, forceps minor; IFO, inferior fronto-occipital fasciculus; ILF, inferior longitudinal fasciculus; SLF, superior longitudinal fasciculus; SLFt, temporal part of the superior longitudinal fasciculus; UNC, uncinate fasciculus.
| Fractional anisotropy | |||||||||||
|---|---|---|---|---|---|---|---|---|---|---|---|
| ATR | CST | CCT | HCT | FMAJ | FMIN | IFO | ILF | SLF | SLFt | UNC | |
| amyloid-β IC 2 | −0.016 (0.904) | 0.081 (0.527) | 0.014 (0.915) | 0.031 (0.810) | 0.011 (0.930) | 0.079 (0.540) | −0.093 (0.467) | −0.073 (0.569) | −0.111 (0.386) | −0.123 (0.336) | −0.047 (0.717) |
| amyloid-β IC 3 | −0.162 (0.205) | 0.133 (0.298) | 0.027 (0.832) | −0.052 (0.685) | −0.094 (0.462) | −0.091 (0.478) | −0.180 (0.159) | −0.105 (0.411) | −0.158 (0.217) | −0.211 (0.097) | −0.073 (0.572) |
| amyloid-β IC 4 | −0.121 (0.347) | 0.026 (0.841) | −0.043 (0.740) | −0.107 (0.404) | −0.112 (0.384) | −0.110 (0.393) | −0.166 (0.195) | −0.076 (0.552) | −0.130 (0.310) | −0.187 (0.142) | −0.042 (0.743) |
| amyloid-β IC 5 | −0.025 (0.848) | 0.089 (0.488) | 0.006 (0.964) | −0.027 (0.836) | −0.073 (0.568) | 0.018 (0.890) | −0.085 (0.507) | −0.002 (0.989) | −0.036 (0.781) | −0.125 (0.331) | 0.014 (0.911) |
| amyloid-β IC 6 | −0.177 (0.166) | 0.085 (0.509) | 0.033 (0.799) | −0.009 (0.947) | −0.123 (0.338) | −0.072 (0.575) | −0.164 (0.199) | −0.080 (0.533) | −0.123 (0.337) | −0.194 (0.128) | −0.061 (0.636) |
| amyloid-β IC 7 | 0.007 (0.957) | 0.004 (0.978) | −0.071 (0.582) | −0.046 (0.719) | −0.062 (0.630) | 0.022 (0.863) | −0.072 (0.576) | −0.031 (0.813) | −0.018 (0.890) | −0.064 (0.617) | −0.051 (0.692) |
| amyloid-β IC 8 | −0.017 (0.896) | 0.065 (0.611) | 0.024 (0.852) | 0.045 (0.725) | −0.003 (0.979) | 0.052 (0.687) | −0.037 (0.774) | 0.024 (0.851) | −0.003 (0.981) | −0.073 (0.572) | 0.029 (0.824) |
| amyloid-β IC 10 | −0.170 (0.183) | 0.082 (0.525) | 0.038 (0.765) | −0.062 (0.627) | −0.152 (0.234) | −0.072 (0.576) | −0.175 (0.170) | −0.082 (0.524) | −0.140 (0.275) | −0.175 (0.170) | −0.039 (0.760) |
| amyloid-β IC 11 | 0.040 (0.757) | 0.064 (0.618) | −0.040 (0.760) | −0.045 (0.724) | −0.020 (0.874) | 0.096 (0.456) | −0.083 (0.517) | −0.087 (0.497) | −0.070 (0.585) | −0.093 (0.467) | −0.046 (0.718) |
| tau IC 2 | −0.214 (0.093) | −0.123 (0.336) | −0.291 (0.021) | −0.364 (0.003) | −0.283 (0.025) | −0.170 (0.184) | −0.307 (0.014) | −0.429 (<0.001) | −0.339 (0.007) | −0.259 (0.041) | −0.280 (0.026) |
| tau IC 3 | −0.207 (0.104) | −0.092 (0.476) | −0.286 (0.023) | −0.398 (0.001) | −0.251 (0.047) | −0.234 (0.065) | −0.301 (0.017) | −0.362 (0.004) | −0.257 (0.042) | −0.283 (0.025) | −0.292 (0.020) |
| tau IC 4 | −0.222 (0.081) | −0.305 (0.015) | −0.309 (0.014) | −0.348 (0.005) | −0.292 (0.020) | −0.165 (0.198) | −0.339 (0.007) | −0.459 (<0.001) | −0.378 (0.002) | −0.297 (0.018) | −0.303 (0.016) |
| tau IC 5 | −0.266 (0.035) | −0.245 (0.053) | −0.370 (0.003) | −0.361 (0.004) | −0.271 (0.032) | −0.288 (0.022) | −0.395 (0.001) | −0.430 (<0.001) | −0.386 (0.002) | −0.286 (0.023) | −0.398 (0.001) |
| tau IC 6 | −0.224 (0.077) | −0.176 (0.167) | −0.239 (0.059) | −0.309 (0.014) | −0.281 (0.026) | −0.150 (0.241) | −0.292 (0.020) | −0.393 (0.001) | −0.330 (0.008) | −0.214 (0.093) | −0.225 (0.077) |
| tau IC 7 | −0.226 (0.075) | −0.194 (0.127) | −0.352 (0.005) | −0.424 (<0.001) | −0.337 (0.007) | −0.232 (0.068) | −0.375 (0.003) | −0.448 (<0.001) | −0.370 (0.003) | −0.272 (0.031) | −0.324 (0.010) |
| tau IC 8 | −0.064 (0.619) | −0.094 (0.464) | −0.245 (0.053) | −0.323 (0.010) | −0.234 (0.065) | −0.049 (0.702) | −0.222 (0.080) | −0.319 (0.011) | −0.215 (0.091) | −0.171 (0.180) | −0.179 (0.160) |
| tau IC 10 | −0.258 (0.041) | −0.121 (0.344) | −0.212 (0.096) | −0.304 (0.016) | −0.324 (0.010) | −0.136 (0.287) | −0.311 (0.013) | −0.427 (<0.001) | −0.350 (0.005) | −0.250 (0.048) | −0.223 (0.081) |
| tau IC 11 | −0.166 (0.192) | −0.188 (0.140) | −0.300 (0.017) | −0.306 (0.015) | −0.208 (0.102) | −0.145 (0.257) | −0.310 (0.013) | −0.392 (0.002) | −0.347 (0.005) | −0.271 (0.032) | −0.299 (0.017) |
| Mean Diffusivity | |||||||||||
| ATR | CST | CCT | HCT | FMAJ | FMIN | IFO | ILF | SLF | SLFt | UNC | |
| amyloid-β IC 2 | 0.031 (0.808) | −0.156 (0.223) | −0.061 (0.636) | 0.011 (0.931) | −0.132 (0.302) | 0.048 (0.712) | −0.072 (0.573) | 0.011 (0.930) | −0.042 (0.742) | 0.087 (0.500) | 0.078 (0.543) |
| amyloid-β IC 3 | 0.053 (0.679) | −0.362 (0.004) | −0.154 (0.227) | 0.020 (0.879) | −0.216 (0.089) | −0.051 (0.691) | −0.108 (0.398) | −0.028 (0.829) | −0.168 (0.188) | 0.082 (0.525) | 0.065 (0.613) |
| amyloid-β IC 4 | 0.067 (0.601) | −0.143 (0.263) | −0.029 (0.824) | 0.092 (0.476) | 0.043 (0.739) | −0.055 (0.669) | 0.039 (0.763) | 0.088 (0.495) | 0.011 (0.935) | 0.101 (0.433) | 0.034 (0.793) |
| amyloid-β IC 5 | 0.029 (0.820) | −0.120 (0.348) | 0.001 (0.995) | 0.014 (0.915) | 0.003 (0.983) | −0.029 (0.823) | −0.018 (0.886) | 0.024 (0.850) | −0.057 (0.656) | 0.059 (0.645) | 0.029 (0.823) |
| amyloid-β IC 6 | 0.128 (0.318) | −0.278 (0.028) | −0.085 (0.508) | 0.088 (0.493) | −0.125 (0.331) | 0.021 (0.869) | −0.016 (0.899) | 0.050 (0.698) | −0.083 (0.519) | 0.148 (0.249) | 0.122 (0.342) |
| amyloid-β IC 7 | 0.081 (0.530) | −0.088 (0.493) | 0.085 (0.507) | 0.096 (0.456) | −0.057 (0.655) | 0.108 (0.401) | 0.066 (0.605) | 0.141 (0.272) | 0.106 (0.409) | 0.108 (0.398) | 0.118 (0.358) |
| amyloid-β IC 8 | 0.011 (0.932) | −0.115 (0.368) | −0.046 (0.718) | −0.005 (0.972) | 0.037 (0.771) | −0.009 (0.943) | −0.038 (0.767) | 0.025 (0.847) | −0.085 (0.507) | 0.009 (0.944) | 0.015 (0.907) |
| amyloid-β IC 10 | 0.088 (0.494) | −0.310 (0.013) | −0.112 (0.381) | 0.057 (0.657) | −0.211 (0.097) | −0.056 (0.661) | −0.068 (0.595) | −0.025 (0.844) | −0.142 (0.266) | 0.107 (0.403) | 0.063 (0.625) |
| amyloid-β IC 11 | 0.049 (0.703) | −0.096 (0.453) | 0.034 (0.791) | 0.023 (0.858) | −0.238 (0.060) | 0.125 (0.329) | −0.053 (0.679) | 0.037 (0.771) | 0.068 (0.598) | 0.102 (0.428) | 0.134 (0.296) |
| tau IC 2 | 0.266 (0.035) | 0.039 (0.760) | 0.324 (0.010) | 0.353 (0.005) | −0.011 (0.930) | 0.244 (0.054) | 0.271 (0.032) | 0.307 (0.015) | 0.183 (0.152) | 0.432 (<0.001) | 0.303 (0.016) |
| tau IC 3 | 0.219 (0.085) | 0.016 (0.900) | 0.289 (0.022) | 0.354 (0.004) | 0.041 (0.748) | 0.080 (0.532) | 0.250 (0.048) | 0.331 (0.008) | 0.171 (0.181) | 0.351 (0.005) | 0.183 (0.150) |
| tau IC 4 | 0.172 (0.177) | 0.054 (0.673) | 0.280 (0.026) | 0.222 (0.081) | 0.016 (0.899) | 0.164 (0.201) | 0.236 (0.062) | 0.243 (0.055) | 0.093 (0.471) | 0.303 (0.016) | 0.259 (0.040) |
| tau IC 5 | 0.228 (0.072) | 0.195 (0.126) | 0.387 (0.002) | 0.260 (0.039) | 0.072 (0.576) | 0.186 (0.145) | 0.362 (0.004) | 0.348 (0.005) | 0.262 (0.038) | 0.436 (<0.001) | 0.337 (0.007) |
| tau IC 6 | 0.226 (0.075) | −0.006 (0.960) | 0.261 (0.039) | 0.265 (0.036) | −0.074 (0.565) | 0.210 (0.099) | 0.242 (0.056) | 0.245 (0.054) | 0.116 (0.365) | 0.382 (0.002) | 0.298 (0.018) |
| tau IC 7 | 0.261 (0.039) | 0.083 (0.519) | 0.418 (<0.001) | 0.371 (0.003) | 0.086 (0.501) | 0.243 (0.055) | 0.371 (0.003) | 0.403 (0.001) | 0.288 (0.022) | 0.463 (<0.001) | 0.319 (0.011) |
| tau IC8 | 0.107 (0.405) | 0.084 (0.514) | 0.311 (0.013) | 0.253 (0.046) | 0.025 (0.848) | 0.148 (0.248) | 0.202 (0.112) | 0.232 (0.067) | 0.158 (0.216) | 0.281 (0.026) | 0.174 (0.172) |
| tau IC 10 | 0.252 (0.046) | −0.054 (0.672) | 0.302 (0.016) | 0.327 (0.009) | −0.052 (0.685) | 0.212 (0.096) | 0.225 (0.076) | 0.239 (0.059) | 0.074 (0.563) | 0.388 (0.002) | 0.285 (0.024) |
| tau IC 11 | 0.193 (0.129) | 0.056 (0.663) | 0.314 (0.012) | 0.258 (0.042) | −0.075 (0.557) | 0.259 (0.040) | 0.226 (0.075) | 0.299 (0.017) | 0.199 (0.118) | 0.431 (<0.001) | 0.350 (0.005) |
Table 4
Association between cognition with the amyloid-β and tau networks.
The values presented in the table correspond to Spearman’s Rho followed by (p values) for correlations between cognitive tests and PET networks SUVRs, while controlling for age, sex, education and presence of cognitive impairment. Correlations were carried out across all amyloid-β positive individuals: 34 amyloid-β positive cognitively normal subjects (CN Aβ+), 21 patients with mild cognitive impairment (MCI Aβ+) and 36 patients with Alzheimer’s disease (AD Aβ+). Some patients had missing scores on the MMSE (3 AD Aβ+), Delayed memory test (1 MCI Aβ+, 5 AD Aβ+), Trail-Making test (1 CN Aβ−, 3 MCI Aβ+, 5 AD Aβ+) and the Clock-drawing test (1 CN Aβ−, 10 CN Aβ+, 11 MCI Aβ+, 11 AD Aβ+). Values in bold correspond to significant group differences after adjusting for multiple comparisons with false discovery rate corrections (FDR) (q < 0.05).
| MMSE Rho (p value) | Delayed recall Rho (p value) | Trail making test Rho (p value) | Clock-drawing test Rho (p value) | |
|---|---|---|---|---|
| amyloid-β IC 2: Left Inferior Occipital | −0.269 (0.013) | 0.245 (0.028) | −0.076 (0.508) | −0.040 (0.773) |
| amyloid-β IC 3: Medial Fronto-Parietal | −0.175 (0.111) | 0.261 (0.019) | −0.062 (0.590) | 0.006 (0.965) |
| amyloid-β IC 4: Middle Frontal | −0.103 (0.351) | 0.179 (0.113) | −0.003 (0.690) | 0.023 (0.870) |
| amyloid-β IC 5: Superior Frontal | −0.292 (0.007) | 0.280 (0.012) | 0.005 (0.978) | −0.055 (0.689) |
| amyloid-β IC 6: Medial | −0.396 (<0.001) | 0.284 (0.011) | −0.006 (0.958) | −0.093 (0.498) |
| amyloid-β IC 7: Right Parietal | −0.292 (0.007) | 0.284 (0.011) | −0.054 (0.639) | −0.111 (0.420) |
| amyloid-β IC 8: Anterior Cingulate | −0.166 (0.131) | 0.325 (0.003) | −0.119 (0.301) | −0.038 (0.783) |
| amyloid-β IC 10: Posterior Parietal | −0.308 (0.004) | 0.191 (<0.089) | 0.032 (0.779) | −0.069 (0.617) |
| amyloid-β IC 11: Lateral Temporal | −0.393 (<0.001) | 0.214 (0.057) | 0.037 (0.751) | −0.042 (0.759) |
| tau IC 2: Left Inferior Occipital | −0.413(<0.001) | 0.338 (0.002) | 0.311 (0.006) | −0.406 (0.002) |
| tau IC 3: Temporal | −0.246 (0.005) | 0.446 (<0.001) | 0.277 (0.014) | −0.271 (0.046) |
| tau IC 4: Insular | −0.274 (0.024) | 0.169 (0.134) | 0.206 (0.070) | −0.322 (0.017) |
| tau IC 5: Superior Frontal | −0.286 (0.008) | 0.268 (0.017) | 0.325 (0.004) | −0.176 (0.199) |
| tau IC 6: Posterior Medial | −0.325 (0.003) | 0.305 (0.006) | 0.285 (0.011) | −0.302 (0.025) |
| tau IC 7: Fronto-Parietal | −0.382 (<0.001) | 0.344 (0.002) | 0.417 (<0.001) | −0.321 (0.017) |
| tau IC 8: Hippocampus | −0.414 (<0.001) | 0.439 (<0.001) | 0.225 (0.047) | −0.229 (0.093) |
| tau IC 10: Right Inferior Occipital | −0.339 (0.002) | 0.279 (0.012) | 0.315 (0.005) | −0.338 (0.012) |
| tau IC 11: Middle Frontal | −0.415 (<0.001) | 0.344 (0.002) | 0.265 (0.019) | −0.311 (<0.021) |
Additional files
-
Supplementary file 1
Association between functional MRI network signals with the amyloid-β and tau networks SUVRs.
- https://cdn.elifesciences.org/articles/50830/elife-50830-supp1-v2.docx
-
Supplementary file 2
Association between gray matter volumes in vulnerable regions to Alzheimer’s disease with the amyloid-β and tau networks SUVRs.
- https://cdn.elifesciences.org/articles/50830/elife-50830-supp2-v2.docx
-
Transparent reporting form
- https://cdn.elifesciences.org/articles/50830/elife-50830-transrepform-v2.pdf
Download links
A two-part list of links to download the article, or parts of the article, in various formats.
Downloads (link to download the article as PDF)
Open citations (links to open the citations from this article in various online reference manager services)
Cite this article (links to download the citations from this article in formats compatible with various reference manager tools)
Amyloid and tau accumulate across distinct spatial networks and are differentially associated with brain connectivity
eLife 8:e50830.
https://doi.org/10.7554/eLife.50830


