Comprehensive annotations of human herpesvirus 6A and 6B genomes reveal novel and conserved genomic features
- Weizmann Institute of Science, Israel
- Institute for Medical Research Israel-Canada, The Hebrew University Hadassah Medical School, Israel
Figures
Figure 1 with 1 supplement

Overview of the experimental approach.
(A) Viral gene expression was analyzed by performing ribosome profiling (red) and initiation enriched RNA-seq (green). HSB-2 cells were infected with HHV-6A strain GS, and MOLT3 cells were infected with HHV-6B strain Z29. Infected cells were harvested at 72 hr post infection (hpi) for RNA-seq, and for ribosome profiling using cycloheximide (CHX) treatment to map overall translation or lactimidomycin (LTM) and Harringtonine (Harr) treatments for mapping translation initiation. (B-C) Metagene analysis of the 5' and the 3' regions of human protein coding regions showing the expression profile as measured by the different (B) Ribo-seq and (C) RNA-seq methods in HHV-6A (green) and HHV-6B (blue) infected cells. The X axis shows the nucleotide position relative to the start or the stop codons.
Figure 1—figure supplement 1
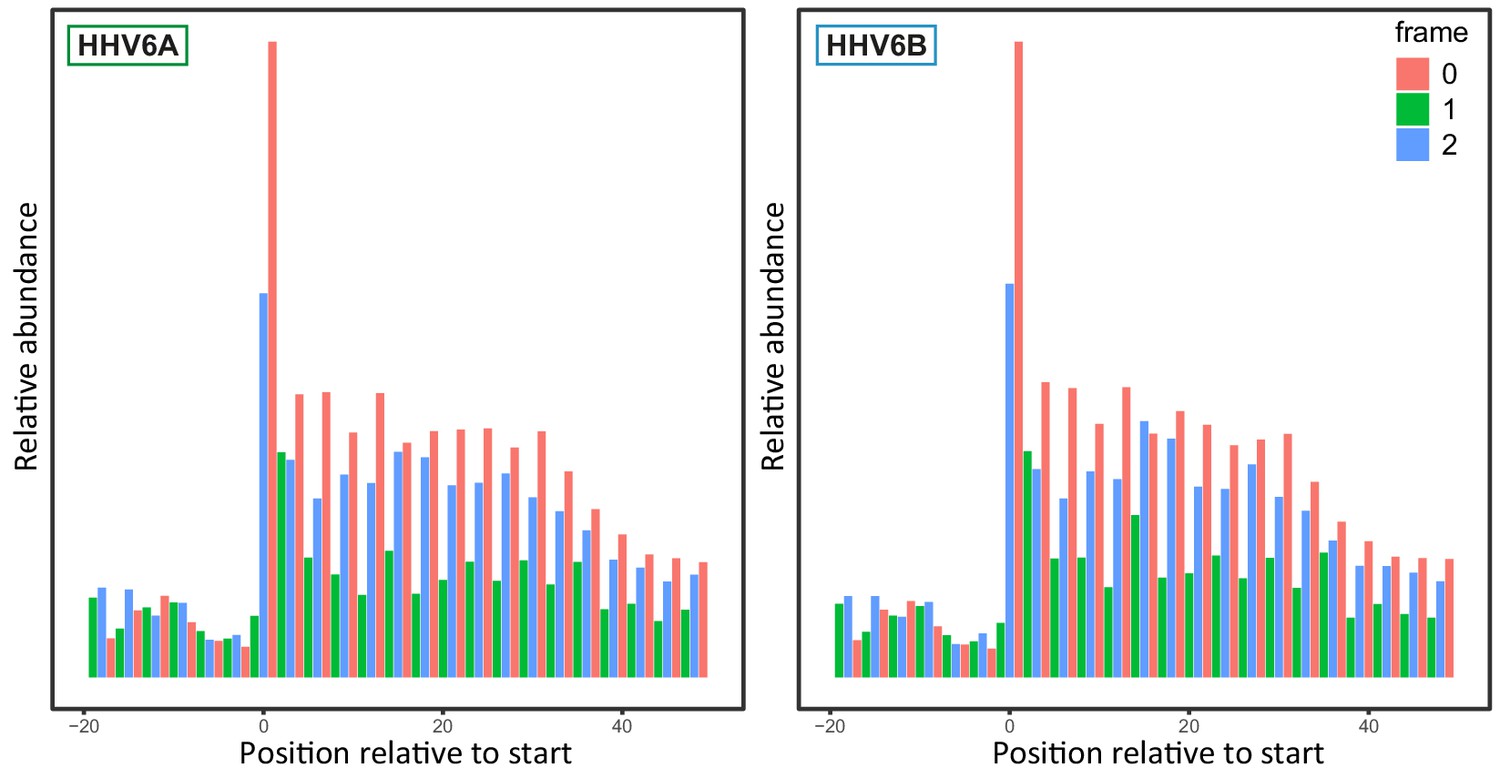
Reading-frame distribution of Ribo-seq reads.
Aggregated normalized reads from HHV-6A and HHV-6B CHX treated Ribo-seq libraries around start codons of human protein coding genes. Colors signify the translation reading frame to which the p-site of read was mapped.
Figure 2
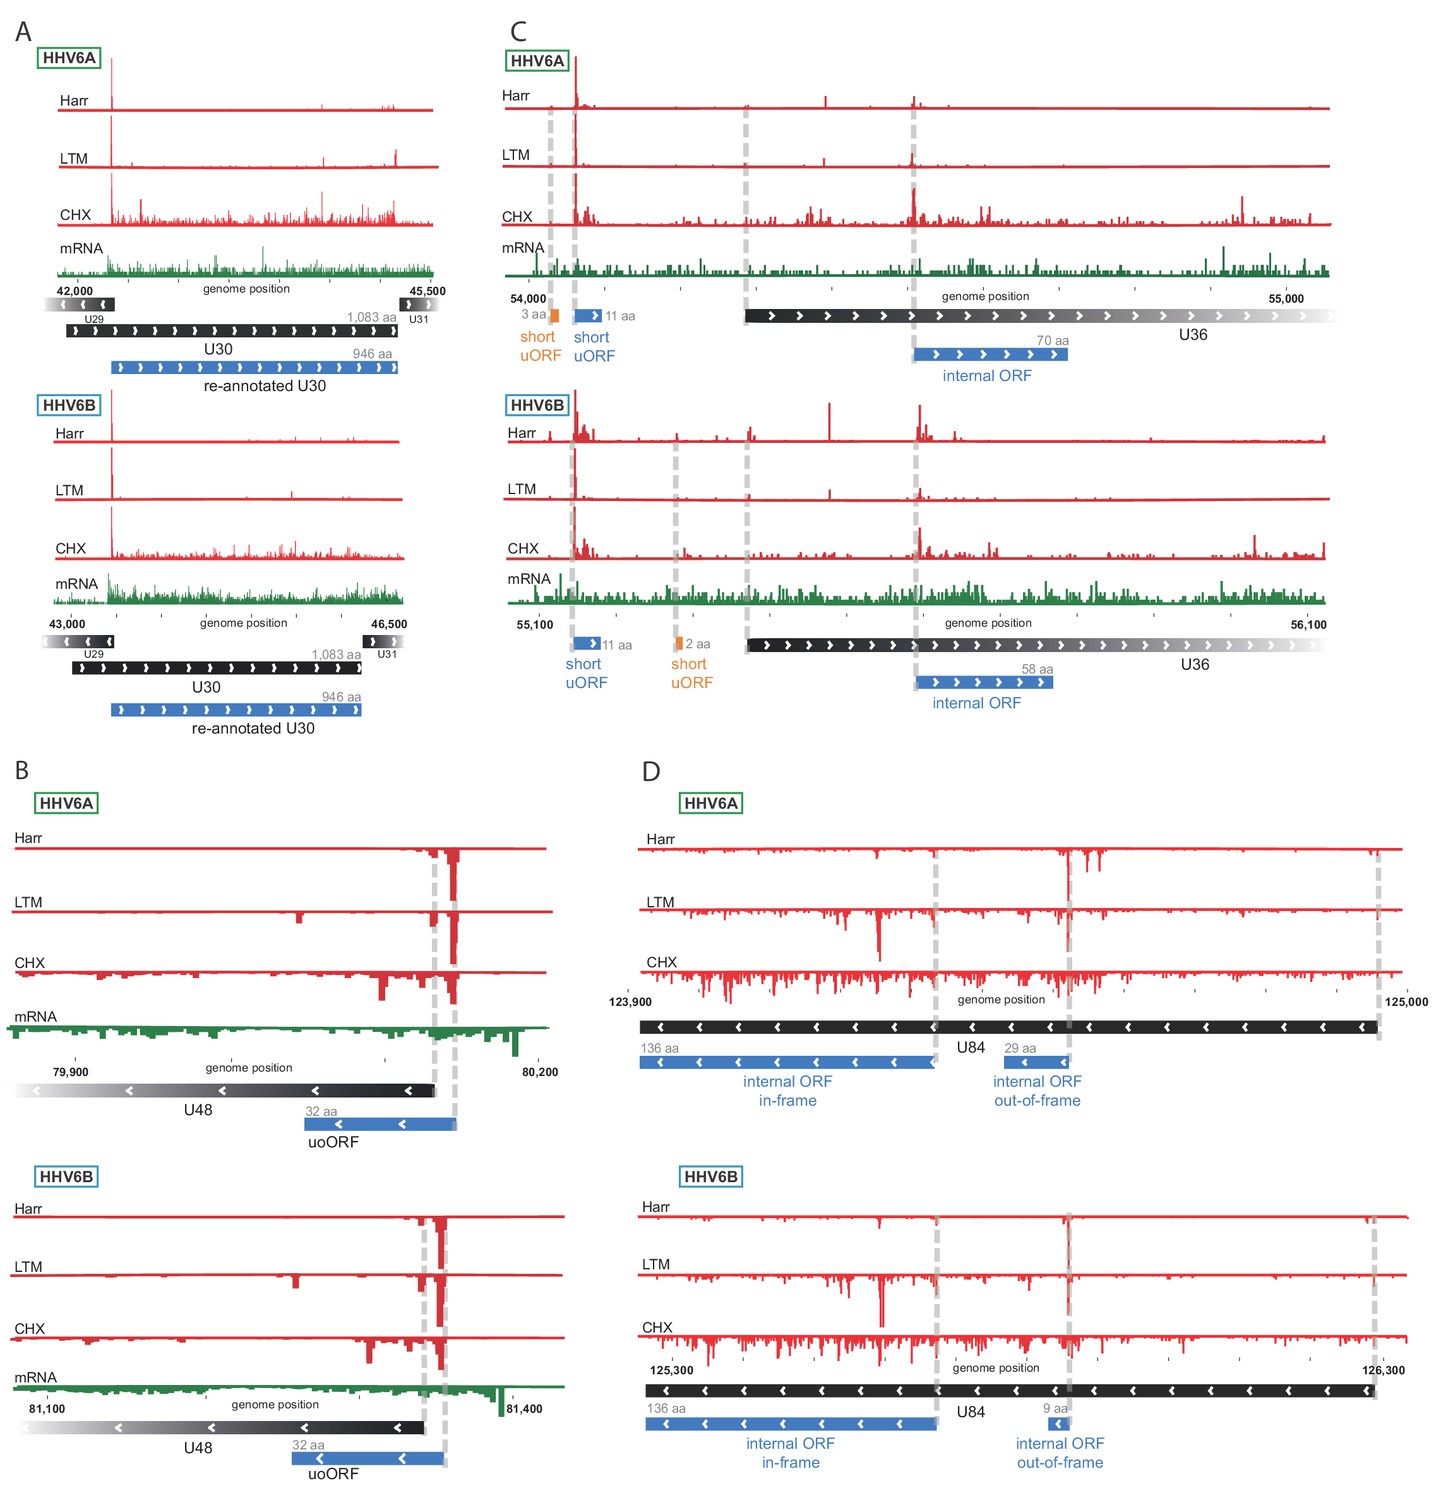
Ribo-Seq measurements reveal the architecture of viral coding regions.
Examples of expression profiles of viral genes that contain novel ORFs conserved in HHV-6A and HHV-6B. Ribo-seq reads are presented in red and RNA-seq reads are presented in green. Canonical annotated ORFs are labeled by black rectangles, novel ORFs initiating at an AUG codon are labeled in blue, and novel ORFs initiating at a near-cognate start codon are labeled in orange. ORF sizes are written in gray. (A) U30 translation initiates at an AUG downstream of the annotated start codon. (B) A 32 amino acid (aa) upstream overlapping ORF (uoORF) is coded by the U48 transcript, initiates upstream of the U48 canonical ORF and partially overlaps it. (C) U36 locus contains two uORFs, as well as an out-of-frame iORF. (D) U84 locus contains an in-frame iORF which is a truncated version of U84, and a novel out-of-frame iORF.
Figure 3 with 1 supplement
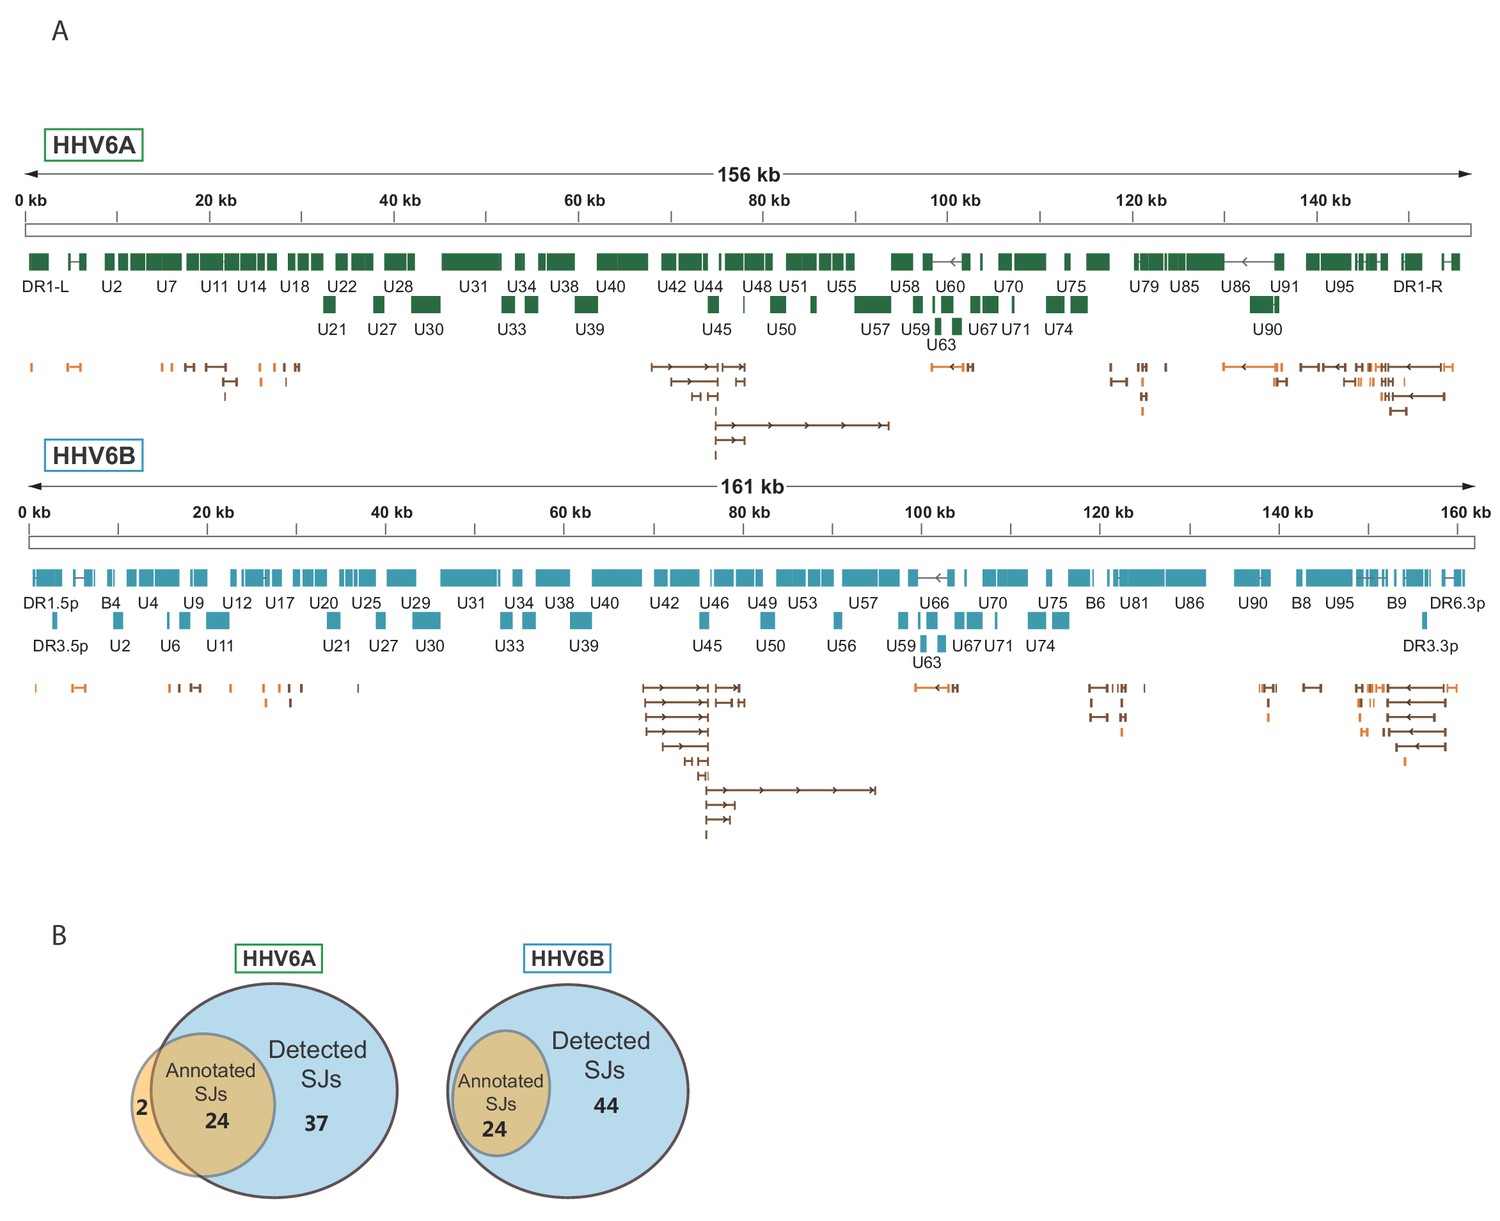
Splicing is abundant in HHV-6A and HHV-6B.
(A) Splice junctions mapped using RNA-seq reads are shown throughout the genomes of HHV-6A and HHV-6B. Previously annotated splice junctions are marked in orange and novel splice junctions are marked in brown. (B) Diagrams displaying the numbers of previously annotated and detected splice junctions for HHV-6A and HHV-6B.
-
Figure 3—source data 1
Splice junction annotation for HHV-6A. Scores from STAR and TopHat represent the number of reads covering the splice junction.
- https://cdn.elifesciences.org/articles/50960/elife-50960-fig3-data1-v1.xlsx
-
Figure 3—source data 2
Splice junction annotation for HHV-6B. Scores from STAR and TopHat represent the number of reads covering the splice junction.
- https://cdn.elifesciences.org/articles/50960/elife-50960-fig3-data2-v1.xlsx
Figure 3—figure supplement 1
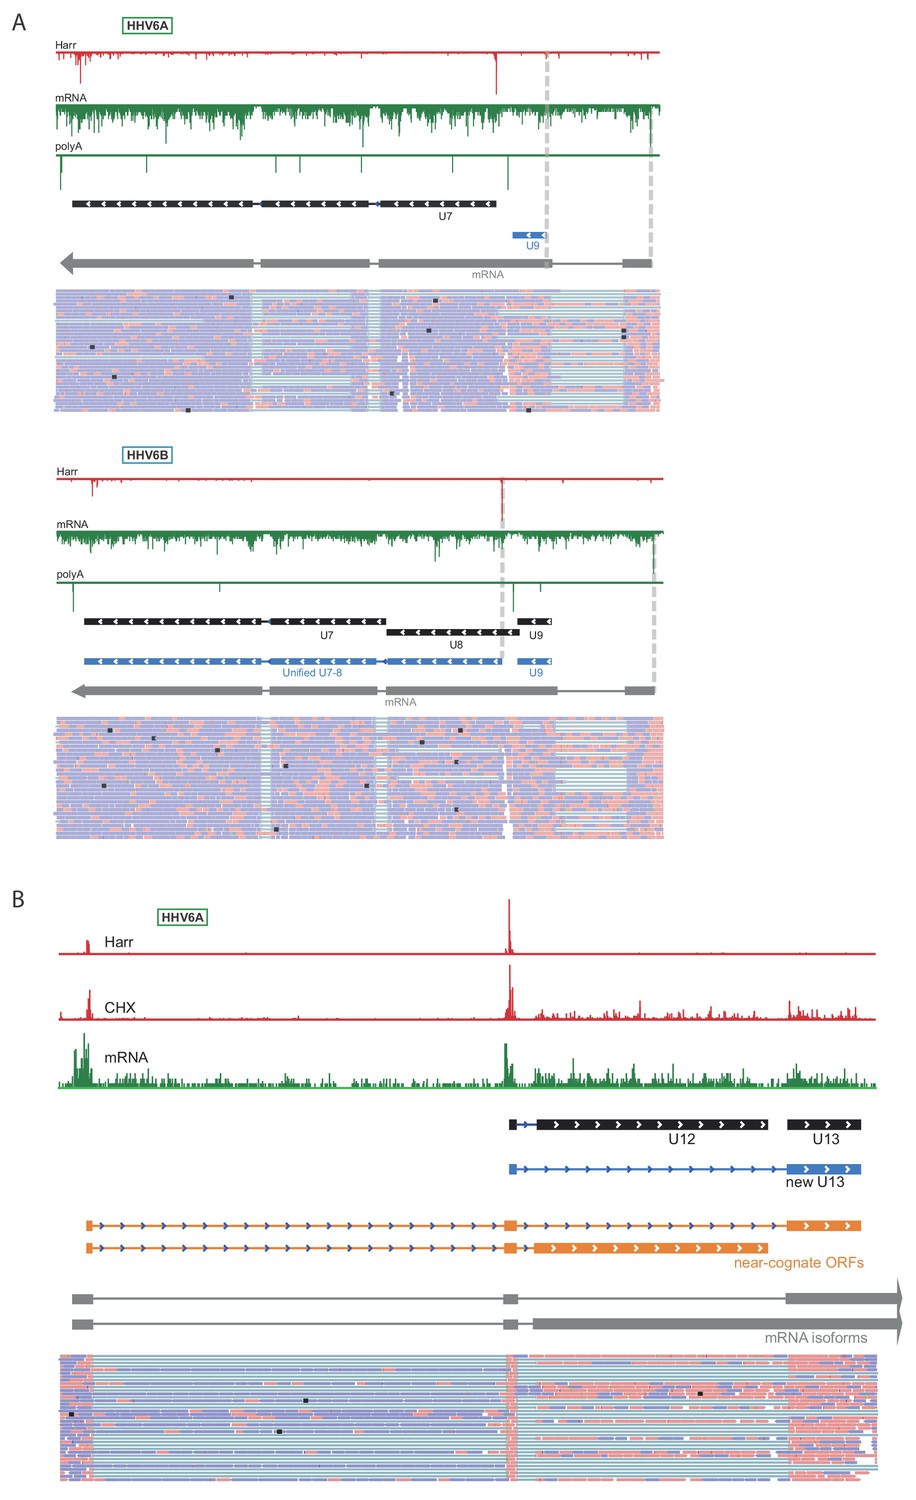
Novel splice junctions result in reannotation of HHV-6 ORFs.
Ribo-seq reads are shown in red and RNA-seq reads are shown in green for (A) the U7-9 locus of HHV-6A and HHV-6B. (B) The U12-13 locus of HHV-6A. Black rectangles mark canonical annotations of open reading frames, blue rectangles mark novel ORFs initiating at an AUG codon, and orange rectangles mark novel ORF initiating at a near-cognate start codon. Transcripts are shown in gray. RNA-seq read alignments in BAM format are shown at the bottom, thin gray lines represent spliced reads, pink lines are reads aligned to the positive strand and blue lines are reads aligned to the negative strand. LTM profiles resemble the Harr profiles and are therefore not presented in the figure.
Figure 4 with 2 supplements
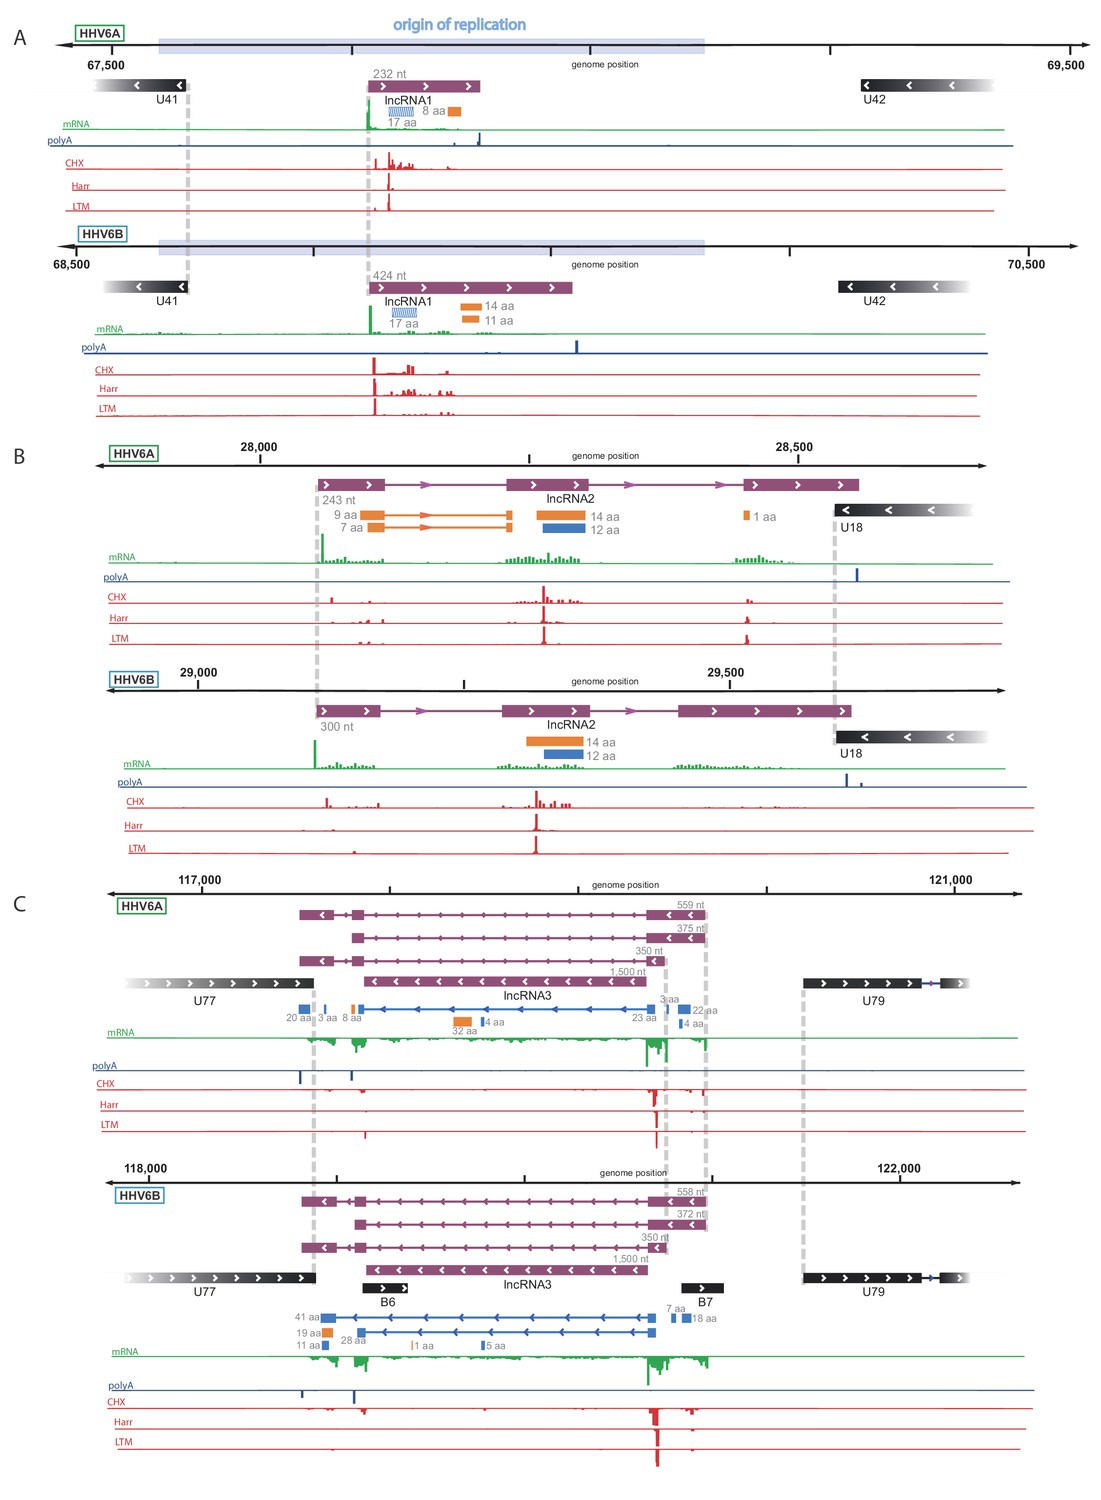
Identification of three highly abundant and conserved viral long non-coding RNAs (lncRNAs).
Viral transcripts that appear to be lncRNAs are shown as purple rectangles. Reads from RNA-seq are presented in green and reads containing polyA are presented in blue. The ribosome profiling (CHX), Harringtonine (Harr) and lactimidomycin (LTM) profiles are presented in red. (A) A transcript initiating within the origin of replication. One putative ORF not detected by our predictions (see Figure 6) is shown as a striped blue rectangle. (B) A spliced transcript initiating between U17 and U18. (C) Three possible isoforms of a spliced transcript with alternative splicing, initiation and termination, as well as a putative stable intron.
-
Figure 4—source data 1
RNA-seq and CHX Ribo-seq read density of previously annotated ORFs and novel lncRNAs for HHV-6A and HHV-6B.
- https://cdn.elifesciences.org/articles/50960/elife-50960-fig4-data1-v1.xlsx
Figure 4—figure supplement 1

Conservation by synteny of newly discovered HHV-6 lncRNAs.
(A and B) Reads from RNA-seq are presented in green. Black rectangles mark canonical ORFs and purple rectangles mark the putative lncRNAs (A) a lncRNA initiating within the lytic origin of replication of HHV-6A, HHV-6B and HCMV (RNA4.9). (B) A spliced lncRNA, likely generating a stable intron, transcribed from the locus between the viral helicase gene and a conserved early phosphoprotein gene in HHV-6A, HHV-6B, HCMV and Murine CMV (MCMV).
Figure 4—figure supplement 2
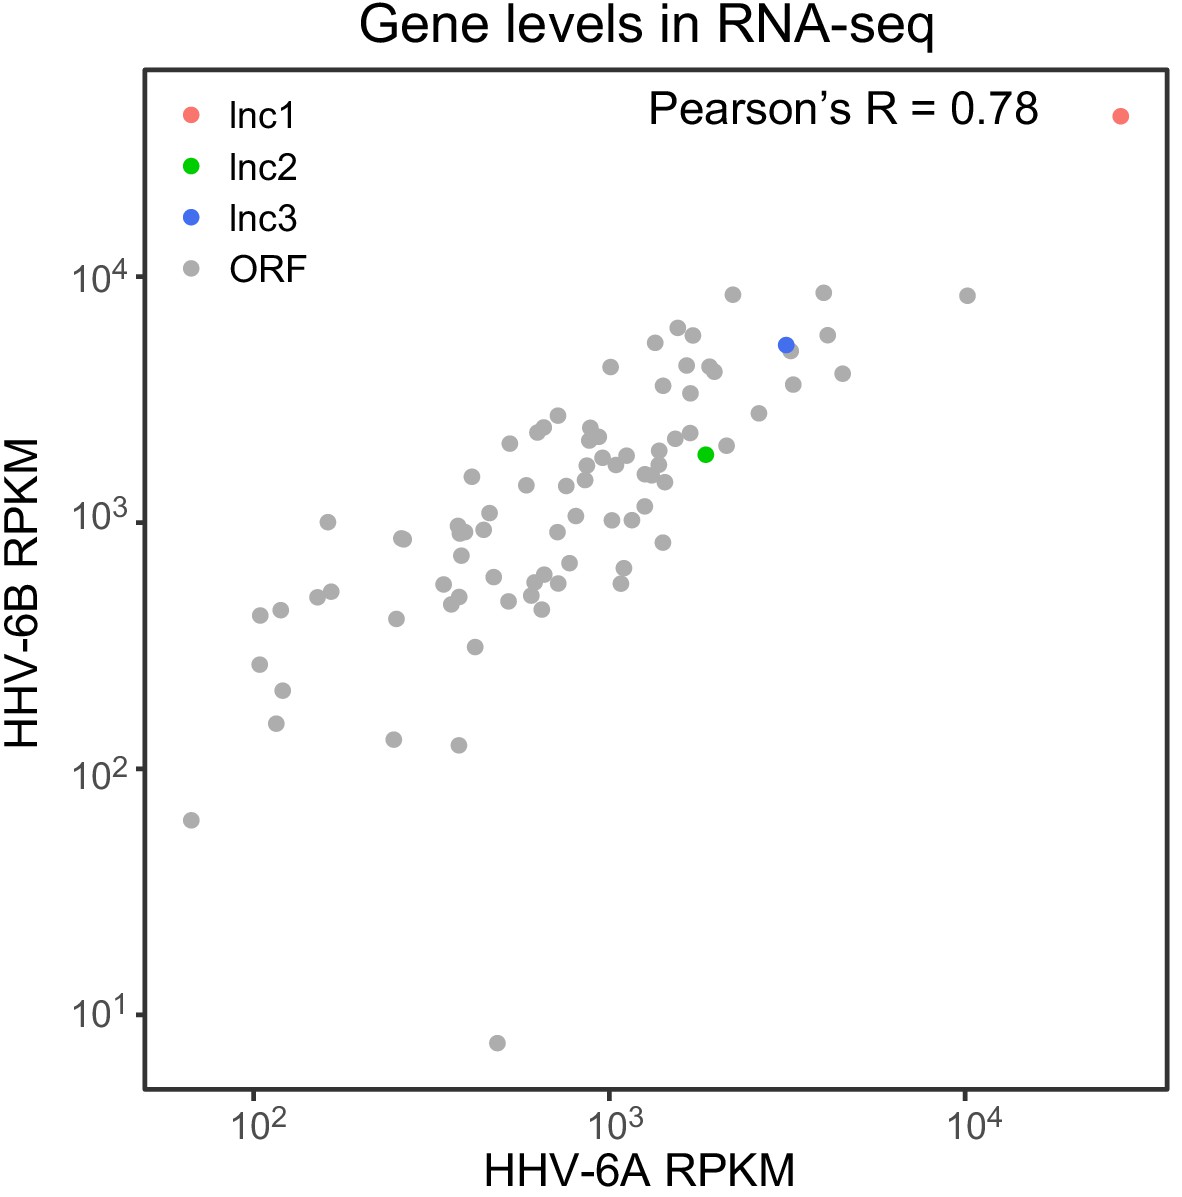
RNA abundance of canonical ORFs and viral lncRNAs is conserved between HHV-6A and HHV-6B.
Scatter plot of normalized RNA expression levels of canonical HHV-6 ORFs and novel lncRNAs. Gray dots represent ORFs, colored dots represent lncRNAs (lncRNA1 in red, lncRNA2 in green and lncRNA3 in blue).
Figure 5 with 1 supplement
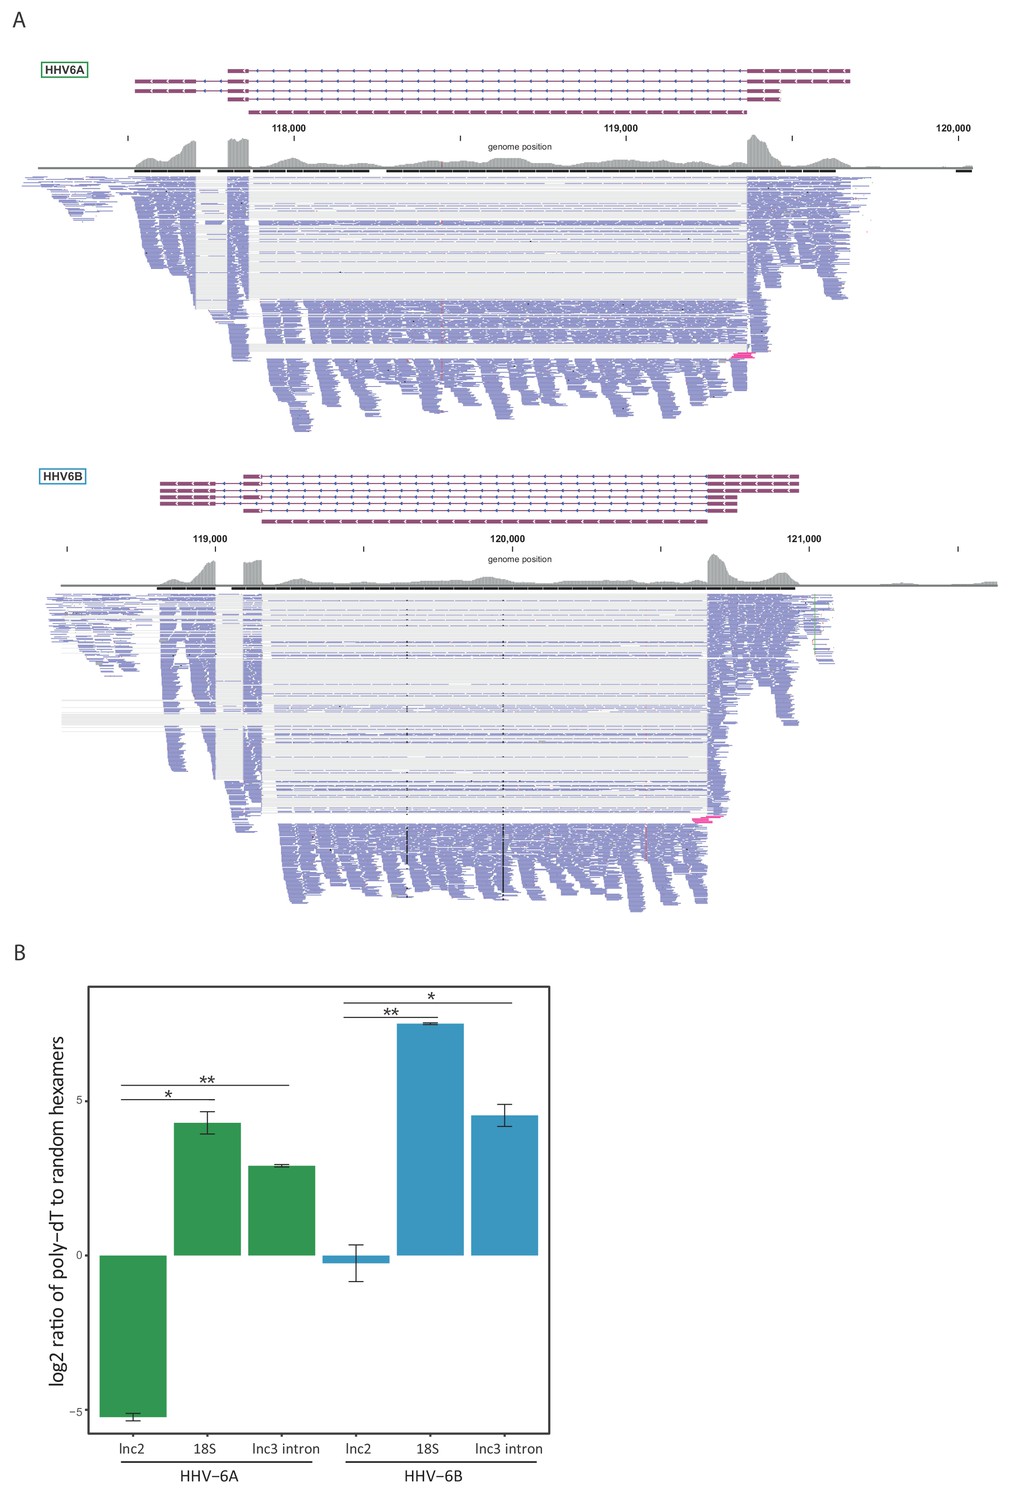
lncRNA3 generates a stable non poly adenylated intron.
(A) RNA-seq reads aligned to the negative strand of lncRNA3 locus in both HHV-6A and HHV-6B are presented. Thin gray lines represent spliced reads, blue lines represent reads aligned to either the exons or intron, pink lines represent reads that span the first exon intron junction. In regions with very high coverage (>100 reads per 50 nt region) reads were downsampled so that maximum 100 reads per region are displayed. Gray bars represent the total reads coverage without omissions. (B) RT-qPCR measurements of the HHV-6A and HHV-6B lncRNA3 intron RNA. Values were normalized to the HHV-6 U21 gene. cDNA was prepared with either oligo-dT or random hexamers primers and the ratio of these measurements is presented. Error bars represent standard error of biological duplicates. P-values were calculated using Student's t-test. * p-value<0.05 and ** p-value<0.01.
Figure 5—figure supplement 1
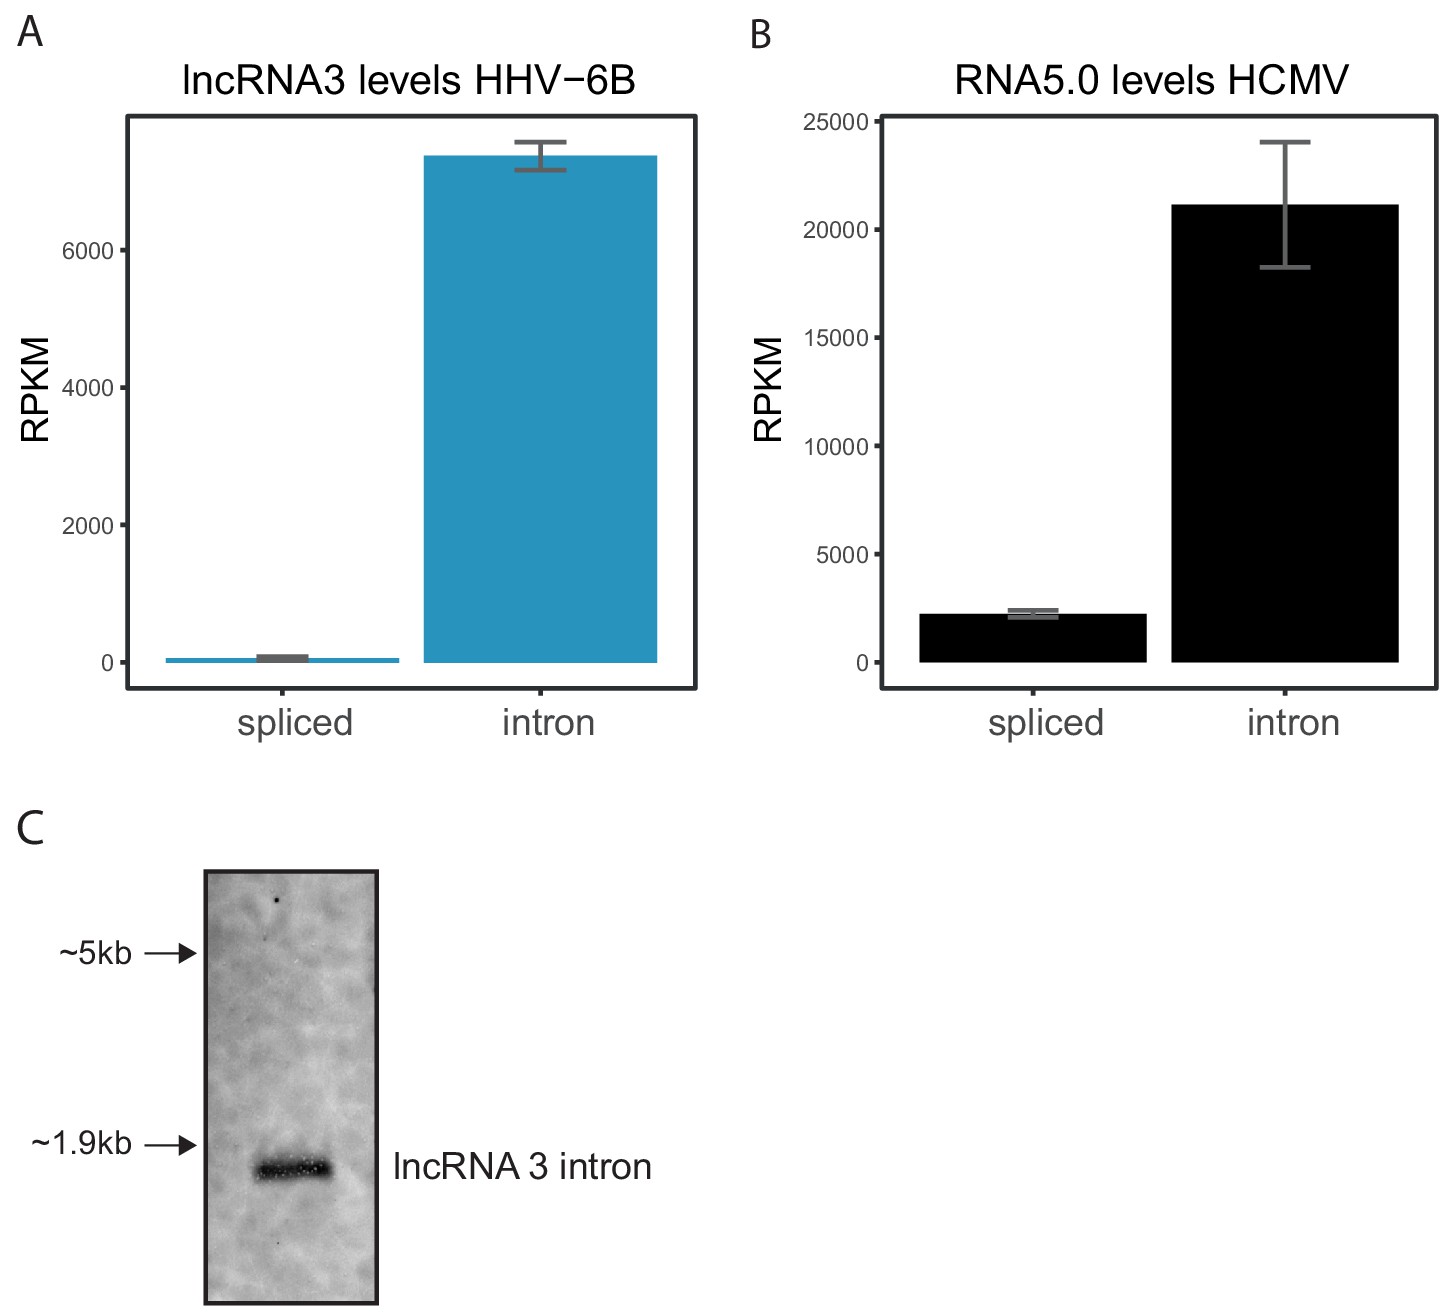
Abundance of lncRNA stable intron in total RNA.
Normalized RNA abundance as measured by RNA-seq of total RNA (without poly-A selection) from cells infected for 72 hr with (A) HHV-6B or (B) HCMV, of (A) the spliced lncRNA3 and the stable intron, or (B) the spliced RNA5.0 and the stable intron. Error bars represent standard error of biological replicates in A and triplicates in B. (C) Northern blot analysis of total RNA extracted from HHV-6B infected Molt-3 cells at 72hpi with probes against the lncRNA3 intron.
Figure 6
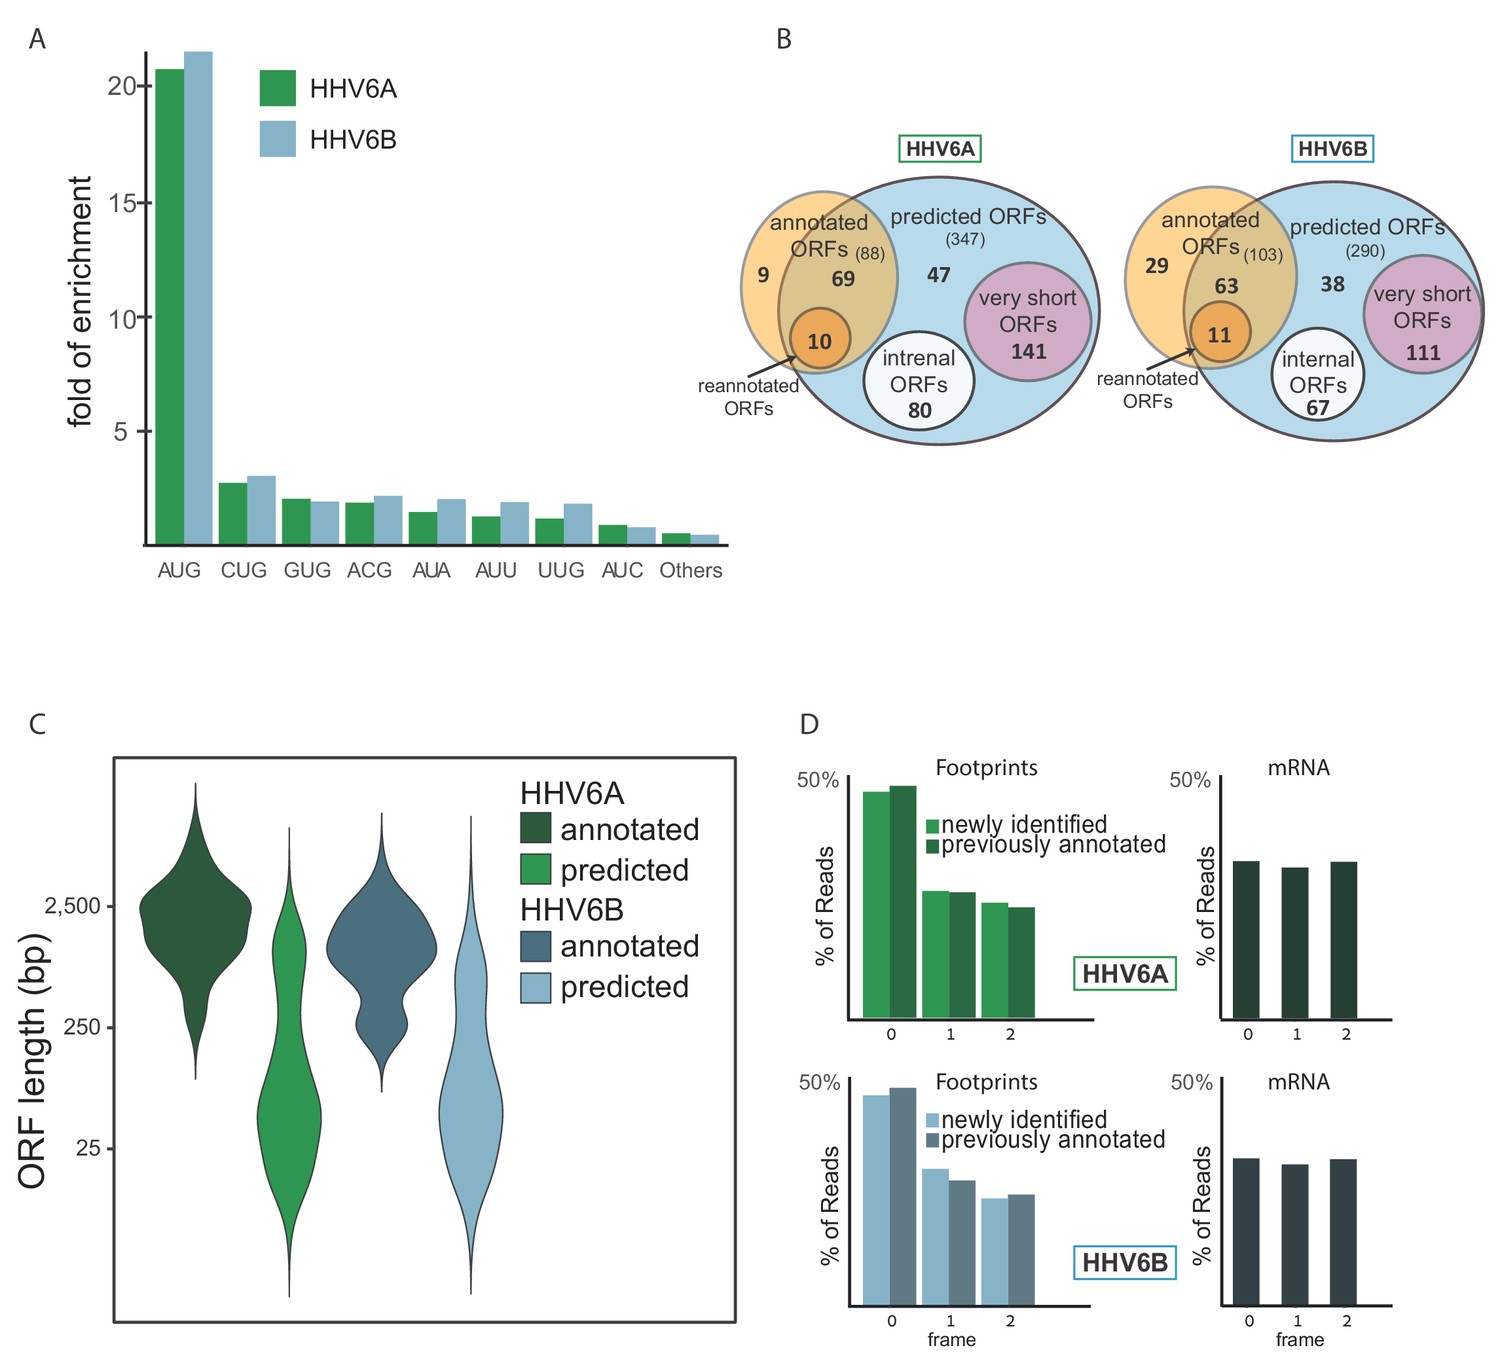
Identification of hundreds of novel HHV-6 ORFs.
(A) Fold enrichment of AUG and near-cognate codons at predicted sites of translation initiation compared to their genomic distribution. (B) Venn diagrams summarizing the HHV-6 translated ORFs. (C) Size distribution of previously annotated ORFs (dark) and of newly identified ORFs (bright). (D) Position of the ribosome footprint reads relative to the translated reading frame showing enrichment of the first position in the annotated ORFs (dark) as well as in the newly identified ones (bright). The mRNA reads were used as control and do not show enrichment to any frame.
-
Figure 6—source data 1
SVM predicted ORFs in HHV-6A.
- https://cdn.elifesciences.org/articles/50960/elife-50960-fig6-data1-v1.xlsx
-
Figure 6—source data 2
SVM predicted ORFs in HHV-6B.
- https://cdn.elifesciences.org/articles/50960/elife-50960-fig6-data2-v1.xlsx
-
Figure 6—source data 3
Previously annotated ORFs not included in the final predictions.
- https://cdn.elifesciences.org/articles/50960/elife-50960-fig6-data3-v1.xlsx
Figure 7 with 4 supplements

Temporal regulation of viral gene expression is driven by pervasive use of alternative 5’ ends.
(A) Heatmap of ribosome occupancy of HHV-6B ORFs clustered by relative expression levels at 5, 24 and 72hpi. Previously annotated kinetic class were labeled on the right as immediate early (IE, green), early (E, blue), late (L, pink), or unknown (N/A, gray). The cluster number appears on the left. (B and C) The ribosome occupancy (red) and mRNA profiles (green) are shown (B) around U53 loci at different hours post infection (marked on the left) and around its HCMV homolog, UL80 (C) and around U81 and U82 loci. (D and E) Dot plots showing the number of uORFs (D) and iORFs (E) of each canonical viral ORF with annotated kinetic class for HHV-6A, HHV-6B and HCMV. P-value was calculated using proportion test. * for p-value<0.05, ** for p-value<0.01 and N.S for non-significant.
-
Figure 7—source data 1
CHX Ribo-seq density and kinetic clusters of SVM predicted HHV-6B ORFs.
- https://cdn.elifesciences.org/articles/50960/elife-50960-fig7-data1-v1.xlsx
-
Figure 7—source data 2
Internal and upstream ORFs of previously annotated HHV-6A and HHV-6B ORFs and their HCMV homologs.
- https://cdn.elifesciences.org/articles/50960/elife-50960-fig7-data2-v1.xlsx
Figure 7—figure supplement 1
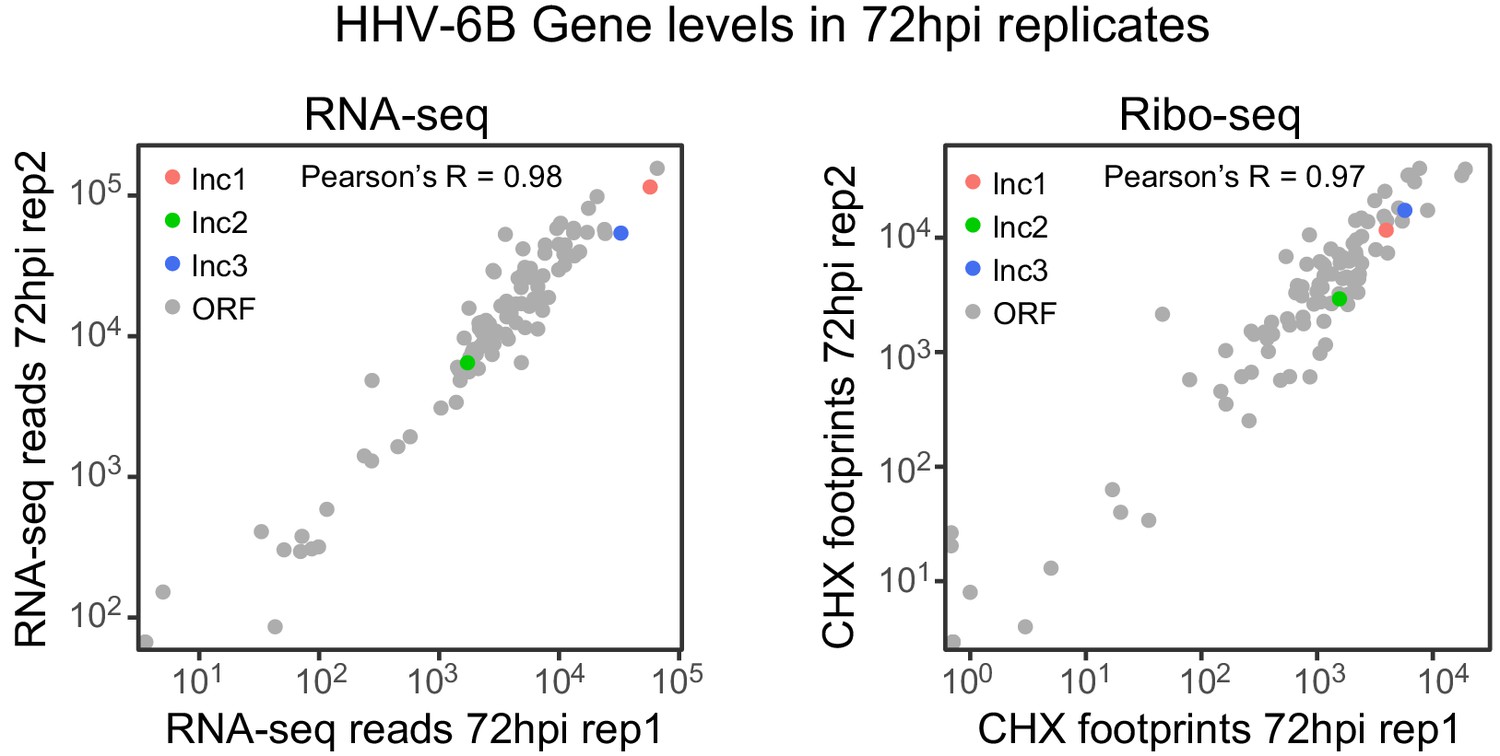
RNA abundance and ribosome footprint coverage correlate well between replicates.
Scatter plot of RNA-seq and CHX Ribo-seq reads of canonical HHV-6 ORFs and novel lncRNAs. Gray dots represent ORFs, colored dots represent lncRNAs (lncRNA1 in red, lncRNA2 in green and lncRNA3 in blue).
Figure 7—figure supplement 2

Conserved temporal regulation of translation from uoORF.
The ribosome occupancy and mRNA profiles are shown around the HHV-6B U51 locus and the UL78 HCMV locus, at different infection times (marked on the left). CHX Ribo-seq reads are presented in red and RNA-seq reads are presented in green. Black rectangles represent canonical annotations, blue rectangles represent novel ORF initiating at an AUG codon and in orange rectangles represent ORFs initiating at a near-cognate start codon.
Figure 7—figure supplement 3
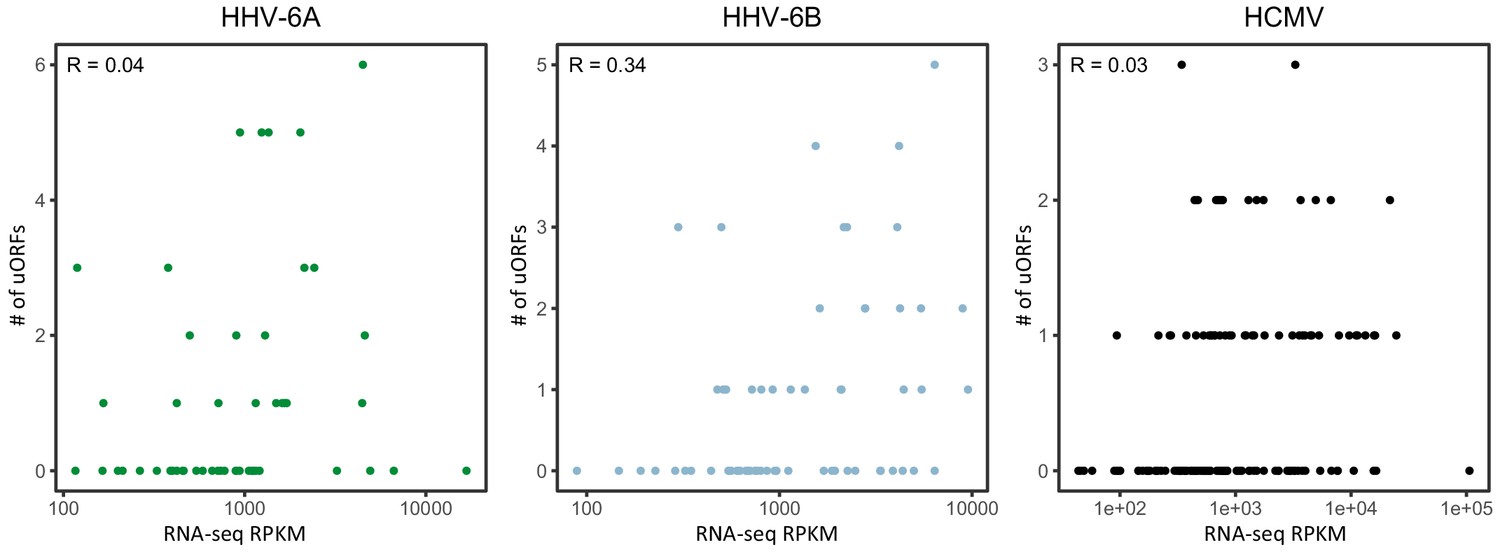
Number of uORFs as a function of RNA abundance.
Scatter plots showing the number of uORFs of each main ORF (Y axis) as a function of the RNA expression level of the same ORF as measured by RNA-seq (X axis). Pearson's correlation coefficient R is displayed for each virus.
Figure 7—figure supplement 4
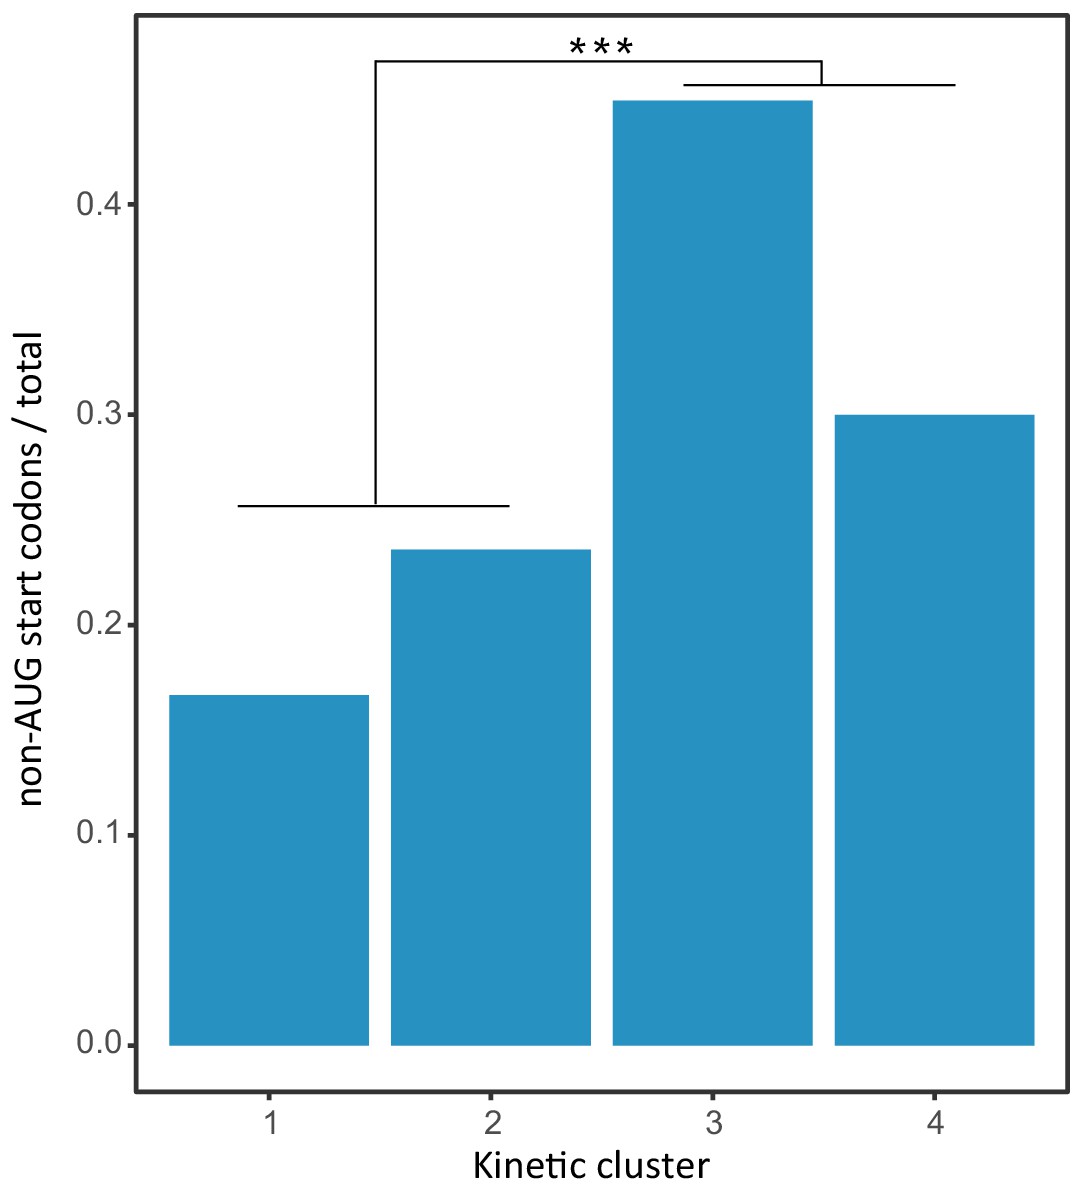
Enrichment of non-AUG start codons at late time points post infection.
The ratio of HHV-6B ORFs initiating and non-AUG start codons in each kinetic cluster (early clusters 1,2 and late clusters 3,4). P-value was calculated using proportion test. *** for p-value<0.001.
Figure 8 with 2 supplements
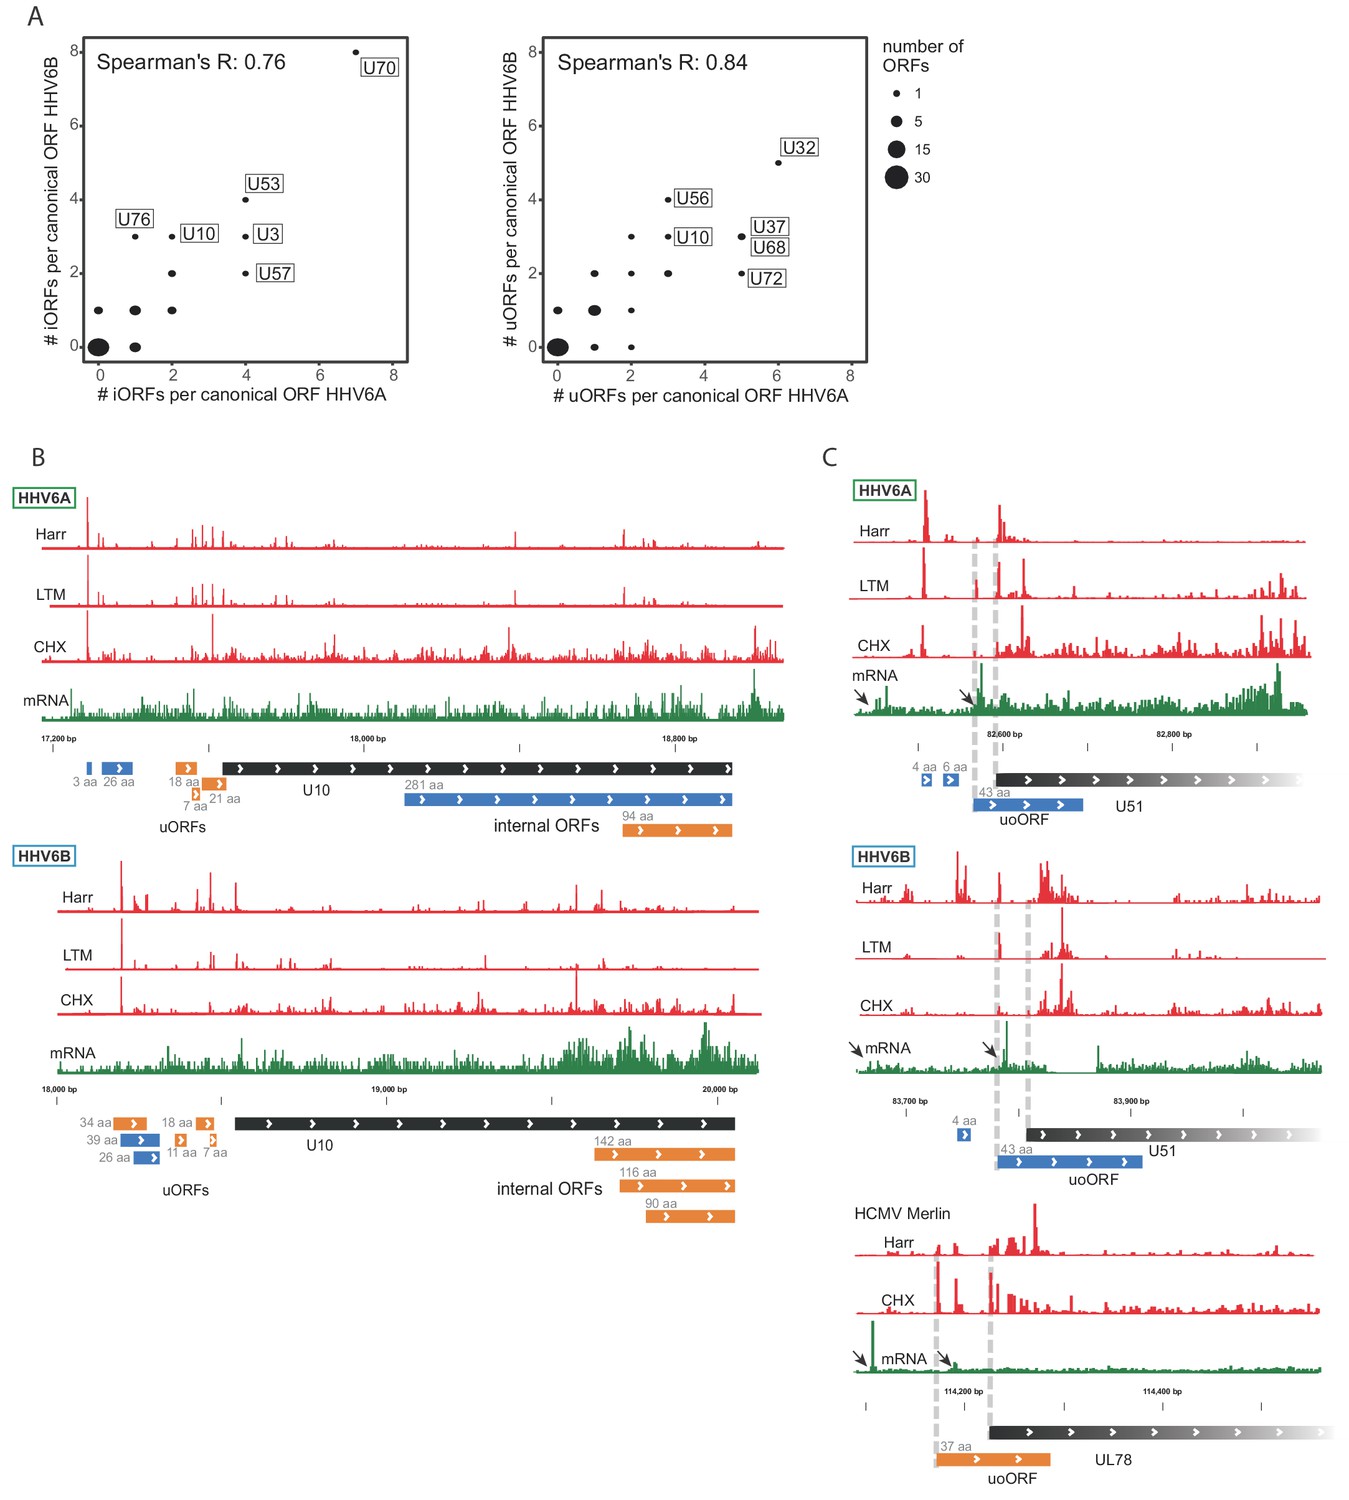
Numerous iORFs and uORFs are conserved between betaherpesviruses.
(A) Correlation between the number of iORFs and uORFs of canonical ORFs in HHV-6A and HHV-6B (55 shared canonical ORFs in total). Dot size indicates the number of canonical ORFs with the indicated number of iORFs or uORFs in the two viruses. (B–C) Selected examples of novel internal or upstream initiation events that are conserved between HHV-6A and HHV-6B. Shown in black rectangles are canonical ORFs, in blue are novel ORFs initiating at an AUG codon, and in orange are novel ORFs initiating at a near-cognate start codon. ORF sizes are written in gray. The ribosome occupancy profiles are shown in red and the mRNA profile is shown in green (B) at U10 locus for both HHV-6A and HHV-6B and (C) at the U51 locus in HHV-6A and HHV-6B and its HCMV homolog U78. The gap in RNA reads in HHV-6B U51 is due to a base insertion relative to the reference, preventing read alignment to the region.
Figure 8—figure supplement 1
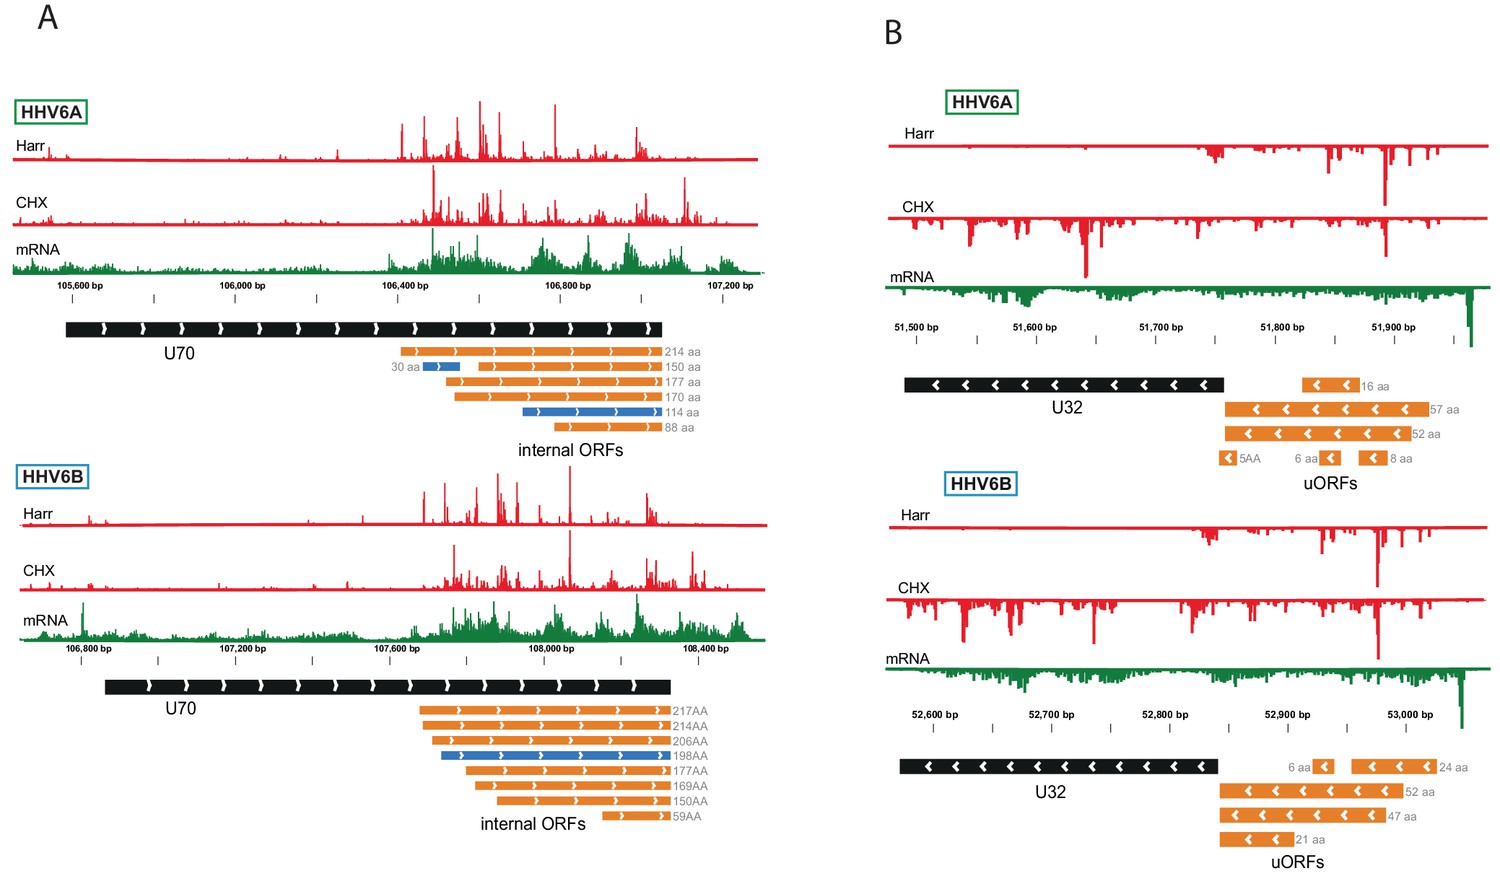
Viral loci with conserved presence of multiple uORFs and iORFs.
Ribo-seq reads (red) and RNA-seq (green) of several virus loci. Black rectangles represent canonical annotations, blue rectangles represent novel ORF initiating at an AUG codon and in orange rectangles represent ORFs initiating at a near-cognate start codon. ORF sizes are written in gray. (A) Multiple in-frame iORFs within U70 in HHV-6A and HHV-6B. (B) Multiple uORFs upstream of U32 ORF in HHV-6A and HHV-6B. LTM ribosome density profiles resemble the Harr ribosome density profiles and are not presented.
Figure 8—figure supplement 2
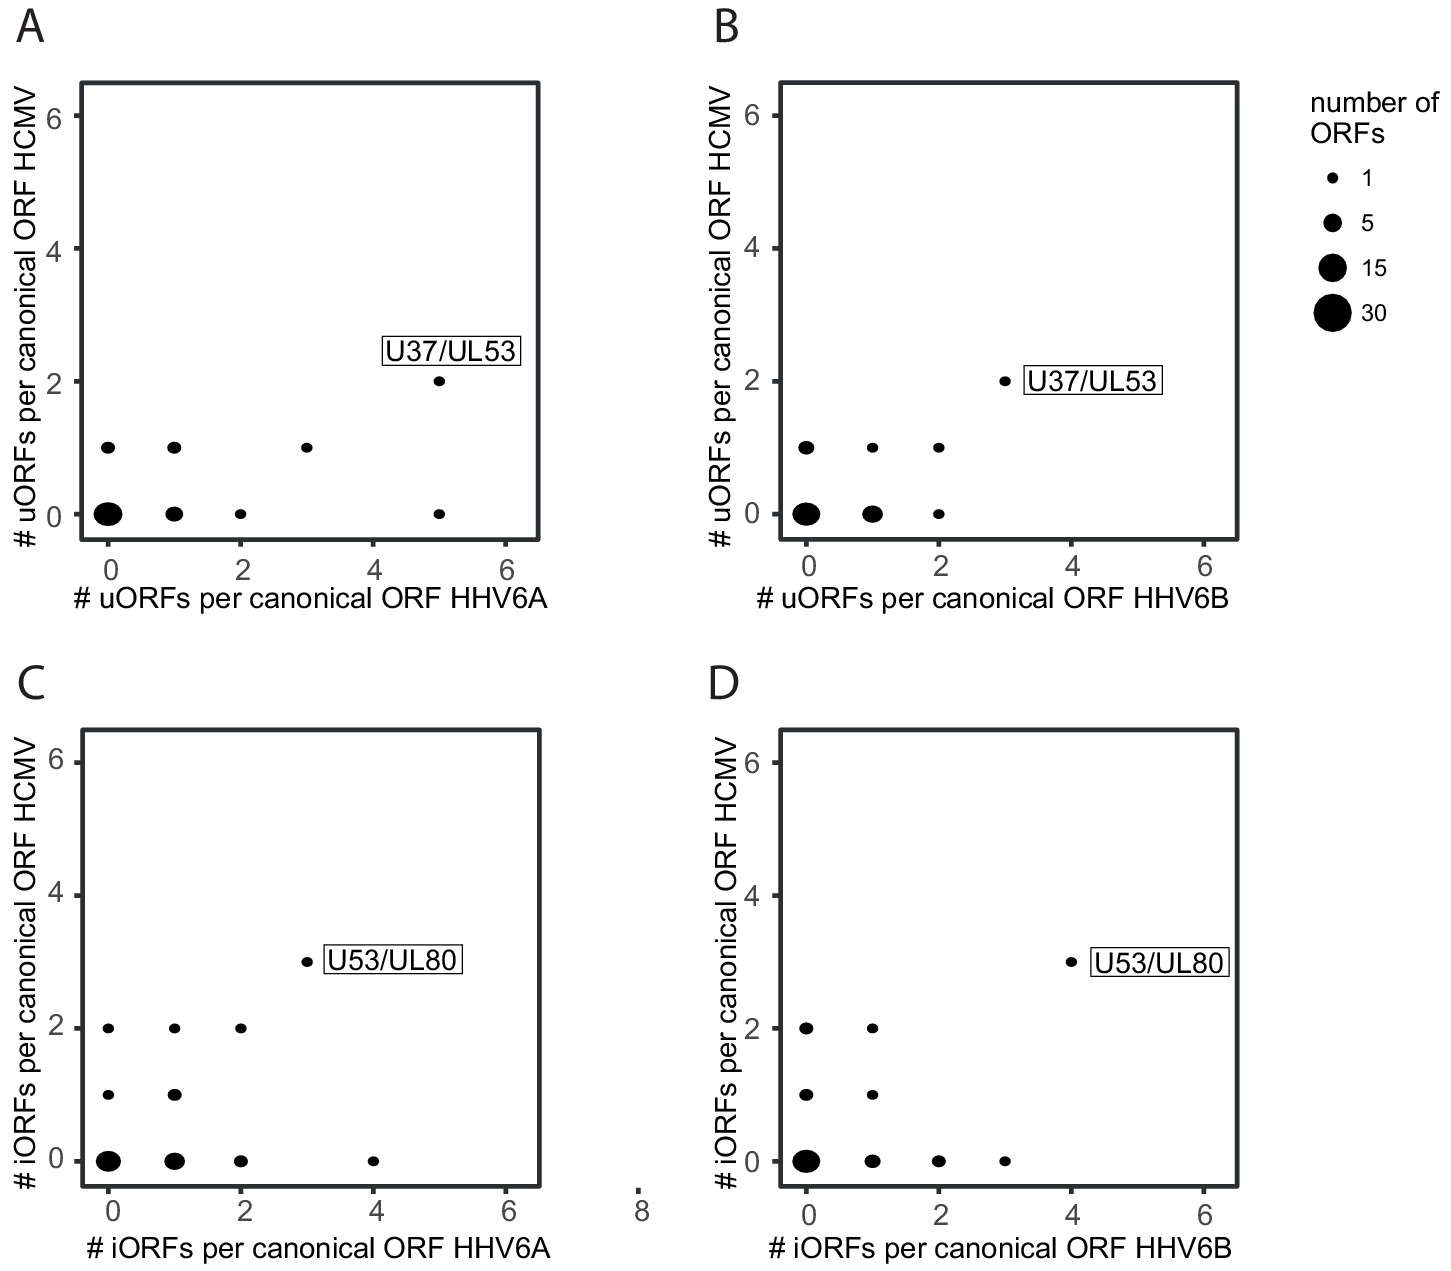
Synteny conservation of uORFs and iORFs between HHV-6 and HCMV.
Correlation between the number of iORFs and uORFs of canonical HCMV and HHV-6 ORFs (26 canonical main ORFs in total). Dot size indicates the number of canonical ORFs with the indicated number of iORFs or uORFs in the two viruses. (A) HHV-6A and HCMV uORFs, (B) HHV-6B and HCMV uORFs, (C) HHV-6A and HCMV iORFs, and (D) HHV-6B and HCMV iORFs.
Tables
Key resources table
| Reagent type (species) or resource | Designation | Source or reference | Identifiers | Additional information |
|---|---|---|---|---|
| Strain, strain background (HHV-6A) | GS | NIH AIDS | ||
| Strain, strain background (HHV-6B) | Z29 | NIH AIDS | ||
| Cell line (Homo-sapiens) | HSB-2 | NIH AIDS, Electro-Nucleonics, Inc (Barre-Sinoussi et al., 1983) | ||
| Cell line (Homo-sapiens) | Molt-3 | NIH AIDS | ATCC CRL1552 | |
| Sequence-based reagent | lncRNA3-6A F | This paper | qPCR primers | AAAAGGACAAGAGCAGCCGC |
| Sequence-based reagent | lncRNA3-6A R | This paper | qPCR primers | ACTCGTATCACCTACCTCTCTCTAC |
| Sequence-based reagent | lncRNA3-6A F | This paper | qPCR primers | GGTATCGGGGTAAGAATAAGATGACG |
| Sequence-based reagent | lncRNA3-6A R | This paper | qPCR primers | AAAAGGACAAGAGCAGCCGC |
| Sequence-based reagent | lncRNA2-6B F | This paper | qPCR primers | CAAAACGGTCTCACTGCTCC |
| Sequence-based reagent | lncRNA2-6B R | This paper | qPCR primers | TCTATAAAGTGCCGTGAGTGC |
| Sequence-based reagent | lncRNA2-6A F | This paper | qPCR primers | CGACAAAACAAAATAGTCCCACT |
| Sequence-based reagent | lncRNA2-6A R | This paper | qPCR primers | ATGGAAAAGGTGGTCGTGGA |
| Sequence-based reagent | U21-6B F | This paper | qPCR primers | CCGCACCCATGAACATAAGG |
| Sequence-based reagent | U21-6B R | This paper | qPCR primers | ATGATGTGACGTGGGGACTT |
| Sequence-based reagent | U21-6A F | This paper | qPCR primers | CCAGCCACCTAGAGAACGAA |
| Sequence-based reagent | U21-6A R | This paper | qPCR primers | TTGGGCTGAACTCTCGACAT |
| Sequence-based reagent | 18 S F | This paper | qPCR primers | CTCAACACGGGAAACCTCAC |
| Sequence-based reagent | 18 S R | This paper | qPCR primers | CGCTCCACCAACTAAGAACG |
| Sequence-based reagent | probe 1 F | This paper | Northern blot probe template primers | GTAAGATTTAACCTATTTTGCAT |
| Sequence-based reagent | probe 1 R | This paper | Northern blot probe template primers | TAATACGACTCACTATAGGGTGA TGACAATATAGAAGATGG |
| Sequence-based reagent | probe 2 F | This paper | Northern blot probe template primers | GAAAAGTCATCAGAAAAGTCATCAGAA |
| Sequence-based reagent | probe 2 R | This paper | Northern blot probe template primers | TAATACGACTCACTATAGGG TCA ACTGTTTTGTGCCCAAC |
| Sequence-based reagent | probe 3 F | This paper | Northern blot probe template primers | TATTTAGTTCACATTATAAGGACCT |
| Sequence-based reagent | probe 3 R | This paper | Northern blot probe template primers | TAATACGACTCACTATAGGGCT GCAAAAACAAATGAAAGTCT |
| Software, algorithm | Bowtie v1.1.2 | (Langmead et al., 2009) | ||
| Software, algorithm | Morpheus | https://software.broadinstitute.org/morpheus | ||
| Software, algorithm | TopHat v2.1.1 | (Kim et al., 2013; Trapnell et al., 2009) | ||
| Software, algorithm | STAR v2.5.3a | (Dobin et al., 2013) | ||
| Software, algorithm | R 3.6.0 | (R Development Core Team, 2019; Wickham, 2016) |
Additional files
-
Supplementary file 1
Mismatches between RNA-seq data and the HHV-6A GS reference genome.
- https://cdn.elifesciences.org/articles/50960/elife-50960-supp1-v1.xlsx
-
Supplementary file 2
Mismatches between RNA-seq data and the HHV-6B Z29 reference genome.
- https://cdn.elifesciences.org/articles/50960/elife-50960-supp2-v1.xlsx
-
Supplementary file 3
Previously annotated ORFs added manually to final ORF predictions.
- https://cdn.elifesciences.org/articles/50960/elife-50960-supp3-v1.xlsx
-
Supplementary file 4
Updated ORF annotations HHV-6A.
Bed format file of genomic loci of ORFs in the genome of HHV-6A curated using SVM model predictions with manual modifications, see Materials and methods.
- https://cdn.elifesciences.org/articles/50960/elife-50960-supp4-v1.bed
-
Supplementary file 5
Bed format file of genomic loci of ORFs in the genome of HHV-6B curated using SVM model predictions with manual modifications, see Materials and methods.
- https://cdn.elifesciences.org/articles/50960/elife-50960-supp5-v1.bed
-
Supplementary file 6
lncRNA annotations HHV-6A.
Bed format file of genomic loci of newly identified lncRNAs in the genome of HHV-6A.
- https://cdn.elifesciences.org/articles/50960/elife-50960-supp6-v1.bed
-
Supplementary file 7
Bed format file of genomic loci of newly identified lncRNAs in the genome of HHV-6B.
- https://cdn.elifesciences.org/articles/50960/elife-50960-supp7-v1.bed
-
Supplementary file 8
GenBank format annotation file HHV-6A.
GenBank files containing annotations of ORFs, lncRNAs and splice junctions as described in this paper for HHV-6A.
- https://cdn.elifesciences.org/articles/50960/elife-50960-supp8-v1.gb
-
Supplementary file 9
GenBank files containing annotations of ORFs, lncRNAs and splice junctions as described in this paper for HHV-6B.
- https://cdn.elifesciences.org/articles/50960/elife-50960-supp9-v1.gb
-
Transparent reporting form
- https://cdn.elifesciences.org/articles/50960/elife-50960-transrepform-v1.docx
Download links
A two-part list of links to download the article, or parts of the article, in various formats.
Downloads (link to download the article as PDF)
Open citations (links to open the citations from this article in various online reference manager services)
Cite this article (links to download the citations from this article in formats compatible with various reference manager tools)
Comprehensive annotations of human herpesvirus 6A and 6B genomes reveal novel and conserved genomic features
eLife 9:e50960.
https://doi.org/10.7554/eLife.50960


