Impaired lysosomal acidification triggers iron deficiency and inflammation in vivo
- University Medical Center Goettingen, Germany
- European Neuroscience Institute, a Joint Initiative of the Max-Planck Institute and of the University Medical Center Goettingen, Germany
- Max-Planck Institute for Biophysical Chemistry, Germany
- Texas A&M University Health Science Center, United States
- Technion Israel Institute of Technology, Israel
Figures
Figure 1
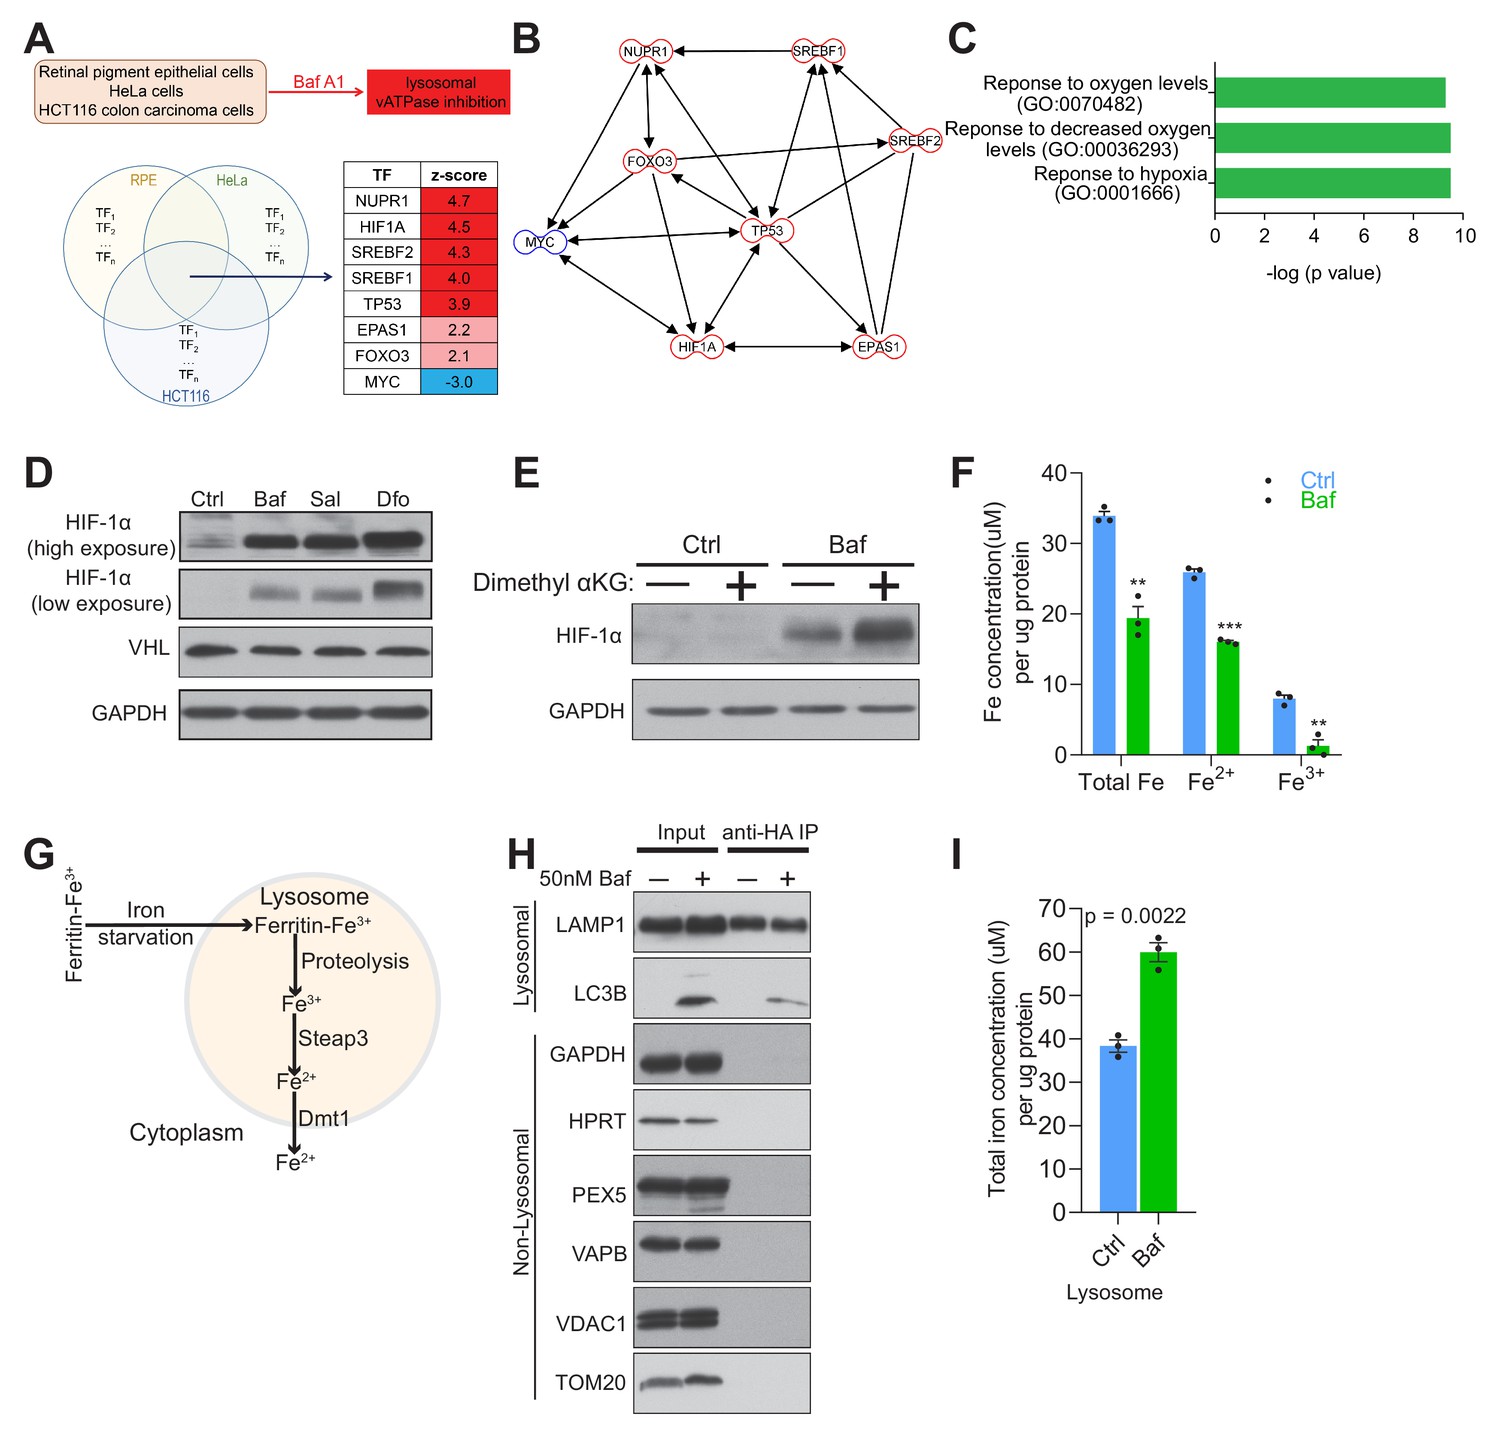
Lysosomal v-ATPase inhibition triggers HIF-1α activation.
(A) Venn diagram illustrating common significantly changed upstream regulators (shown as a table) mediating differential gene expression in bafilomycin (Baf)-treated cells in three different transcriptome datasets from HeLa, HCT116 and RPE cells. (B) Transcription factor network of the significantly changed upstream regulators found in Figure 1A. (C) Metascape gene set enrichment analyses show significant overrepresentation of the transcription factors (Figure 1A) in the hypoxia response. (D) Immunoblot of HIF-1α and VHL with GAPDH as loading control in cell lysates of 500 nM Baf- and 500 nM saliphe (Sal)-treated fibroblasts. 300 µM Dfo is used as a positive control for the iron deficiency response. (E) Western blot of whole cell extracts showing HIF-1α levels in control and 500 nM Baf-treated fibroblasts supplemented with cell-permeant aα-ketoglutarate (5 mM). GAPDH is used as a loading control (n = 3). (F) Total, ferrous and ferric iron concentrations in fibroblasts treated with or without 500 nM Baf for 24 hr. Results are summarized as mean ± SEM of three experimental measures shown as black dots. **p<0.01; ***p<0.001, unpaired two-tailed t-test. (G) Illustration of the intralysosomal pathway of iron homeostasis handling (H) Immunoblot of lysosomes following purification by the lysoIP method in 3x HA-tagged Tmem192 mouse embryonic fibroblasts treated with or without 50 nM Baf for 24 hr. Lysosomal purity is shown by enrichment of LAMP1 and LC3B in the lysosomal compartment, while excluding GAPDH and HPRT (cytosol), PEX5 (peroxisome), VAPB (endoplasmic reticulum), and VDAC1 and TOM20 (mitochondria), n = 3. (I) Total iron concentration in lysosomes purified from fibroblasts treated with or without 50 nM Baf for 24 hr. Results are shown as mean ± SEM of three experimental measures shown as black dots. The indicated p value is the unpaired two-tailed t-test with Welch’s correction.
Figure 2 with 1 supplement
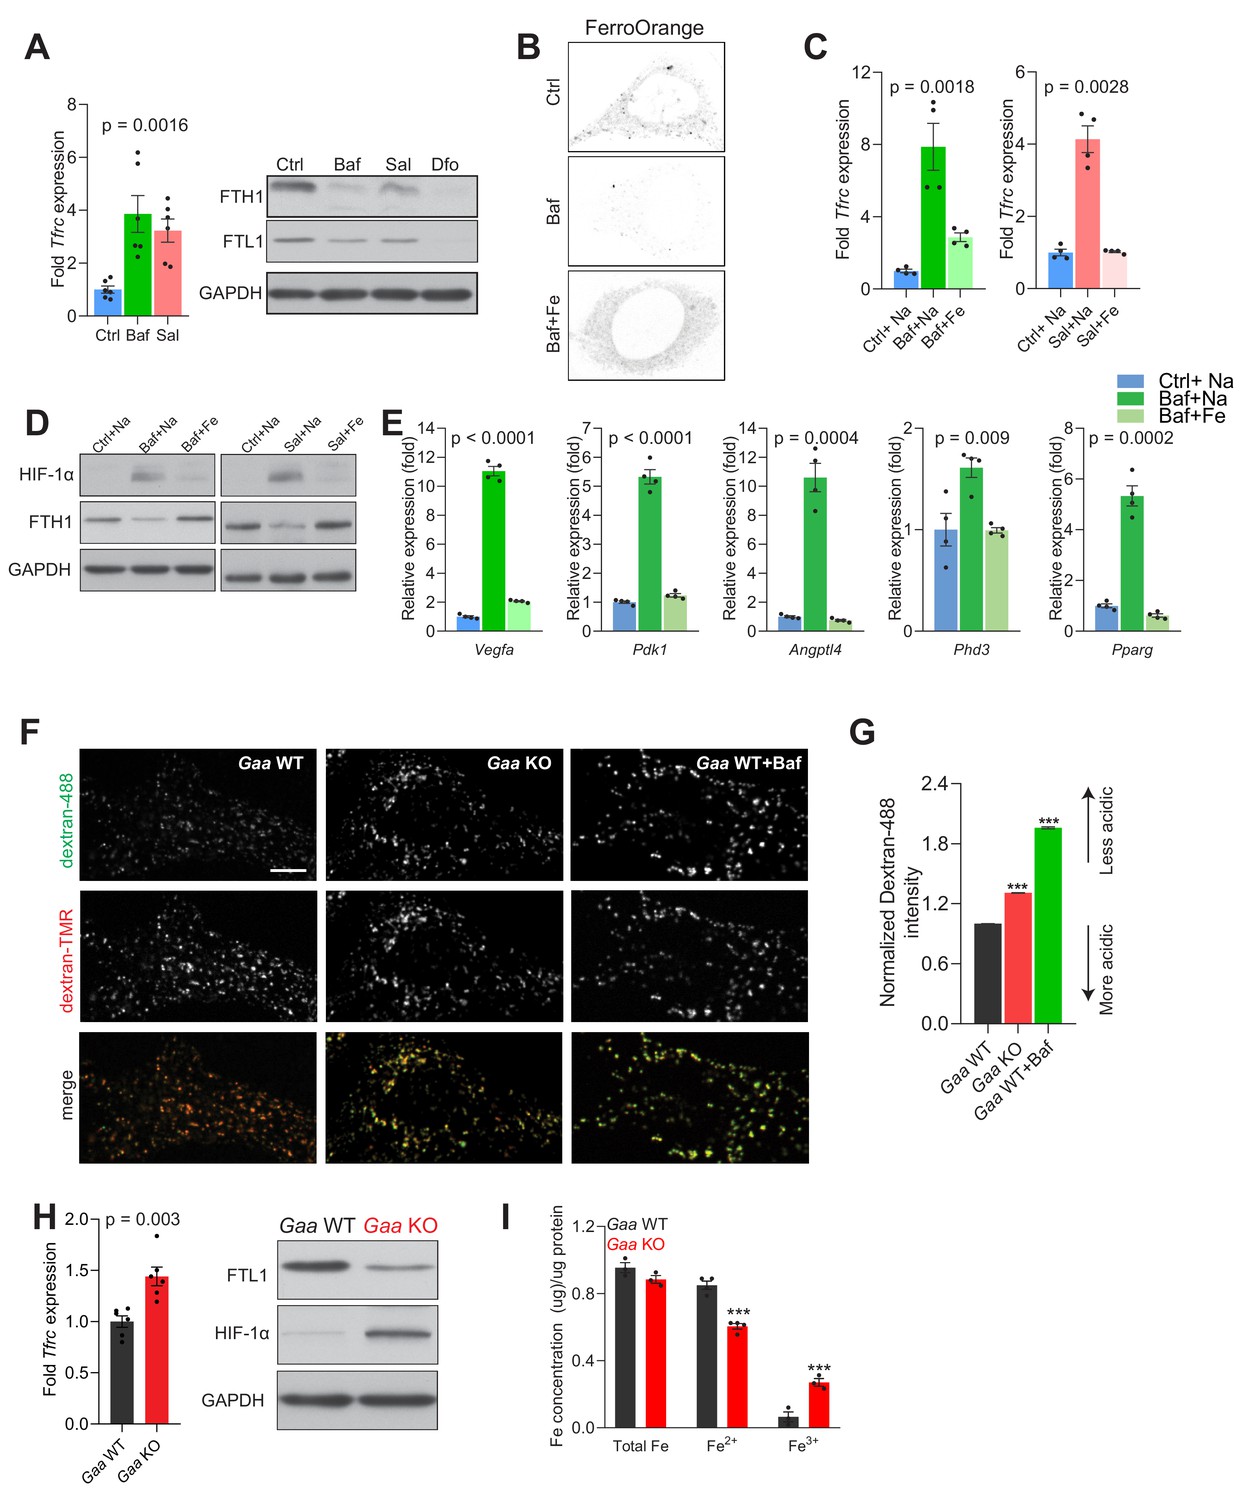
Lysosomal iron efflux regulates HIF-1α response.
(A) Increased Tfrc transcript levels in 500 nM Baf- and 500 nM Sal-treated mouse embryonic fibroblasts relative to untreated fibroblasts. Western blot showing decreased FTH1 and FTL1 protein levels in Baf- and Sal-treated fibroblasts (n = 6). GAPDH is used as loading control. Tfrc expression is depicted as bars representing mean ± SEM, n = 6; shown as black dots. p value is determined by the Welch’s one-way ANOVA as differences between untreated group, and Baf- and Sal-treatments. (B) Representative images of FerroOrange staining of cytoplasmic labile iron pools in control, 500 nM Baf-treated and 500 nM Baf-treated fibroblasts with 150 µM iron citrate supplementation. Note the reduced staining in Baf-treated fibroblasts relative to the other conditions. (C) mRNA levels of Tfrc in control, 500 nM Baf-treated and 500 nM Baf-treated fibroblasts with 150 µM iron citrate supplementation (left) or in control, 500 nM Sal-treated and 500 nM Sal-treated fibroblasts with 150 µM iron citrate supplementation (right) for 24 hr. Bar graphs depict mean ± SEM of four independent experimental measures (shown as black dots). p values represent Welch’s one-way ANOVA with Dunnett’s correction for multiple comparisons, estimated as differences between Baf- or Sal-treated cells and other experimental groups. (D) Whole cell immunoblots of HIF-1α and FTH1 in fibroblasts treated with 500 nM Baf or 500 nM Baf + 150 µM iron citrate (left) or with 500 nM Sal and 500 nM Sal + 150 µM iron citrate (n = 4). GAPDH is used as loading control. (E) Transcript levels of HIF-1α target genes in fibroblasts treated with 500 nM Baf or with 500 nM Baf + 150 µM iron citrate. The mean ± SEM of four biological replicates (black dots) is shown. p-values are determined by Welch’s one-way ANOVA with Dunnett’s correction for multiple comparisons (all experimental groups compared to Baf-treated cells). (F–G) Gaa KO fibroblasts display impaired lysosomal acidification. Representative spinning-disk microscopy images for Gaa WT and Gaa KO MEFs co-stained with Dextran-Oregon Green 488 and Dextran-TMRM are shown with Baftreatment in Gaa WT used as a positive control for impaired acidification. Scale bar 2 µm. (G) Quantification of the intensity of Dextran-Oregon Green in Dextran-TMRM positive punta shows increased Dextran-Oregon Green intensity in Gaa KO fibroblasts and in Baf-treated Gaa WT fibroblasts. Bar graphs depict mean ± SEM, n = 3 independent experiments, with 50 cells per condition from each experiment. ***p<0.001, determined by the unpaired two-tailed t-test with Welch’s correction (H) Increased Tfrc expression (left) in Gaa-/- fibroblasts (n = 6, depicted as black dots). p value is determined by the unpaired two-tailed t-test with Welch’s correction. Whole cell immunoblots of FTL1 and HIF-1α (right) in Gaa-/- fibroblasts (n = 6). GAPDH is used as loading control. (I) Total, ferrous and ferric iron concentrations in fibroblasts prepared from Gaa-/- and their wild type littermate controls. Results are summarized as mean ± SEM of experimental measures shown as black dots. Differences between means shown as actual p values are determined by the unpaired two-tailed t-test with Welch’s correction.
Figure 2—figure supplement 1

HIF-1a mediated response is triggered by lack of lysosomal iron efflux.
(A) Increased Tfrc mRNA levels in fibroblasts treated with lysosomal iron chelator, Dfo (300 µM) for 24 hr. Bar graphs represent mean ± SEM for six independent experimental measures (shown as black dots). p-value is unpaired two-tailed t-test with Welch’s correction. (B) Immunoblots of SQSTM1 and LC3B in 500 nM Baf- and 500 nM Sal-treated fibroblasts (n = 6). 300 µM Dfo is used as positive control for the independence of impaired lysosomal iron efflux on defective autophagy. GAPDH is used as loading control. (C) Increased Tfrc mRNA levels in fibroblasts treated with either vehicle control, 50 µM Chloroquine (CQ) or 50 nM Baf for 24 hr (left). Bar graphs represent mean ± SEM for four independent experimental measures (shown as black dots). p value is Welch’s one-way ANOVA with all experimental groups compared to vehicle control treated cells. Multiple test corrections were by the Dunnett’s method. Immunoblots of HIF-1α, FTH1 and FTL1 with GAPDH as loading control in whole cell lysates prepared from fibroblasts treated for 24 hr with either vehicle control, 50 µM Chloroquine (CQ) or 50 nM Baf (right). Blots are representative of n = 4 biological replicates. (D) Expression level of HIF-1a target genes in 500 nM Sal- and 500 nM Sal-treated fibroblasts with 150 µM iron citrate supplementation. p values are estimated as Welch’s one-way ANOVA with all experimental groups compared to Sal-treated cells. Multiple test corrections were by the Dunnett’s method. (E) Tfrc mRNA levels in fibroblasts with siRNA mediated silencing of Atp6v1h subunit of the vATPase (left). Relative Tfrc expression is shown as bars representing mean ± SEM, n = 6 biological replicates (black dots). p value is determined by the Welch’s one-way ANOVA followed by Dunnett’s correction for multiple comparisons of all groups to the siCtrl group. Efficient knockdown is shown as immunoblot of ATP6V1H (right). Immunoblots of HIF-1α, FTH1, FTL1 with GAPDH as loading control are also shown for n = 3 biological samples in fibroblasts with Atp6v1h knockdown. (F–G) Silencing of Atp6v1h in fibroblasts results in impaired lysosomal acidification. Representative spinning-disk microscopy images for siCtrl and siAtp6v1h fibroblasts were co-stained with Dextran-Oregon Green 488 and Dextran-TMRM with Baf treatment in siCtrl cells used as a positive control for impaired acidification. Scale bar 2 µm. (G) Quantification of the intensity of Dextran-Oregon Green in Dextran-TMRM positive punta shows increased Dextran-Oregon Green intensity in Atp6v1h knockdown fibroblasts and in Baf-treated siCtrl fibroblasts. Bar graphs depict mean ± SEM, n = 3 independent experiments, with 20 cells per condition from each experiment. ***p<0.001, determined by the unpaired two-tailed t-test with Welch’s correction (H) Expression level of HIF-1a target genes following Atp6v1h knockdown in fibroblasts. p values are estimated as Welch’s one-way ANOVA with all experimental groups compared to siCtrl cells. Multiple test corrections were by the Dunnett’s method.
Figure 3 with 2 supplements
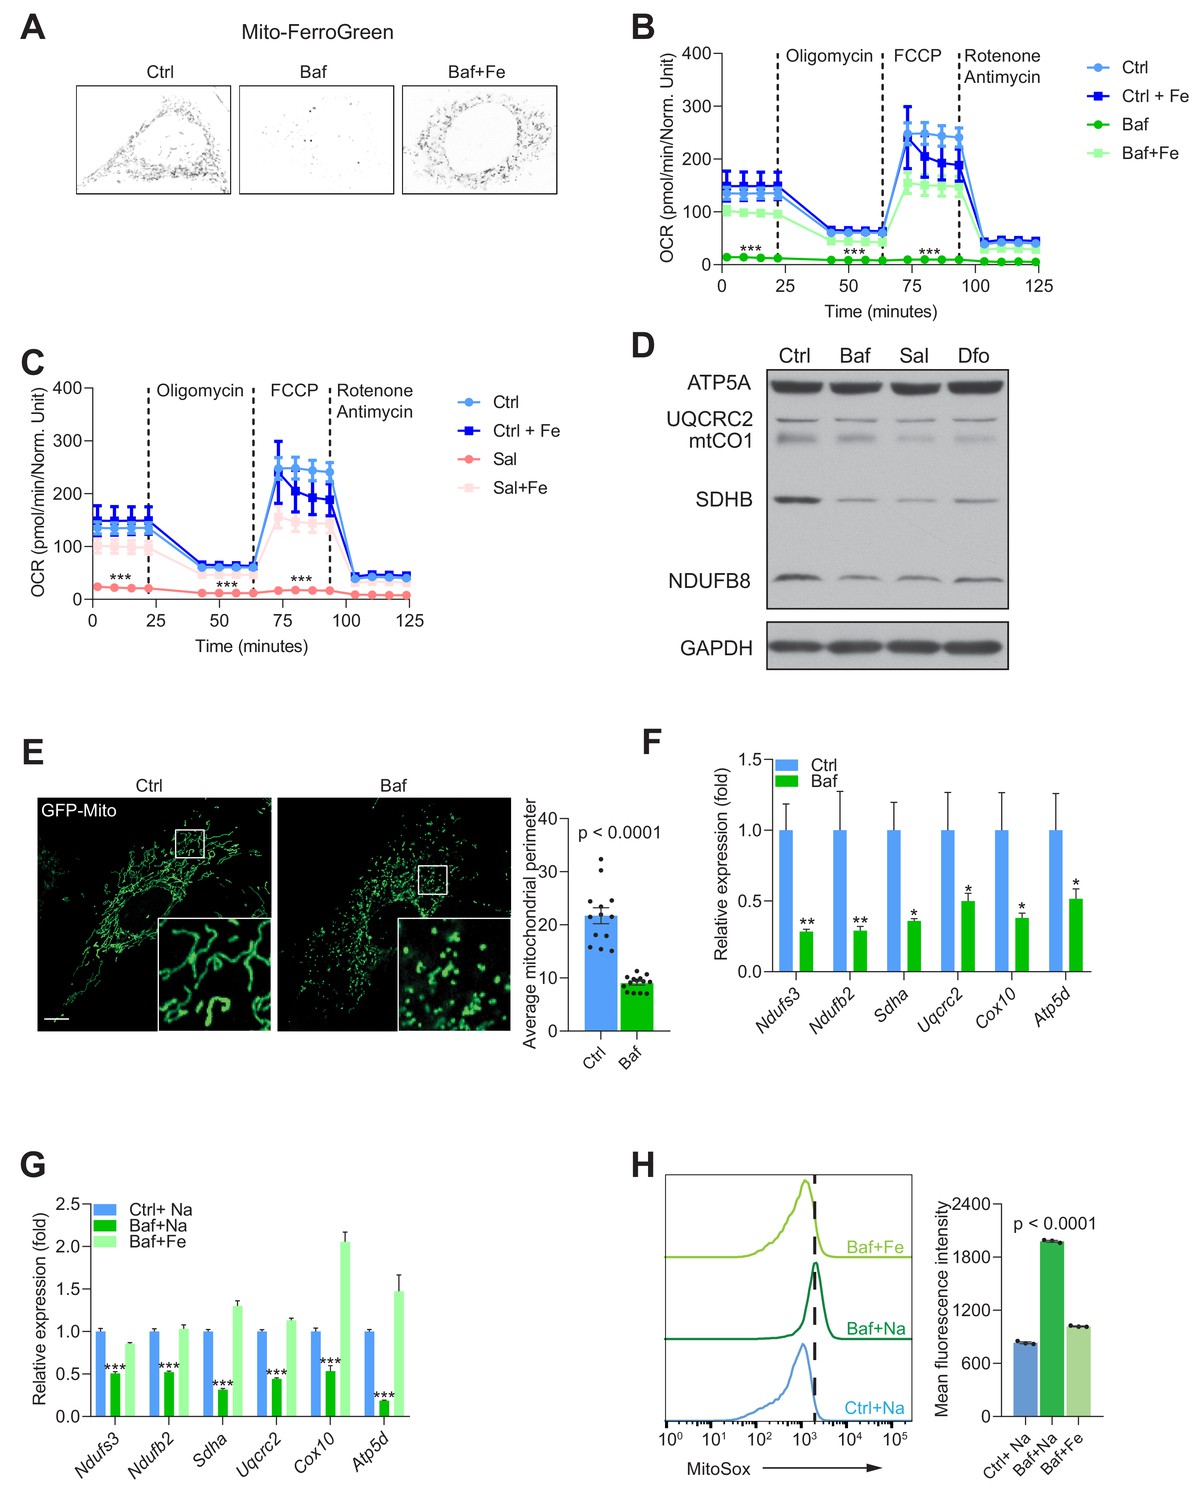
Mitochondrial biogenesis and function are dependent on endolysosomal iron supply.
(A) Representative image Mito-FerroGreen staining of mitochondrial labile iron pools in control, 500 nM Baf- and 500 nM Baf + 150 µM Fe-citrate treated fibroblasts. Note the barely detectable labile iron levels in mitochondria of Baf-treated fibroblasts. (B–C) Mitochondrial oxygen consumption rates (OCR) in 500 nM Baf- and 500 nM Baf-treated fibroblasts with 150 µM iron citrate supplementation (B) or in 500 nM Sal- and 500 nM Sal-treated fibroblasts with 150 µM iron citrate supplementation (C). Results represent mean ± SEM, three independent experimental replicates. Each experimental replicate is calculated from the average of 8 technical replicates. ***p<0.001, Welch’s one-way ANOVA with Dunnett’s correction for multiple comparison (all experimental groups compared to Baf- or Sal-treated cells). (D) Western blot of whole cell extracts showing ATP5A, UQCRC2, mtCO1, SDHB and NDUFSB in control, 500 nM Baf- and 500 nM Sal-treated fibroblasts (n = 6). 300 µM Dfo is used as positive control for iron deficiency. Note the reduction of mitochondrial proteins in treated cells relative to controls. GAPDH is used as loading control. (E) Representative images of fibroblasts transfected with GFP-Mito and treated with 500 nM Baf for 24 hr to show the mitochondrial network. Note the prevalent mitochondrial fragmentation in Baf-treated fibroblasts. Number of cells is shown as black dots per condition in bars representing mean ± SEM of mitochondrial perimeter from three independent experiments. p value is estimated by the Mann-Whitney U-test. Scale bar, 10 µm. (F) Transcript levels of nuclear-encoded mitochondrial genes in 500 nM Baf-treated fibroblasts. Bars depict mean ± SEM of six independent experimental measures. *p<0.05; **p<0.01; ***p<0.001, unpaired two-tailed t-test with Welch’s correction. (G) Transcript levels of nuclear-encoded mitochondrial genes in 500 nM Baf-treated fibroblasts and 500 nM Baf-treated fibroblasts with150µM iron citrate supplementation. Results are shown as mean ± SEM, n = 8. *p<0.05; **p<0.01; ***p<0.001, Welch’s one-way ANOVA with multiple test corrections made by the Dunnett’s method. All comparisons were made between Baf-treated cells and other experimental conditions. (H) Mitochondrial superoxide levels in 500 nM Baf- and 500 nM Baf-treated fibroblasts with 150 µM iron citrate supplementation. Differences are depicted as mean fluorescent intensities of the superoxide-sensitive and mitochondrial-targeted dye, Mitosox. Error bars represent SEM of three independent experimental measures (black dots). p value is Welch’s one-way ANOVA with Dunnett’s correction for multiple corrections (all conditions compared to Baf-treated cells).
Figure 3—figure supplement 1
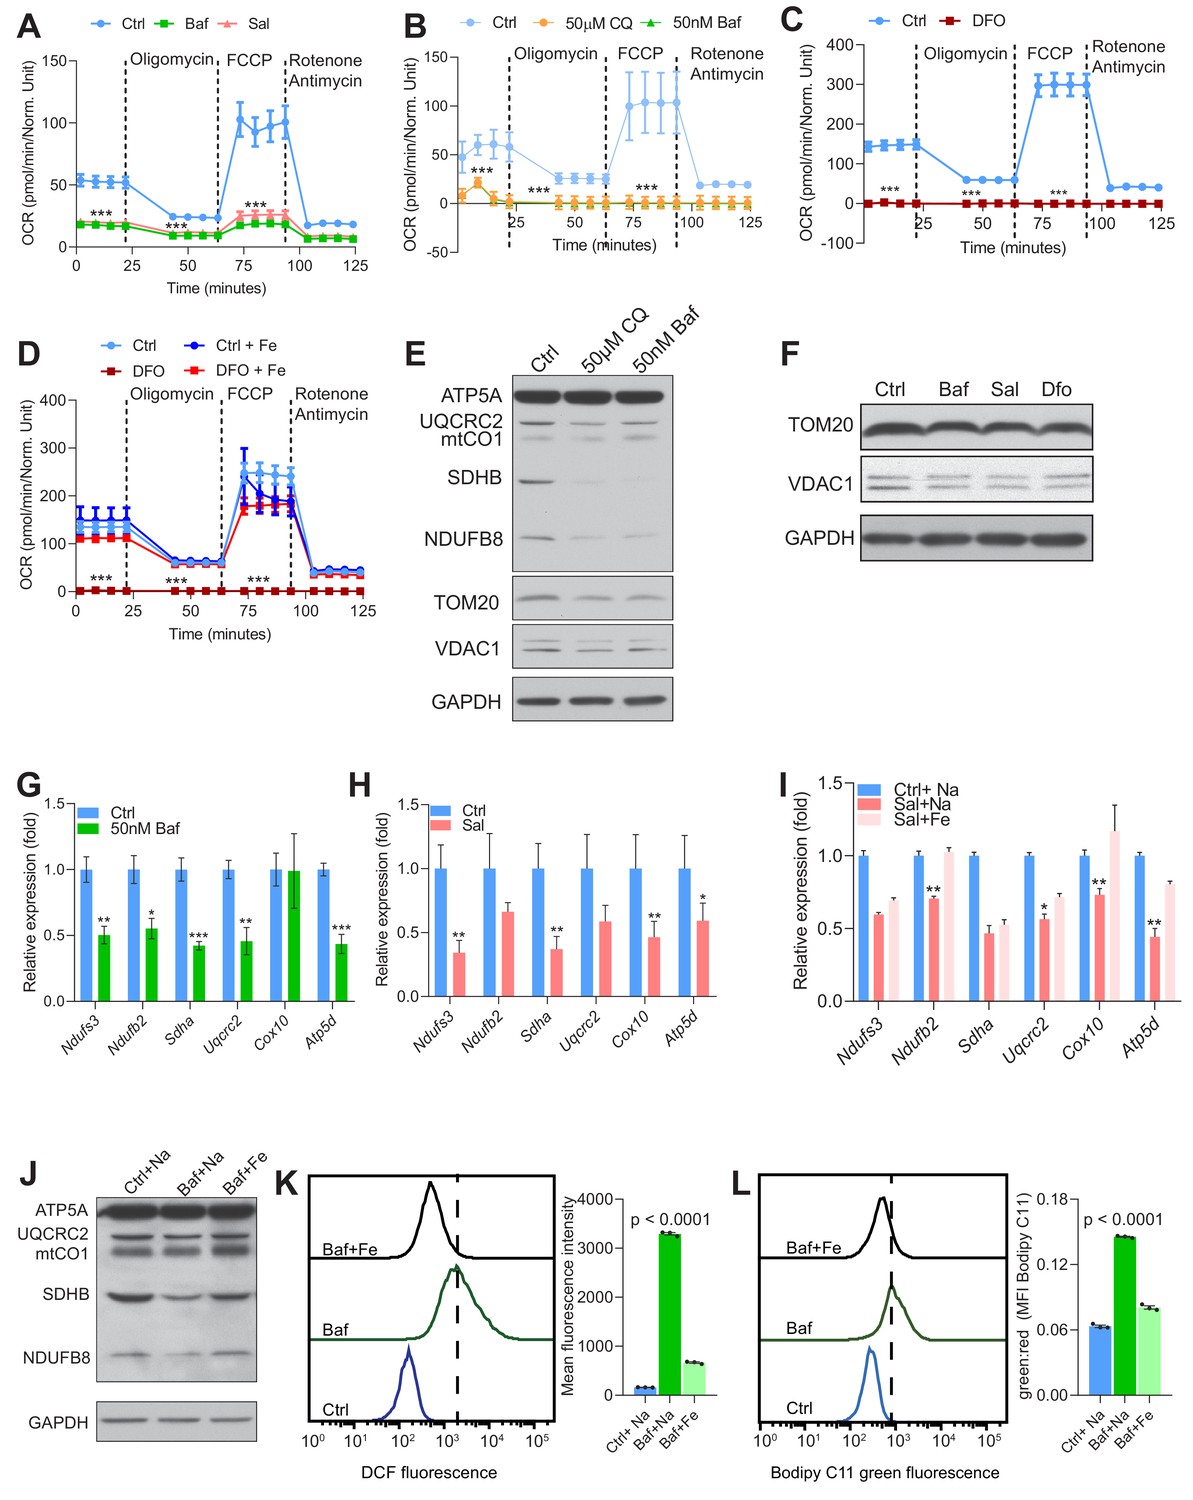
Lysosomal iron efflux is essential for mitochondrial biogenesis and function.
(A–C) Mitochondrial OCR in 500 nM Baf- and 500 nM Sal-treated fibroblasts (A), in fibroblasts treated with either vehicle, 50 µM Chloroquine or 50 nM Baf (B) and in 300 µM Dfo-treated fibroblasts (C). Note the seemingly lack of mitochondrial respiration in Dfo-treated fibroblasts. Results represent mean ± SEM, n = 3. Each experimental replicate is calculated from the average of 12 technical replicates. ***p<0.001, Welch’s one-way ANOVA with Dunnett’s correction for multiple comparisons (A, B) and unpaired two-tailed t-test with Welch’s correction (C). (D) 150 µM iron citrate supplementation rescues the barely detected mitochondrial OCR in 300 µM Dfo-treated fibroblasts. Experimental points represent mean ± SEM, n = 3. Each experimental replicate is calculated from the average of 8 technical replicates. ***p<0.001, Welch’s one-way ANOVA with Dunnett’s correction for multiple comparisons with all experimental groups compared to Dfo-treated cells. (E) Immunoblots of whole cell extracts showing ATP5A, UQCRC2, mtCO1, SDHB, NDUFB8, TOM20 and VDAC1 in fibroblasts treated for 24 hr with either vehicle, 50 µM Chloroquine or 50 nM Baf. GAPDH is used as loading control, n = 4 biological replicates. (F) Immunoblots showing reduced TOM20 and VDAC1 protein levels in fibroblasts treated with 500 nM Baf and 500 nM Sal (n = 6). 300 µM Dfo is used as positive control for iron deficiency and GAPDH is used as loading control. (G) Reduced levels of nuclear-encoded mitochondrial transcripts in fibroblasts treated for 24 hr 50 nM Baf. Results are shown as bar graphs representing mean ± SEM of four independent experimental replicates. *p<0.05; **p<0.01; ***p<0.001, unpaired two-tailed t-test with Welch’s correction. (H) Mitochondrial biogenesis is repressed in 500 nM Sal-treated fibroblasts as assessed by the reduced transcript levels of nuclear-encoded mitochondrial genes following 24 hr of treatment with Sal. Results are shown as bar graphs representing mean ± SEM of six independent experimental replicates. *p<0.05; **p<0.01; ***p<0.001, unpaired two-tailed t-test with Welch’s correction. (I) 150 µM iron citrate supplementation in 500 nM Sal-treated fibroblasts, partially rescues the decreased expression of nuclear-encoded mitochondrial genes in fibroblasts treated with Sal alone. Bars depict mean ± SEM, n = 8. *p<0.05; **p<0.01; Welch’s one-way ANOVA with Dunnett’s correction for multiple comparisons. All conditions are compared to the Sal alone treatment group. (J) Immunoblots of whole cell extracts showing ATP5A, UQCRC2, mtCO1, SDHB and NDUFB8 in 500 nM Baf-treated cells and in 150 µM iron citrate supplemented-Baf treated fibroblasts (n = 3). Note the rescue of the decreased levels of mitochondrial proteins (NDUFB8, SDHB and mtCO1) following iron supplementation in Baf-treated cells. GAPDH is used as loading control. (K–L) 150 µM iron citrate supplementation rescues Baf-induced increase in the levels of reactive of oxygen species (DCF) and in the levels of lipid peroxidation (Bodipy C11). Results are depicted representative histograms of three independent experimental replicates and quantifications are shown as mean ± SEM. p values are determined by the Welch’s one-way ANOVA with Dunnett’s correction for multiple comparisons to Baf-treated fibroblasts.
Figure 3—figure supplement 2
Impaired lysosomal iron efflux results in decreased mitochondrial biogenesis and function.
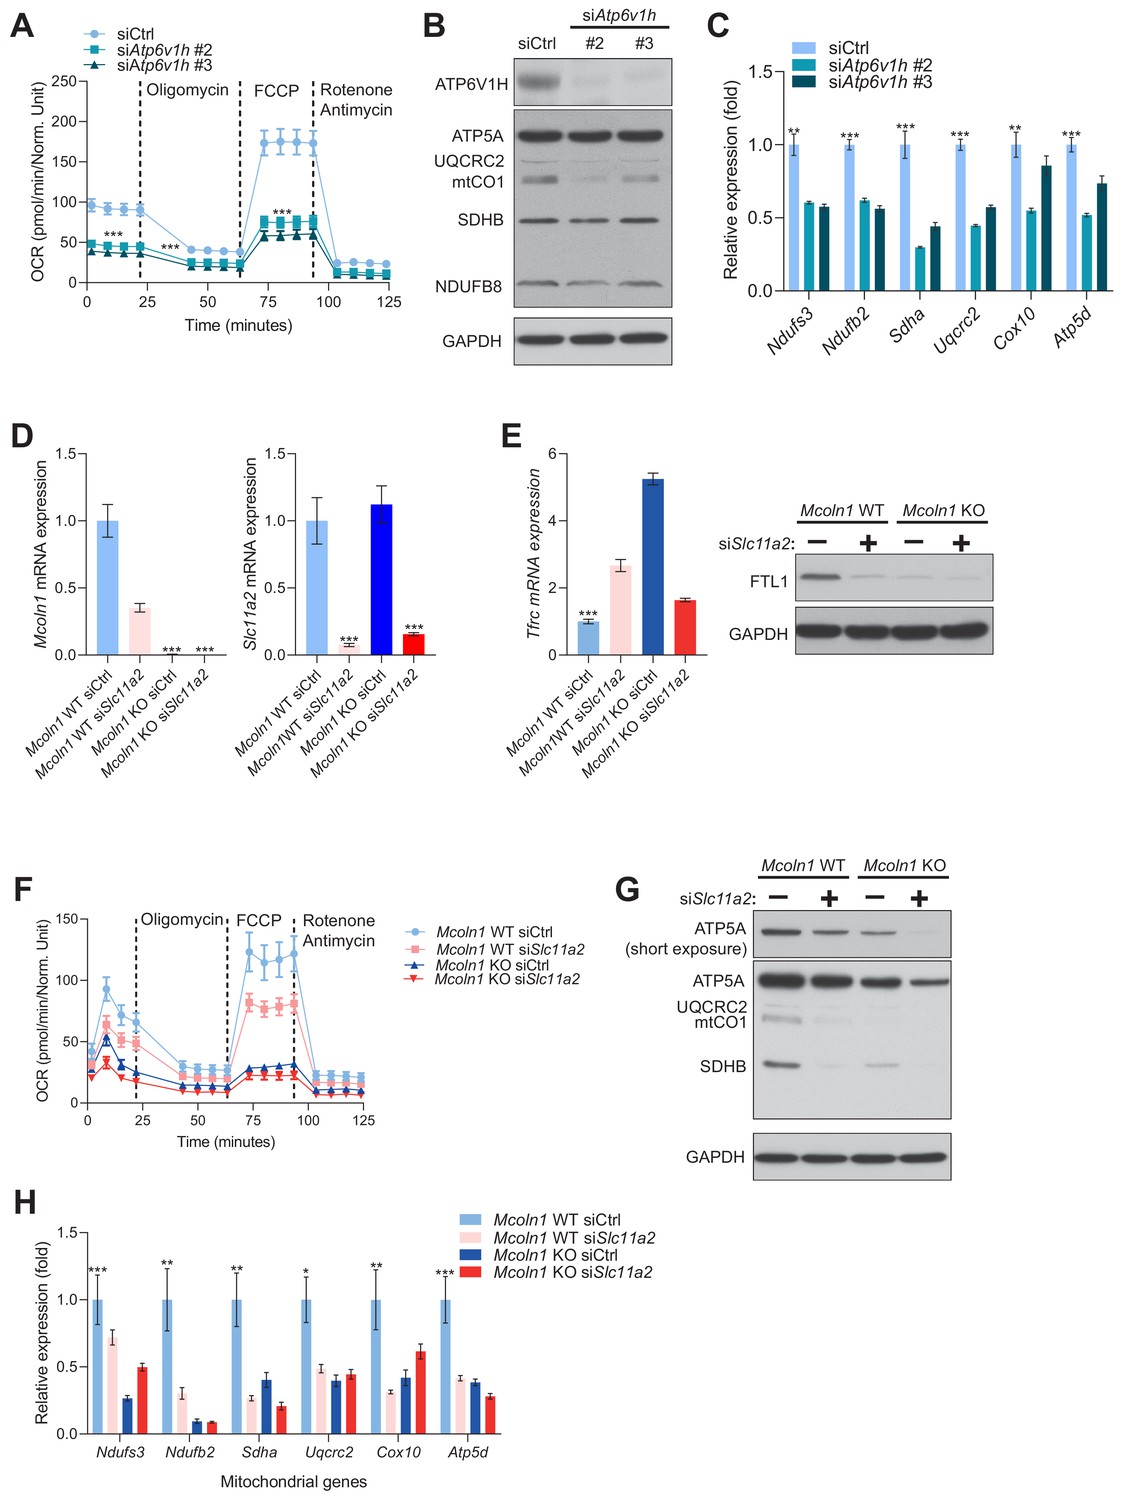
(A) Mitochondrial OCR in fibroblasts with siRNA mediated silencing of Atp6v1h. Results represent mean ± SEM, n = 3. Each experimental replicate is calculated from the average of 16 technical replicates. ***p<0.001, Welch’s one-way ANOVA with Dunnett’s correction for multiple comparisons. (B) Immunoblots of whole cell extracts showing ATP6V1H, ATP5A, UQCRC2, mtCO1, SDHB, and NDUFB8, Atp6v1h knockdown fibroblasts. GAPDH is used as loading control, n = 3 independent experiments. (C) Mitochondrial biogenesis is repressed in fibroblasts with Atp6v1h silencing as assessed by the expression of nuclear-encoded mitochondrial genes. Results are shown as bar graphs representing mean ± SEM of six independent experimental replicates. **p<0.01; ***p<0.001, Welch’s one-way ANOVA with Dunnett’s correction for multiple comparisons. Mean differences compared between siCtrl and the other experimental groups. (D) Expression levels of Mcoln1 (left) and Slc11a2 (right) in siRNA-mediated knockdown of Slc11a2 in Mcoln1-/- mouse embryonic fibroblast and their wild type control fibroblasts. Bars represent mean ± SEM, n = 6 biological replicates. ***p<0.0001, unpaired two-tailed t-test with Welch’s correction. (E) Tfrc mRNA levels in Mcoln1 WT and KO fibroblasts with siRNA-mediated silencing of Slc11a2 (left). Relative Tfrc expression is shown as bars representing mean ± SEM, n = 6 biological replicates. ***p<0.001, determined by the Welch’s one-way ANOVA followed by Dunnett’s correction for multiple comparisons of all groups to the Mcoln1 WT siCtrl group. Immunoblots of HIF-1α, FTH1, FTL1 with GAPDH as loading control in Mcoln1 WT and KO fibroblasts with siRNA-mediated silencing of Slc11a2 are also shown for n = 3 biological samples (right). (F) Mitochondrial OCR in Mcoln1 WT and KO fibroblasts with Slc11a2 knockdown. Results represent mean ± SEM, n = 3. Each experimental replicate is calculated from the average of 9 technical replicates. ***p<0.001, Welch’s one-way ANOVA with Dunnett’s correction for multiple comparisons (G) Immunoblots of ATP5A, UQCRC2, mtCO1 AND SDHB in lysates prepared from Mcoln1 WT and KO fibroblasts with siRNA-mediated knockdown of Slc11a2. GAPDH is used as loading, n = 3 independent experiments. (H) Reduced levels of nuclear-encoded mitochondrial transcripts in either Mcoln1 KO fibroblasts, Slc11a2 knockdown fibroblasts or both. Results are shown as bar graphs representing mean ± SEM of six independent experimental replicates. *p<0.05; **p<0.01; ***p<0.001, determined by the Welch’s one-way ANOVA followed by Dunnett’s correction for multiple comparisons of all groups to the Mcoln1 WT siCtrl group.
Figure 4 with 1 supplement
Impaired lysosomal iron efflux results in non-apoptotic cell death.
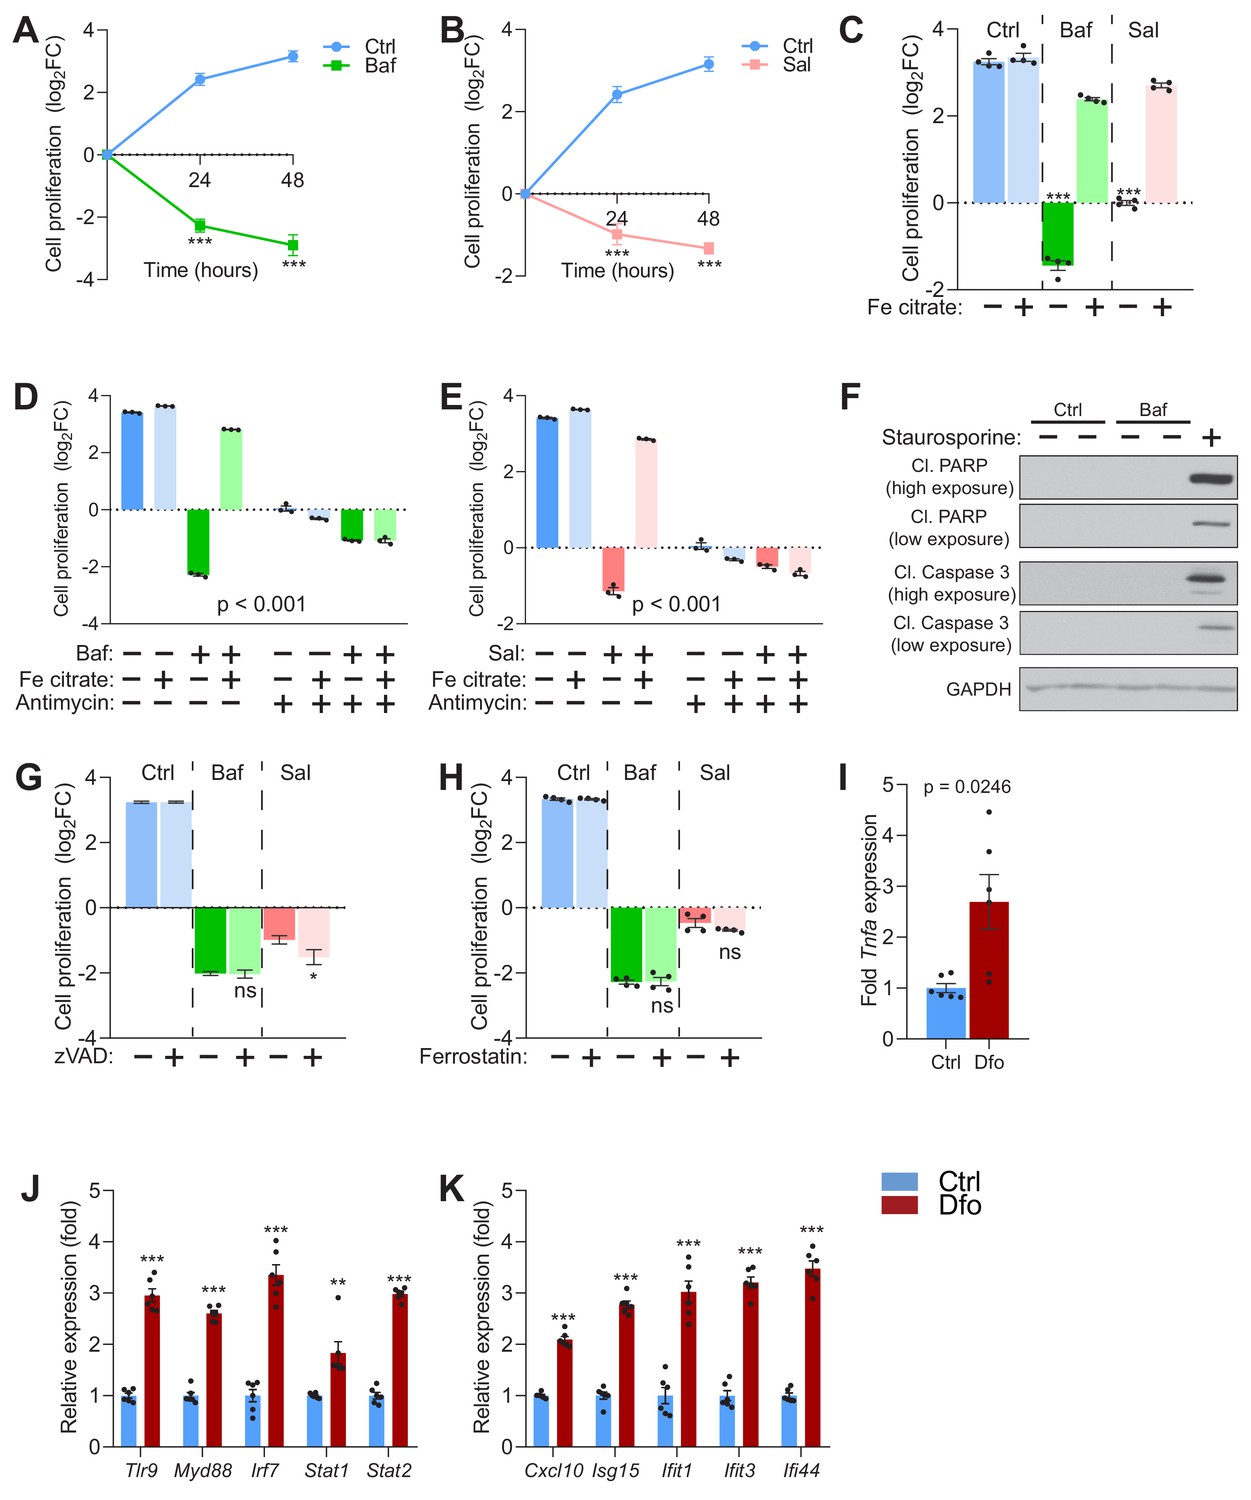
(A–B) 500 nM Baf-treated (A) and 500 nM Sal-treated (B) fibroblasts display about 4- to 8-fold increase in cell death with time of treatment, relative to untreated fibroblasts, which show progressive cell proliferation. Results are presented as mean ± SEM, n = 4 experimental replicates with each experimental replicate being the average of technical triplicates. ***p<0.001, unpaired two-tailed t-test with Welch’s correction (C) 150 µM iron citrate supplementation rescues cell death in fibroblasts upon treatment with 500 nM Baf or Sal. Bars and error bars represent mean ± SEM of log2 fold change in cell number of experimental conditions. Black dots indicate individual experimental measurements. ***p<0.001, Welch’s one-way ANOVA with Dunnett’s correction for multiple comparisons. All conditions compared to fibroblasts treated with either Baf or Sal alone. (D–E) 20 µM Antimycin treatment for 48 hr abolishes the rescue of cell death following iron supplementation in 500 nM Baf-treated (C) or 500 nM Sal-treated (D) fibroblasts. Bar graphs represent mean ± SEM of three independent experimental measures (black dots). ***p<0.001, Two-way ANOVA with Sidak correction for multiple comparisons. (F) Whole cell immunoblot of cleaved PARP and cleaved caspase-3 levels shows that Baf-induced cell death is non-apoptotic (n = 3). 1 µM Staurosporine treatment for 4 hr is used as positive control for caspase-3 dependent apoptotic cell death. GAPDH is used as loading control. (G–H) Inhibitors of apoptosis (G) and ferroptosis (H) show no observed effects on 500 nM Baf or Sal-induced cell death in fibroblasts following 48 hr of treatment. Results show mean ± SEM, n = 4. *p<0.5; ns p>0.05, Welch’s one-way ANOVA with Dunnett’s correction for multiple comparisons to treatment with Baf or Sal alone. 20 uM zVAD or 5 µM Ferrostatin were used. (I–K) 300 µM Dfo treatment in neurons results in more than 2-fold increase in the expression of Tnfa (I), increased expression of regulators of interferon gene expression (J) and increased transcript levels of interferon-stimulated genes (K). Results show mean ± SEM of six independent experiments. **p<0.01; ***p<0.001, unpaired two-tailed t-test with Welch’s correction.
Figure 4—figure supplement 1
Iron deficiency-induced cell death is non-apoptotic.
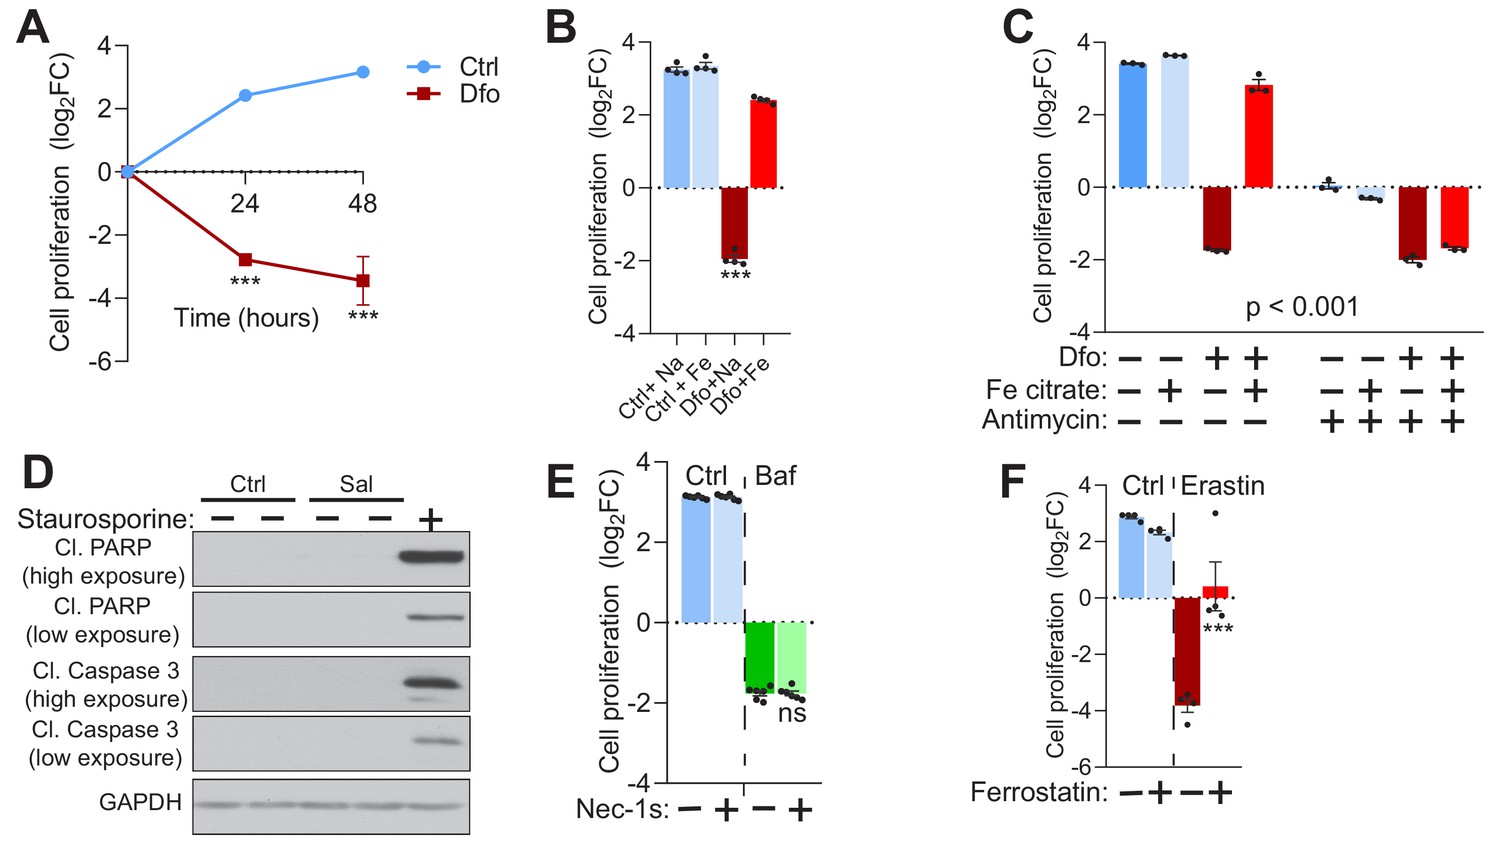
(A) 300 µM Dfo-treated fibroblasts show time dependent increase in cell death of up to about sixteen-fold after 48 hr of treatment. Data points are mean ± SEM, n = 4. ***p<0.001, unpaired t-test with Welch’s correction (B) 150 µM Iron citrate supplementation rescues cell death following 300 µM Dfo treatment in fibroblasts. Bar graphs and error bars represent mean ± SEM of log2 fold change in cell number of experimental conditions. Black dots indicate individual experimental measures. ***p<0.001, Welch’s one-way ANOVA with Dunnett’s correction for multiple comparisons. Mean differences compared between Dfo alone treatments and the other experimental groups. (C) 20 µM Antimycin treatment abrogates the rescue of cell death following iron supplementation in Dfo-treated fibroblasts. Results are summarized at mean ± SEM, n = 3 (depicted as black dots). ***p<0.001; Two-way ANOVA with Sidak correction of for multiple comparisons. (D) Caspase 3-independent cell death in 500 nM Sal-treated fibroblasts shown by whole cell immunoblots of cleaved PARP and cleaved caspase three levels in Sal-treated cells (n = 3). 1 µM Staurosporine treatment for 4 hr is used as positive for caspase 3-dependent cell death. GAPDH is used as loading control. (E) 5 µM Nec-1s, metabolically stable RIPK1 inhibitor, has no observable effects on cell death induced by 500 nM Baf treatment in fibroblasts for 48 hr. Results show mean ± SEM of 6 experimental replicates. ns p>0.05, Welch’s one-way ANOVA with Dunnett’s correction of multiple comparisons. Baf alone treated group compared with all other treatment conditions. (F) 5 µM Ferrostatin treatment abrogates 10 µM Erastin-induced cell death in fibroblasts. Treatments were carried out for 48 hr. Bar graphs represent mean ± SEM, n = 4 (black dots). ***p<0.001, Welch’s one-way ANOVA with Dunnett’s correction for multiple comparisons (all groups compared to cells treated with erastin alone).
Figure 5 with 1 supplement
Functional iron deficiency in a mouse model of impaired lysosomal acidification (Gaa-/- mouse).
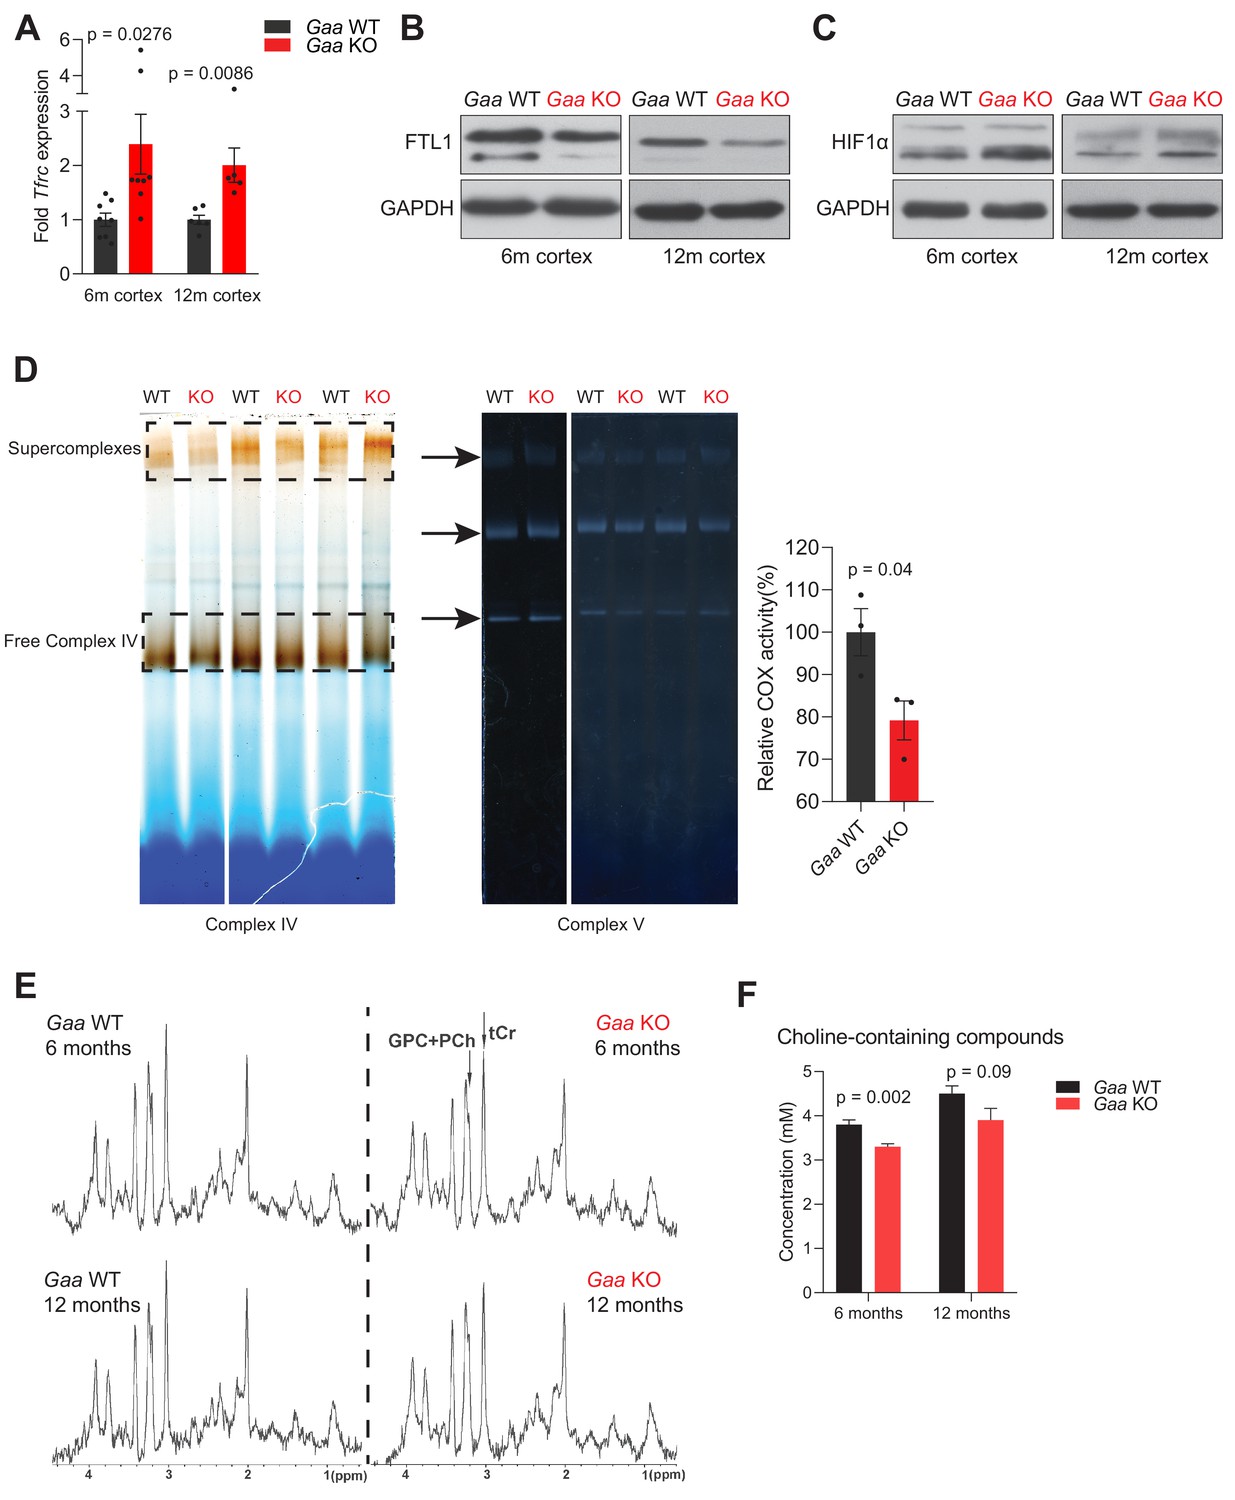
(A) Tfrc mRNA levels in the cortex of 6 and 12 month old Gaa-/- mice and their wild type littermate controls. Black dots represent sample size (n) in each group. p values are unpaired two-tailed t-tests with Welch’s correction. Bars are depicted as mean ± SEM. (B) Western blot of FTL1 and GAPDH as loading control from cortical tissue lysates of 6 and 12 month old Gaa+/+ and Gaa-/- mice (n = 4 mice per group). (C) HIF-1α immunoblots with GAPDH as loading control from cortical tissue lysates of 6 and 12 month old Gaa+/+ and Gaa-/- mice (n = 4 mice per group). (D) Activity staining of native respiratory chain complex IV of mitochondria purified from cortices of 6 month old mice (n = 3; depicted as black dots). Complex V activity staining is used as loading control. The difference between activities (mean ± SEM) of groups is determined by the unpaired two-tailed t-test with Welch’s correction. (E) MRS reveals significant changes in metabolite concentrations in Gaa-/- mice in vivo. MRS (STEAM, TR/TE/TM = 6000/10/10 ms, 256 averages, (2.0 mm)3 volume-of-interest centered on the striatum) of 6 month old (upper row) and 12 month old (lower row) wild type (right column) and Gaa-/- mice (left column) in vivo, as summarized in Table 1, processed with a 1 Hz line broadening. GPC+PCh = Choline containing compounds, tCr = total creatine, ↑=significant signal intensity increases, ↓=significant signal intensity decreases. *p<0.05; **p<0.01, Mann-Whitney’s U-test. (F) Graphs depicted as mean ± SEM of n = 8 mice per group (6 months) or five mice per group (12 months) show decreased concentration of total choline-containing compounds in Gaa-/- mice in vivo. p values indicate the Mann-Whitney’s U-test.
Figure 5—figure supplement 1
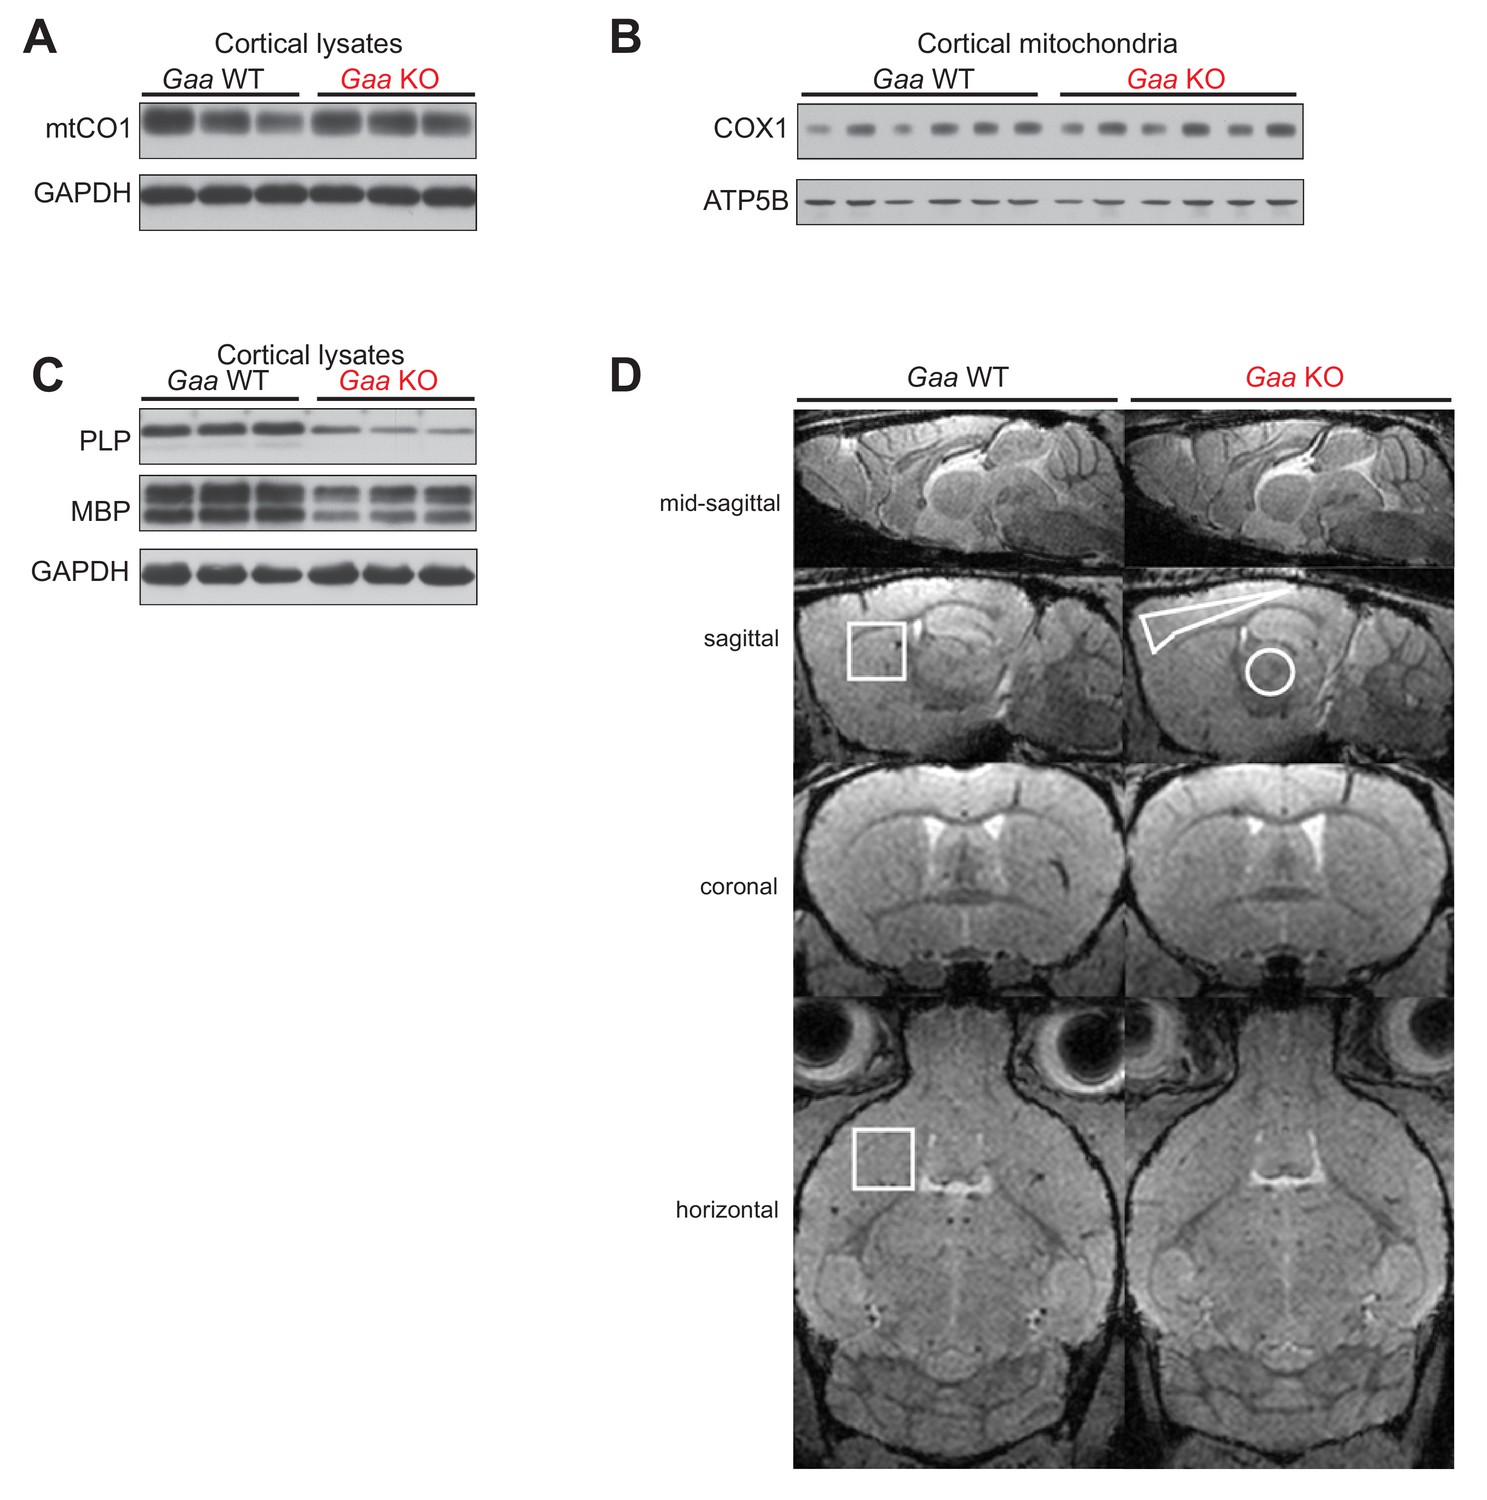
Steady state levels of COX1, PLP and MBP proteins, and in vivo MRI of mouse brain.
(A) Immunoblots of COX1 in whole cortical lysates of Gaa WT and KO mice at 6 months of age. GAPDH is used as loading control (n = 8). (B) Western blots of COX in mitochondria purified from Gaa WT and KO mouse cortices at 6 months of of age. ATP5A is used as loading control (n = 5). (C) PLP and MBP immunoblots from whole cortical lysates of 6 month old Gaa-/- mice and their wild type littermates (n = 8). GAPDH is used as loading control. (D) MRI (RF-spoiled 3D FLASH, TR/TE = 22/7.7 ms, flip angle 10°, fat suppression 90°, 117 µm isotropic resolution) of the brain of a 6-month-old wild-type and (left column) a 6-month-old Gaa-/-mouse (right column). Images are acquired from the mid-sagittal section, the sagittal section 2.4 mm from the midline, a coronal section showing the anterior commissure, and a horizontal section. They show the volume- as well as the region-of-interest used for the evaluation of the striatum (squares), the cerebral cortex (polygon), and the thalamus.
Figure 6
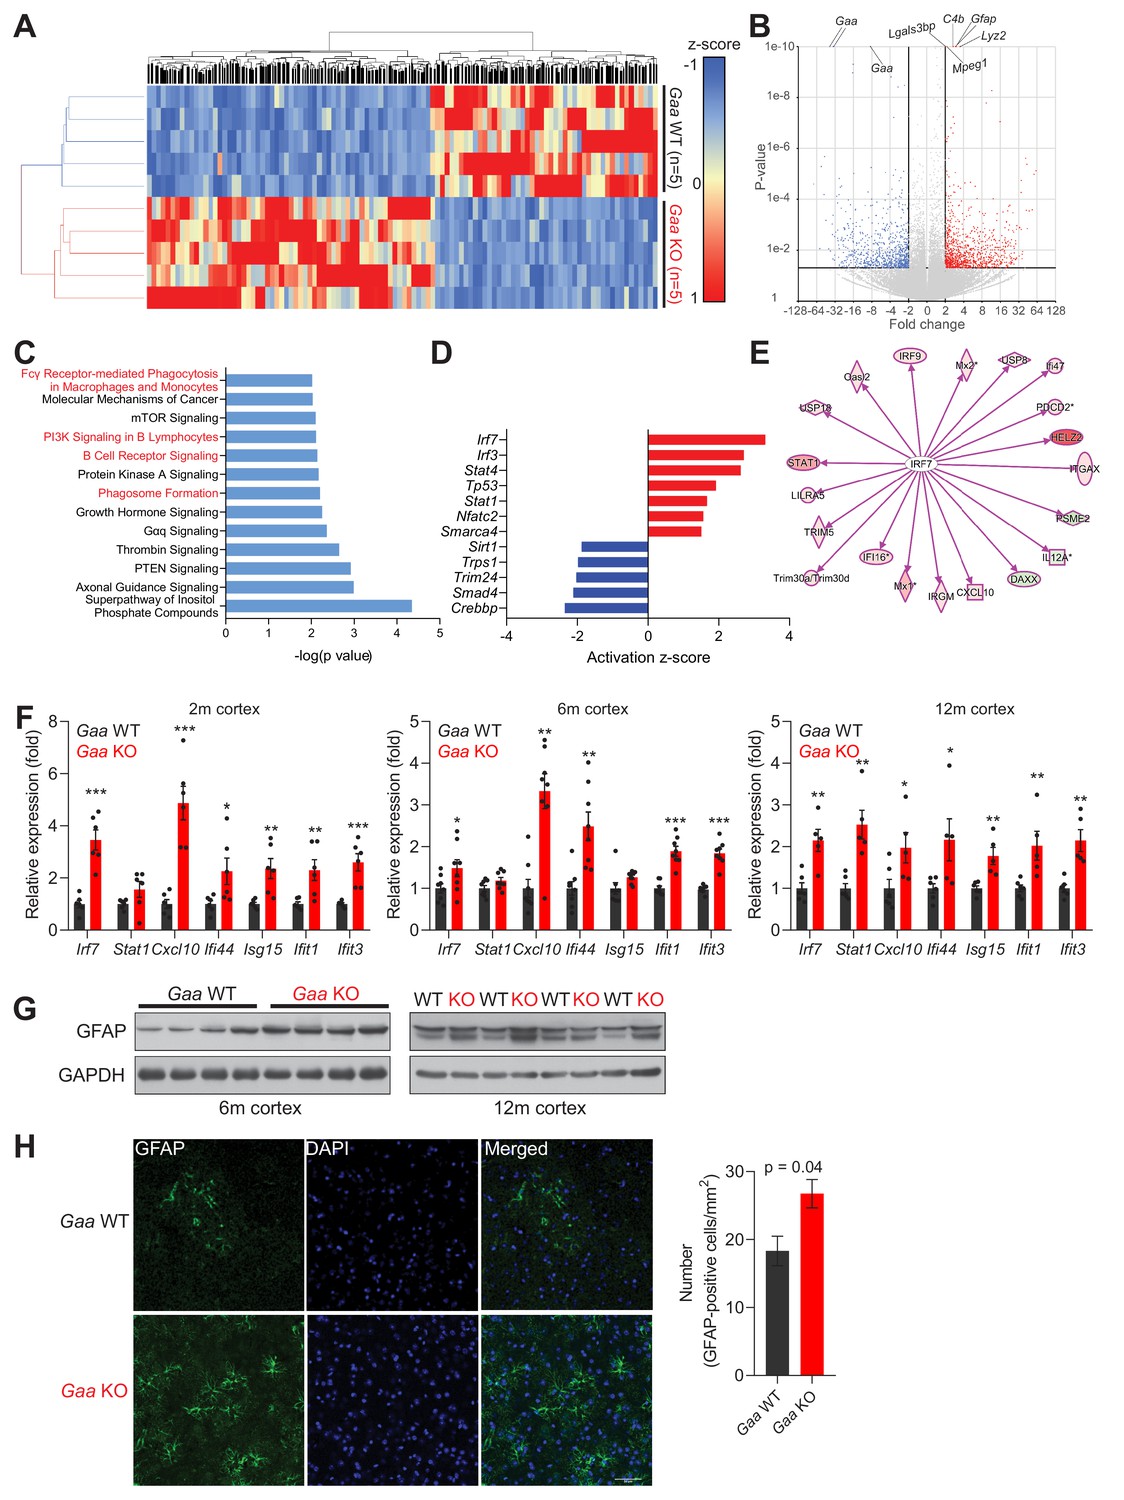
Iron deficiency is linked to induction of innate immunity in the CNS of Gaa-/- mice.
(A) Hierarchical clustering of the brain samples of Gaa-/-- and WT mice at 12 months of age. (B) Volcano plot of the transcripts detected in the RNAseq analysis, highlighting those that were considered as differentially expressed genes (adjusted p value < 0.05, and fold-change >2). Some of the transcripts with the lowest p value between WT and KO are highlighted in the plot. (C) Results of the pathway analysis showing the pathways most enriched in the differentially expressed gene list of the Gaa-KO/WT cortex dataset. The pathways related to inflammation are highlighted in red. (D) Transcription factors predicted to be significantly active or repressed in the cortex of 12 month old Gaa-/- mice compared to WT. The z-score is represented (positive z-score, predicted activation; negative z-score, predicted repression). (E) Transcript levels of Irf7 targets recognized in the Gaa-/-dataset by Ingenuity Pathway Analysis. The targets are color-coded (red indicates higher expression in Gaa-/-mice, green represents lower expression), showing that the vast majority is up-regulated, in agreement with the predicted activation of Irf7. (F) Transcript levels of interferon-stimulated genes and their regulators in the cortices of 2 month, 6 month and 12 month old Gaa-/- mice and their wild type littermate controls. Number of mice per group is displayed as black dots in bars, which represent mean ± SEM. *p<0.05; **p<0.01; ***p<0.001, unpaired two-tailed t-test with Welch’s correction. (G) Whole cortical tissue immunoblots of increased GFAP levels and GAPDH as loading control in 6- and 12 month old wild type and Gaa-/- mice (n = 4 mice per group). (H) Representative images of GFAP (green) in the cortex of 6 month old Gaa-/- mice and their wild type littermate controls. Scale bar, 20 µm. Quantifications on the right show the increased number of GFAP-positive cells in the cortices of Gaa-/- mice (n = 3 mice per group) depicted as bars denoting mean ± SEM. p value is estimated from an unpaired two-tailed t-test with Welch’s correction.
Figure 7 with 1 supplement
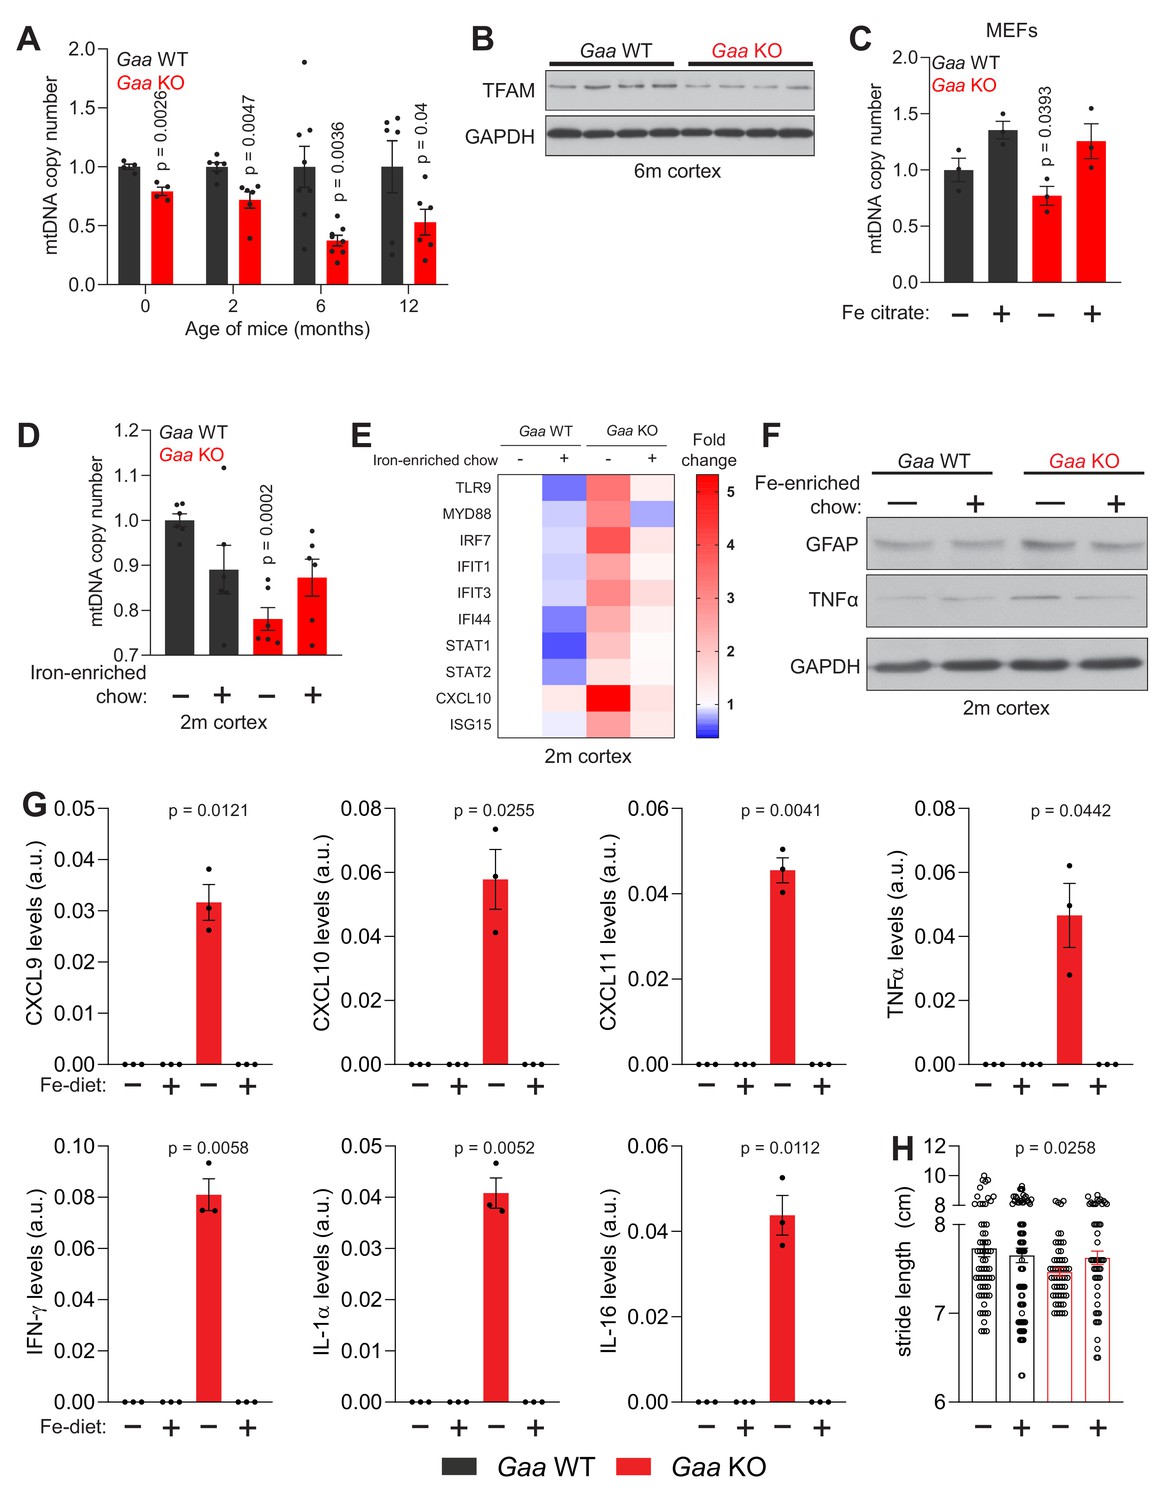
Iron deficiency impairs mtDNA homeostasis in Gaa-/- mice.
(A) Age-dependent decline in relative mtDNA copy number levels in the cortex of Gaa-/- mice from 0 to 12 months of age. Number of mice per group is depicted as dots in bars which denote mean ± SEM. *p<0.05; **p<0.01; ***p<0.001, unpaired two-tailed t-test with Welch’s correction. (B) Western blot showing reduced TFAM and GAPDH as loading control in the cortex of Gaa-/- mice and their wild type littermate controls (n = 8 mice per group). (C–D) Iron supplementation rescues mtDNA copy number defects in Gaa-/- fibroblasts (C) and in the cortex of 2 month old Gaa-/- mice (D). Results are summarized as mean ± SEM of n = 3 independent measures in Gaa-/- fibroblasts and n = 6 mice per group indicated as black dots for 2 month old Gaa-/- mice. *p<0.05; ***p<0.001, Welch’s one-way ANOVA test with Dunnett’s correction for multiple comparisons. All conditions compared to the untreated Gaa-/- fibroblasts (C) or Gaa-/- mice fed standard chow (D). (E) Iron supplementation as iron-enriched chow dampens the increased expression of innate immune response genes in Gaa-/- mice at 2 months of age. This result is depicted as a Heatmap for n = 6 mice per group, in which blue denotes decreased expression of interferon-stimulated genes relative to white (no change or baseline) and red denotes increased expression. Note the dampening of the hot red in Gaa-/- on standard chow relative to the cohort of Gaa-/- mice on iron-enriched chow. (F) Immunoblot of GFAP and TNFα in the cortices of Gaa-/- mice and their wild type littermate controls fed standard or iron-enriched chow for 2 months (n = 3). Note the reduction in GFAP and TNFα protein amounts following iron supplementation in Gaa-/- mice. GAPDH is used as loading control (G) Iron-enriched diet restores increased levels of cytokine and chemokines to control levels in the cortices of 2 month old Gaa-/- mice. Cytokines are increased in Gaa-/- mice fed standard chow, and are barely detectable in Gaa-/- mice fed iron-enriched diet or their wild type littermate controls. Levels of cytokines and chemokines are shown as mean ± SEM (n = 3 mice per group, black dots) and p values represent Brown-Forsythe’s one-way ANOVA tests estimated as differences between Gaa-/- mice on standard chow and all other experimental groups. (H) Mouse gait analysis shows rescue of stride length following 2 months of iron supplementation in Gaa-/- mice. Data is presented as mean ± SEM. Each experimental data point (hollow circles) represents stride length measured on all four limbs of each animal. 13–19 animals per group were used. p value is determined by the Welch’s one-way ANOVA followed by Dunnett’s correction for multiple comparisons of all groups to Gaa-/- mice fed standard diet.
Figure 7—figure supplement 1
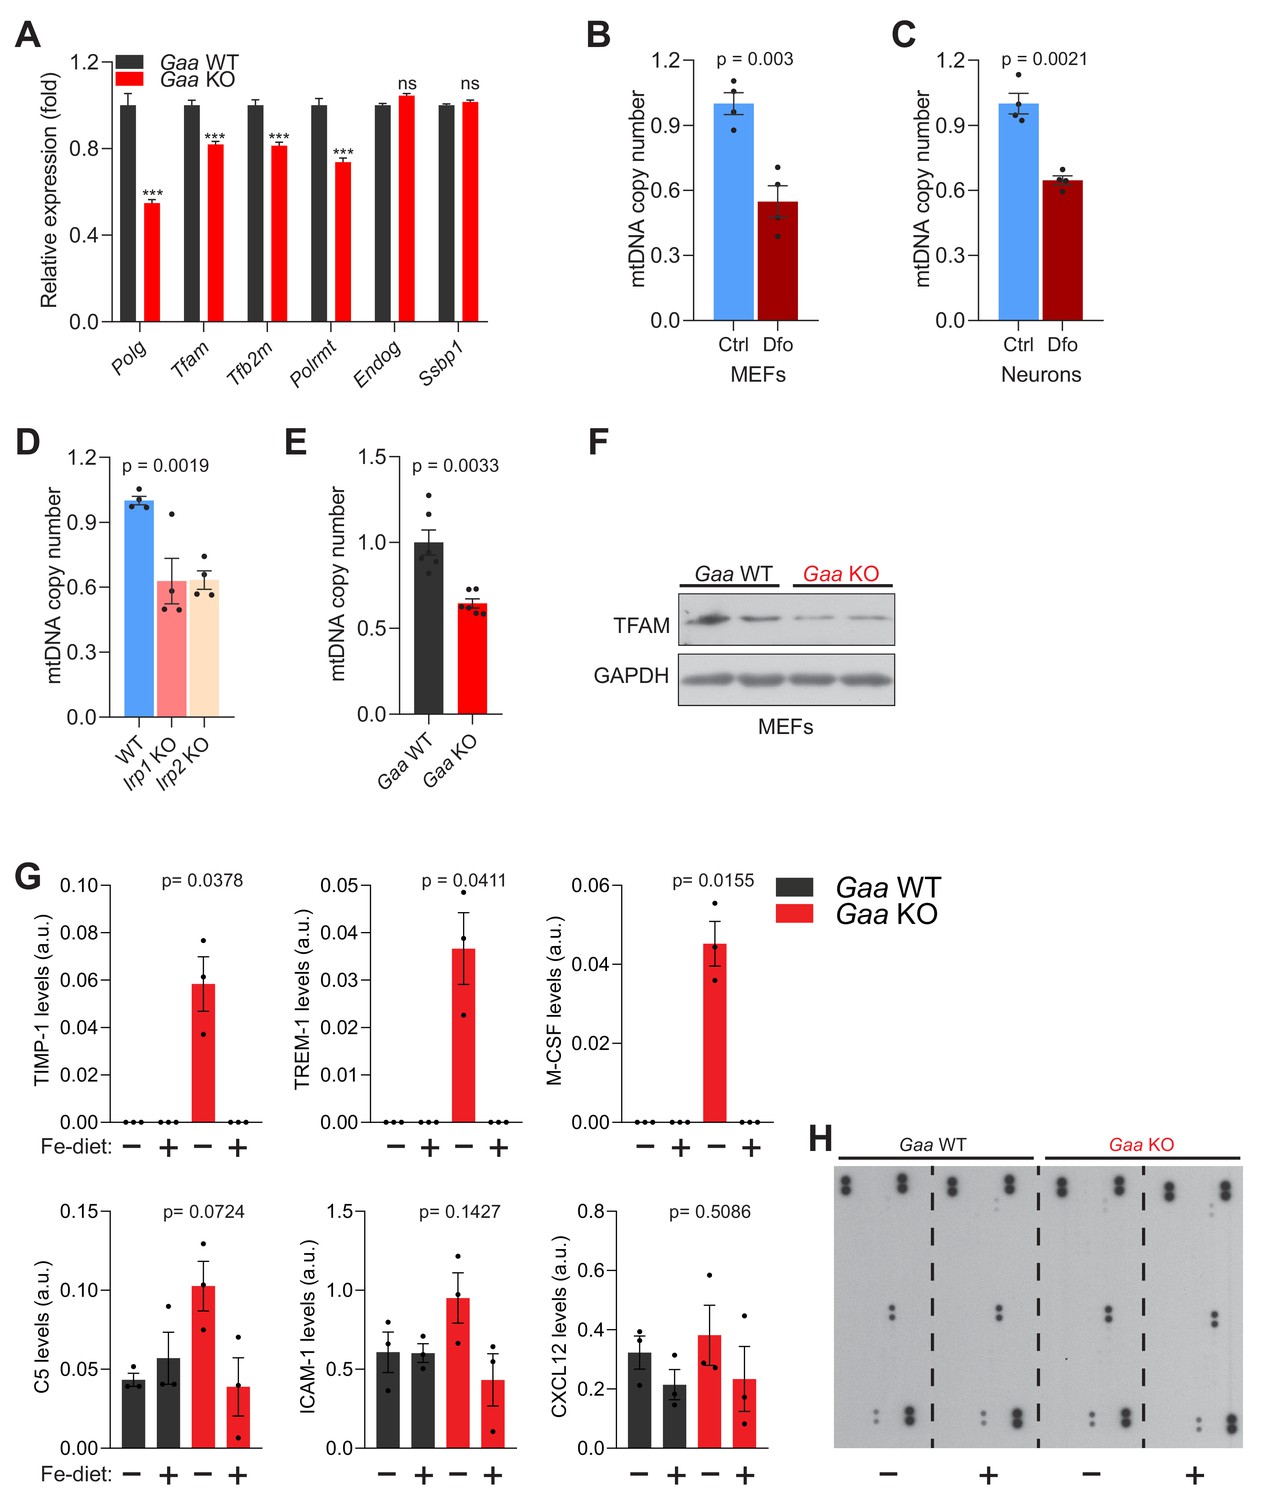
Iron deficiency causes impaired mtDNA homeostasis and induces inflammation in vivo.
(A) Transcript levels of mtDNA maintenance and transcription genes in Gaa-/- mice and their wild type littermates. Graphs represent mean ± SEM, n = 8 mice per group. ***p<0.001; ns p>0.05, unpaired two-tailed t-test with Welch’s correction. (B–C) mtDNA copy number levels in 300 µM Dfo-treated fibroblasts (B) and neurons (C). Results are summarized as mean ± SEM of four independent experiments (depicted as black dots). p values are estimated as unpaired two-tailed t-test with Welch’s correction. (D) Irp1-/- and Irp2-/- fibroblasts show reduced mtDNA copy number levels. Bars represent mean ± SEM, n = 4 (black dots). p value, Welch’s one-way ANOVA with Dunnett’s correction for multiple comparisons made to WT group. (E) mtDNA copy number decline in Gaa-/- fibroblasts relative to WT. Results are shown as mean ± SEM, n = 6 (black dots). p value is the unpaired two-tailed t-test with Welch’s correction. (F) Whole cell immunoblots of TFAM in Gaa-/- fibroblasts and their WT controls (n = 4). GAPDH is used as a loading control. (G) Iron-enriched diet restores increased levels of cytokine and chemokines to control levels in the cortices of 2 month old Gaa-/- mice. Cytokines are increased in Gaa-/- mice fed standard chow, and are barely detectable in Gaa-/- mice fed iron-enriched diet or their wild type littermate controls. Levels of cytokines and chemokines are shown as mean ± SEM (n = 3 mice per group, black dots) and p values represent Brown-Forsythe’s one-way ANOVA tests estimated as differences between Gaa-/- mice on standard chow and all other experimental groups (H) Representative image of cytokine array blots (n = 3) per group quantified and presented as graphs in Figure 7G and Figure 7—figure supplement 1G.
Tables
Table 1
Relaxation times of water protons and Magnetization Transfer ratios determined by MRI (related to Figure 5).
| 6 months | 12 months | |||||
|---|---|---|---|---|---|---|
| Background | Wild type | Gaa(-/-) | Wild type | Gaa(-/-) | ||
| n | n = 8 | n = 8 | n = 5 | n = 5 | ||
| T1 (s) | ||||||
| Cerebral Cortex | 1.67 ± 0.07 | 1.67 ± 0.07 | 1.65 ± 0.05 | 1.62 ± 0.09 | ||
| Striatum | 1.62 ± 0.05 | 1.64 ± 0.07 | 1.62 ± 0.03 | 1.58 ± 0.06 | ||
| Thalamus | 1.49 ± 0.03 | 1.52 ± 0.09 | 1.50 ± 0.04 | 1.46 ± 0.03 | ||
| T2 (ms) | ||||||
| Cerebral Cortex | 40.3 ± 0.5 | 38.3 ± 0.8*** | 39.8 ± 0.7 | 37.9 ± 0.5* | ||
| Striatum | 39.7 ± 1.0 | 37.3 ± 0.8** | 38.5 ± 0.6 | 36.7 ± 0.7* | ||
| Thalamus | 38.4 ± 1.0 | 35.9 ± 1.1** | 37.2 ± 0.3 | 36.2 ± 0.8 | ||
| Magnetization Transfer Ratio (%) | ||||||
| Cerebral Cortex | 7.5 ± 1.7 | 7.0 ± 1.7 | 7.8 ± 0.9 | 8.4 ± 0.6 | ||
| Striatum | 9.9 ± 0.7 | 9.0 ± 0.8* | 9.8 ± 0.6 | 10.0 ± 0.9 | ||
| Thalamus | 12.5 ± 1.6 | 11.9 ± 1.9 | 12.9 ± 2.0 | 13.0 ± 0.9 | ||
Key resources table
| Reagent type (species) or resource | Designation | Source or reference | Identifiers | Additional information |
|---|---|---|---|---|
| Antibody | Anti-ATP5B | Self-made | PRAB4826 | WB (1:1000) |
| Antibody | Anti-ATP6V1H | Abcam | Cat# Ab187706 | WB (1:1000) |
| Antibody | Anti-COX1 | Self-made | PRAB2035 | WB (1:1000) |
| Antibody | Anti-cleaved caspase 3 | Cell signaling | RRID: AB_2070042 | WB (1:1000) |
| Antibody | Anti-cleaved PARP | Cell signaling | RRID: AB_10699459 | WB (1:1000) |
| Antibody | Anti-FTH1 | Cell signaling | RRID: AB_1903974 | WB (1:1000) |
| Antibody | Anti-Ferritin light chain | Abcam | RRID: AB_1523609 | WB (1:1000) |
| Antibody | Anti-GAPDH | Sigma-Aldrich | RRID: AB_796208 | WB (1:10000) |
| Antibody | Anti-GFAP | Abcam | RRID: AB_305808 | WB (1:1000) |
| Antibody | Anti-HA | Abcam | RRID:AB_301017 | WB (1:1000) |
| Antibody | Anti-HIF-1 alpha | Novus | RRID: AB_10000663 | WB (1:500) |
| Antibody | Anti-HPRT | Abcam | RRID: AB_297217 | WB (1:4000) |
| Antibody | Anti-LAMP1 | Sigma-Aldrich | RRID:AB_477157 | WB (1:1000) |
| Antibody | Anti-LC3B | Cell signaling | RRID: AB_2137707 | WB (1:1000) |
| Antibody | Anti-MBP | MPI-EM Goettingen | Klaus-Armin Nave | WB (1:1000) |
| Antibody | Anti-Total Rodent OXPHOS Cocktail | Abcam | RRID: AB_2629281 | WB (1:2000) |
| Antibody | Anti-PEX5 | Sigma-Aldrich | RRID:AB_10673419 | WB (1:1000) |
| Antibody | Anti-PLP | MPI-EM Goettingen | Klaus-Armin Nave | WB (1:1000) |
| Antibody | Anti-SQSTM1 | Abcam | RRID: AB_945626 | WB (1:8000) |
| Antibody | Anti-mtTFA | Abcam | RRID: AB_2651017 | WB (1:1000) |
| Antibody | Anti-TNFα | Abcam | Cat# Ab183218 | WB (1:1000) |
| Antibody | Anti-TOM20 | Proteintech Group | RRID: AB_2207530 | WB (1:1000) |
| Antibody | Anti-VAPB | Bethyl Laboratories | RRID:AB_2780841 | WB (1:1000) |
| Antibody | Anti-VDAC1 | Abcam | RRID: AB_443084 | WB (1:2000) |
| Antibody | Anti-VHL | Santa Cruz | RRID: AB_2215955 | WB (1:1000) |
| Antibody | Anti-mouse IgG | Jackson Laboratory | RRID: AB_2307392 | WB (1:4000) |
| Antibody | Anit-rabbit IgG | Jackson Laboratory | RRID: AB_2307391 | WB (1:4000) |
| Chemical compound, drug | Antimycin | Sigma-Aldrich | Cat# A8674 | 1 µM, 20 µM |
| Chemical compound, drug | Bafilomycin | Santa Cruz | Cat# sc-201550 | 500 nM, 50 nM |
| Chemical compound, drug | Bodipy581/591 C11 | Thermo Fisher | Cat# D3861 | 1 µM |
| Chemical compound, drug | Deferoxamine mesylate | Sigma-Aldrich | Cat# D9533 | 300 µM |
| Chemical compound, drug | Dimethyl 2-oxoglutarate | Th. Geyer GmbH | Cat# 349631 | 5 mM |
| Chemical compound, drug | Dextran Oregon Green 488 | Thermo Fisher | Cat# D7170 | 0.4 mg/mL |
| Chemical compound, drug | Dextran Tetramethylrhodamine | Thermo Fisher | Cat# D1817 | 1 mg/mL |
| Chemical compound, drug | Erastin | Cayman Chemical | Cat# 17754 | 10 µM |
| Chemical compound, drug | FCCP | Sigma-Aldrich | Cat# C2920 | 2 µM |
| Chemical compound, drug | Mito-FerroGreen | Dojindo Laboratories | Cat# M489 | 5 µM |
| Chemical compound, drug | FerroOrange | Goryo Chemical | Cat# GC904 | 1 µM |
| Chemical compound, drug | Ferrostatin | Sigma-Aldrich | Cat# SML0583 | 5 µM |
| Chemical compound, drug | H2DCF-DA | Thermo Fisher | Cat# D399 | 10 µM |
| Chemical compound, drug | Ferric citrate | Sigma-Aldrich | Cat# F3388 | 150 µM |
| Chemical compound, drug | Lipofectamine RNAiMAX Reagent | Thermo Fisher | Cat# 13778–150 | |
| Chemical compound, drug | Lipofectamine 2000 | Thermo Fisher | Cat# 11668–019 | |
| Chemical compound, drug | MitoSox Red Mitochondrial Superoxide indicator | Thermo Fisher | Cat# M36008 | 1 µM |
| Chemical compound, drug | Necrostatin-1s | Abcam | Cat# Ab221984 | 5 µM |
| Chemical compound, drug | Oligomycin | Sigma-Aldrich | Cat# O4876 | 1 µM |
| Chemical compound, drug | Pierce anti-HA Magnetic Beads | Thermo Scientific | Cat# 88836 | 200 µL |
| Chemical compound, drug | Rotenone | Sigma-Aldrich | Cat# R8875 | 1 µM |
| Chemical compound, drug | Saliphenylhalamide | Omm Scientific Inc | Donald R. Stewart | 500 nM |
| Chemical compound, drug | Staurosporine | LC Laboratories | Cat# S-9300 | 1 µM |
| Chemical compound, drug | TriReagent | Sigma-Aldrich | Cat# T9424 | |
| Chemical compound, drug | z-VAD | InVivoGen | Cat# tlrl-vad | 20 µM |
| Commercial assay or kit | Iron assay Kit | Abcam | Cat# Ab83366 | |
| Commercial assay or kit | Crystal RNA Mini Kit | BioLab Products | Cat# 31-010-404 | |
| Commercial assay or kit | Luna Universal qPCR Master Mix | New England Biolabs | Cat# M3003E | |
| Commercial assay or kit | iScript cDNA Synthesis Kit | Bio-Rad | Cat# 170–8891 | |
| Commercial assay or kit | Proteome Profiler Mouse Cytokine Array Kit, Panel A | R and D Systems | Cat# ARY006 | |
| Commercial assay or kit | Cell Titer-Glo Luminiscence Cell Viability Assay | Promega | Cat# G7572 | |
| Commercial assay or kit | Seahorse XFe Cell Mito Stress Test Kit | Agilent | Cat# 103015–100 | |
| Cell line (M. musculsus) | Murine embryonic fibroblast (wild type) | This paper | N/A | |
| Cell line (M. musculsus) | Gaa-/- murine embryonic fibroblasts | This paper | N/A | |
| Cell line (M. musculsus) | Primary cortical neurons | This paper | N/A | |
| Cell line (M. musculsus) | Irp1-/- and Irp2-/- murine embryonic fibroblasts | Israel Institute of technology | Esther Meyron-Holtz | |
| Cell line (M. musculsus) | Tmem192-3xHA murine embryonic fibroblasts | This paper | N/A | |
| Cell line (M. musculsus) | Mcoln1-/- murine embryonic fibroblasts | Ludwig Maximillians- University, Munich | Christian Grimm | |
| Genetic reagent (M. musculus) | Mouse: B6;129-GaatmRabn/J | Jackson Laboratory | JAX: 004154 | |
| Sequence-based reagent | qPCR primer sequences | Integrated DNA technologies | This paper (N/A) | Sequences inSupplementary file 5 |
| Recombinant DNA reagent | Plasmid: pAcGFP1-Mito | Clontech | Cat# 632432 | |
| Recombinant DNA reagent | Plasmid: pLJC5-Tmem192-3xHA | Addgene | Cat# 102930 | |
| Transfected reagent (M. musculus) | siRNA to Atp6v1h | Integrated DNA technologies | This paper (N/A) | Sequences inSupplementary file 5 |
| Transfected reagent (M. musculus) | siRNA to Slc11a2 | Integrated DNA technologies | This paper (N/A) | Sequences in Supplementary file 5 |
| Software, algorithm | Metascape | Zhou et al., 2019 | http://metascape. org/gp/index. html#/main/step1 | |
| Software, algorithm | Prism version 8.0 | GraphPad Software Inc | https://www.graphpad.com/scientific-software/prism/ | |
| Software, algorithm | ImageJ version 1.51j8 | NIH | https://imagej.nih.gov/ij/ | |
| Software, algorithm | Ingenuity Pathway Analysis | Qiagen Bioinformatics | https://www.qiagenbioinformatics.com/products/ingenuity-pathway-analysis/ | |
| Software, algorithm | Partek Genomics Suite Analysis Software | Partek Inc | http://www.partek.com/partek-genomics-suite/ | |
| Software, algorithm | Wave Desktop software | Agilent | https://www.agilent.com/en/products/cell-analysis/software-download-for-wave-desktop | |
| Software, algorithm | Digigait Imaging and Analysis software | Mouse Specifics Inc | https://mousespecifics.com/digigait/ | |
| Software, algorithm | FlowJo v10 | Tree Star Inc | https://www.flowjo.com/solutions/flowjo/downloads |
Additional files
-
Supplementary file 1
Annotation of disease or functions (Ingenuity Pathway Analysis) for the category of cell death and survival, for the differentially-expressed gene list obtained from dataset GSE47836.
- https://cdn.elifesciences.org/articles/51031/elife-51031-supp1-v2.xls
-
Supplementary file 2
Annotation of disease or functions (Ingenuity Pathway Analysis) for the category of cell death and survival, for the differentially-expressed gene list obtained from dataset GSE60570.
- https://cdn.elifesciences.org/articles/51031/elife-51031-supp2-v2.xls
-
Supplementary file 3
Annotation of disease or functions (Ingenuity Pathway Analysis) for the category of cell death and survival, for the differentially-expressed gene list obtained from dataset GSE16870.
- https://cdn.elifesciences.org/articles/51031/elife-51031-supp3-v2.xls
-
Supplementary file 4
Concentration and concentration ratios of metabolites determined by in vivo MRS.
- https://cdn.elifesciences.org/articles/51031/elife-51031-supp4-v2.docx
-
Supplementary file 5
List of qPCR primers and siRNA sequences for mouse genes.
- https://cdn.elifesciences.org/articles/51031/elife-51031-supp5-v2.docx
-
Supplementary file 6
Antibody validation.
- https://cdn.elifesciences.org/articles/51031/elife-51031-supp6-v2.docx
-
Transparent reporting form
- https://cdn.elifesciences.org/articles/51031/elife-51031-transrepform-v2.pdf
Download links
A two-part list of links to download the article, or parts of the article, in various formats.
Downloads (link to download the article as PDF)
Open citations (links to open the citations from this article in various online reference manager services)
Cite this article (links to download the citations from this article in formats compatible with various reference manager tools)
Impaired lysosomal acidification triggers iron deficiency and inflammation in vivo
eLife 8:e51031.
https://doi.org/10.7554/eLife.51031


