Single cell analysis reveals multiple requirements for zinc in the mammalian cell cycle
- University of Colorado, Boulder, United States
- University of California, Berkeley, United States
Figures
Figure 1 with 5 supplements
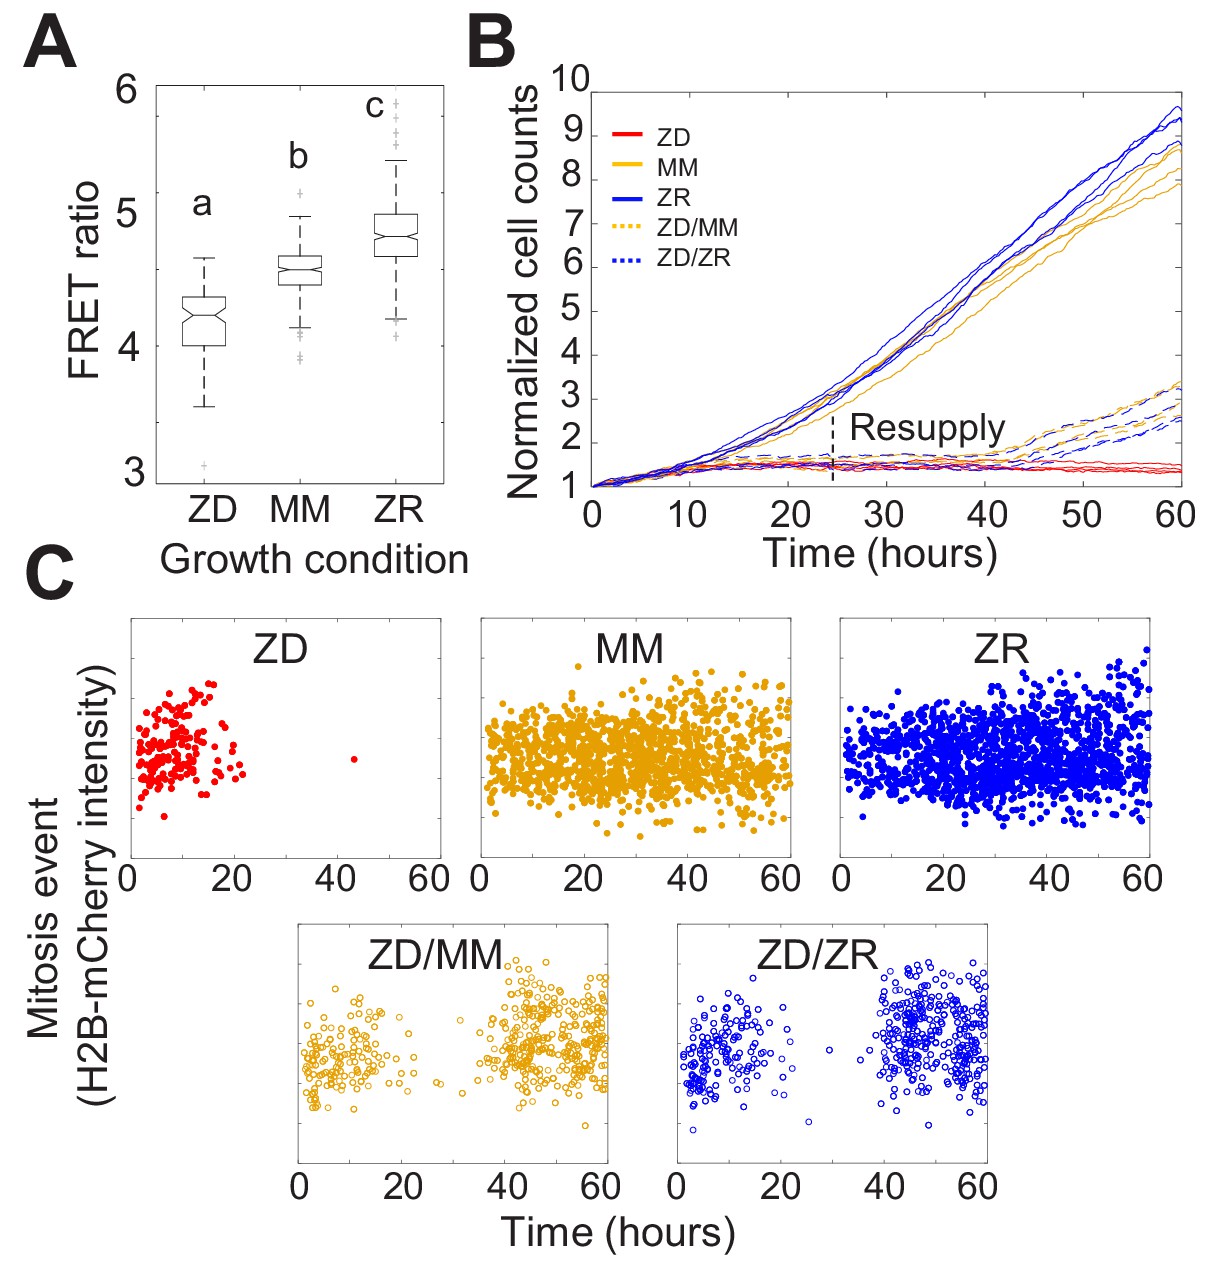
Nutritional Zn2+ levels influence cell proliferation and intracellular Zn2+ levels.
(A) The FRET ratio, which is proportional to labile Zn2+, of cells expressing ZapCV2 and grown in ZD, MM, or ZR conditions (n = 103, 382, and 402, respectively, pooled from four wells from each condition). Letters indicate statistically different groups by ANOVA with Tukey-Kramer, p<0.001 for each comparison. DF = 2 and F = 333). Average FRET ratios were calculated in a one hr window before mitosis. (B) Normalized cell counts after 60 hr of growth in either Zn-deficient (ZD), minimal medium (MM), or Zn replete (ZR) medium. ZD/MM and ZD/ZR conditions were grown in ZD medium until resupply with either MM or ZR medium at 24 hr. Each line represents cells grown in an individual well (n = 4 wells per condition). Cell counts were normalized to initial density in each well. (C) Mitosis events detected over time of cells in panel A. Mitosis events were identified as described in Supplementary file 1 (Total mitosis events pooled from four wells).
-
Figure 1—source data 1
FRET ratios of cells grown in different media.
- https://cdn.elifesciences.org/articles/51107/elife-51107-fig1-data1-v1.xlsx
Figure 1—figure supplement 1

Total elemental content in minimal medium with and without Chelex 100 treatment.
ICP-MS analysis was used to measure elemental content in minimal medium containing 1.5% horse serum. Components of MM (horse serum and insulin) were treated with Chelex 100 to remove additional Zn (MM+Chelex). n = 4 replicates per condition. Black bars indicate mean and SEM is depicted with brackets. While Cu and Ca were slightly lower in Chelex-treated medium, the differences were not statistically significant. The difference for Zn and Ni was statistically significant, where * indicates p<0.05 with paired t-test. For Zn, p=0.0059 and for Ni, p=0.0276.
-
Figure 1—figure supplement 1—source data 1
ICP-MS data for total elemental content in minimal medium with and without Chelex-100.
- https://cdn.elifesciences.org/articles/51107/elife-51107-fig1-figsupp1-data1-v1.xlsx
Figure 1—figure supplement 2
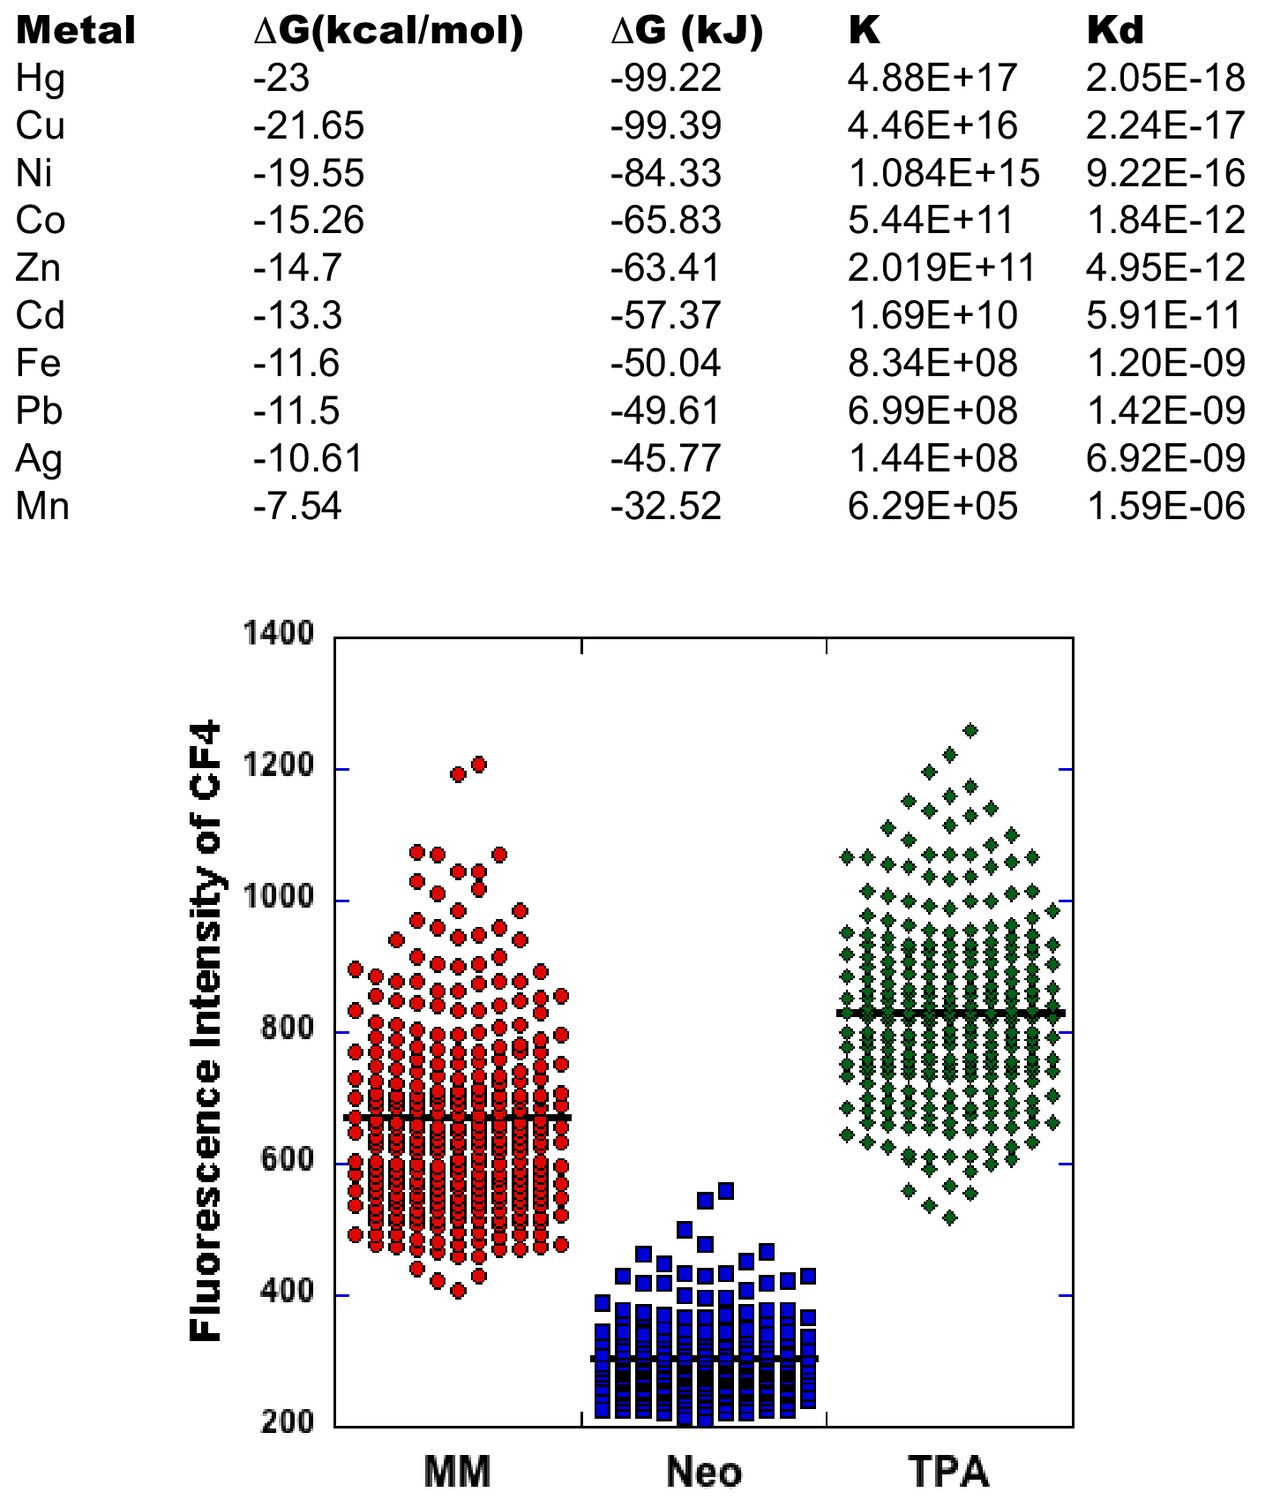
The effect of TPA on metal ions other than zinc.
The ΔG values in kcal/mol for TPA binding to metals were obtained from Giorgio Anderegg et al, Helvetica Chimica Acta, Vol 60, Fasc 1 (1977) – Nr 1. These values were converted to kJ/mol and finally to a binding constant (K), assuming standard state conditions and 293K. The Kd was calculated from 1/K. Analysis of Kd values indicates that relative to other biologically relevant metal ions (Cu, Fe, Mn), TPA binds Cu more tightly than Zn. While research suggests that there is a kinetically accessible labile pool of Cu in cells (Ackerman and Chang, J. Biol. Chem., 293 (Ly et al., 2015) 4628–4635 (2017)), it has been estimated to be in the attomolar (10−18 M, Morgan et al., PNAS, 116 (Corniola et al., 2008) 1216—12172 (2019)) range and typically requires high concentrations (50–200 μM) of a high affinity chelator (bathocuproine sulfate or neocuproine, Kd = 1.2×10⁻²⁰) to deplete. However, in order to test whether 3 μM TPA (the highest concentration of TPA used to induce Zn deficiency) could deplete the labile pool of Cu in cells, we used CF4 (Xiao et al., Nature Chem. Bio. (Matson and Cook, 2017) 655–663 (2018)). Cells in minimal medium were treated with 50 μM neocuproine for 30 min or 3 μM TPA for 20 hr. At the end of treatment, 2 μM CF4 (dissolved in methanol) was added for 20 min. After washing cells 3x, cells were imaged on a spinning disc confocal with 514 nm excitation. The plot above shows the background corrected fluorescence intensity for individual cells (286 cells for MM, 231 cells for neo and 266 for TPA). Neocuproine depletes the labile Cu pool (p<0.0001, ANOVA with Tukey HSD post-hoc test) but TPA does not.
Figure 1—figure supplement 3

TPEN induces high levels of cell death, while TPA at low levels causes significantly less cell death.
% dead cells after 30 hr of growth in defined medium. Cell death was measured using trypan blue and cells were counted using an automated cell counter. n = 3 per condition. Black bars indicate mean for each condition.
-
Figure 1—figure supplement 3—source data 1
Data for cell viability under different chelator concentrations.
- https://cdn.elifesciences.org/articles/51107/elife-51107-fig1-figsupp3-data1-v1.xlsx
Figure 1—figure supplement 4
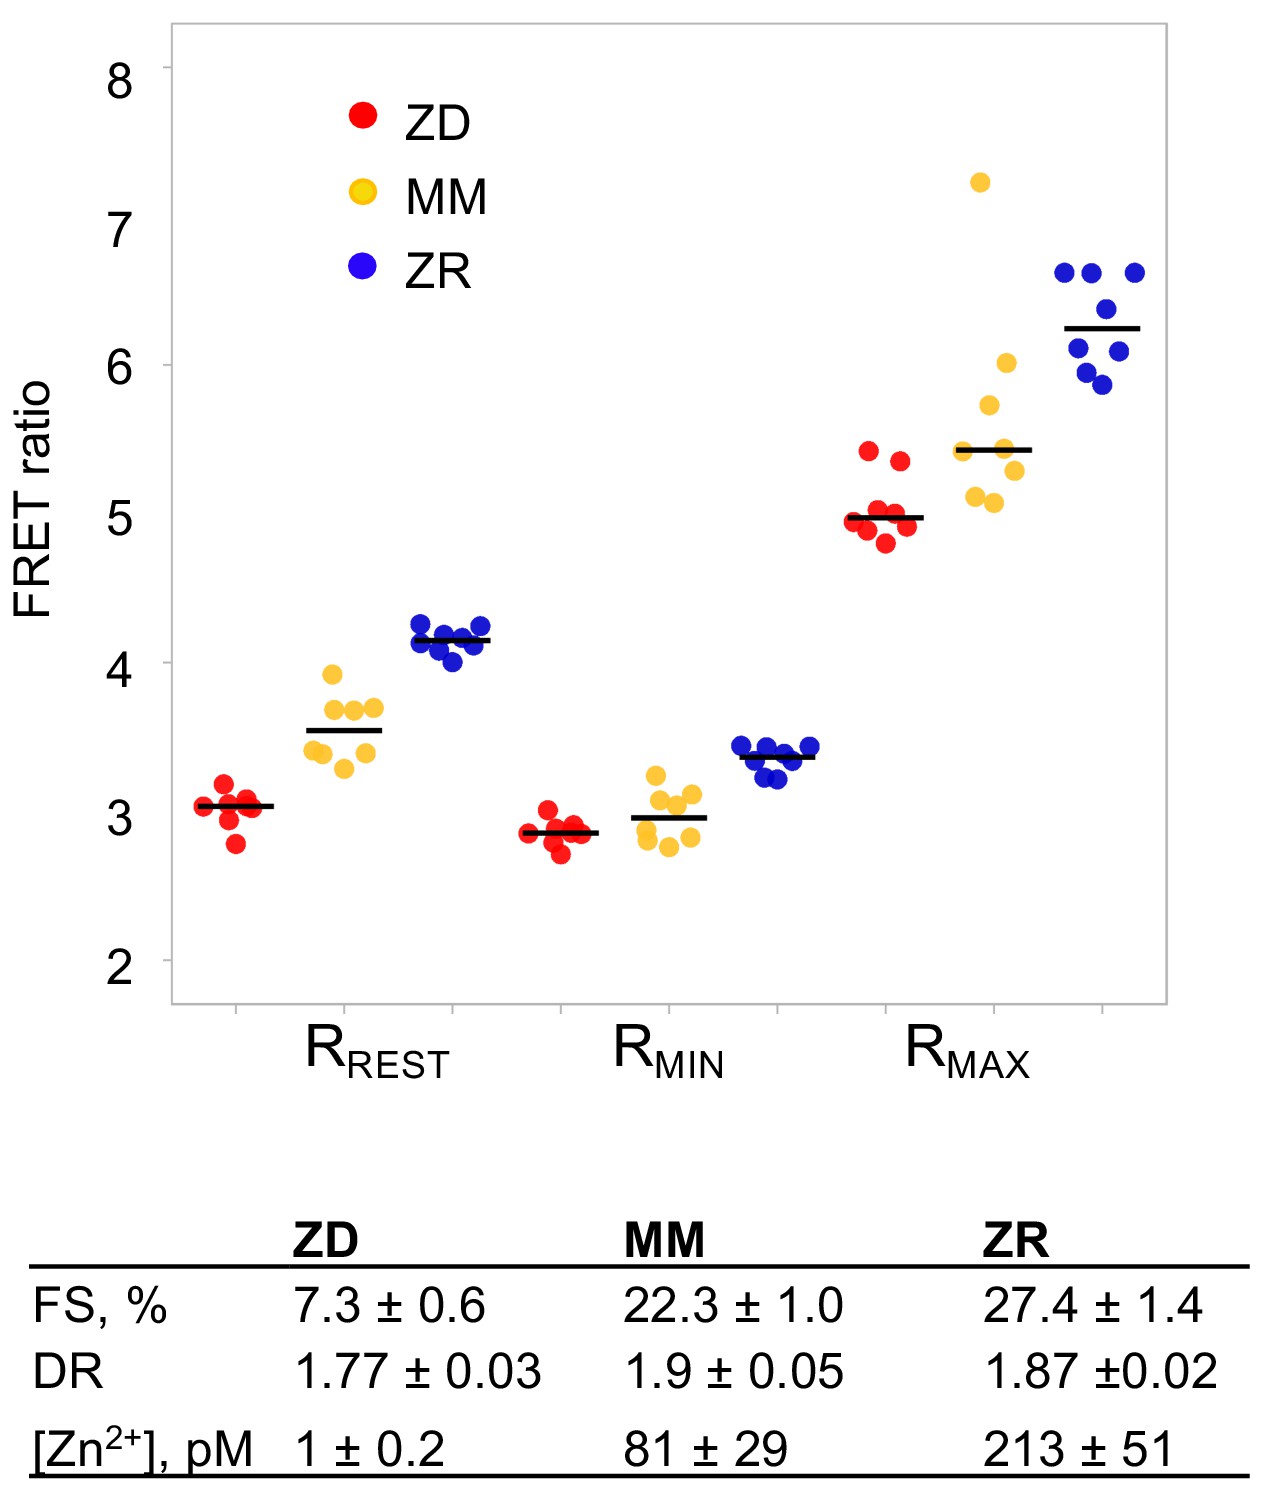
Intracellular Zn2+ levels titrate with extracellular medium.
Sensor calibrations of MCF10A cells stabling expressing PB-NES-ZapCV2. Cells were grown for 24 hr in either ZD (3 µM TPA), MM, or ZR media. For collection of Rrest, cells were imaged in ZD, MM, or ZR. To collect Rmin, 50 µM TPA in MM was added. Rmax was measured by treatment with HBSS buffer with 119 nM Zn2+, 0.001% saponin, and 5 µM pyrithione. Fractional saturation (FS) and dynamic range (DR) of the sensor were calculated. Zn2+ concentrations were measured as described in the methods. n = 8 per condition and black bars indicate mean.
Figure 1—figure supplement 5
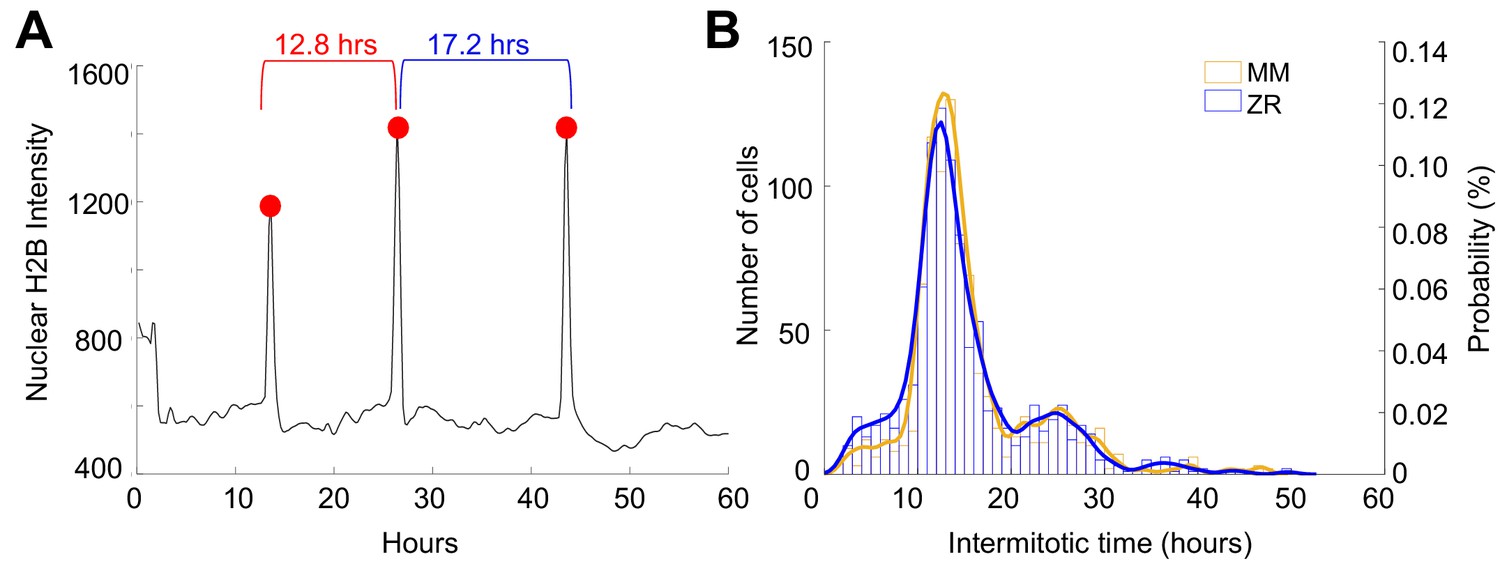
Intermitotic time does not differ between cells grown in minimal medium and Zn2+ replete conditions.
(A) H2B intensity of a single cell tracked throughout a 60 hr period. Three mitosis events were detected and marked with a red dot. The intermitotic time (IM) was calculated by determining the difference in hours between each successive mitosis event and indicated above. (B) Intermitotic times for divisions within a 60 hr period of cells grown in either MM or ZR conditions. Histograms show number of cells in each IM time bin and overlaid density plots show the probability of IM times, peaking ~13 hr for both conditions (n = 907 in MM and n = 1000 in ZR, each pooled from four wells).
Figure 2 with 1 supplement

Mild Zn2+ deficiency induces cellular quiescence and stalling of the cell cycle in S-phase.
(A) Schematic of possible cell fates identified using the CDK2 activity reporter. Dashed lines indicate time and CDK2 activity thresholds used for cell fate classifications. Cell traces were computationally aligned to mitosis. (B) Single cell CDK2 traces of cells grown for 60 hr in either ZD, MM, or ZR media (n = 80 random cell traces from four individual wells). Gray CDK2 traces in top panel are displayed in real time and red dots indicate mitosis events. CDK2 traces in bottom panel are aligned computationally to mitosis and colored by cell fate classifications based on CDK2 activity after the first mitosis event. Percent of the total traces classified into each category are listed above traces (n = 254, 2015, 2059 total cells from four wells for ZD, MM, and ZR, respectively). (C) Traces from individual cell fate classifications of cells grown in ZD medium as in B (n = 80 random traces). (D) FACS analysis of cells grown for 24 hr in either ZD (3 µM or 2 µM TPA), MM, or ZR media. Density scatter plots of pRb Ser 807/811 vs. PI DNA staining are displayed for each growth condition (n = 4527, 6104, 7149, 10,010, respectively). Hyper-pRb vs. hypo-pRb populations are indicated.
Figure 2—figure supplement 1
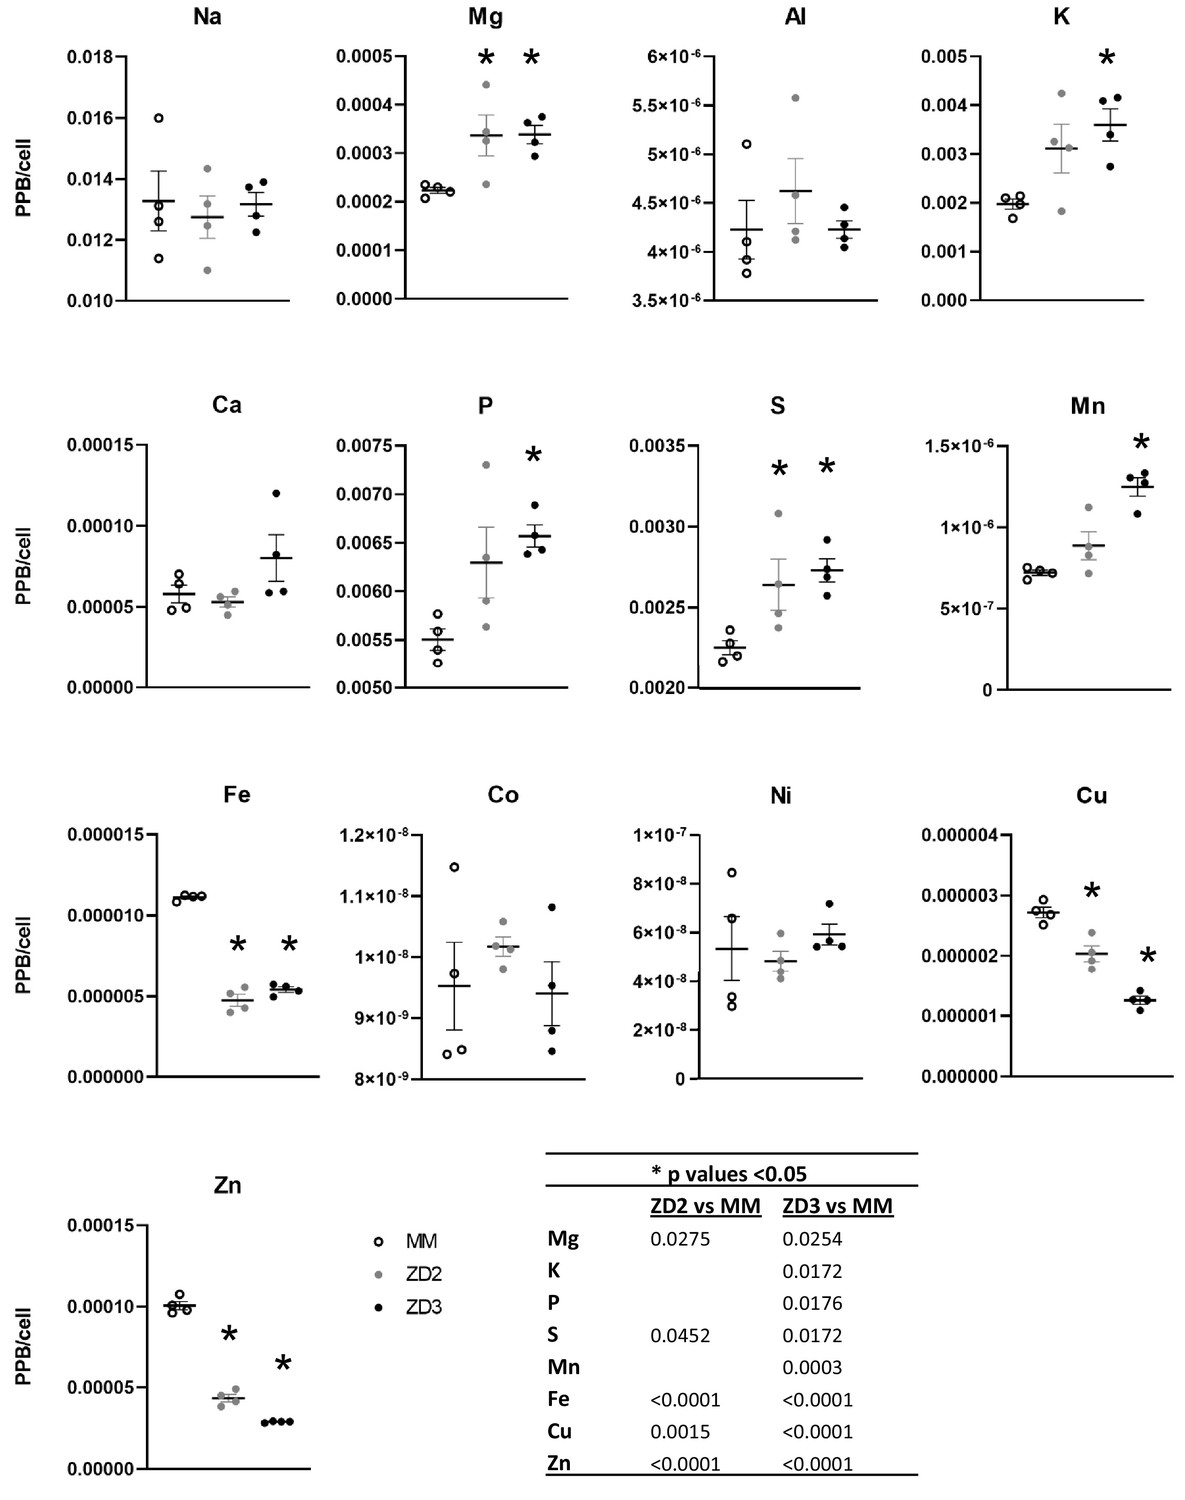
Total elemental content in cells grown in ZD medium compared to MM.
ICP-MS was used to analyze cells growth for 24 hr in either ZD or MM conditions (ZD3 = 3 µM TPA and ZD2 = 2 µM TPA). n = 4 replicates per condition. Black bars indicate mean and SEM is depicted with brackets. *p<0.05 with one-way ANOVA Dunnett’s multiple comparisons test with MM as control sample.
-
Figure 2—figure supplement 1—source data 1
ICP-MS data of total elemental content in cells grown in ZD medium comparred to MM.
- https://cdn.elifesciences.org/articles/51107/elife-51107-fig2-figsupp1-data1-v1.xlsx
Figure 3
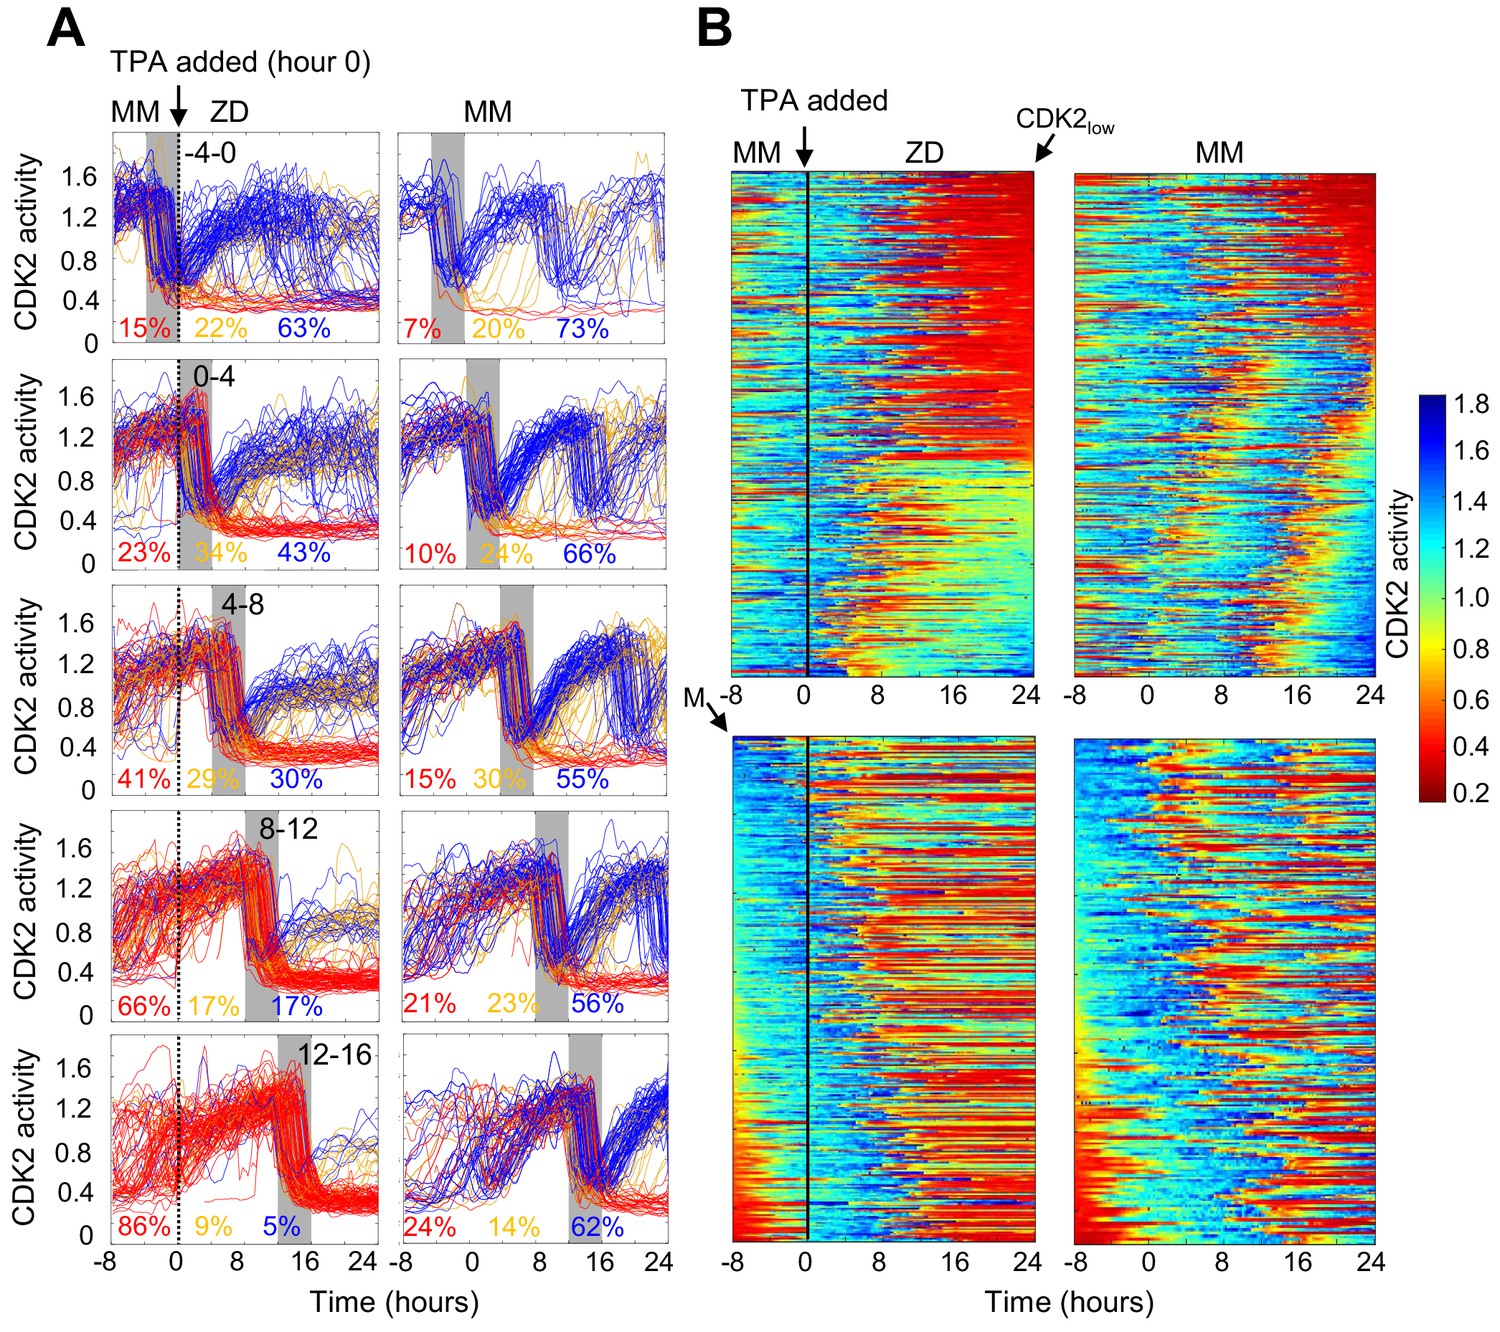
Timing of Zn2+ deprivation with respect to cell cycle phase influences cell fate.
(A) Single cell traces of CDK2 ratio over time in cells grown for 8 hr in MM followed by 24 hr in ZD conditions (left panels) or in unperturbed MM (right panels). Arrow/black vertical bar indicates time of TPA addition. Traces are separated by windows of when they underwent mitosis events relative to TPA addition. These 4 hr windows are shaded in gray (−4 to 0 hr relative to TPA addition, 0–4, 4–8, 8–12, and 12–16). Each plot shows n = 120 random traces (except the top right plot: n = 43 due to fewer cells identified in window) from 24 wells for TPA perturbed cells and eight wells for MM cells. The % traces in each category are listed below each plot. Total number of cells analyzed for these calculations: n = 237, 504, 760, 609, and 422 from top to bottom for TPA treatment windows and 43, 124, 165, 185, and 205 from top to bottom for MM windows). Cells are classified and color-coded based on the CDK2 ratio immediately following the first mitosis event. (B) Heatmaps of CDK2 traces from individual cells as grown in A, sorted computationally. Top panel heatmaps are sorted from CDK2low to CDK2high at end of the imaging period. Bottom panel heatmaps are sorted by the time of mitosis (M) at the start of the imaging period. Legend shows the CDK2 color heatmap. n = 321 traces for each heatmap.
-
Figure 3—source data 1
CDK2 ratios as a function of time for each data trace in Figure 3.
- https://cdn.elifesciences.org/articles/51107/elife-51107-fig3-data1-v1.xlsx
Figure 4
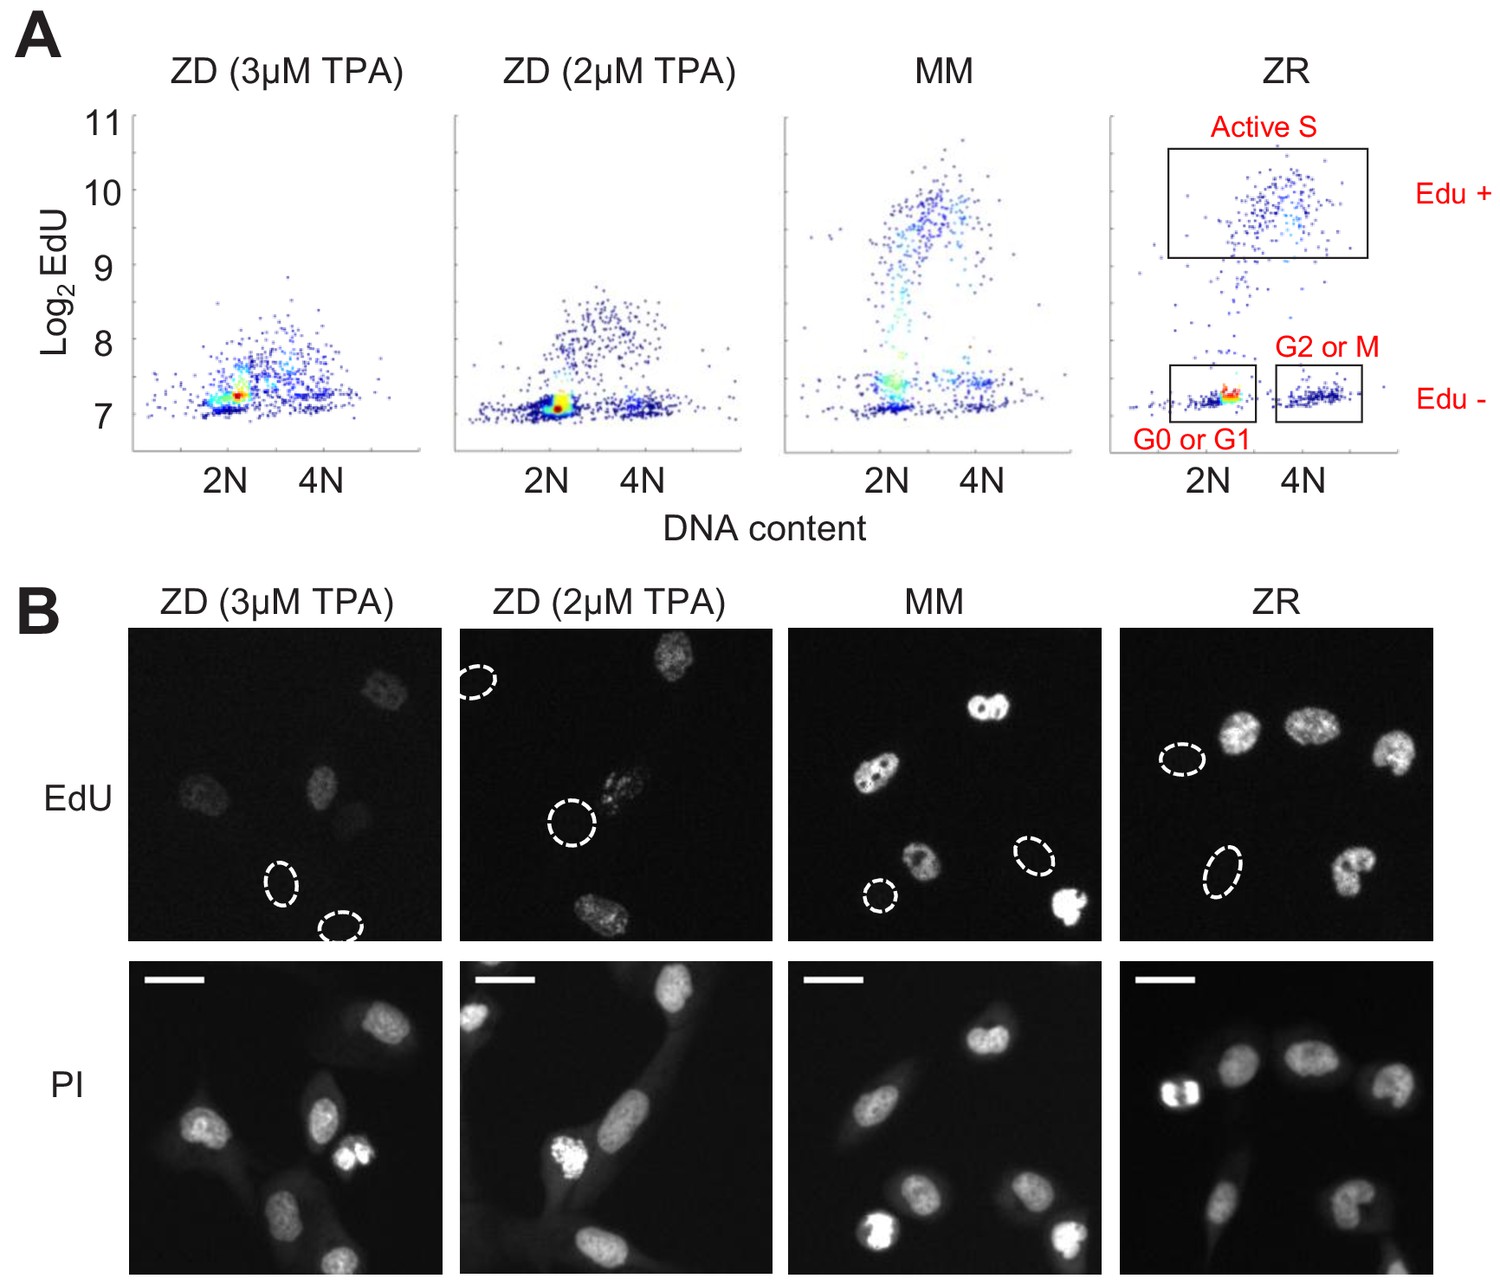
Zn2+ deficiency causes a defect in DNA synthesis.
(A) Density plots of single cells analyzed for EdU incorporation and DNA content. EdU incorporation was measured after 15 mins of incubation after 24 hr of growth in either ZD (3 µM or 2 µM TPA), MM, or ZR conditions (n = 1437 pooled from two wells, 916 from two wells, 817 from four wells, 676 from four wells, respectively, by condition). Propidium iodide (PI) plus RNAse was used to stain for DNA content define 2N and 4N populations. Cell cycle phases were classified by their location on the 2D Edu vs. DNA plot (shown in red). (B) Representative cell images for Edu and PI staining for each growth condition. EdU negative cells are outlined with a white dash lined. Scale bars indicate 20 µm.
Figure 5
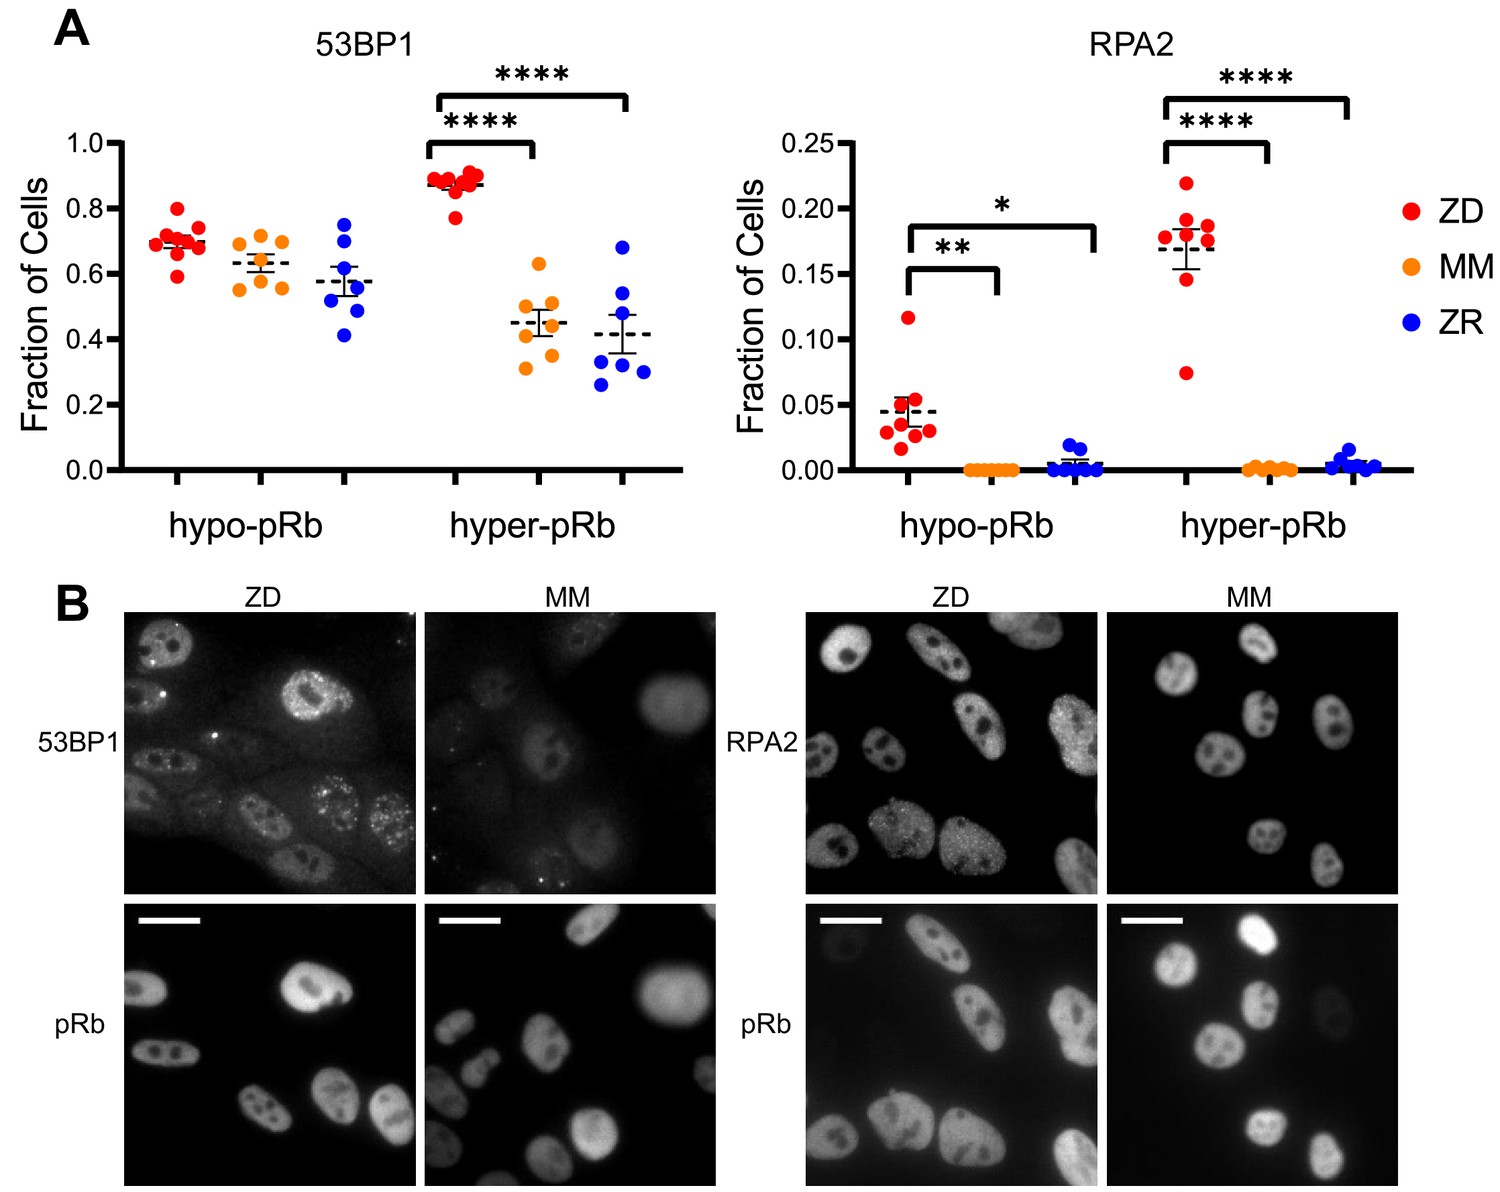
Zn2+ deficiency leads to increased DNA damage.
(A) Cells were grown in ZD, MM, or ZR media for 24 hr and then stained with antibodies for pRb and either 53BP1 (a marker of DSB) or RPA2 (a marker of SSB). The pRb status of each cell was used to classify cells as either quiescent (hypo-pRb) or cycling (hyper-pRb). Foci were identified using a custom MATLAB script. The fraction of cells positive for DNA damage (presence of 1+ foci) is plotted. Each point represents an individual well from two pooled biological replicate experiments (n wells = 6–9 per condition).The total n values for each condition are as follows: 53BP1: 5940, 6069, and 7473 for ZD, MM, and ZR; RPA2: 4454, 5991, and 6480 for ZD, MM, and ZR. Statistical significance was assessed using one-way ANOVA with Sidak’s multiple corrections test (*p<0.05, **p<0.01, ****p<0.0001). Exact p-values for 53BP1: hyper-ZD vs hyper-MM = 5.54E-10, hyper-ZD vs hyper-ZR = 6.61E-11; Exact p-values for RPA2: hypo-ZD vs hypo-MM = 4.17E-03; hypo-ZD vs hypo-ZR = 1.35E-02, hyper-ZD vs hyper-MM = 1.00E-15, hyper-ZD vs hyper-ZR = 3.00E-15. (B) Representative images for 53BP1 and RPA2 staining for ZD and MM conditions. Scale bars indicate 20 µm.
-
Figure 5—source data 1
Cell parameters for DNA damage assay.
- https://cdn.elifesciences.org/articles/51107/elife-51107-fig5-data1-v1.xlsx
Figure 6 with 1 supplement
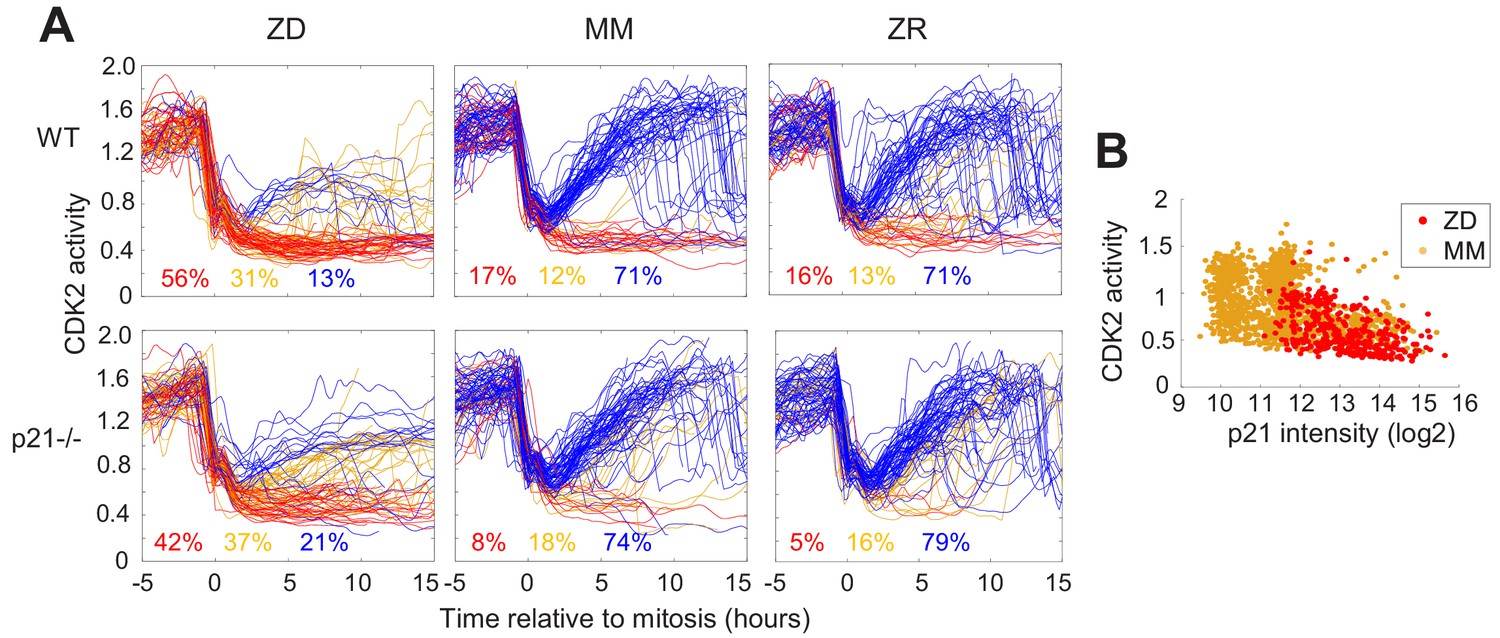
Quiescence induced by Zn2+deficiency does not require p21.
(A) Single cell CDK2 traces of WT (top) and p21-/- (bottom) MCF10A cells grown in either ZD, MM, or ZR media. Plots show n = 120 random traces selected from eight individual wells. CDK2 traces were aligned computationally to mitosis and colored by cell fate classifications. % total traces classified into each category are listed below traces (calculated from total traces n = 410, 3275, 3445 for WT cells grown in ZD, MM, and ZR, respectively and n = 441, 764, and 659 for p21-/- cells). (B) CDK2 ratio vs. p21 intensity in WT MCF10A cells at a fixed timepoint after 40 hr of growth in ZD or MM media. p21 was detected with an anti-p21 antibody (for ZD, n = 412 cells pooled from three wells; for MM, n = 1414 cells pooled from three wells).
Figure 6—figure supplement 1
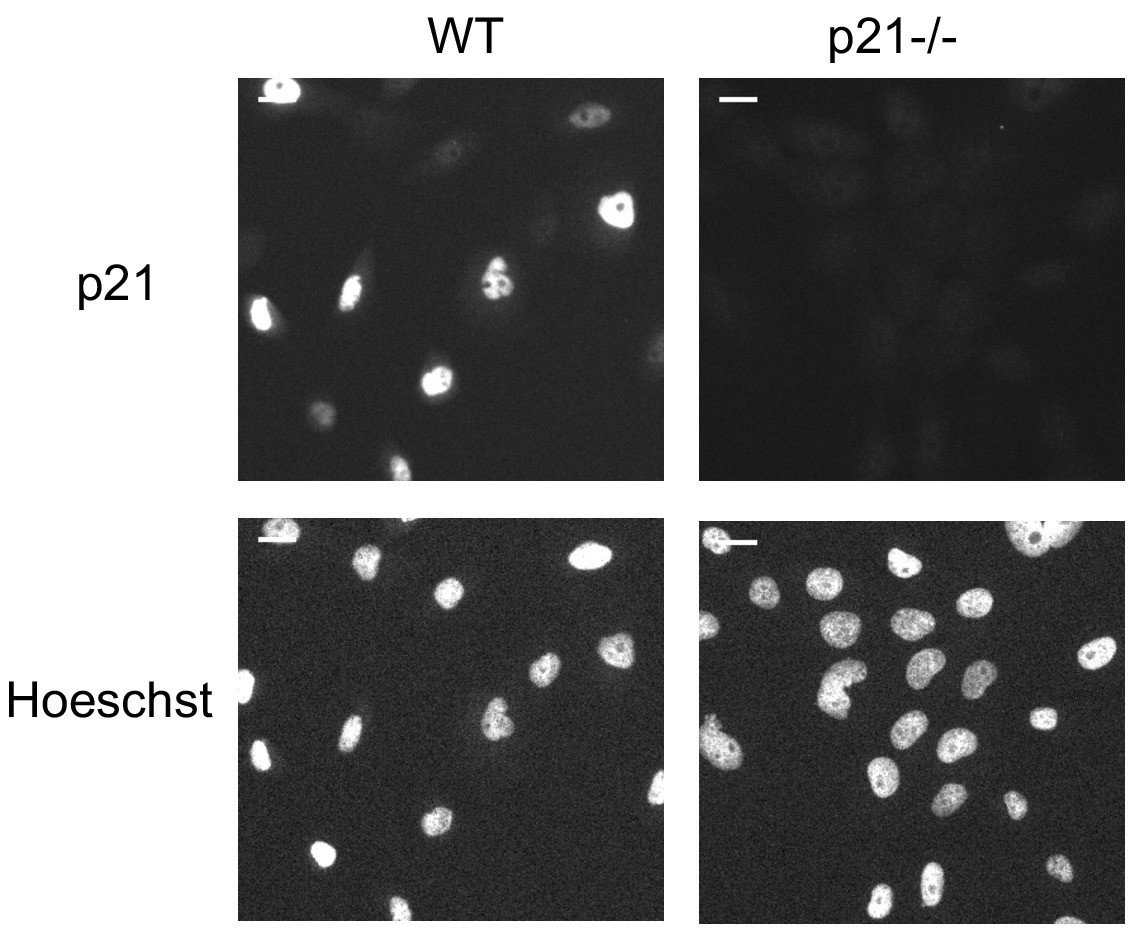
Validation of p21 knockdown in p21-/- cell line.
Representative cell images for Hoescht DNA staining and p21 IF for WT MCF10A cells and p21-/- MCF10A cells. p21 was detected with an anti-p21 antibody. Scale bars indicate 20 µm.
Figure 7 with 2 supplements
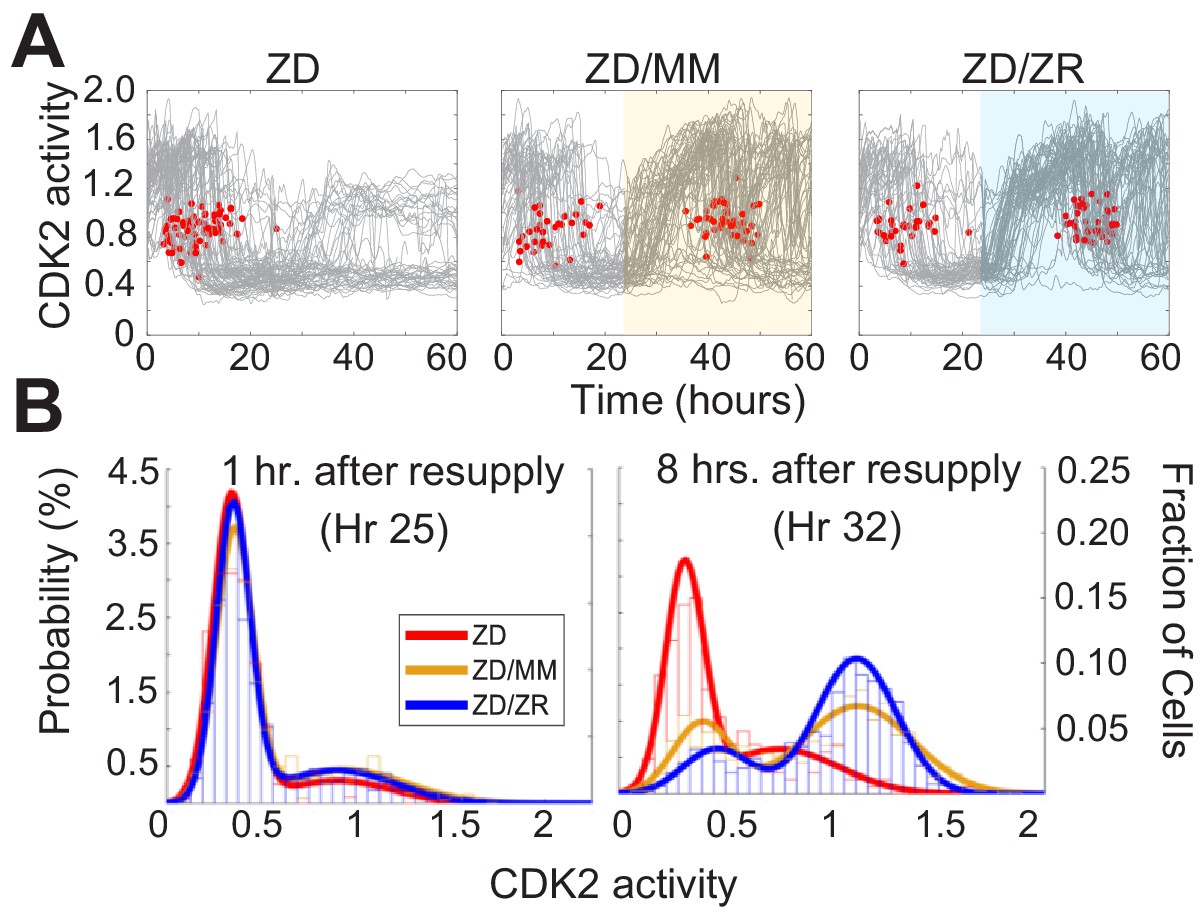
Zn2+ resupply after Zn2+-deficiency induced quiescence allows re-entry into the cell cycle.
(A) Single cell CDK2 traces of cells grown in ZD conditions for 60 hr and cells grown in ZD for 24 hr and resupplied with either MM or ZR media (n = 80 random traces from four wells per condition). Yellow or blue shaded regions indicate medium resupply. Red dots indicate mitosis events. (B) CDK2 ratio density histograms after cells either remain in ZD medium or are resupplied with MM or ZR. Histograms are shown for timepoints 1 and 8 hr after resupply (n = 210, 1068, and 1024 for ZD, MM, and ZR respectively for hr 1; n = 187, 1154, and 1139 for ZD, MM, and ZR respectively for hr 8, pooled from four wells for ZD and eight wells for ZD/MM and ZD/ZR).
Figure 7—figure supplement 1
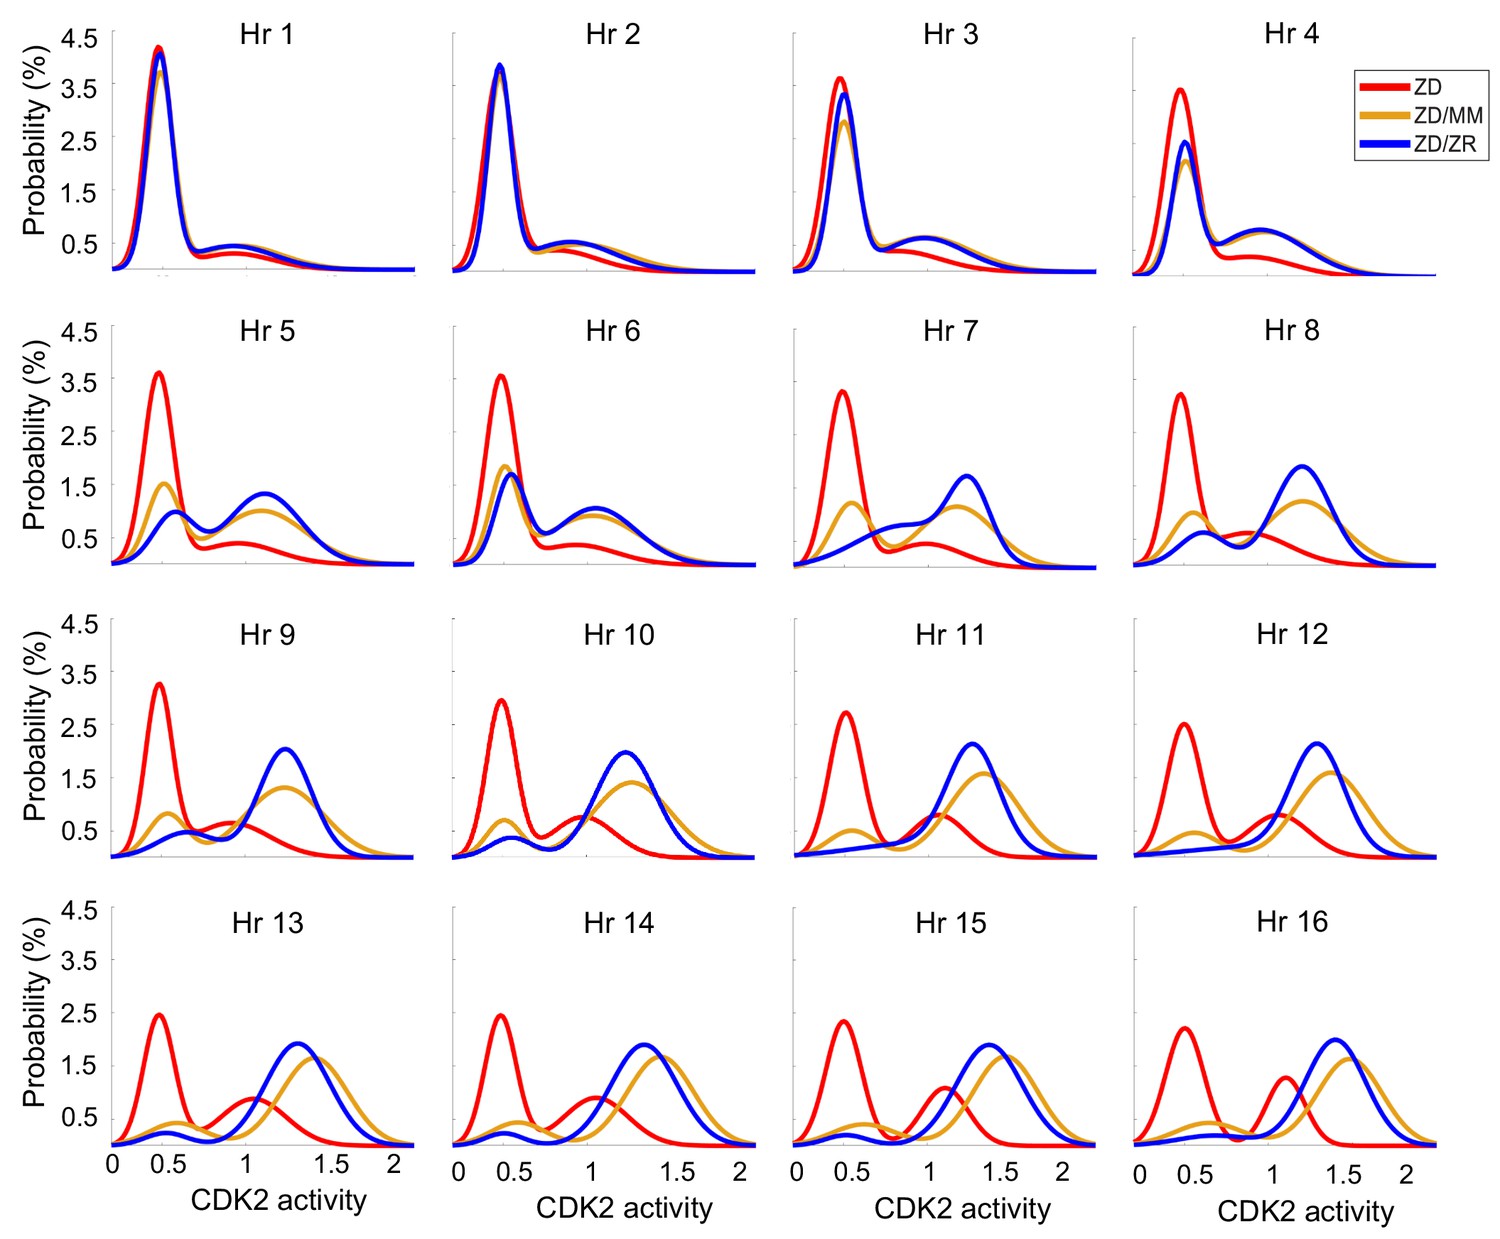
Zn2+ resupply allows for re-entry into the cell cycle following Zn2+ deficiency-induced quiescence.
CDK2 activity density plots after cells either remain in ZD medium or are resupplied with MM or ZR. Hr indicates number of hours after resupply, for example Hr 1 = 1 hr after resupply, or hour 25 of the experiment (n = 210, 207, 202, 195, 196, 196, 191, 187, 185, 188, 188, 187, 187, 181, 178, and 176, for Hr 1–16 for ZD pooled from four wells, 1068, 1121, 1129, 1124, 1127, 1142, 1149, 1154, 1165, 1169, 1170, 1178, 1191, 1187, 1182, and 1198, for MM pooled from eight wells, and 1024, 1067, 1085, 1103, 1120, 1124, 1137, 1139, 1144, 1150, 1148, 1153, 1156, 1157, 1166, and 1162 for ZR pooled from four wells for ZD and eight wells for ZD/MM and ZD/ZR).
Figure 7—figure supplement 2
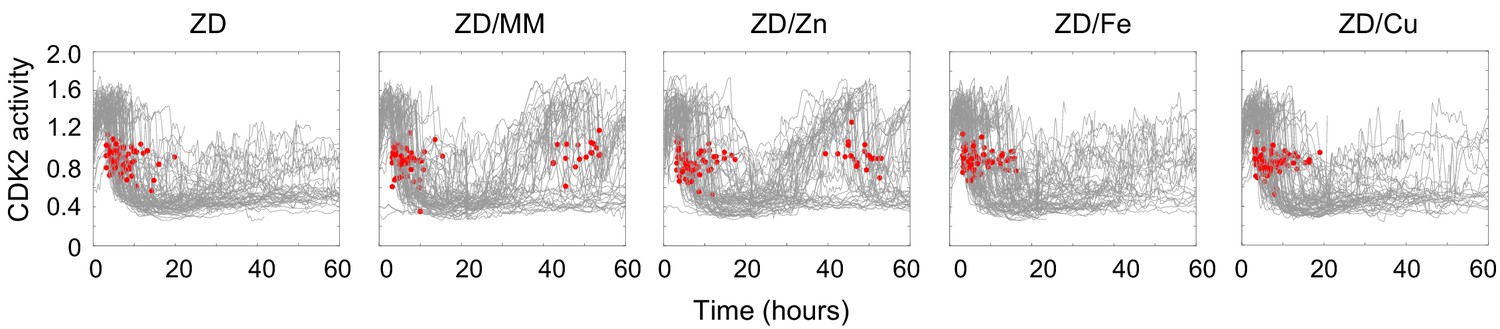
Zn2+ resupply, but not Cu2+ or Fe2+ allows for re-entry into the cell cycle following Zn2+ deficiency-induced quiescence.
Single cell CDK2 traces of cells grown in ZD conditions (3 µM TPA) for 60 hr and cells grown in ZD for 21 hr and resupplied with either MM, ZnCl2 (0.73 µM), FeCl2 (0.8 µM), or CuCl2 (0.16 µM), (n = 80 random traces from four wells per condition for ZD, three wells for ZD/MM, and seven wells for ZD/Zn, ZD/Fe, and ZD/Cu). These concentrations were calculated from ICP-MS data on Chelex-treated MM. Specifically, because replacing half the medium on quiescent cells with MM induced cell cycle re-entry, we added back half the concentration of each element in MM. Red dots indicate mitosis events. Source Data Figure 1: Resting FRET values for cells grown in ZD, MM or ZR media for Figure 1A. Source Data Figure 1—figure supplement 1: ICP-MS data in ppb per cell for MM and Chelex-100-treated MM. Samples were run in triplicate. Source Data Figure 1—figure supplement 3: Live-dead analysis of cells grown in TPEN versus TPA. Source Data Figure 2—figure supplement 1: ICP-MS data in ppb per cell for cells grown for 24 hr in MM, MM + 2 μM TPA or MM + 3 μm TPA. Source Data Figure 3: CDK2 ratio over time for each track presented in Figure 3B. 321 tracks are presented for each condition. Each track contains 160 frames, where each frame is separated by 12 min. Source Data Figure 5: Quantification of DNA damage. Imaging parameters are presented for each cell in the analysis. Web Reference https://www.who.int/whr/2002/chapter4/en/index3.html. Last accessed July 3, 2019.
Tables
Key resources table
| Reagent type (species) or resource | Designation | Source or reference | Identifiers | Additional information |
|---|---|---|---|---|
| Cell line (Homo sapiens) | MCF10A | ATCC | CRL-10317, RRID:CVCL_0598 | |
| Cell line (Homo sapiens) | MCF10A + PB-NES ZapCV2 and PB-H2B- mCherry (stable) | This paper | ||
| Cell line (Homo sapiens) | MCF10A + DHB-Venus and H2B-mTurqoise (stable) | Laboratory of Sabrina Spencer | PMCID:PMC4001917 | |
| Cell line (Homo sapiens) | MCF10A p21-/- + DHB-Venus and H2B-mTurqoise (stable) | Laboratory of Sabrina Spencer | PMCID:PMC4001917 | |
| Recombinant DNA reagent | PB-NES-ZapCV2 (plasmid used for stable cell line generation) | Published in previous Palmer lab paper PMID: 27959493 | Cytosolic FRET sensor in Piggybac vector | |
| Recombinant DNA reagent | PB-H2B-mCherry (plasmid used for stable cell line generation) | This paper | H2B-mCherry subcloned from H2B-mCherry CSII-EF (PMCID:PMC4001917) into PB510B1 Piggybac vector (System Biosciences) with primers listed below | |
| Sequence-based reagent | Forward primer to subclone H2B-mCherry into PB plasmid (PB510B1, System Biosciences) | IDT | 5’-GGAATT GAATTCGCT ACCGGTCTC GAGAC-3’ (EcoRI site for cloning) | |
| Sequence-based reagent | Reverse primer to subclone H2B-mCherry into PB plasmid (PB510B1, System Biosciences) | IDT | 5’-GATTAT GATCTAGAG TCGCGG CCGCCT G-3’ (NotI site for cloning) | |
| Antibody | Anti-Phospho-Rb Ser 807/811 (rabbit monoclonal) | Cell Signalling Technology | D20B12 XP, Lot8, RRID:AB_11178658 | 1:500 (FACS) 1:100 (IF) |
| Antibody | Anti-p21 Waf1/Cip1 (rabbit monoclonal) | Cell Signalling Technology | 2947S, Lot 10, RRID:AB_823586 | 1:200 (IF) |
| Antibody | Anti-53BP1 (mouse monoclonal) | BD Biosciences | 612523, Lot 6217571, RRID:AB_399824 | 1:200 (IF) |
| Antibody | Anti-RPA2 (mouse monoclonal) | Abcam | Abcam, ab2175, Lot GR3224197-5), RRID:AB_302873 | 1:250 (IF) |
| Antibody | AlexaFluor 488 (donkey anti rabbit) | Abcam | ab150073, Lot GR328726-1, RRID:AB_2636877 | 1:500 for pRb (FACS) |
| Antibody | AlexaFluor 488 (goat anti mouse) | Thermo Fisher Scientific | A11029, Lot 1789729,RRID:AB_138404 | 1:500 for 53BP1 and RPA2 (IF) |
| Antibody | AlexaFluor 647 (goat anti rabbit) | Thermo Fisher Scientific | A21244, Lot 1156625, RRID:AB_141663 | 1:500 for pRb (IF) |
| Antibody | AlexaFluor 568 (donkey anti rabbit) | Thermo Fisher Scientific | A10042, Lot 1134929, RRID:AB_2534017 | 1:500 for p21 in (IF) |
| Commercial assay or kit | Click-IT EdU AlexaFluor 647 HCS Assay | Thermo Fisher Scientific | C10356 | |
| Commercial assay or kit | FxyCycle PI/RNase Staining Solution | Thermo Fisher Scientific | F10797 | |
| Chemical compound, drug | TRIS(2-PYRIDYLMETHYL)AMINE 98% (TPA) | Sigma-Aldrich | 723134 | |
| Chemical compound, drug | N,N,N′,N′-Tetrakis(2-pyridylmethyl)ethylenediamine (TPEN) | Sigma-Aldrich | P4413 | |
| Chemical compound, drug | Zinc chloride, anhydrous, 99.95% (metals basis) | Alfa Aesar | 87900 | |
| Chemical compound, drug | Chelex-100, sodium form | Sigma-Aldrch | C7901 | |
| Chemical compound, drug | Neocuproine hydrochloride Monohydrate | Fluka | 72090 | |
| CF4 | Copper-Fluor-4 | Christopher Chang Lab | PMCID: PMC6008210 | |
| Software | BD FACSDiva | BD Biosciences | Version 8 | |
| Software | MATLAB | Mathworks | V R2017b VR2018a | |
| Software | KaleidaGraph | Synergy | Version 4.02 | |
| Software | Prism | GraphPad Software | Version 8.2.0 | |
| Other (Code) | Cell segmentation and tracking pipeline generated in Matlab | Desposited: https://biof-git.colorado.edu/biofrontiers-imaging/palmer-zinc-cell-cycle | ||
| Other | Hoechst 33258 | Sigma-Aldrich | 861405 | Used at 0.1 µg/mL in PBS |
Additional files
-
Transparent reporting form
- https://cdn.elifesciences.org/articles/51107/elife-51107-transrepform-v1.docx
-
Supplementary file 1
Detailed protocol for cell segmentation, tracking, and analysis in MatLab.
- https://cdn.elifesciences.org/articles/51107/elife-51107-supp1-v1.pdf
Download links
A two-part list of links to download the article, or parts of the article, in various formats.
Downloads (link to download the article as PDF)
Open citations (links to open the citations from this article in various online reference manager services)
Cite this article (links to download the citations from this article in formats compatible with various reference manager tools)
Single cell analysis reveals multiple requirements for zinc in the mammalian cell cycle
eLife 9:e51107.
https://doi.org/10.7554/eLife.51107


