Diversification of the Caenorhabditis heat shock response by Helitron transposable elements
- University of California, San Diego, United States
Figures
Figure 1 with 1 supplement
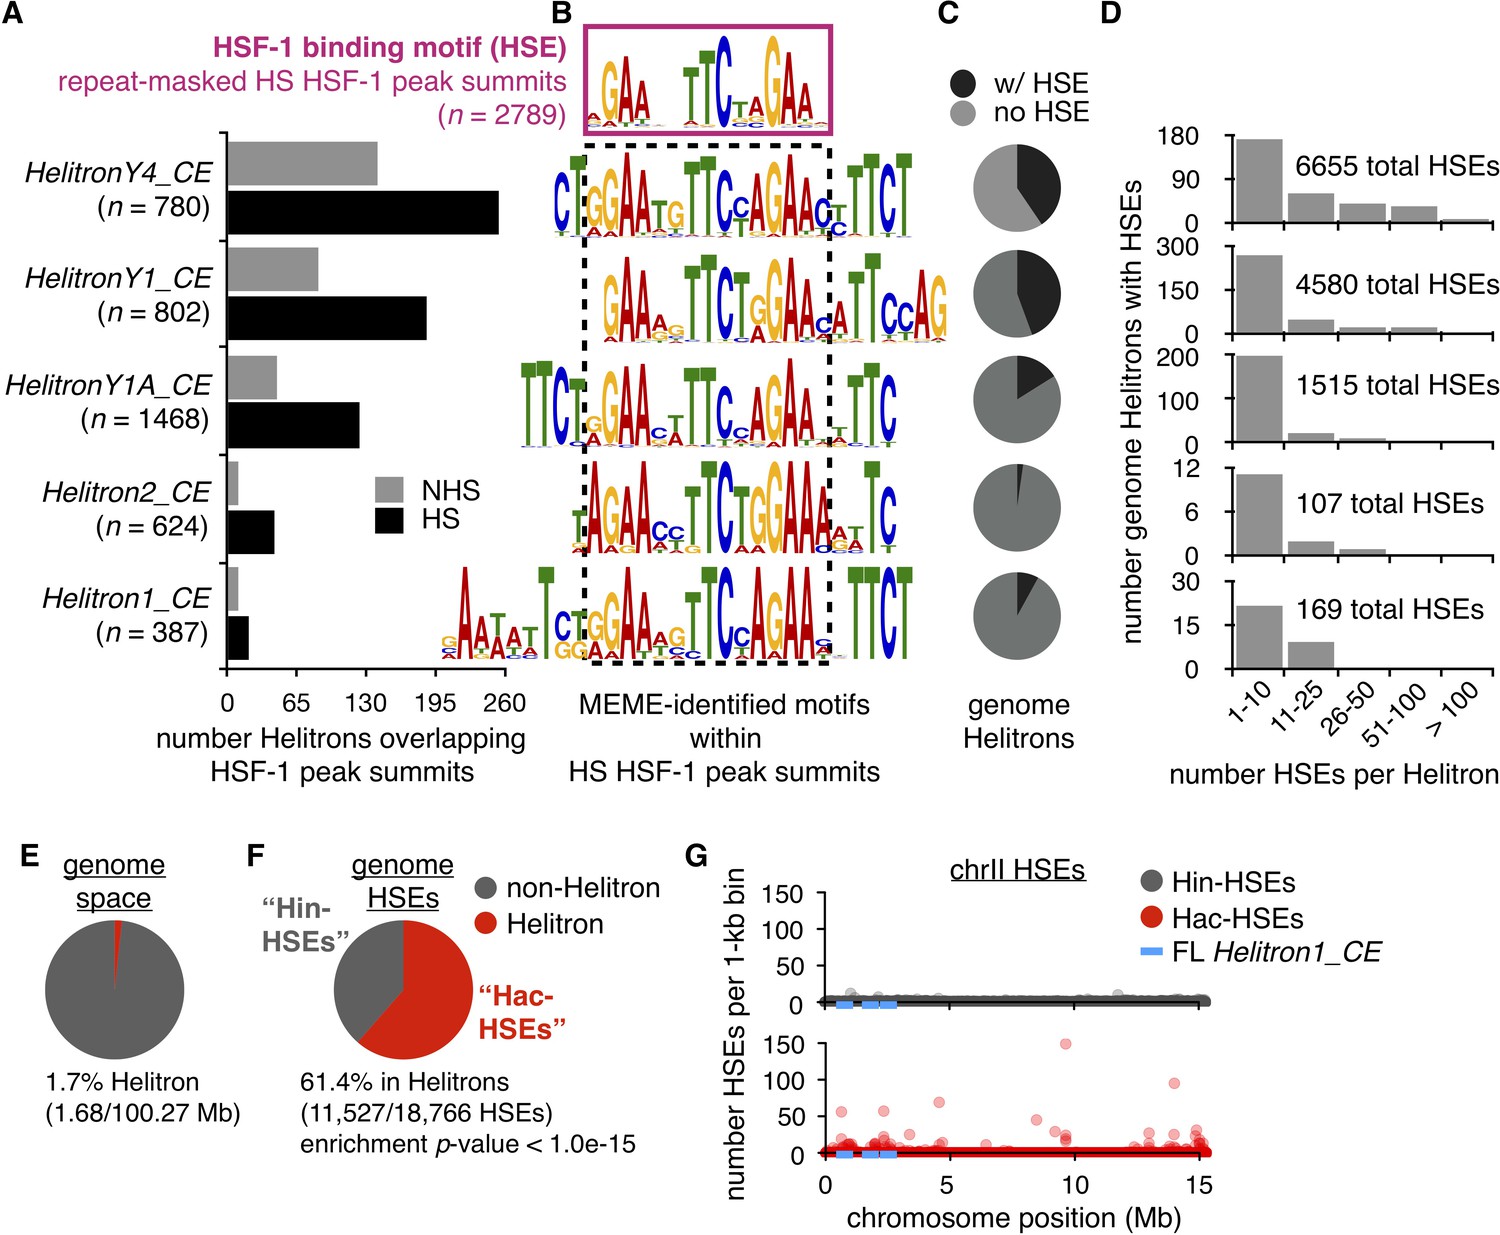
Helitrons contribute a significant number of HSEs to the C. elegans genome.
(A) Number of Helitrons that overlap with 101 bp regions centered around HSF-1 peak summits (ChIP-seq data from Li et al. (2016); peaks called using MACS2, Zhang et al., 2008) in non-heat shock (NHS) and heat shock (HS) conditions. Helitron coordinates were obtained from the RepeatMasker track downloaded from the UCSC Genome Browser (genome assembly ce11, Kent et al., 2002). (B) De novo motifs extracted from 101 bp regions centered around HS HSF-1 peak summits using MEME (Bailey and Elkan, 1994). The HSE motif extracted from all repeat-masked HS HSF-1 peak summits is boxed with a solid purple line, while HSE-like motifs found within non-repeat-masked summits that overlap with Helitrons are boxed with a dashed black line. For repeat-masked HSF-1 peak summits, the displayed HSE motif is the most significant motif found. For Helitron-overlapping summits, displayed HSE-like motifs are within the top 10 significant motifs identified and are significantly similar to the HSE motif extracted from repeat-masked summits using the Tomtom motif comparison tool (q-value <1.0e-03) (Gupta et al., 2007). (C) Pie chart displaying the proportions of all genomic Helitrons in which HSEs are present (black) or absent (gray). HSEs were identified by scanning the genome with FIMO (q-value <0.05) (Grant et al., 2011) using MEME-derived output from repeat-masked HSF-1 peak summits. (D) Histograms displaying binned numbers of HSEs within all HSE-containing Helitrons found in the genome. Total numbers of HSEs that reside within each Helitron type are also shown. (E) Pie chart displaying the proportion of the C. elegans genome that is annotated as Helitron (red) or not (gray). (F) Pie chart displaying the number of HSEs in the C. elegans genome that reside within (red, hereafter referred to as Hac-HSEs) or outside of (gray, hereafter referred to as Hin-HSEs) annotated Helitrons. HSEs are significantly enriched within Helitron sequences (p<1.0e-15, binomial test). (G) Numbers of Hin- (gray) and Hac-HSEs (red) within 1 kb bins along the length of chromosome II (chrII). The approximate positions of full-length (FL) Helitron1_CE elements are shown using blue lines.
Figure 1—figure supplement 1
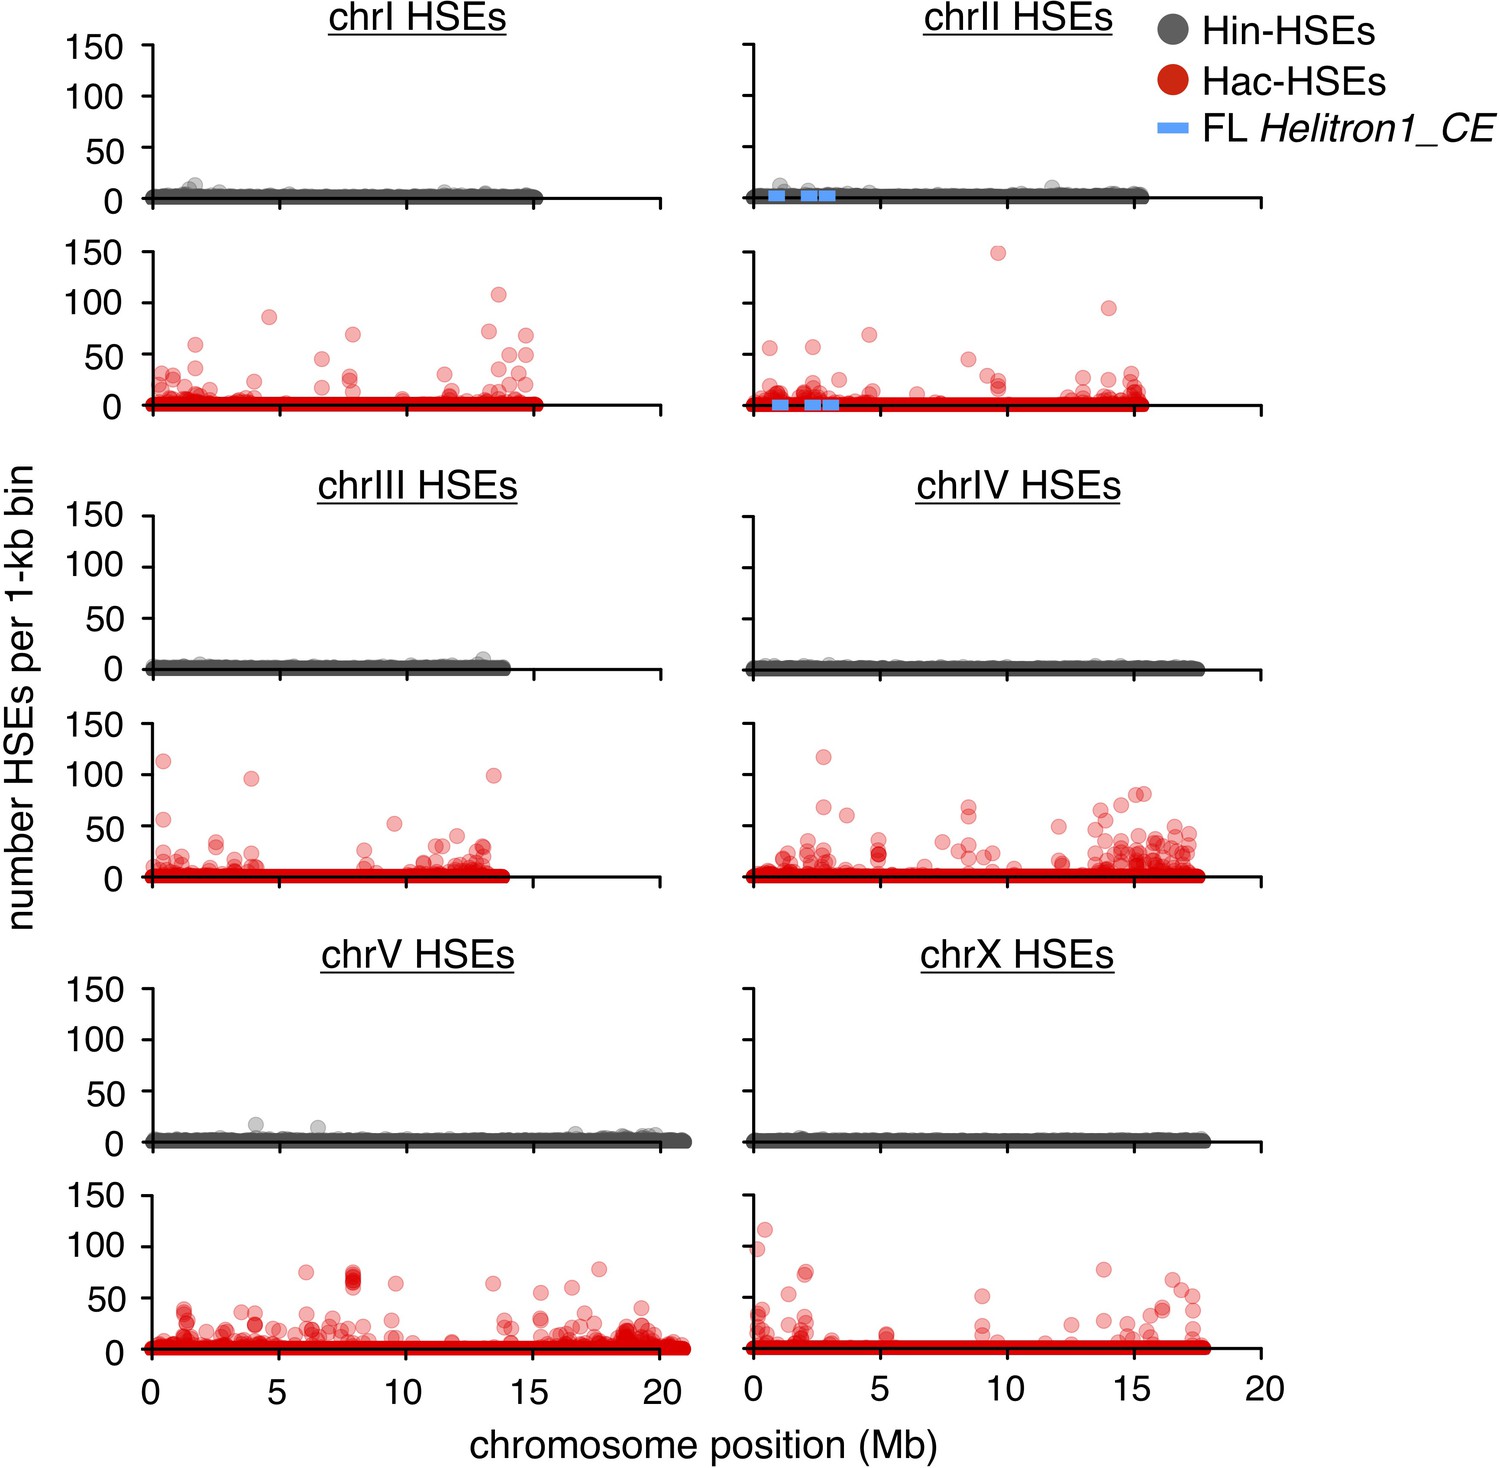
Genome-wide distributions of Hin- and Hac-HSEs.
Numbers of Hin- (gray) and Hac-HSEs (red) within 1 kb bins along the length of each C. elegans chromosome. The approximate positions of full-length (FL) Helitron1_CE elements are shown using blue lines.
Figure 2 with 1 supplement
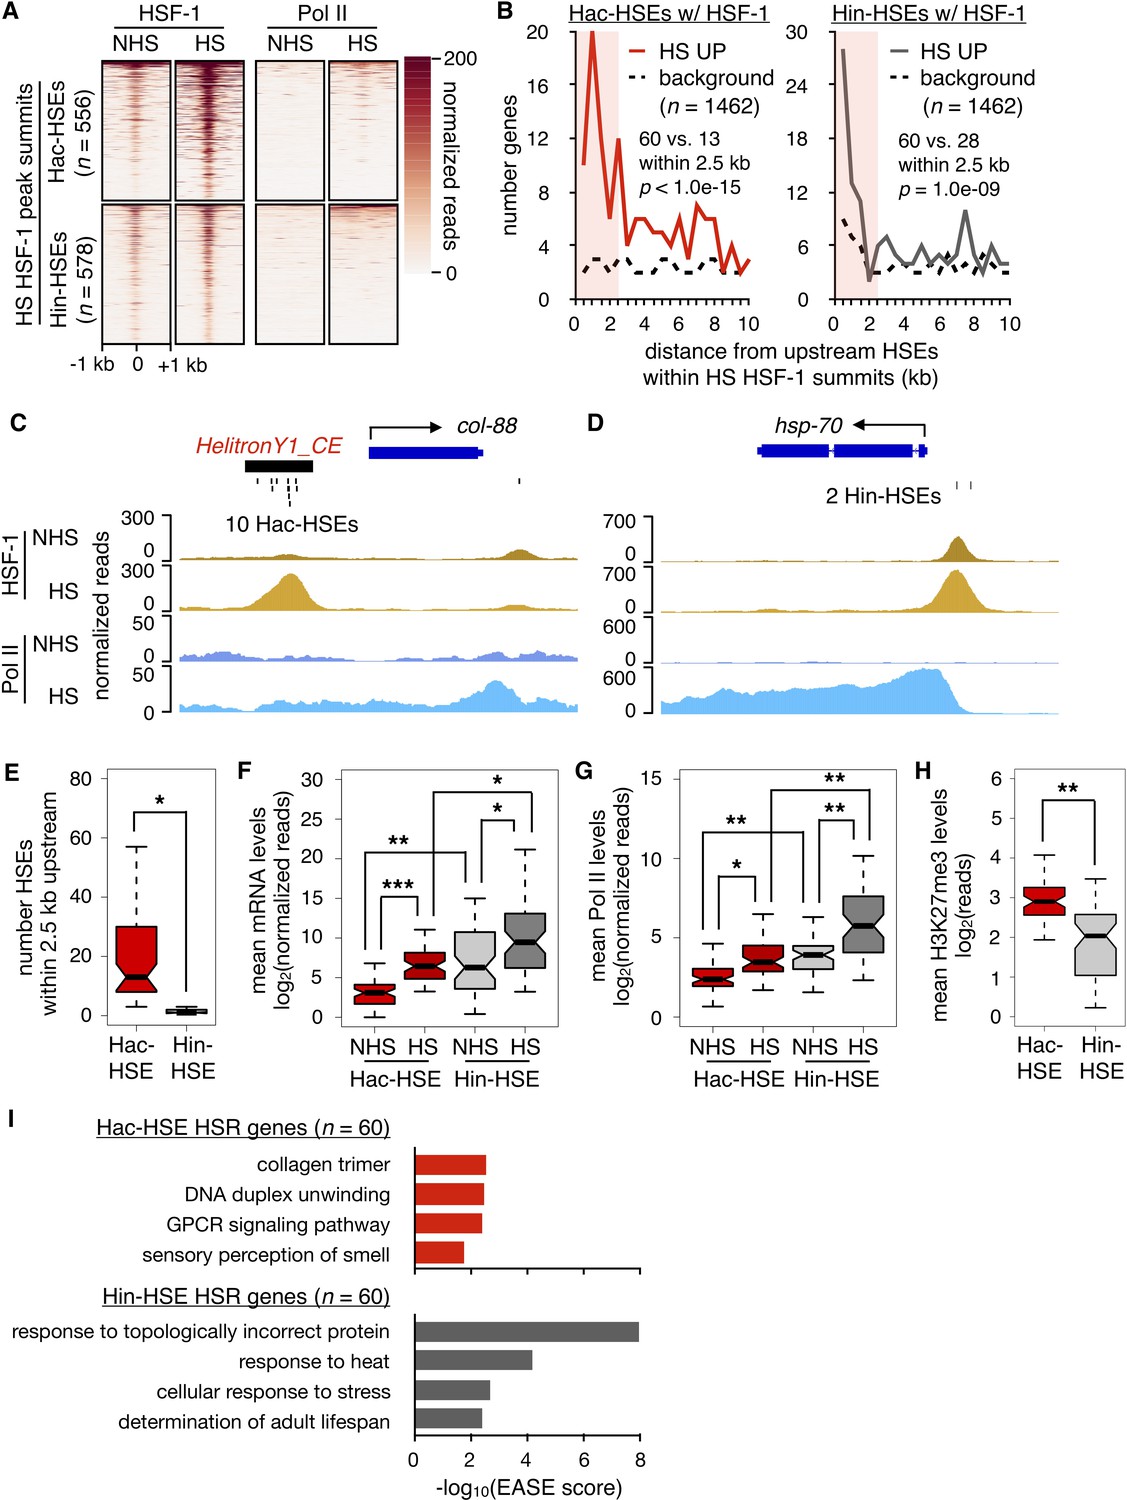
HSR genes with adjacent Hac- or Hin-HSEs display different properties.
(A) Heatmap displaying normalized (see Materials and methods for details) HSF-1 and Pol II ChIP-seq reads over 2 kb regions centered on Hac-HSE- and Hin-HSE-containing HS HSF-1 peak summits. ChIP data are from Li et al. (2016). (B) Number of genes within 500 bp bins versus distance from upstream Hac- and Hin-HSEs that reside within HS HSF-1 peak summits. HS UP genes (n = 1462) are those with a fold change after HS >2 and an adjusted p-value<0.01 determined using DESeq2 (Love et al., 2014). For Hac-HSEs, 60 HS UP (red solid line) vs. 13 background (black dashed line) genes reside within 2.5 kb, resulting in a significant enrichment (p<1.0e-15, χ2 test). For Hin-HSEs, 60 HS UP (gray solid line) vs. 28 background (black dashed line) genes reside within 2.5 kb, resulting in a significant enrichment (p=1.0e-09, χ2 test). HS UP genes that have HSEs within HSF-1 peak summits less than 2.5 kb upstream from annotated transcriptional start sites are considered to be part of the heat-shock response (HSR genes). (C) Genome browser screenshot of normalized HSF-1 (goldenrod) and Pol II (blue) ChIP-seq reads (note scale differences) in the vicinity of the Hac-HSE HSR gene col-88. The 10 Hac-HSEs located within the HelitronY1_CE sequence found in the upstream promoter region are shown. (D) Genome browser screenshot of normalized HSF-1 and Pol II ChIP-seq reads (note scale differences) in the vicinity of the Hin-HSE HSR gene hsp-70. The two Hin-HSEs located in the upstream promoter region are shown below the gene structure. (E) Notched boxplot showing distributions of the number of HSEs located within 2.5 kb upstream of Hac- (red, n = 60) or Hin-HSE (gray, n = 60) HSR genes. Notches represent 95% confidence intervals of the median. (F) Notched boxplot showing distributions of DESeq2-normalized steady-state mRNA levels during NHS and HS conditions for Hac- or Hin-HSE HSR genes. As some Hac-HSE HSR genes were undetectable under NHS conditions, a single read was added to all genes to allow for log transformation. (G) Notched boxplot showing distributions of normalized Pol II ChIP-seq reads obtained during NHS and HS conditions over Hac- or Hin-HSE HSR gene bodies. (H) Notched boxplot showing distributions of H3K27me3 ChIP-seq reads using publicly available data obtained from L3 stage worms during NHS conditions (Ho et al., 2014) over Hac- or Hin-HSE HSR gene bodies. H3K27me3 data were obtained from the modMine database (intermine.modencode.org) (Contrino et al., 2012) under accession number modEncode_5051. For panels E-H, a single asterisk represents p<1.0e-04, double asterisks represent p<1.0e-08, and triple asterisks represent p<1.0e-12 (Welch Two Sample t-test). (I) Significantly enriched gene ontology (GO) terms identified using DAVID (Huang et al., 2009a; Huang et al., 2009b) for Hac-HSE (red) and Hin-HSE (gray) HSR genes.
Figure 2—figure supplement 1
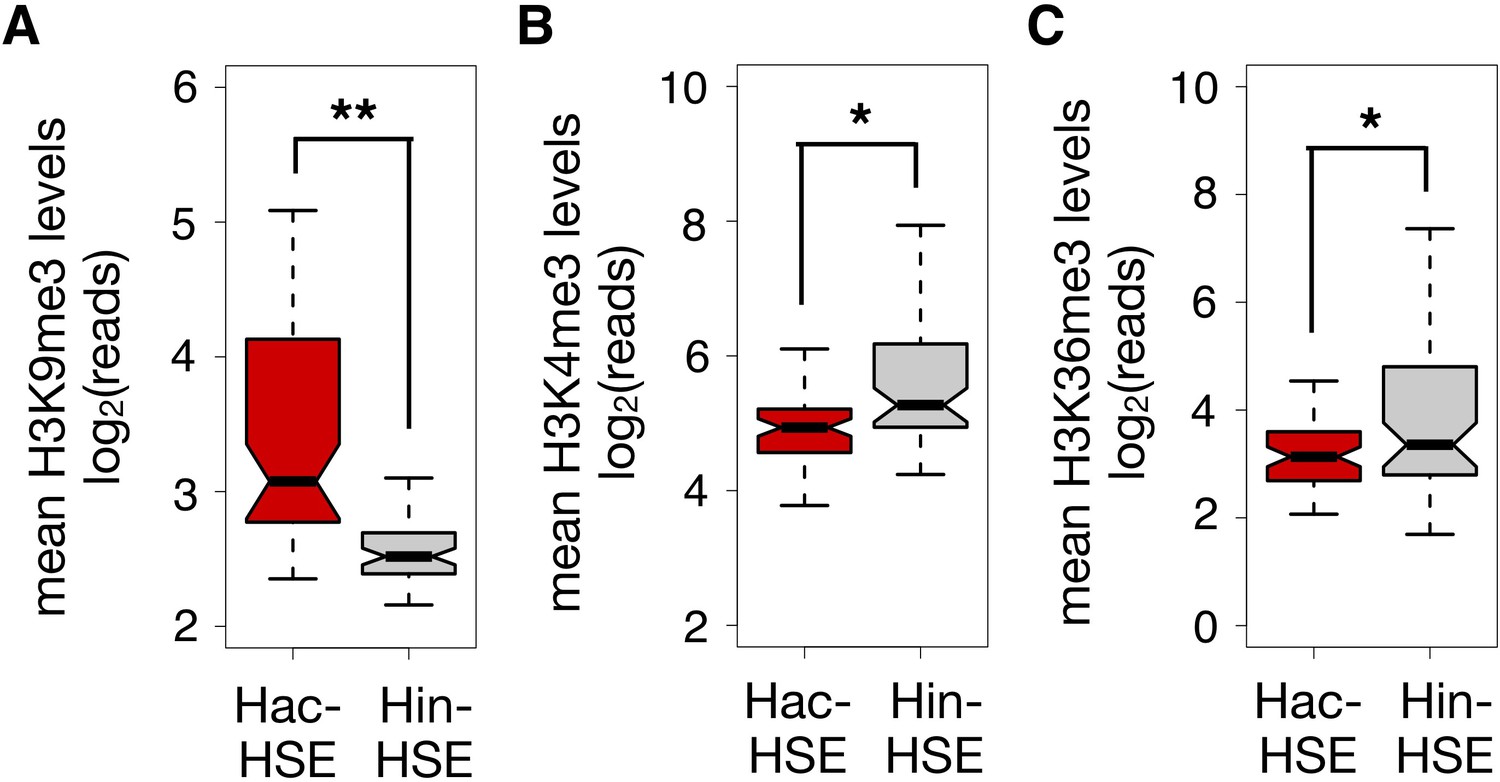
HSR genes with adjacent Hac- or Hin-HSEs display different levels of histone modifications associated with gene expression or repression.
(A) Notched boxplot showing distributions of H3K9me3 ChIP-seq reads using publicly available data obtained from L3 stage worms during NHS conditions (Ho et al., 2014) over Hac- or Hin-HSE HSR gene bodies. H3K9me3 data were obtained from the modMine database (intermine.modencode.org) (Contrino et al., 2012) under accession number modEncode_5040. (B) Notched boxplot showing distributions of H3K4me3 ChIP-seq reads using publicly available data obtained from L3 stage worms during NHS conditions (Ho et al., 2014) over Hac- or Hin-HSE HSR gene 5’ regions (1 kb windows centered on annotated transcriptional start sites). H3K4me3 data were obtained from the modMine database under accession number modEncode_3576. (C) Notched boxplot showing distributions of H3K36me3 ChIP-seq reads using publicly available data obtained from L3 stage worms during NHS conditions (Ho et al., 2014) over Hac- or Hin-HSE HSR gene bodies. H3K36me3 data were obtained from the modMine database under accession number modEncode_3563. For panels A-C, a single asterisk represents p<0.01, and double asterisks represent p<1.0e-06 (Welch Two Sample t-test).
Figure 3
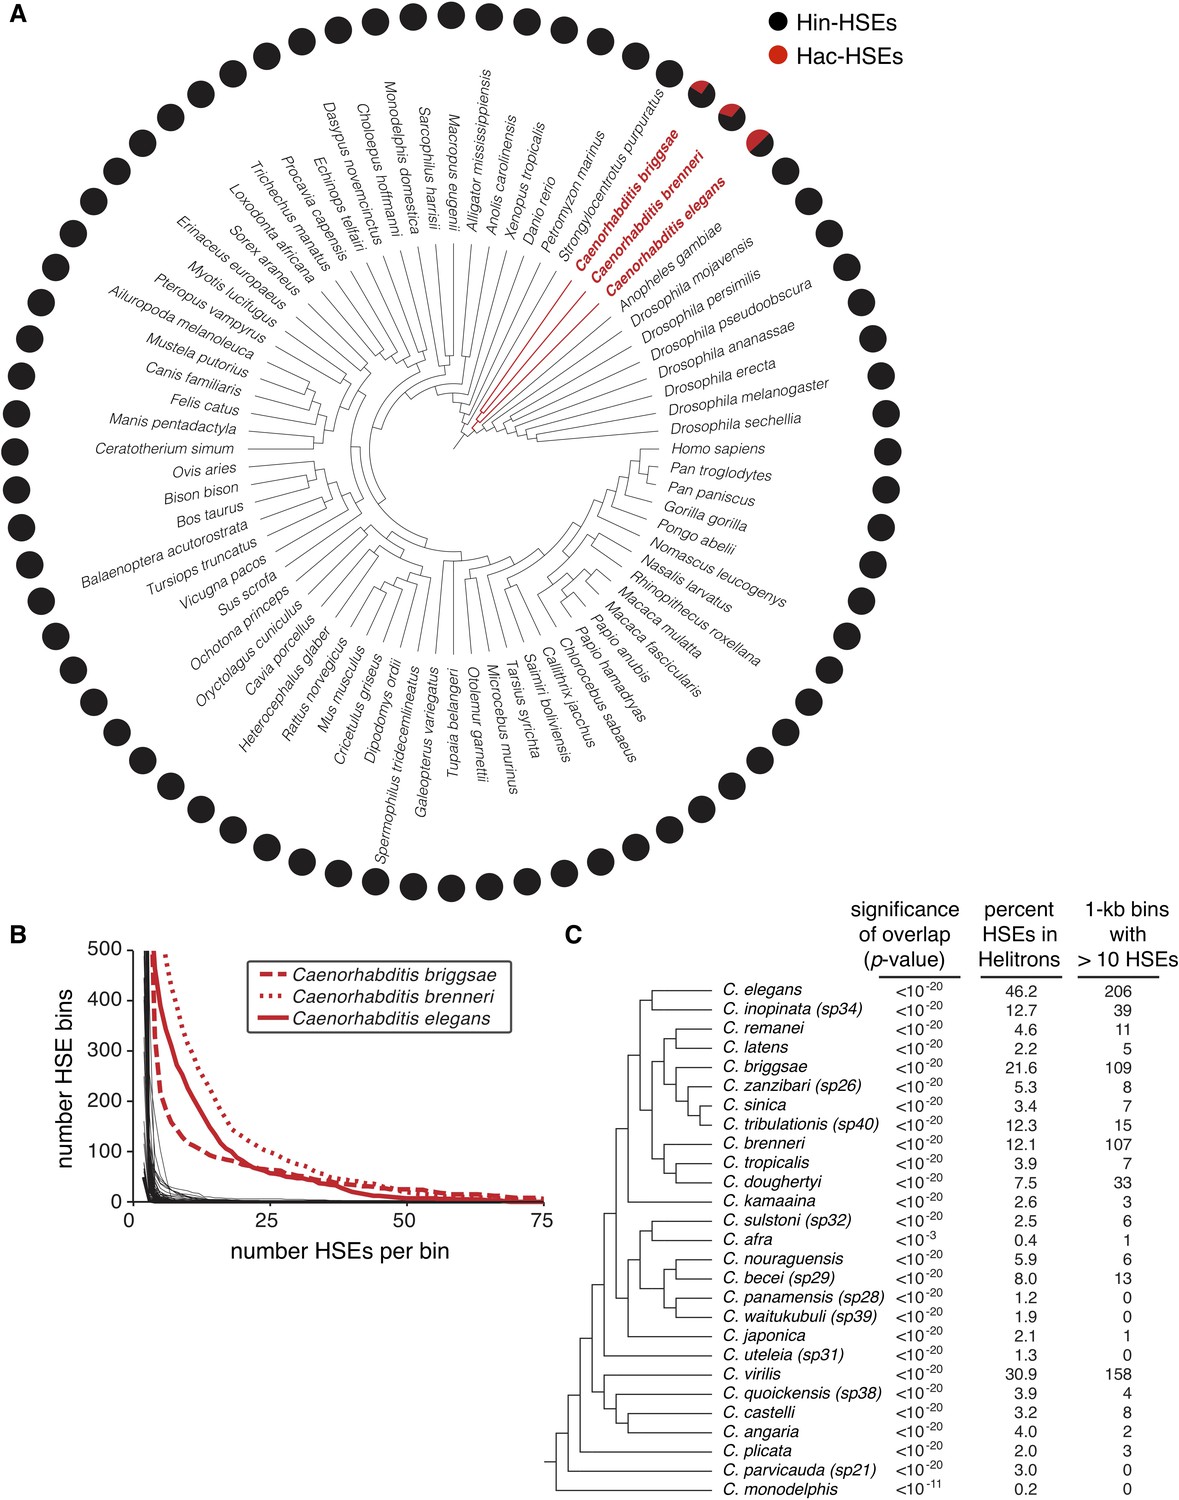
Helitrons contribute significant numbers of HSEs to other Caenorhabditis genomes.
(A) Phylogeny of all metazoan genomes hosted at the UCSC genome browser (genome.ucsc.edu) that have RepeatMasker-generated annotations of repetitive elements (see Supplementary file 5 for genome assembly IDs). Adjacent pie charts display the proportion of total HSEs that reside within (red) or outside of (gray) annotated Helitrons. To prevent possible species-specific biases found in HSEs from influencing our results, we scanned for HSEs using the canonical species-independent sequence NGAANNTCCNNGGAN and its reverse complement (Perisic et al., 1989). Names of species with significant HSE-Helitron overlap (cumulative binomial distribution with p-value<0.001, see Supplementary file 5) are highlighted in red. (B) Cumulative distribution analysis of the density of HSEs for the genomes shown in panel A. The number of HSEs per 1 kb window (bin) in each genome was determined. Curves are plotted as the number of bins with a value that is greater than or equal to the indicated numbers of HSEs per bin. The three Caenorhabditis genomes that show numerous 1 kb windows with large numbers of HSEs per bin are highlighted in red. (C) Phylogeny of species hosted at the Caenorhabditis Genomes Project (http://www.caenorhabditis.org) that have RepeatMasker-generated annotations of repetitive elements (see Supplementary file 6 for genome assembly IDs). Next to each species name is the statistical significance of HSE/Helitron overlap (cumulative binomial probability), proportion of total HSEs found to overlap with Helitrons, and number of 1 kb windows with greater than 10 HSEs per window. Complete data are found in Supplementary file 6.
Figure 4
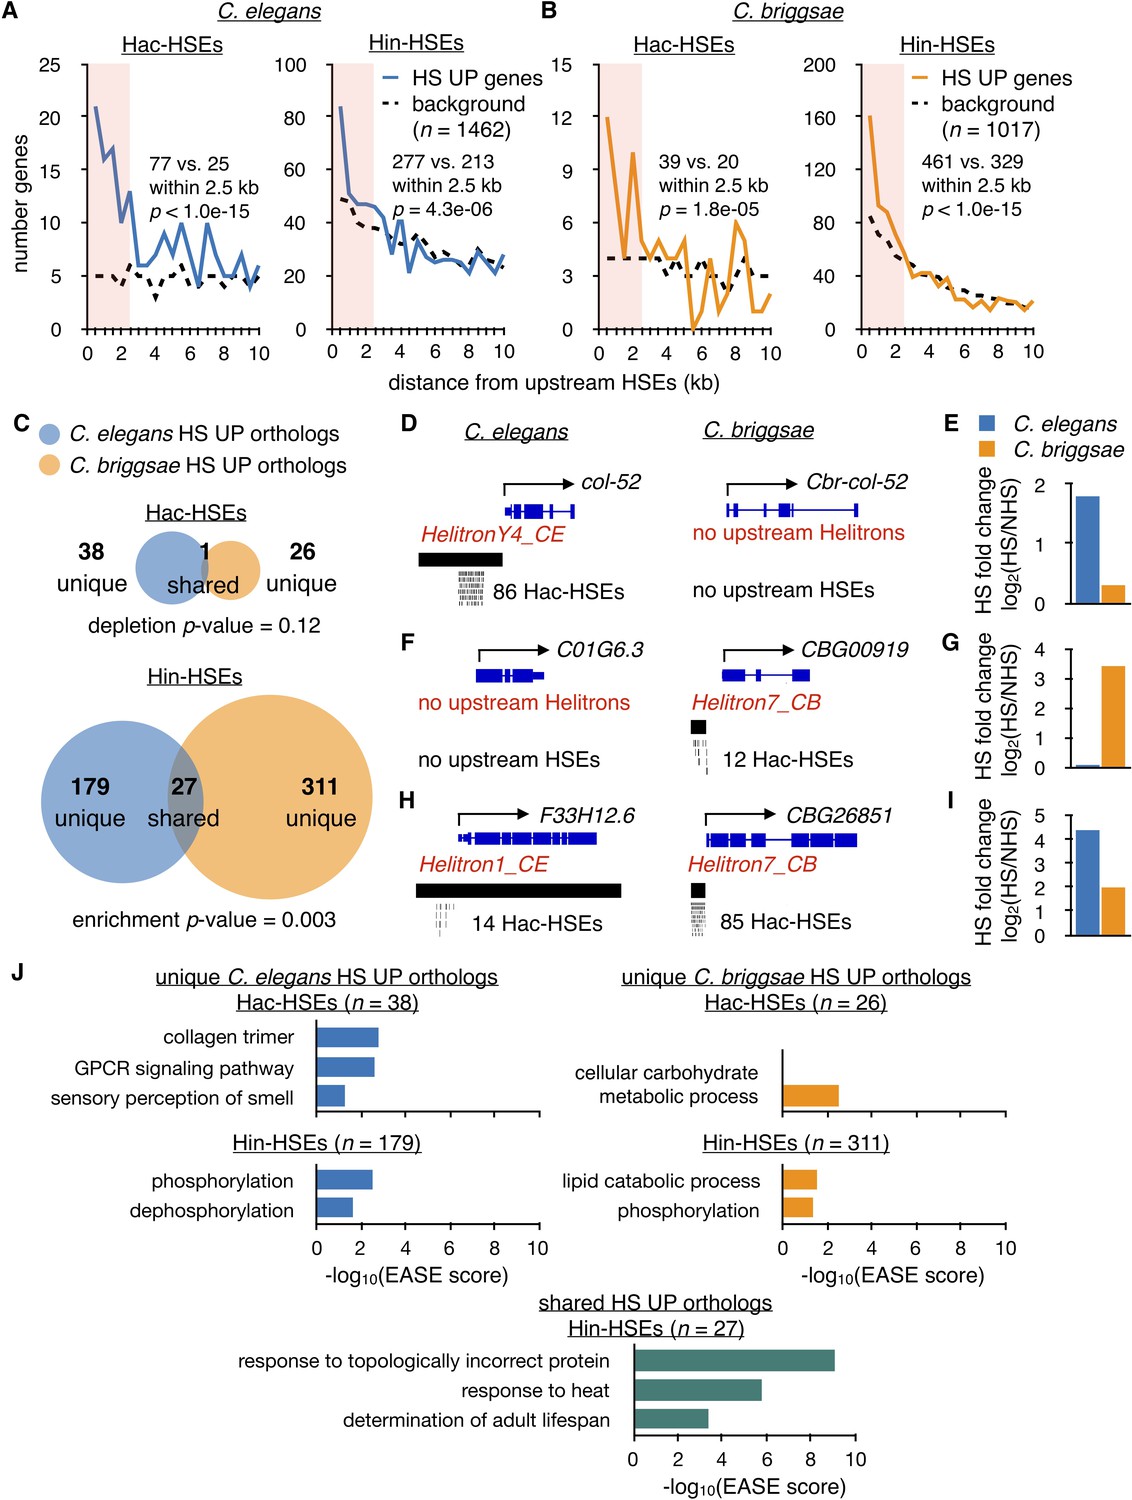
Hac-HSEs are associated with distinct gene sets up-regulated by HS in C. elegans and C. briggsae.
(A) Number of C. elegans HS UP genes (n = 1462) within 500 bp bins vs. distance from Hac- and Hin-HSEs. HS UP genes are defined as those with a fold change after HS >2 and an adjusted p-value<0.01 determined using DESeq2 (Love et al., 2014). Solid blue lines represent numbers of HS UP genes observed, while black dashed lines represent background numbers resulting from chance. Seventy-seven HS UP vs. 25 expected genes have Hac-HSEs within 2.5 kb upstream, resulting in significant enrichment (p<1.0e-15, χ2 test). Two hundred and seventy-seven HS UP vs. 213 expected genes have Hin-HSEs within 2.5 kb upstream, resulting in significant enrichment (p=4.3 e-06, χ2 test) (B) Number of C. briggsae HS UP genes (n = 1017) within 500 bp bins vs. distance from Hac- and Hin-HSEs. Solid orange lines represent numbers of HS UP genes observed, while dashed black lines represent background numbers resulting from chance. Thirty-nine HS UP vs. 20 background genes have Hac-HSEs within 2.5 kb upstream, resulting in significant enrichment (p=1.8e-05, χ2 test). Four hundred and sixty-one HS UP vs. 329 background genes have Hin-HSEs within 2.5 kb upstream, resulting in significant enrichment (p<1.0e-15, χ2 test). (C) Venn diagrams showing overlap of orthologous HS UP genes in C. elegans (blue) and C. briggsae (orange) that have Hac- or Hin-HSEs within 2.5 kb upstream in both species. Unique HS UP orthologs have upstream HSEs in either C. elegans or C. briggsae, while shared HS UP orthologs have upstream HSEs in both species. There is significant enrichment in the overlap of C. elegans Hin-HSE genes with C. briggsae orthologs up-regulated after HS (p=0.003, hypergeometric test). (D) Genome browser screenshots of C. elegans col-52 and its C. briggsae ortholog Cbr-col-52. C. elegans col-52 has 86 upstream Hac-HSEs supplied by a copy of HelitronY4_CE and Cbr-col-52 lacks upstream Hac-HSEs. (E) HS fold-change values for C. elegans col-52 (blue) (3.5 fold) and C. briggsae Cbr-col-52 (orange) (1.2 fold) determined using DESeq2. (F) Genome browser screenshots of C. elegans C01G6.3 and its C. briggsae ortholog CBG00919. C01G6.3 lacks upstream Hac-HSEs and CBG00919 has 12 Hac-HSEs provided by a copy of Helitron7_CB. (G) HS fold-change values for C. elegans C01G6.3 (blue) (1.1 fold) and C. briggsae CBG00919 (orange) (11 fold) determined using DESeq2. (H) Genome browser screenshots of C. elegans F33H12.6 and its C. briggsae ortholog CBG26851. F33H12.6 resides within a full-length copy of Helitron1_CE and has 14 upstream Hac-HSEs. CBG26851 has 85 upstream Hac-HSEs supplied by a copy of Helitron7_CB. (I) HS fold-change values for C. elegans F33H12.6 (blue) (21 fold) and C. briggsae CBG26851 (orange) (4.0 fold) determined using DESeq2. (J) Significantly-enriched gene ontology (GO) terms identified using DAVID (Huang et al., 2009a; Huang et al., 2009b) for unique Hac- and Hin-HSE up-regulated orthologs in C. elegans (blue) and C. briggsae (orange), as well as shared Hin-HSE up-regulated orthologs (aquamarine).
Figure 5
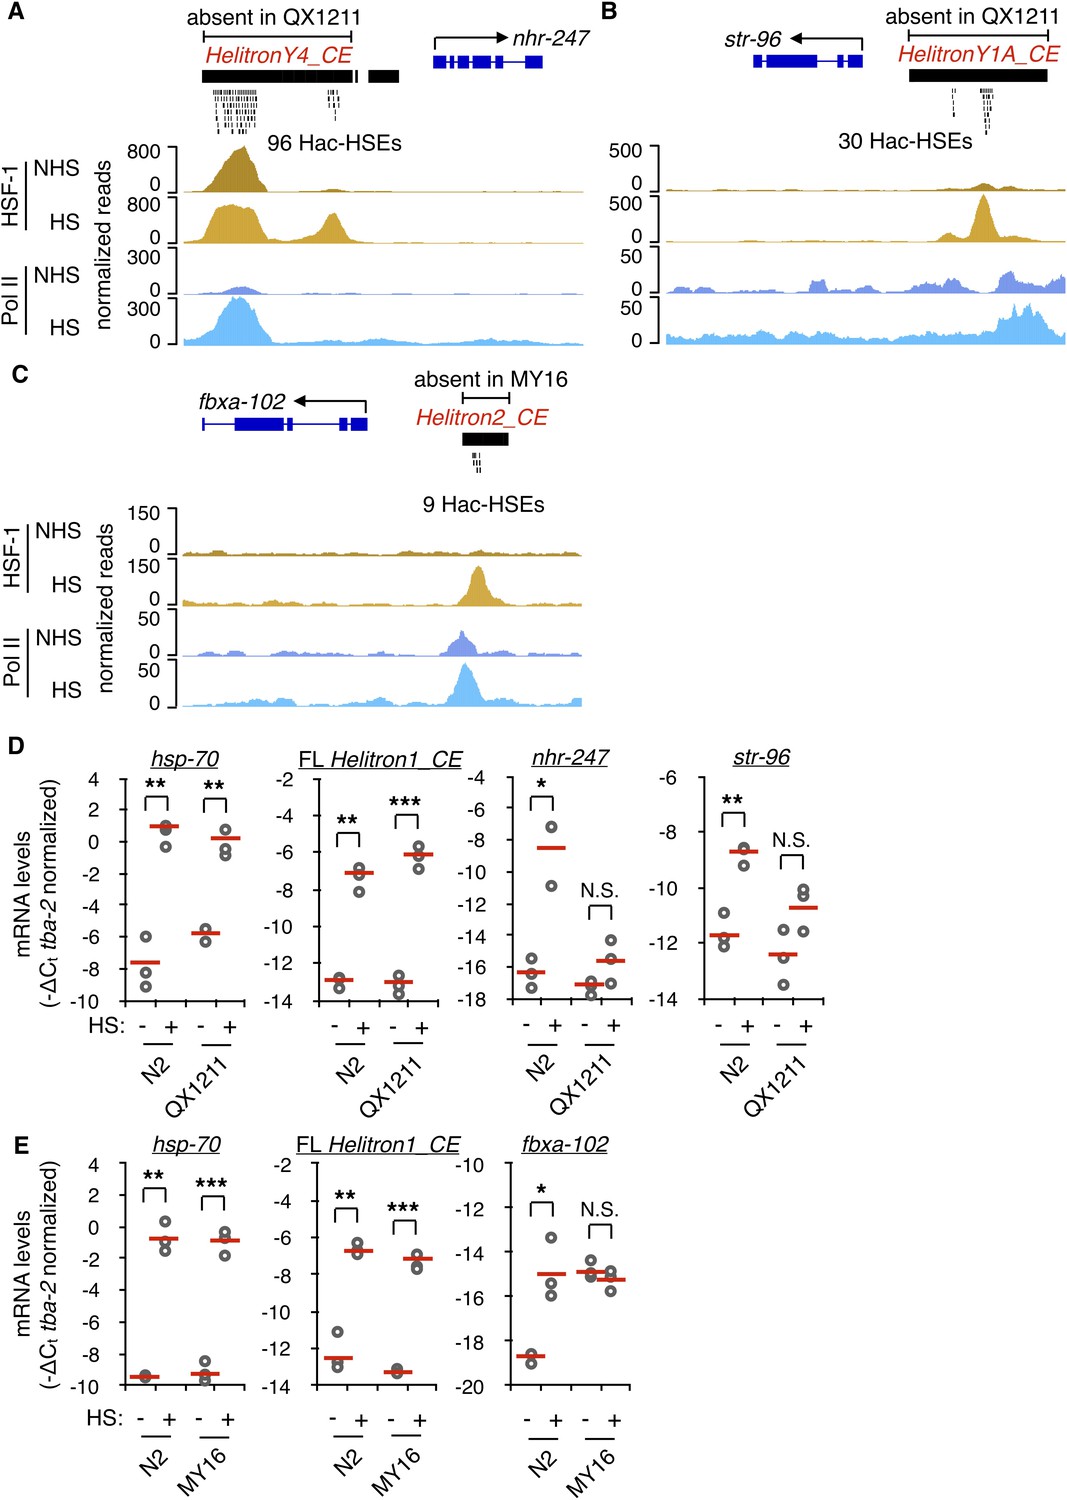
Hac-HSEs diversify the HSR in C. elegans.
(A) Genome browser screenshot depicting the region surrounding the Hac-HSE HSR gene nhr-247 showing normalized ChIP-seq signal for HSF-1 and Pol II under NHS and HS conditions (ChIP-seq data obtained from Li et al., 2016). HelitronY4_CE sequence containing 96 Hac-HSEs is located upstream of nhr-247 in the wild-type reference strain N2, but is absent in the wild isolate QX1211. (B) Genome browser screenshot depicting the region surrounding the Hac-HSE HSR gene str-96 showing normalized ChIP-seq signal for HSF-1 and Pol II under NHS and HS conditions. HelitronY1A_CE sequence containing 30 Hac-HSEs is located upstream of str-96 in the wild-type reference strain N2, but is absent in the wild isolate QX1211. (C) Genome browser screenshot depicting the region surrounding the Hac-HSE HSR gene fbxa-102 showing normalized ChIP-seq signal for HSF-1 and Pol II under NHS and HS conditions. Helitron2_CE sequence containing nine Hac-HSEs is located upstream of fbxa-102 in the wild-type reference strain N2, but is absent in the wild isolate MY16. (D) Scatterplots showing relative mRNA expression levels (-ΔCt) determined using RT-qPCR (gray open circles) of nhr-247 and str-96 before (NHS) and after heat shock (HS) in N2 worms that have and QX1211 worms that lack upstream Hac-HSEs. Expression levels of the Hin-HSE HSR gene hsp-70 and Helitron1_CE transposase are also shown. RT-qPCR data are normalized to the heat-shock-unchanging housekeeping gene tba-2. Data obtained from three independent biological replicates are shown, with their mean values represented using solid red lines. (E) Scatterplots showing relative mRNA expression levels (-ΔCt) determined using RT-qPCR (gray open circles) of fbxa-102 before (NHS) and after heat shock (HS) in N2 worms that have and MY16 worms that lack upstream Hac-HSEs. Expression levels of the Hin-HSE HSR gene hsp-70 and Helitron1_CE transposase are also shown. RT-qPCR data are normalized to the heat-shock-unchanging housekeeping gene tba-2. Data obtained from three independent biological replicates are shown, with their mean values represented using solid red lines. In N2 NHS worms, fbxa-102 was undetectable in one biological replicate. For panels D-E, a single asterisk represents p<0.05, double asterisks represent p<0.01, and triple asterisks represent p<0.001 (Welch Two Sample t-test). For all genes with the exception of Helitron1_CE transposase, one primer in each qPCR primer pair spans an exon-exon junction to ensure detection of mature mRNA levels.
Tables
Key resources table
| Reagent type (species) or resource | Designation | Source or reference | Identifiers | Additional information |
|---|---|---|---|---|
| Genetic reagent (C. elegans) | N2 | wild-type strain | ||
| Genetic reagent (C. elegans) | QX1211 | Wild isolate | ||
| Genetic reagent (C. elegans) | MY16 | Wild isolate | ||
| Genetic reagent (C. briggsae) | AF16 | wild-type strain | ||
| Commercial assay or kit | Illumina TruSeq Stranded Total RNA Library Prep Gold Kit | Illumina | Illumina: 20020598 | |
| Software, algorithm | FigTree v1.4.4 | http://tree.bio.ed.ac.uk/software/figtree/ | ||
| Software, algorithm | Bowtie2 v2.3.3.1 | Langmead and Salzberg, 2012 | Sequence alignment | |
| Software, algorithm | MEME v5.0.3 | Bailey and Elkan, 1994 | Motif finder | |
| Software, algorithm | Tomtom v5.0.2 | Gupta et al., 2007 | Motif comparison | |
| Software, algorithm | Cistrome | Liu et al., 2011 | Generation of heat maps | |
| Software, algorithm | DESeq2 v1.18.1 | Love et al., 2014 | Differential expression analysis of RNA-seq | |
| Software, algorithm | Delly v0.8.1 | Rausch et al., 2012 | Genome comparisons | |
| Software, algorithm | bcftools v1.9 | Narasimhan et al., 2016 | Genome comparisons |
Additional files
-
Supplementary file 1
Transcription Factor motifs in Helitrons.
Enrichment of Transcription Factor motifs found within C. elegans Helitrons compared to genome-wide occurences.
- https://cdn.elifesciences.org/articles/51139/elife-51139-supp1-v2.xlsx
-
Supplementary file 2
Heat shock-induced gene expression of L2 stage N2 C. elegans.
RNA-seq results showing fold change in gene expression of C. elegans subjected to heat shock at 34°C versus control animals at 20°C for 30 min.
- https://cdn.elifesciences.org/articles/51139/elife-51139-supp2-v2.xlsx
-
Supplementary file 3
C. elegans Hin-HSE genes up-regulated by heat shock.
List of HSR genes containing Helitron independent HSEs (Hin-HSEs) bound by HSF-1.
- https://cdn.elifesciences.org/articles/51139/elife-51139-supp3-v2.xlsx
-
Supplementary file 4
C. elegans Hac-HSE genes up-regulated by heat shock.
List of HSR genes containing Helitron acquired HSEs (Hac-HSEs) bound by HSF-1.
- https://cdn.elifesciences.org/articles/51139/elife-51139-supp4-v2.xlsx
-
Supplementary file 5
Presence of HSEs in Helitrons across species.
Analysis of HSEs located within annotated Helitrons for species available at the UCSC Genome Browser.
- https://cdn.elifesciences.org/articles/51139/elife-51139-supp5-v2.xlsx
-
Supplementary file 6
Presence of HSEs in Helitrons in Caenorhabditis genomes.
Analysis of HSEs located within annotated Helitrons for species available through the Caenorhabditis Genome Project.
- https://cdn.elifesciences.org/articles/51139/elife-51139-supp6-v2.xlsx
-
Supplementary file 7
Heat shock-induced gene expression of L2 stage AF16 C. briggsae.
RNA-seq results showing fold change in gene expression of C. briggsae subjected to heat shock at 34°C versus control animals at 20°C for 30 min.
- https://cdn.elifesciences.org/articles/51139/elife-51139-supp7-v2.xlsx
-
Supplementary file 8
Comparison of Hin-HSE and Hac-HSE genes up-regulated by heat shock in C. elegans and C. briggsae.
List of HSR genes containing Helitron independent HSEs (Hin-HSEs) and Helitron acquired (Hac-HSEs) in C. elegans and C. briggsae.
- https://cdn.elifesciences.org/articles/51139/elife-51139-supp8-v2.xlsx
-
Transparent reporting form
- https://cdn.elifesciences.org/articles/51139/elife-51139-transrepform-v2.pdf
Download links
A two-part list of links to download the article, or parts of the article, in various formats.
Downloads (link to download the article as PDF)
Open citations (links to open the citations from this article in various online reference manager services)
Cite this article (links to download the citations from this article in formats compatible with various reference manager tools)
Diversification of the Caenorhabditis heat shock response by Helitron transposable elements
eLife 8:e51139.
https://doi.org/10.7554/eLife.51139


