Shifting from fear to safety through deconditioning-update
- Neurobiology of Memory Lab, Biophysics Department, Biosciences Institute, Federal University of Rio Grande do Sul, Brazil
- Institute of Medical Biochemistry Leopoldo de Meis, Federal University of Rio de Janeiro, Brazil
Figures
Figure 1 with 4 supplements

Weakening fear memory through deconditioning-update training.
(A) Experimental design: male rats were fear-conditioned with five tone-shock pairings (context A; 5 CS + US, 0.5mA). 48 hr later, the no-footshock and footshock (deconditioning-update) groups were exposed to four daily reactivation sessions (context B). After this, animals underwent test (context B), renewal (context A) and spontaneous recovery (context B) sessions. Black circles represent context A, while white rectangles represent context B. (B) Freezing levels during reactivation sessions. Rats exposed to weak footshocks during reactivation sessions showed a significant reduction in freezing responses, maintained during the test (C), renewal (E) and spontaneous recovery (D) sessions. (F) Experimental design: female rats were fear-conditioned (context A; 5CS+US, 0.5mA). 48 hr later, the no-footshock and footshock groups were exposed to four daily reactivation sessions (context B). After this, all groups underwent test, renewal, and spontaneous recovery sessions. Animals were reconditioned (context A; 3CS+US, 0.5mA) on the next day and retested 24 hr later. (G) Freezing levels during memory reactivation. Rats exposed to weak footshocks showed a significant reduction in freezing responses, maintained during the test (H), renewal (I), spontaneous recovery (J) and retraining test (K) sessions. Bars represent mean ± SEM. Statistical comparisons were performed using two-way repeated-measures ANOVA followed by a Bonferroni post-hoc (reactivation sessions) or one-way ANOVA followed by Tukey post-hoc (test, renewal, spontaneous recovery, and retraining test). *p<0.05; **p<0.005; ***p<0.0005; ****p<0.0001. For full statistics, see Supplementary file 1. For pre-CS freezing values, see Supplementary file 12.
-
Figure 1—source data 1
Raw data of Figure 1.
- https://cdn.elifesciences.org/articles/51207/elife-51207-fig1-data1-v2.xlsx
Figure 1—figure supplement 1
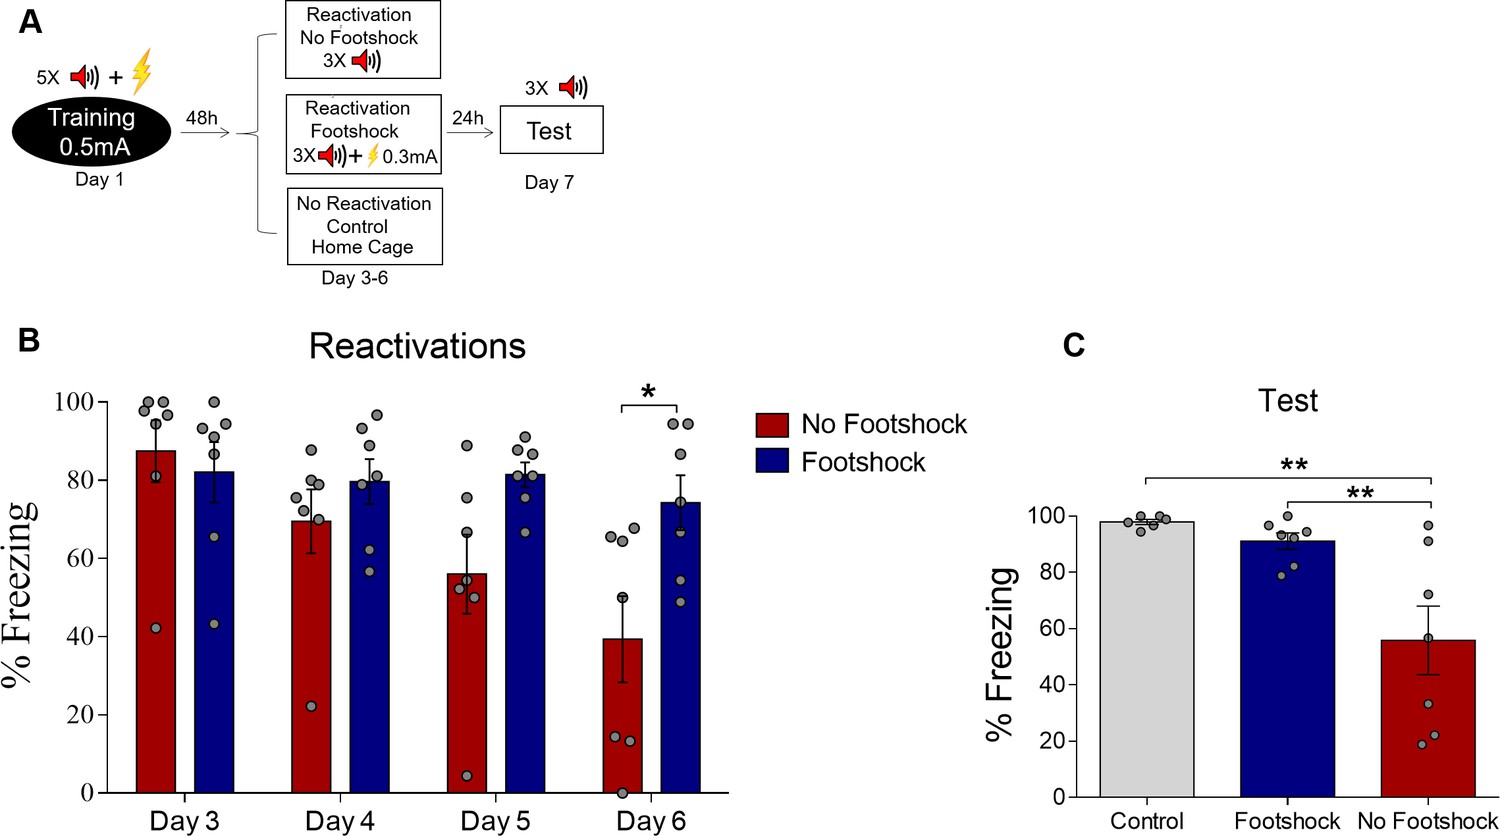
Deconditioning-update does not occur with 0.3-mA shocks.
(A) Experimental design: rats were fear-conditioned with five tone-shock pairings (context A; 5 CS + US, 0.5mA). Starting 48 hr later, animals were exposed to four daily reactivation sessions (context B) with or without an intermediate footshock (0.3mA) at the end of tones. Subsequently, all groups underwent test sessions (context B). Black circle represents context A and white rectangles represents context B. (B) Freezing levels during reactivation sessions. Rats exposed to the intermediate footshock (0.3mA) showed less freezing reduction than no-footshock animals across sessions. (C) The no-footshock group expressed lower freezing in the test compared with footshock animals or homecage controls. Statistical comparisons are performed using two-way repeated-measures ANOVA followed by a Bonferroni post-hoc (reactivation sessions) or one-way ANOVA followed by a Tukey post-hoc (test and spontaneous recovery). Bars represent mean ± SEM. *p<0.05; **p<0.005. For full statistics, see Supplementary file 5. For pre-CS freezing, see Supplementary file 15.
Figure 1—figure supplement 2

A single reactivation session does not update fear memory.
(A) Experimental design: rats were fear-conditioned with five tone-shock pairings (context B; 5 CS + US, 0.5mA). 48 hr later, animals were exposed to a single reactivation session (context B) with or without a weak (0.1 mA) footshock. Animals then underwent test (context B), and renewal (context A) sessions. Black circles represent context A and white rectangles represents context B. There were no significant differences in freezing between groups in the reactivation (B), test or renewal sessions (C). Bars represent mean ± SEM. Statistical comparisons are performed using Student’s t test (reactivation sessions) or one-way ANOVA followed by a Tukey post-hoc (test and renewal). For full statistics, see Supplementary file 6. For pre-CS freezing, see Supplementary file 16.
Figure 1—figure supplement 3
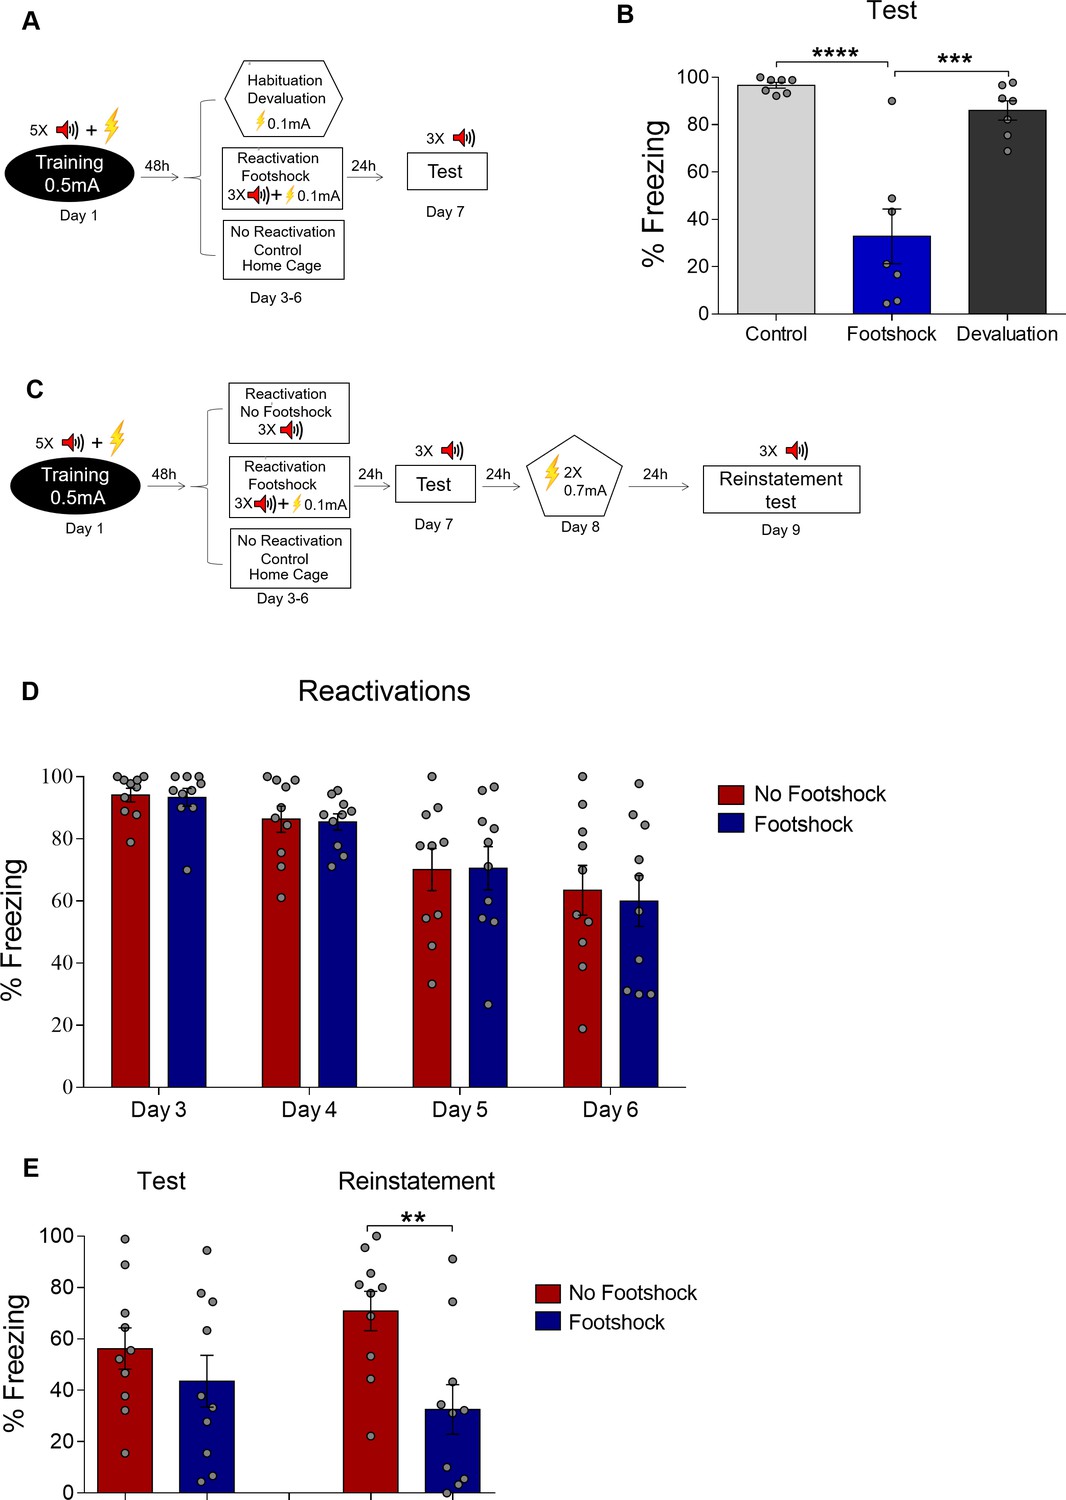
Deconditioning-update is not due to US devaluation.
(A) Experimental design for devaluation: animals received five conditioning trial tones (CS) that co-terminated with a 0.5-mA, 1 s footshock (US) in context A. On days 3 to 6, the footshock group received 3 USs (0.1-mA footshock) at the end of the tone in context B, while the devaluation group received the same shocks in a different context (context C) without tone, and control animals remained in their home cages. Black circle represents context A, while white rectangles and hexagon represent contexts B and C, respectively. (B) On day 7, both groups were tested in context B with 3 CSs (tones), and the footshock group showed a decrease in freezing responses compared to the other two groups. (C) Experimental design for reinstatement: rats were fear-conditioned with five tone-shock pairings (context A; 5 CS + US, 0.5mA). Starting 48 hr later, animals were exposed to four daily reactivation sessions (context B) with or without a weak footshock (0.1 mA) at the end of tones. On day 7, both groups were tested. On the following day, animals received two 2-s non-paired footshock (reinstatement) in a different context followed by another test 24 hr later. Freezing levels were similar during reactivation (D) and test sessions, but rats exposed to the weak footshock during reactivation sessions showed less freezing responses after reinstatement (E). Bars represent mean ± SEM. Statistical comparisons are performed using two-way repeated-measures ANOVA followed by a Bonferroni post-hoc (reactivation sessions) or one-way ANOVA followed by a Tukey post-hoc (test and reinstatement sessions). *p<0.05; **p<0.005. ****p<0.0001. For full statistics, see Supplementary file 7. For pre-CS freezing, see Supplementary file 17.
Figure 1—figure supplement 4
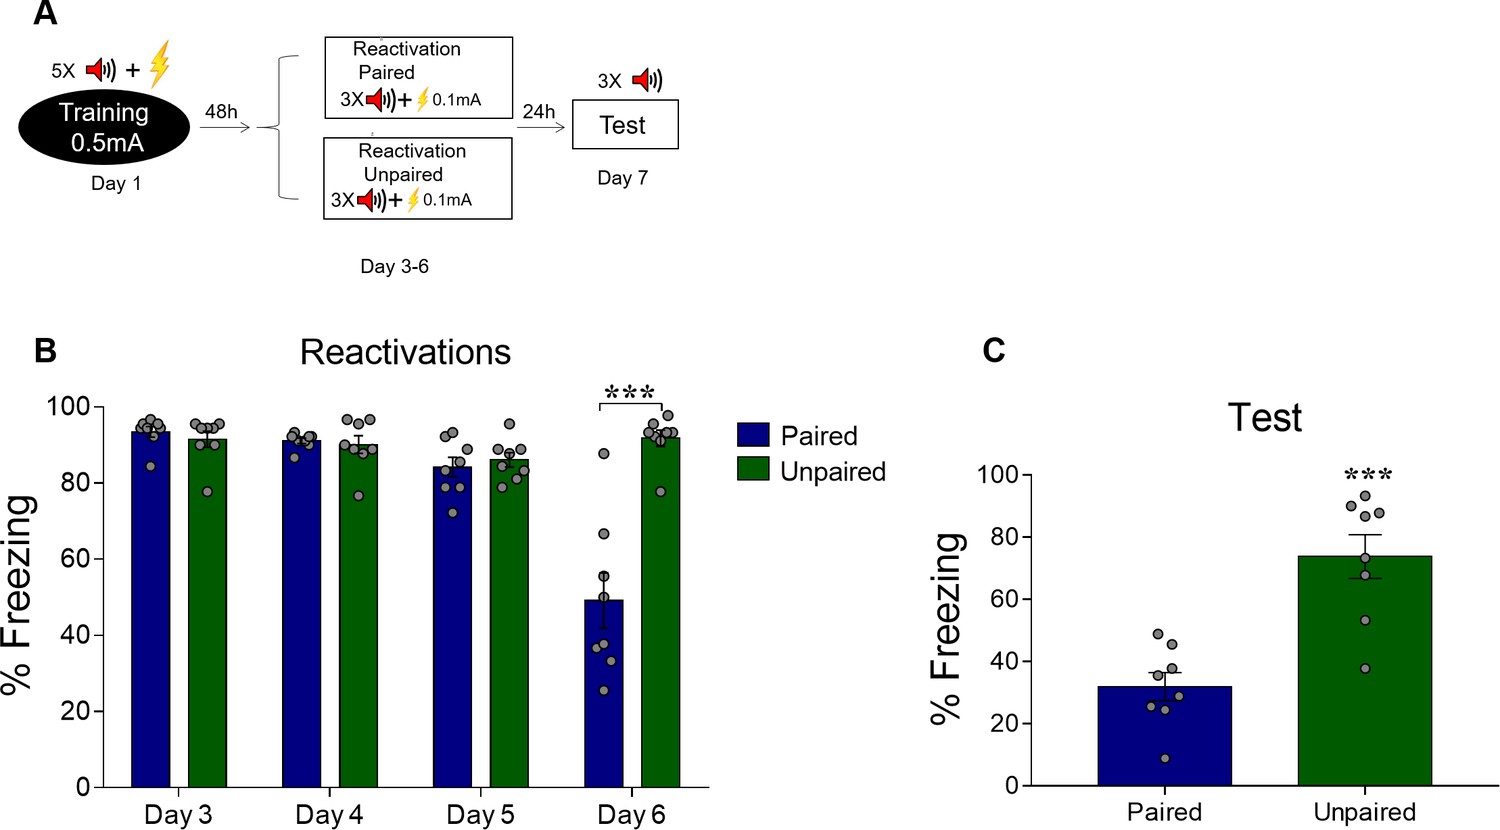
Deconditioning-update does not occur with unpaired shocks in the reactivation sessions.
(A) Experimental design: rats were fear-conditioned with five tone-shock pairings (context A; 5 CS + US, 0.5mA). Starting 48 hr later, animals were exposed to four daily reactivation sessions (context B), where weak 0.1 mA footshocks were presented either paired (i.e. at the end of each tone) or unpaired (i.e. in pseudorandom moments during the session) with the CSs. Subsequently, all groups were tested in context B. Black circle represents context A and white rectangles represents context B. (B) Freezing levels during reactivation sessions. Rats exposed to unpaired footshocks showed higher freezing levels across sessions than those exposed to paired ones. (C) The paired CS-US group expressed lower freezing in the test compared with the unpaired group. Statistical comparisons are performed using two-way repeated-measures ANOVA followed by a Bonferroni post-hoc (reactivation sessions) or Student’s t test (test session). Bars represent mean ± SEM. ***p<0.001. For full statistics, see Supplementary file 8. For pre-CS freezing, see Supplementary file 18.
Figure 2 with 1 supplement
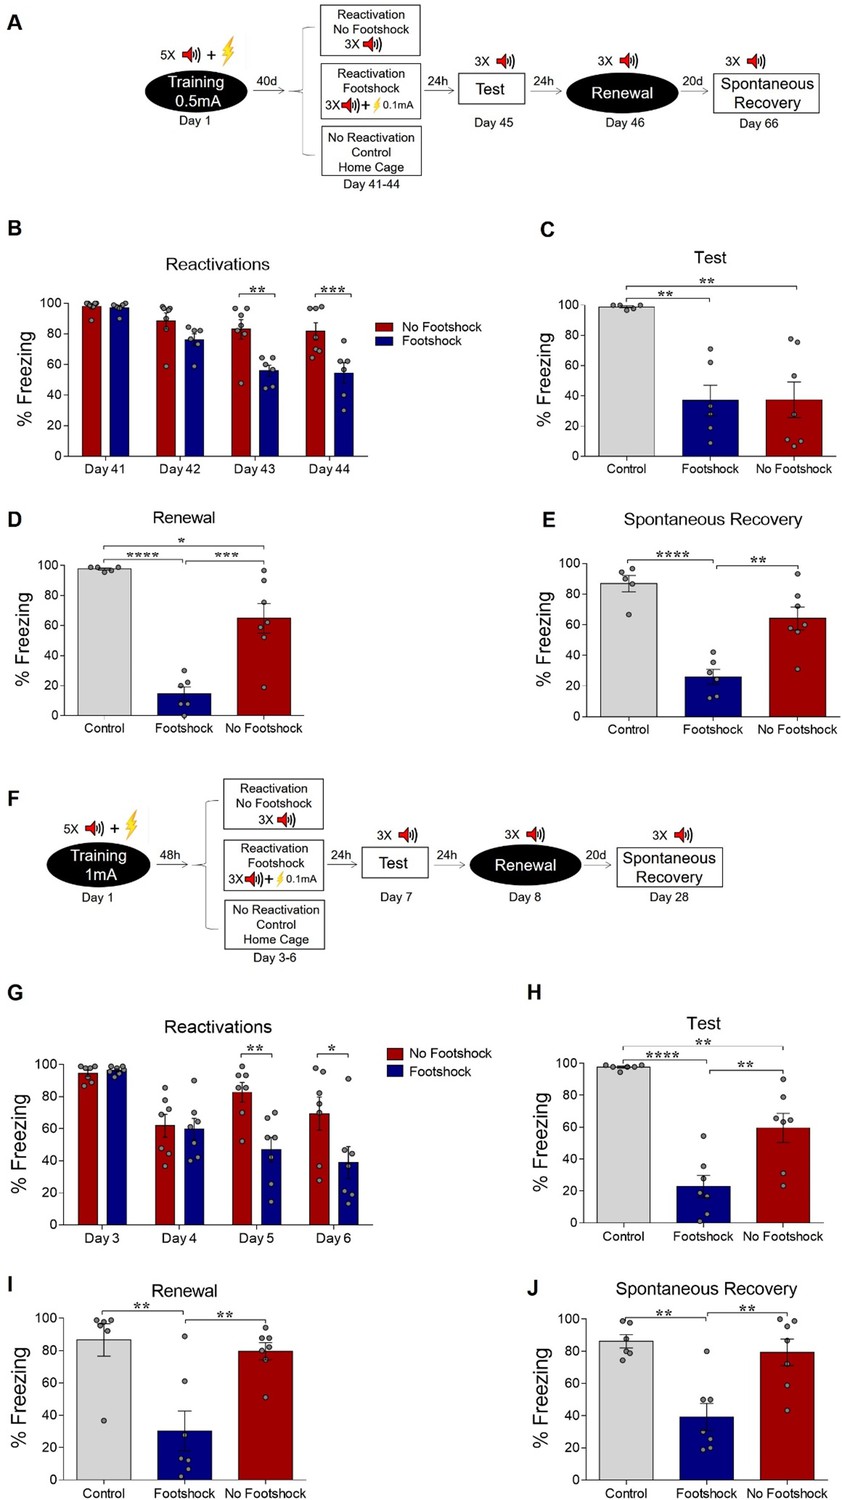
Deconditioning-update weakens both remote and strong fear memories.
(A) Experimental design for remote memory: rats were fear-conditioned with five tone-shock pairings (context A; 5 CS + US, 0.5mA). Starting 40 days later, the no-footshock and footshock (deconditioning-update) groups were exposed to daily reactivation sessions (context B). Then, all groups underwent test (context B), renewal (context A) and spontaneous recovery (context B) sessions. Black circles represent context A, while white rectangles represent context B. (B) Freezing levels during reactivation sessions. Rats exposed to weak footshocks during reactivation sessions showed similar freezing levels to no-footshock animals during the test session (C) and lower freezing levels at the renewal (D) and spontaneous recovery (E) ones. (F) Experimental design for strong training (5CS+US, 1mA). (G) Freezing levels during reactivation sessions. Rats exposed to weak footshocks during reactivation sessions showed a significant reduction in freezing responses that was maintained during the test (H), renewal (I) and spontaneous recovery (J) sessions. Bars represent mean ± SEM. Statistical comparisons are performed using two-way repeated-measures ANOVA followed by a Bonferroni post-hoc (reactivation sessions) or one-way ANOVA followed by a Tukey post-hoc (test and spontaneous recovery). *p<0.05; **p<0.005; ***p<0.0005; ****p<0.0001. For full statistics, see Supplementary file 2. For pre-CS freezing, see Supplementary file 13.
-
Figure 2—source data 1
Raw data of Figure 2.
- https://cdn.elifesciences.org/articles/51207/elife-51207-fig2-data1-v2.xlsx
Figure 2—figure supplement 1
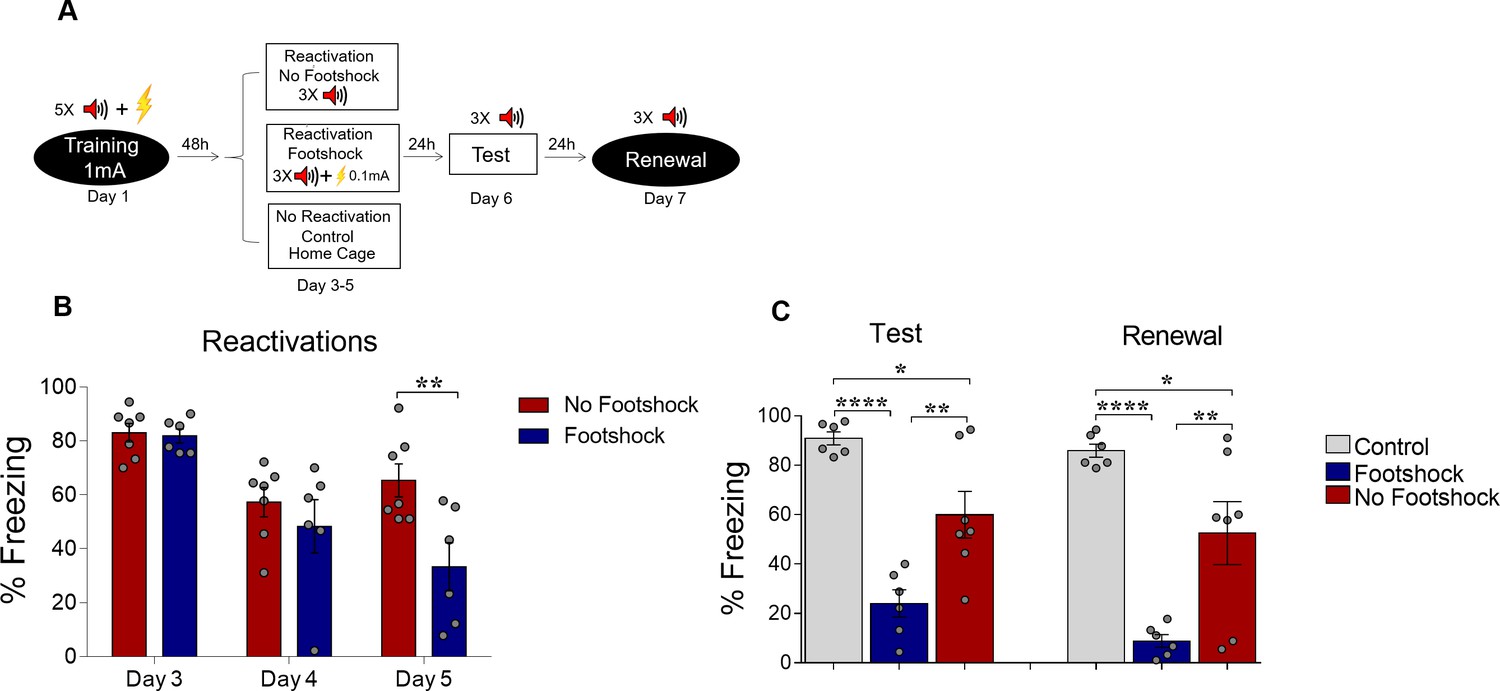
Deconditioning-update weakens strong fear memories in females.
(A) Experimental design: rats were fear-conditioned with five tone-shock pairings (context A; 5 CS + US, 1mA). Starting 48 hr later, animals were exposed to three daily reactivation sessions (context B) with or without a weak footshock (0.1 mA) at the end of tones. Subsequently, all groups underwent test (context B) and renewal (context A) sessions. Black circles represent context A and white rectangles represent context B. (B) Freezing levels during reactivation sessions. Rats exposed to weak footshocks during reactivation sessions showed a decrease in freezing responses that was maintained in the test session (C). Bars represent mean ± SEM. Statistical comparisons are performed using two-way repeated-measures ANOVA followed by a Bonferroni post-hoc (reactivation sessions) or one-way ANOVA followed by a Tukey post-hoc (test and renewal). *p<0.05; **p<0.005. ****p<0.0001. For full statistics, see Supplementary file 9. For pre-CS freezing, see Supplementary file 19.
Figure 3

Deconditioning-update weakens fear memory in different behavioral tasks.
(A) Experimental design in contextual fear conditioning: rats were fear-conditioned with five contextual-shock pairings (4 min context + 4 US, 0.5mA). Starting 48 hr later, the no-footshock and footshock groups were exposed to daily reactivation sessions. 24 hr after the last reactivation, all groups were tested; 20 days later, they were tested for spontaneous recovery. (B) Freezing levels during reactivation sessions. Rats exposed to weak footshocks during reactivation sessions showed a significant reduction in freezing responses maintained during the test (C) and spontaneous recovery (D) sessions. (E) Experimental design in inhibitory avoidance: rats were placed in the lighted compartment and received footshocks (4 US, 0.5mA) upon entering the dark one. Starting 48 hr later, the no-footshock and footshock groups were exposed to daily 30-s reactivation sessions in the dark compartment; 24 hr after the last reactivation, all groups were tested. Rats exposed to weak footshocks during reactivation sessions showed lower latencies to cross to the dark compartment (F) and spent more time in it during the test (G). Bars represent mean ± SEM or median with interquartile range (in F and G). Statistical comparisons for contextual fear conditioning are performed using two-way repeated-measures ANOVA followed by a Bonferroni post-hoc (reactivation sessions) or one-way ANOVA followed by a Tukey post-hoc (test, renewal, and spontaneous recovery). For inhibitory avoidance, a Kruskal-Wallis test followed by a Dunn post-hoc was performed. *p<0.05; **p<0.005; ***p<0.0005; ****p<0.0001. For full statistics, see Supplementary file 3.
-
Figure 3—source data 1
Raw data of Figure 3.
- https://cdn.elifesciences.org/articles/51207/elife-51207-fig3-data1-v2.xlsx
Figure 4 with 2 supplements
Deconditioning-update is based on memory destabilization mechanisms.
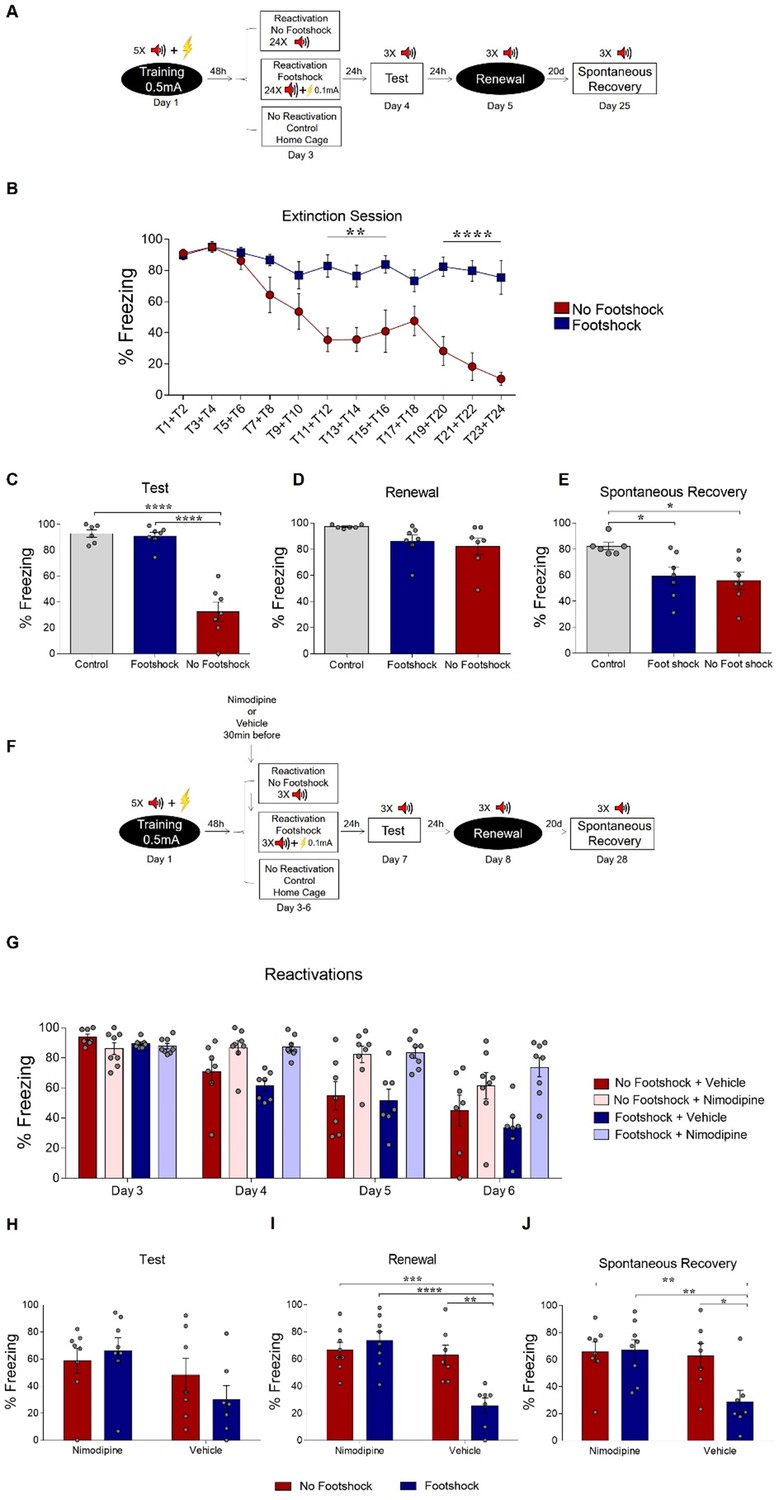
(A) Experimental design: rats were fear-conditioned with five tone-shock pairings (context A; 5CS+US, 0.5mA). 48 hr later, the no-footshock and footshock groups underwent a single extinction session (context B, 24 CSs), followed by test (context B), renewal (context A) and spontaneous recovery (context B) sessions. (B) Freezing levels during extinction. Weak footshocks impaired extinction within the session and in the test session (C), but not in renewal (D) or spontaneous recovery (E). (F) Experimental design: rats were fear-conditioned (context A; 5CS+US, 0.5mA). 48 hr later, all animals underwent daily reactivation sessions (context B), receiving nimodipine (16 mg/kg, i.p.) or vehicle 30 min before each one. They then underwent test (context B), renewal (context A) and spontaneous recovery (context B) sessions. Nimodipine prevented freezing decrease across reactivation sessions in both groups (G). Freezing was similar between groups in the test session (H), but was lower in the vehicle-footshock group in the renewal (I) and spontaneous recovery (J) sessions. Bars represent mean ± SEM. Statistical comparisons are performed using two-way repeated-measures ANOVA followed by Bonferroni post-hoc (extinction), one-way ANOVA followed by Tukey post-hoc (test, renewal, and spontaneous recovery following extinction), three-way repeated-measures ANOVA followed by Bonferroni post-hoc (reactivation sessions with nimodipine/vehicle) and two-way ANOVA followed by Bonferroni post-hoc (test, renewal, and spontaneous recovery following nimopidine/vehicle). *p<0.05; **p<0.005; ***p<0.0005; ****p<0.0001 in between-group comparisons. For full statistics, see Supplementary file 4. For pre-CS freezing, see Supplementary file 14.
-
Figure 4—source data 1
Raw data of Figure 4.
- https://cdn.elifesciences.org/articles/51207/elife-51207-fig4-data1-v2.xlsx
Figure 4—figure supplement 1
Effects of deconditioning-update in a single 12-CS extinction session.
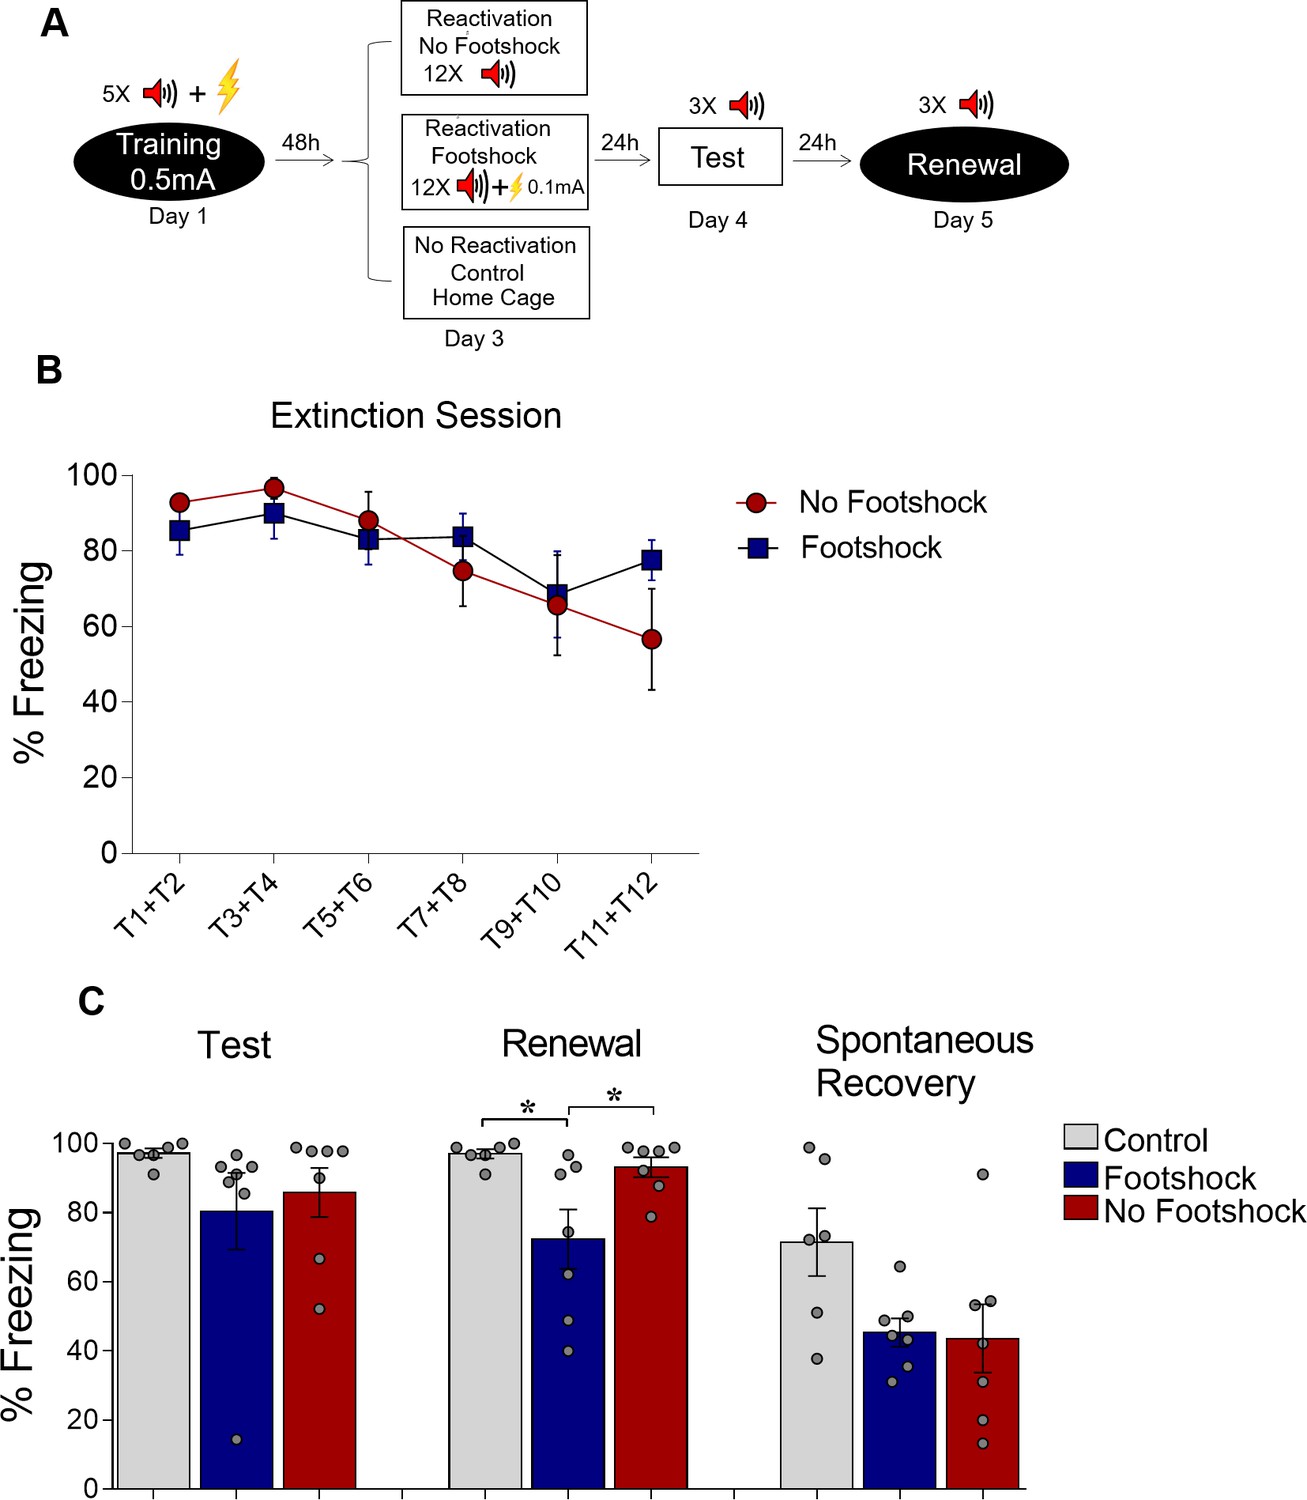
(A) Experimental design: rats were fear-conditioned with five tone-shock pairings (context B; 5 CS + US, 0.5mA). 48 hr later, both groups underwent a single extinction session (context A, 12 CSs) with or without a weak footshock (0.1 mA) at the end of tones. Animals then underwent test (context A), renewal (context B) and spontaneous recovery (context A) sessions. Black circles represent context A and white squares represent context B. (B) Freezing levels during the extinction session. No differences were found between the groups during extinction or in the test and spontaneous recovery sessions, but the deconditioning-update group showed less renewal (C). Bars represent mean ± SEM. Statistical comparisons are performed using two-way repeated-measures ANOVA followed by a Bonferroni post-hoc (extinction session) or one-way ANOVA followed by a Tukey post-hoc (test, renewal and spontaneous recovery). For full statistics, see Supplementary file 10. For pre-CS freezing, see Supplementary file 20.
Figure 4—figure supplement 2
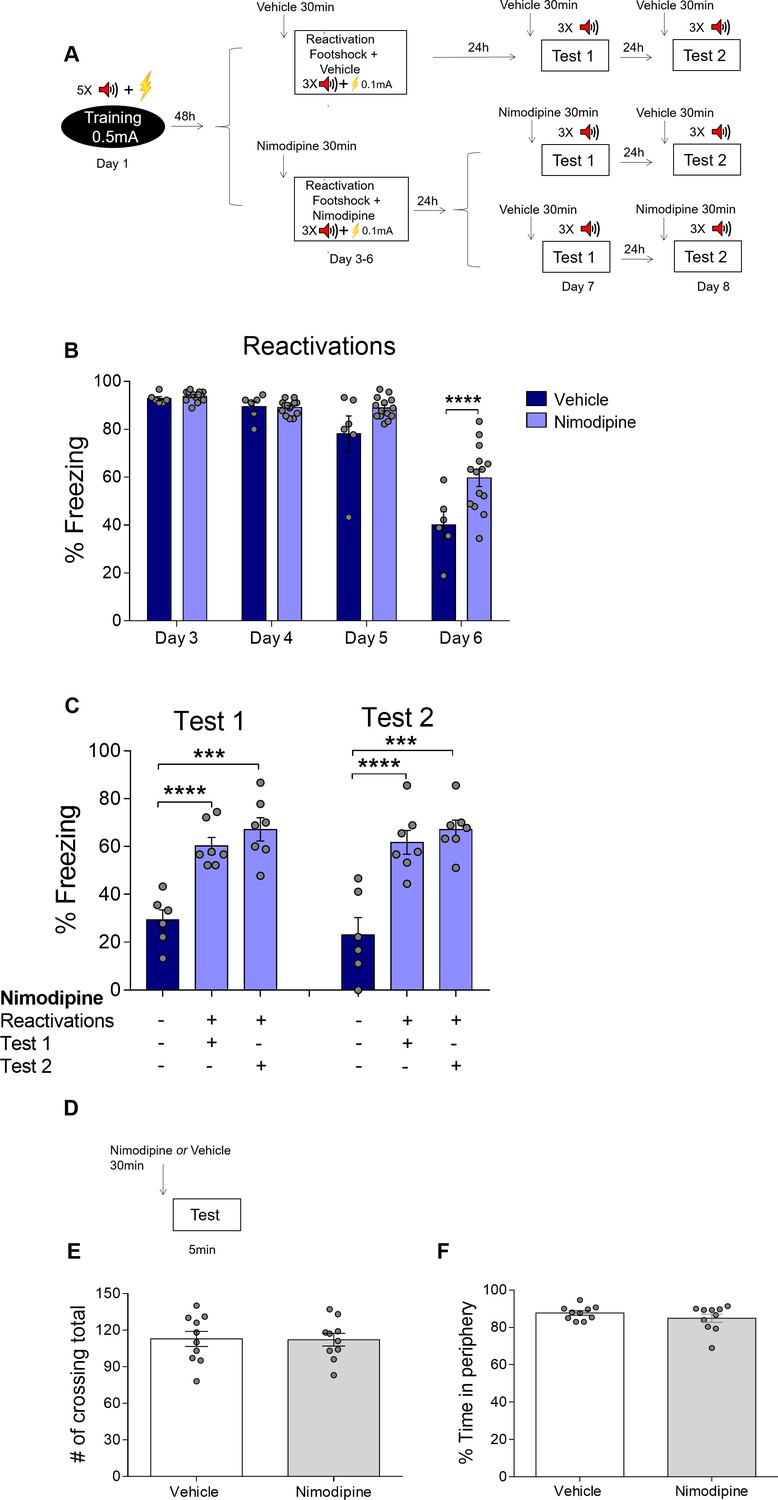
Nimodipine does not induce a state-dependent memory and does not affect open field behavior.
(A) Experimental design: rats were fear-conditioned with five tone-shock pairings (context A; 5CS+US, 0.5mA). 48 hr later, all animals underwent daily reactivation sessions (context B), receiving nimodipine (16 mg/kg, i.p.) or vehicle 30 min before each one. They were tested 24 hr (Test 1) and 48 hr (Test 2) later in context B. Half of the animals treated with nimodipine during reactivation received nimodipine and half received vehicle before Test 1; treatments were reversed in Test 2. Black circle represents context A, while white rectangles represent context B. (B) Nimodipine treatment before reactivation prevented freezing reduction across reactivation sessions. (C) Nimodipine injection before the test did not affect freezing expression, suggesting that it prevented deconditioning instead of inducing state-dependent extinction. Sessions in which each group received nimodipine are marked with plus signs below the graph, while those in which vehicle was given are marked with minus signs. (D) Experimental design of the open field task. Nimodipine administered 30 min before the test did not influence the number of crossings (E) or time spent in the periphery of the arena (F). Bars represent mean ± SEM. Statistical comparisons are performed using two-way repeated-measures ANOVA followed by a Bonferroni post-hoc (reactivation sessions), one-way ANOVA followed by a Tukey post-hoc (test sessions) or Student’s t test (open field test). ****p<0.0001. For full statistics, see Supplementary file 11. For pre-CS freezing, see Supplementary file 21.
Figure 5 with 1 supplement
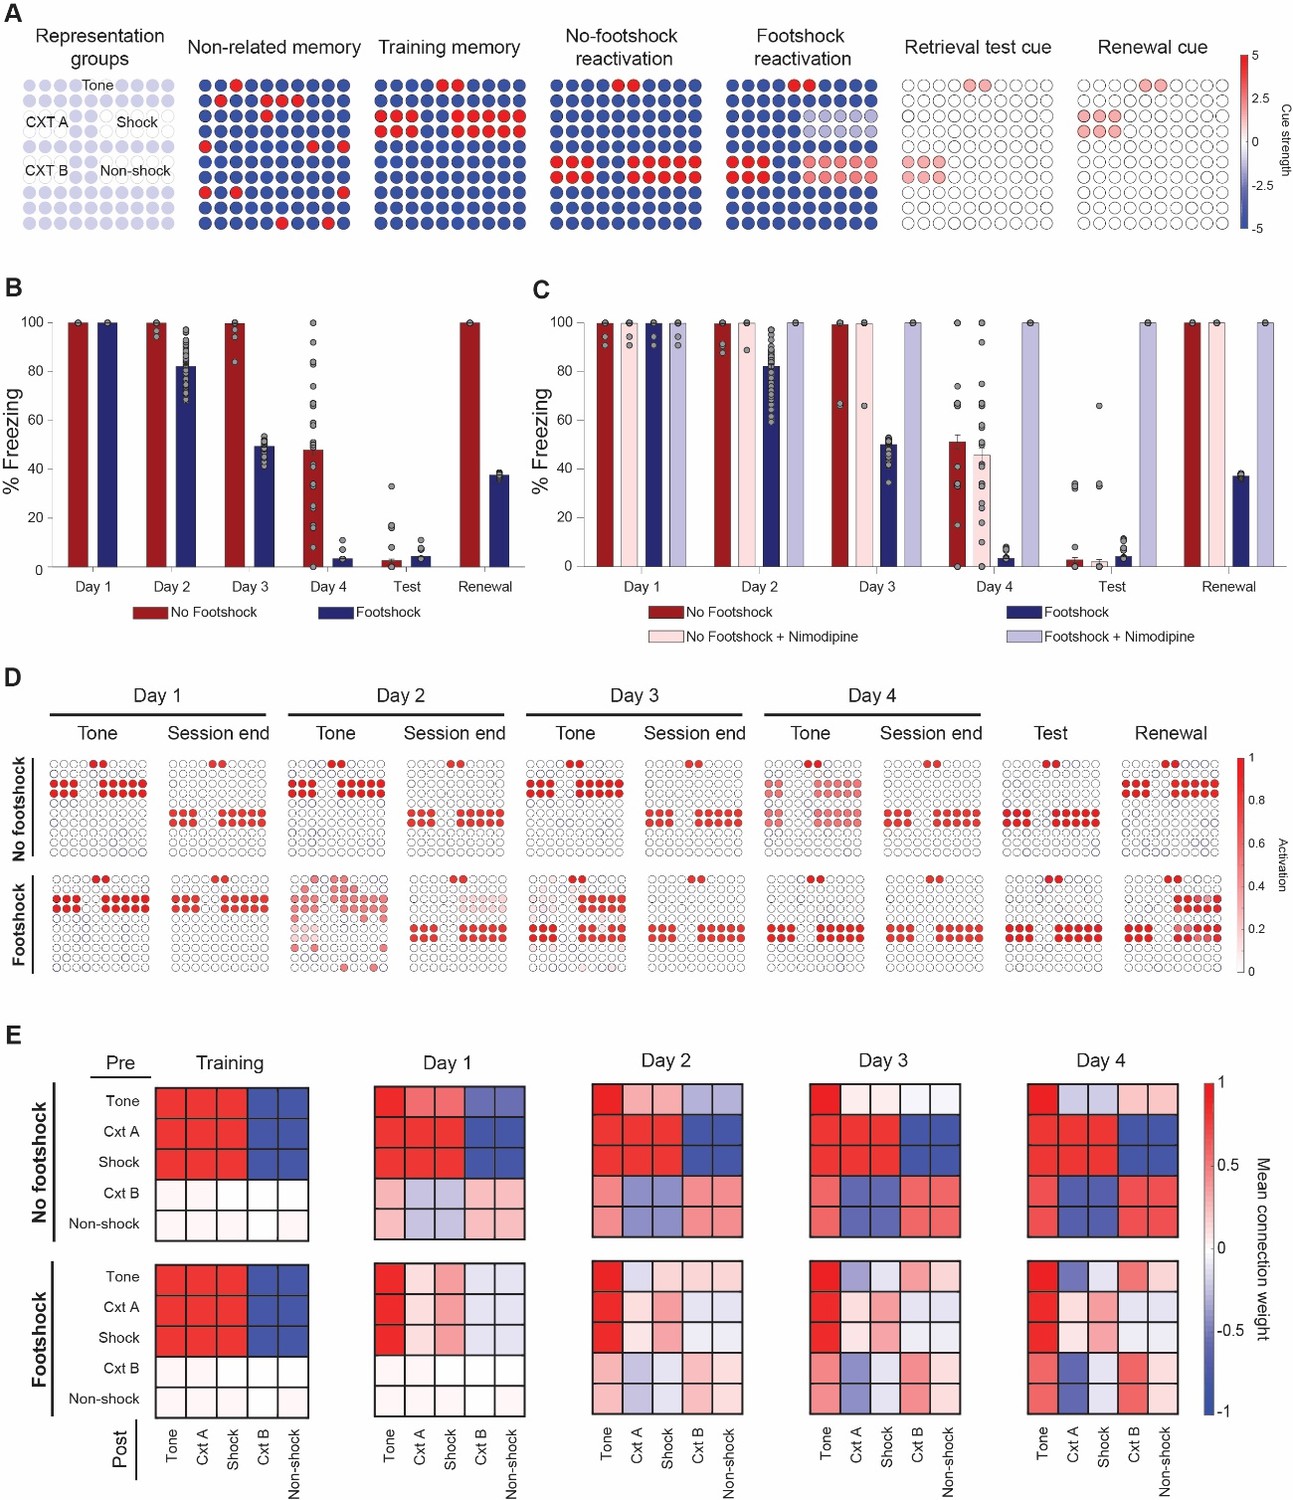
Lower mismatch accelerates fear reduction and decreases renewal in a neural network model.
(A) Cue inputs presented to the network during training (shock memory), reexposure (with or without footshock) and test sessions (consisting of the tone and either context B (test) or A (renewal)). Color scale shows the cue received by each of the 100 neurons (B) Extinction over multiple sessions using the no-footshock (red bars) or footshock (blue bars) cue. Bars represent freezing, expressed as the activity ratio between shock neurons and the sum of shock and non-shock neurons in response to the test cue, at reexposure days 1 to 4. After each test, memory is updated according to the activity reached in response to the full reexposure pattern. (C) Effect of LVGCC blockade (i.e. setting the mismatch-induced degradation term D to 0). Removing the degradation term blocks deconditioning-update, but not regular extinction. (D) Network activity in retrieval tests during tone presentations (e.g. cued with the tone alone) and at the end of reexposure (e.g. cued with the full reactivation pattern), as well as on test and retrieval sessions. Lower mismatch (i.e. weak footshock) leads to retrieval of the original pattern on the first days, leading to memory updating through mismatch-induced degradation and lower retrieval on subsequent tests. (E) Mean synaptic weights between different neuronal groups after training and at the end of each extinction session. Heat map represents the connection from neuronal populations in the Y axis to those in the X axis in the no-footshock and footshock groups. Deconditioning-update leads to weakening of connections between context and shock neurons and of their inhibitory connections to other neurons. On no-footshock extinction, an extinction memory is formed with sparing of the shock representation.
Figure 5—figure supplement 1
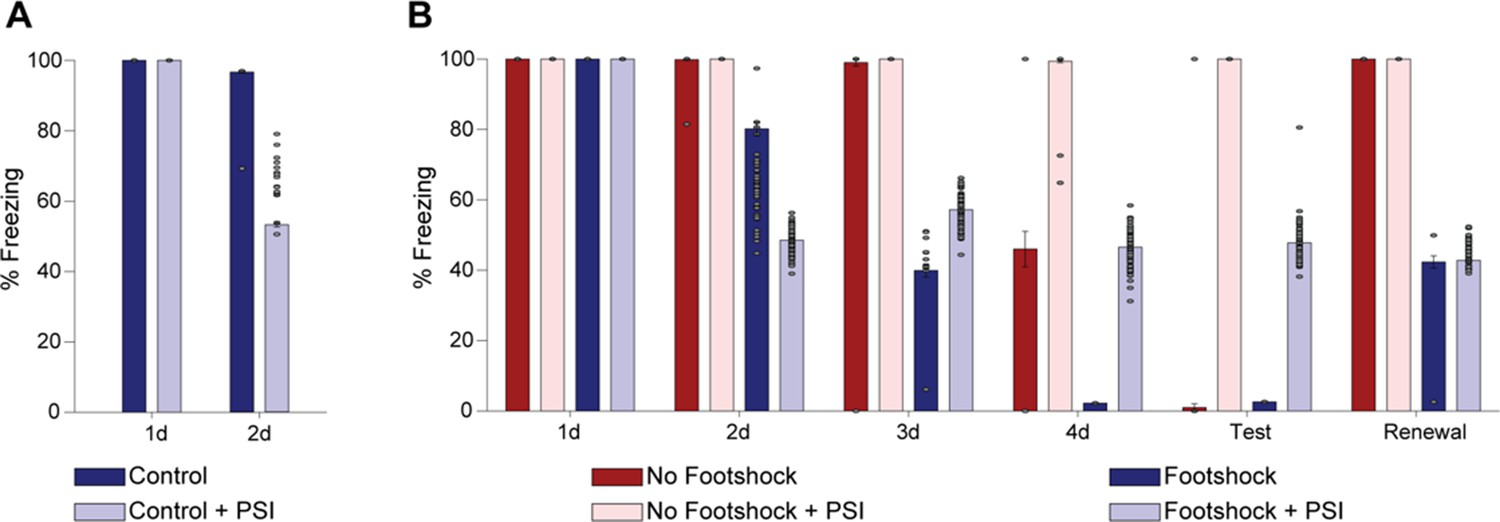
Blockade of Hebbian plasticity impairs reconsolidation, blocks standard extinction and interacts with deconditioning-update.
(A) Effect of protein synthesis inhibition (modeled by setting the Hebbian plasticity term S to 0 in the model) during reexposure with a low degree of mismatch that does not induce extinction (i.e. reconsolidation condition). Bars represent freezing, expressed as the activity ratio between shock neurons and the sum of shock and non-shock neurons in response to the test cue, before and after a reexposure with either vehicle (dark bars, Hebbian plasticity on) or a protein synthesis inhibitor (light bars, Hebbian plasticity off). Unlike in deconditioning-update, which requires several sessions, freezing decreases after a single reexposure session under protein synthesis blockade. (B) Effect of protein synthesis inhibition on regular extinction (red bars) or deconditioning-update (blue bars), as defined by the patterns in Figure 5A. Blockade of Hebbian plasticity inhibits extinction with a pure extinction pattern, which is fully based on learning a new attractor; however, it causes deconditioning-update to initially progress faster due to greater weakening of the original memory. On the long run, however, extinction is impaired in this group as well due to blockade of new learning.
Additional files
-
Source code 1
Matlab code for Figure 5.
- https://cdn.elifesciences.org/articles/51207/elife-51207-code1-v2.zip
-
Supplementary file 1
Weakening fear memory through deconditioning-update training.
- https://cdn.elifesciences.org/articles/51207/elife-51207-supp1-v2.docx
-
Supplementary file 2
Deconditioning-update approach weakens both remote and strong fear memory.
- https://cdn.elifesciences.org/articles/51207/elife-51207-supp2-v2.docx
-
Supplementary file 3
Deconditioning-updating weakens fear memory in different behavioral tasks.
- https://cdn.elifesciences.org/articles/51207/elife-51207-supp3-v2.docx
-
Supplementary file 4
Deconditioning-update is based on memory destabilization mechanisms.
- https://cdn.elifesciences.org/articles/51207/elife-51207-supp4-v2.docx
-
Supplementary file 5
Deconditioning-update does not occur with 0.3-mA shocks.
- https://cdn.elifesciences.org/articles/51207/elife-51207-supp5-v2.docx
-
Supplementary file 6
A single reactivation session does not update fear memory.
- https://cdn.elifesciences.org/articles/51207/elife-51207-supp6-v2.docx
-
Supplementary file 7
Deconditioning-update is not due to US devaluation.
- https://cdn.elifesciences.org/articles/51207/elife-51207-supp7-v2.docx
-
Supplementary file 8
Deconditioning-update does not occur with unpaired shocks in the reactivation sessions.
- https://cdn.elifesciences.org/articles/51207/elife-51207-supp8-v2.docx
-
Supplementary file 9
Deconditioning-update weakens strong fear memories in females.
- https://cdn.elifesciences.org/articles/51207/elife-51207-supp9-v2.docx
-
Supplementary file 10
Deconditioning-update does not occur in a single 12-CS extinction session.
- https://cdn.elifesciences.org/articles/51207/elife-51207-supp10-v2.docx
-
Supplementary file 11
Nimodipine does not affect open field behavior and does not induce a state-dependent memory.
- https://cdn.elifesciences.org/articles/51207/elife-51207-supp11-v2.docx
-
Supplementary file 12
Baseline (pre-CS) freezing levels for Figure 1.
- https://cdn.elifesciences.org/articles/51207/elife-51207-supp12-v2.docx
-
Supplementary file 13
Baseline (pre-CS freezing levels for Figure 2.
- https://cdn.elifesciences.org/articles/51207/elife-51207-supp13-v2.docx
-
Supplementary file 14
Baseline (pre-CS) freezing levels for Figure 4.
- https://cdn.elifesciences.org/articles/51207/elife-51207-supp14-v2.docx
-
Supplementary file 15
Baseline (pre-CS) freezing levels for Figure 1—figure supplement 1.
- https://cdn.elifesciences.org/articles/51207/elife-51207-supp15-v2.docx
-
Supplementary file 16
Baseline (pre-CS) freezing levels for Figure 1—figure supplement 2.
- https://cdn.elifesciences.org/articles/51207/elife-51207-supp16-v2.docx
-
Supplementary file 17
Baseline (pre-CS) freezing levels for Figure 1—figure supplement 3.
- https://cdn.elifesciences.org/articles/51207/elife-51207-supp17-v2.docx
-
Supplementary file 18
Baseline (pre-CS) freezing levels for Figure 1—figure supplement 4.
- https://cdn.elifesciences.org/articles/51207/elife-51207-supp18-v2.docx
-
Supplementary file 19
Baseline (pre-CS) freezing levels for Figure 2—figure supplement 1.
- https://cdn.elifesciences.org/articles/51207/elife-51207-supp19-v2.docx
-
Supplementary file 20
Baseline (pre-CS) freezing levels for Figure 4—figure supplement 1.
- https://cdn.elifesciences.org/articles/51207/elife-51207-supp20-v2.docx
-
Supplementary file 21
Baseline (pre-CS) freezing levels for Figure 4—figure supplement 2.
- https://cdn.elifesciences.org/articles/51207/elife-51207-supp21-v2.docx
-
Transparent reporting form
- https://cdn.elifesciences.org/articles/51207/elife-51207-transrepform-v2.docx
Download links
A two-part list of links to download the article, or parts of the article, in various formats.
Downloads (link to download the article as PDF)
Open citations (links to open the citations from this article in various online reference manager services)
Cite this article (links to download the citations from this article in formats compatible with various reference manager tools)
Shifting from fear to safety through deconditioning-update
eLife 9:e51207.
https://doi.org/10.7554/eLife.51207


