The ion selectivity filter is not an activation gate in TRPV1-3 channels
- Porter Neuroscience Research Center, National Institute of Neurological Disorders and Stroke, National Institutes of Health, United States
Figures
Figure 1 with 2 supplements
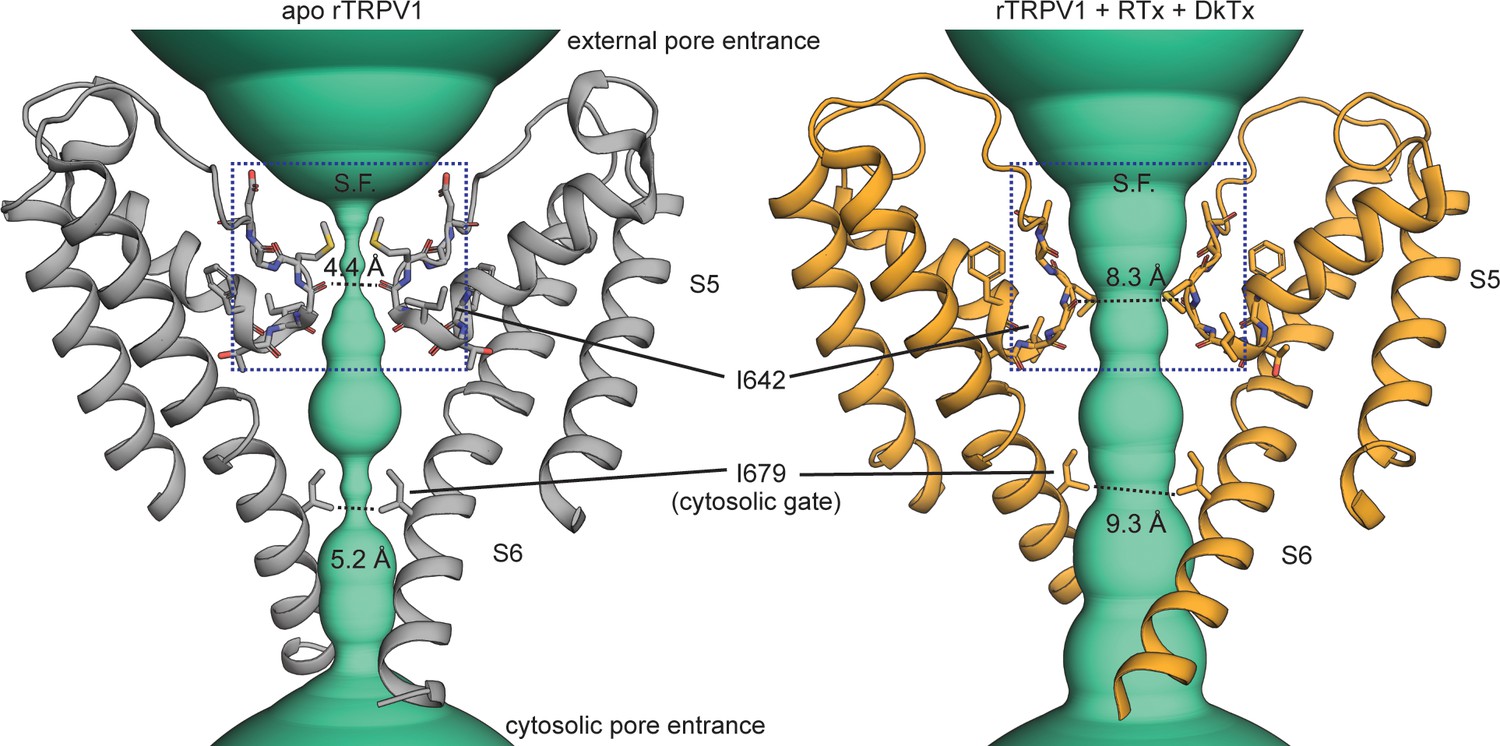
Gating the pore of the TRPV1 channel.
The pore domain of the unliganded (apo, PDB: 5IRZ) and Resiniferatoxin (RTx)/Double-knot toxin (DkTx) bound (PDB: 5IRX) TRPV1 channel structures (Gao et al., 2016b) with only two opposing subunits depicted. The turquoise densities illustrate the ion-conducting pathway according to the van der Waals pore-radius calculated using HOLE (Smart et al., 1996), which is explicitly shown at the narrowest points on the selectivity filter (S.F.) and cytosolic gate.
Figure 1—figure supplement 1
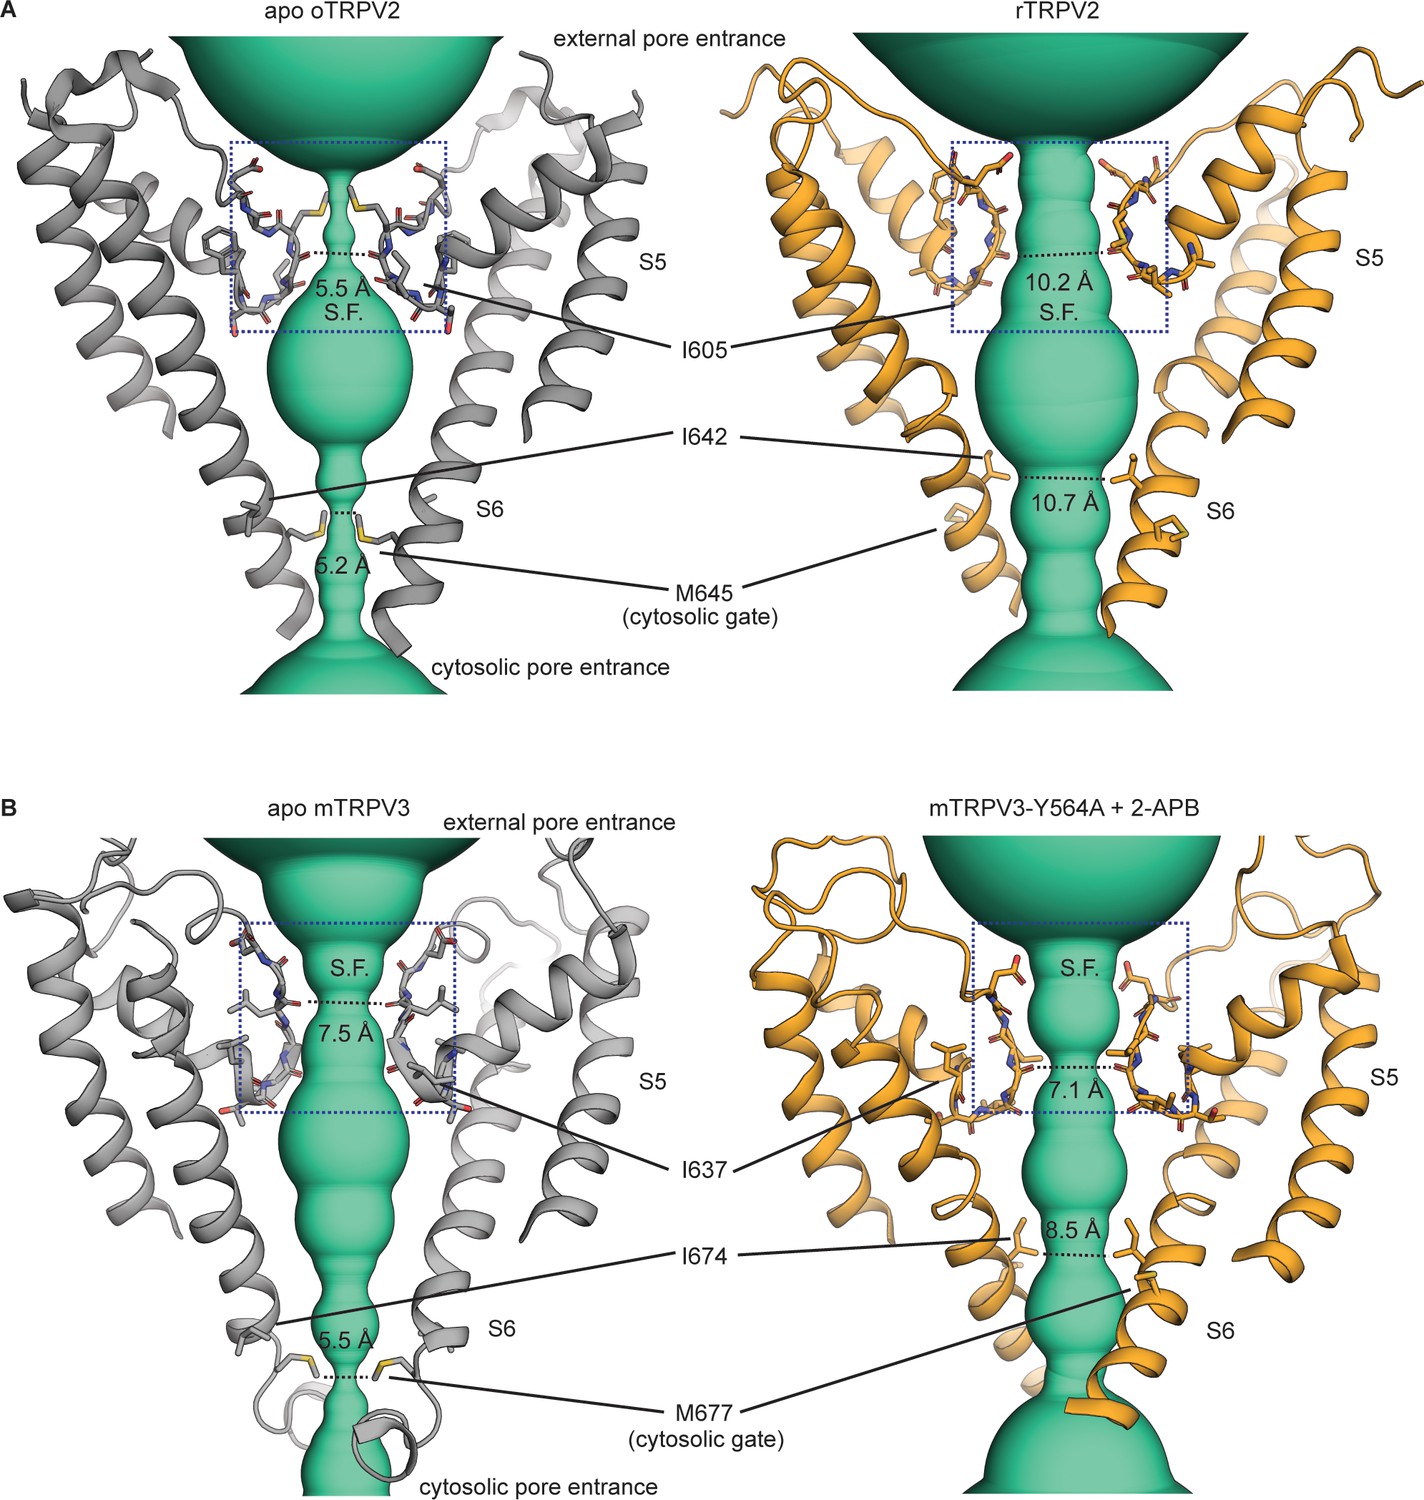
The ion-conducting pathway of the TRPV2 and TRPV3 channels.
(A) The pore domain of the un-liganded rabbit TRPV2 (PDB: 5AN8) (Zubcevic et al., 2016) and rat TRPV2 (PDB: 6bo4) (Dosey et al., 2019) channel structures with only two opposing subunits depicted. The turquoise densities illustrate the ion-conducting pathway estimated based on the van del Waals radii using HOLE, with explicitly shown radii at the narrowest points of the selectivity filter (S.F.) and the cytosolic end of S6. Labeled residue numbering is according to the rat TRPV2. (B) The pore domain of the un-liganded (PDB: 6DVW) and 2-APB-bound mTRPV3 + Y564A (PDB: 6DVZ) (Singh et al., 2018) channel structures with only two opposing subunits depicted. The turquoise densities illustrate the ion-conducting pathway, with explicitly shown radii at the narrowest points of the selectivity filter (S.F.) and the cytosolic end of S6. Labeled residue numbering is according to the mouse TRPV3.
Figure 1—figure supplement 2
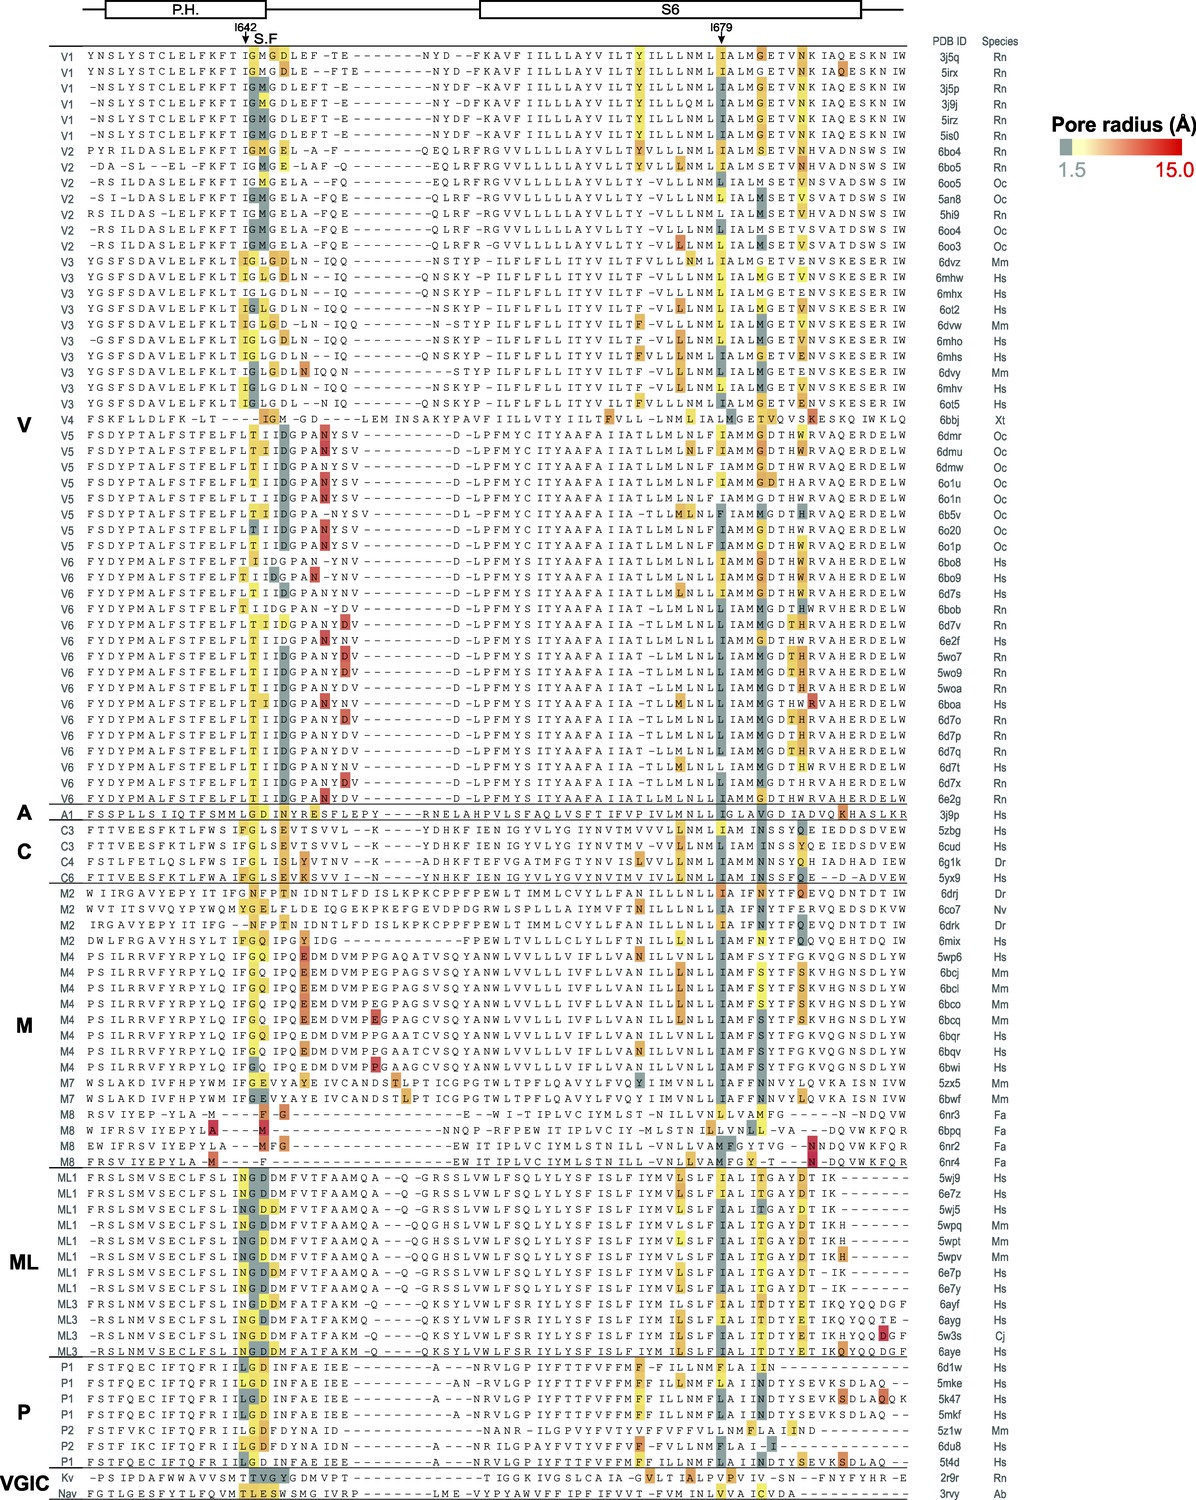
Constrictions in the ion-conduction pathway of TRP channel structures.
Structure-based sequence alignment of TRP channel ion-conduction pathways grouped by sub-families (see labels on the left), with the minimal pore radius per pore-facing residue represented in gray (radii <1.5 Å) or yellow-to-red color scale (radii >1.5 Å, color scale on the top right corner). The mammalian Kv1.2/2.1 paddle chimera and the prokaryotic NavAb channel are included at the bottom of the alignment. The PDB ID numbers relating each amino acid sequence in the alignment with their corresponding structural model are listed on the first column to the right, and the abbreviations for the animal species from which the proteins were obtained are listed on the second column. The abbreviations for the animal species are: Rn – Rattus norvegicus; Oc – Oryctolagus cuniculus; Mm – Mus musculus; Hs – Homo sapiens; Xt – Xenopus tropicalis; Dr – Danio rerio; Nv – Nematostella vectensis; Fa – Ficedula albicollis; Cj – Callithrix jacchus; Ab – Arcobacter butzleri. See Supplementary file 1 for the entire list of structures that were included, the corresponding references. P.H. denotes pore helix, and S.F. selectivity filter.
Figure 2
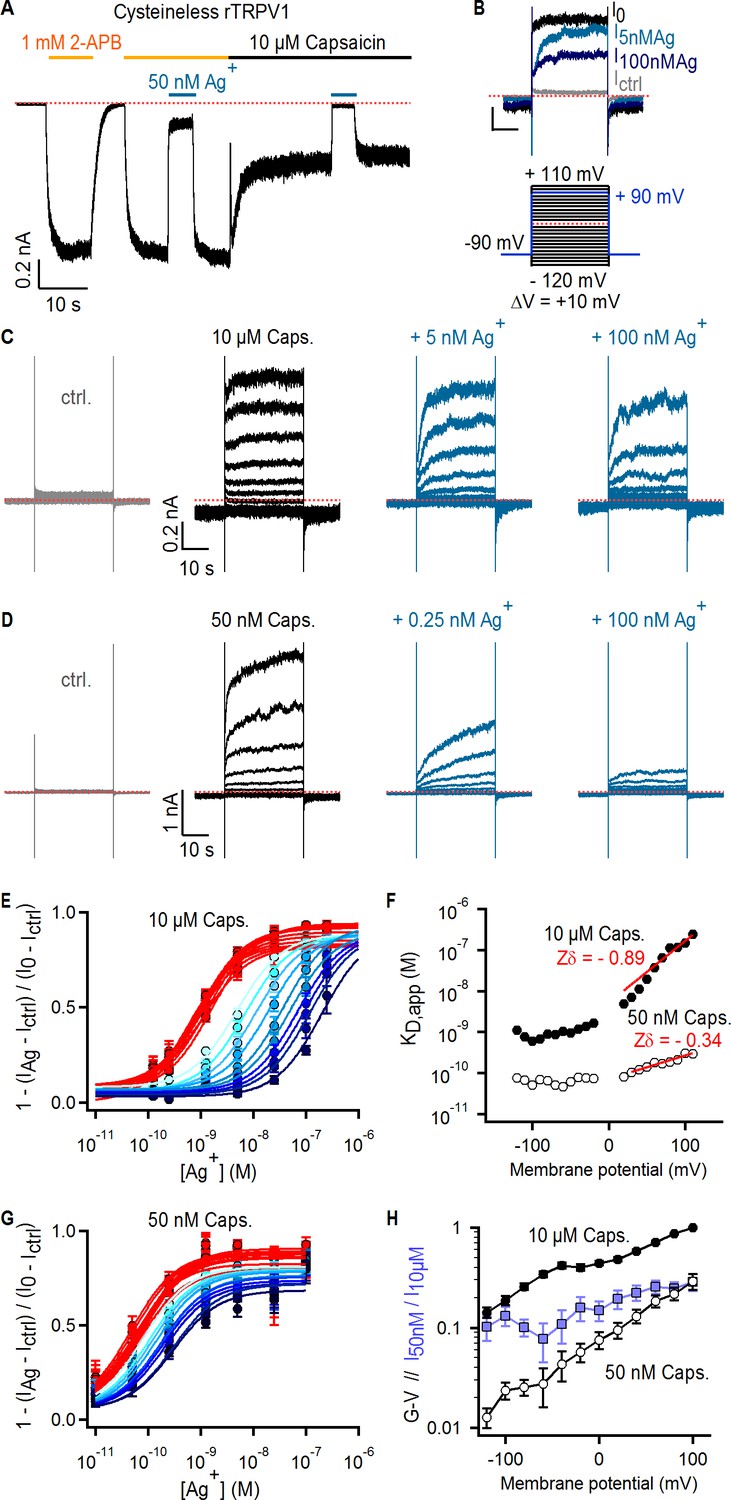
Ag+ blocks TRPV1 channels in a state-dependent manner.
(A) Representative whole-cell current-trace at −60 mV exposed to 2-APB (yellow line), capsaicin (black line) and external Ag+-ions (blue line). The red dotted line denotes the zero-current level. (B) Representative Cys-less rTRPV1 currents elicited by voltage steps from – 90 to + 90 mV (blue lines in the voltage protocol below) selected from the current families in (C), and obtained in the absence of agonist (gray trace), or with 10 µM capsaicin in the absence (black trace, I0) or presence of external Ag+ (blue traces). (C, D) Representative Cys-less rTRPV1 current traces elicited by voltage-steps as indicated in the protocol in (B, lower panel), activated with 10 µM (C) or 50 nM (D) capsaicin. Traces elicited at odd-voltage values are not depicted. (E) Dose-response relations for block by external Ag+ at negative (red) or positive (blue, color intensity increases with depolarization) voltages, obtained from Cys-less rTRPV1 channels activated by 10 µM capsaicin from traces as in (C). Continuous curves are fits to the Hill equation. Data are shown as mean ± SEM (n = 5–10). (F) Apparent dissociation constants for Ag+ as a function of voltage, obtained from fits of the Hill equation to each of the curves in (E) and (G). The red lines are fits of KD,app(V) = KD,app(0 mV) x exp(-Zδ x VF/RT), with a KD,app(0 mV) of 5.2 nM (10 µM capsaicin) or 70 pM (50 nM capsaicin). (G) Dose-response curves for Ag+-block of currents activated by 50 nM capsaicin, obtained from current families as in (D) (mean ± SEM, n = 3–13). (H) Conductance-voltage (G–V) relations (black symbols) obtained from data as in (C) and normalized to 10 µM capsaicin at +100 mV. The ratio at each voltage between control-subtracted currents activated by 50 nM and 10 µM capsaicin is shown in blue. Data is shown as mean ± SEM (n = 5).
Figure 3 with 5 supplements
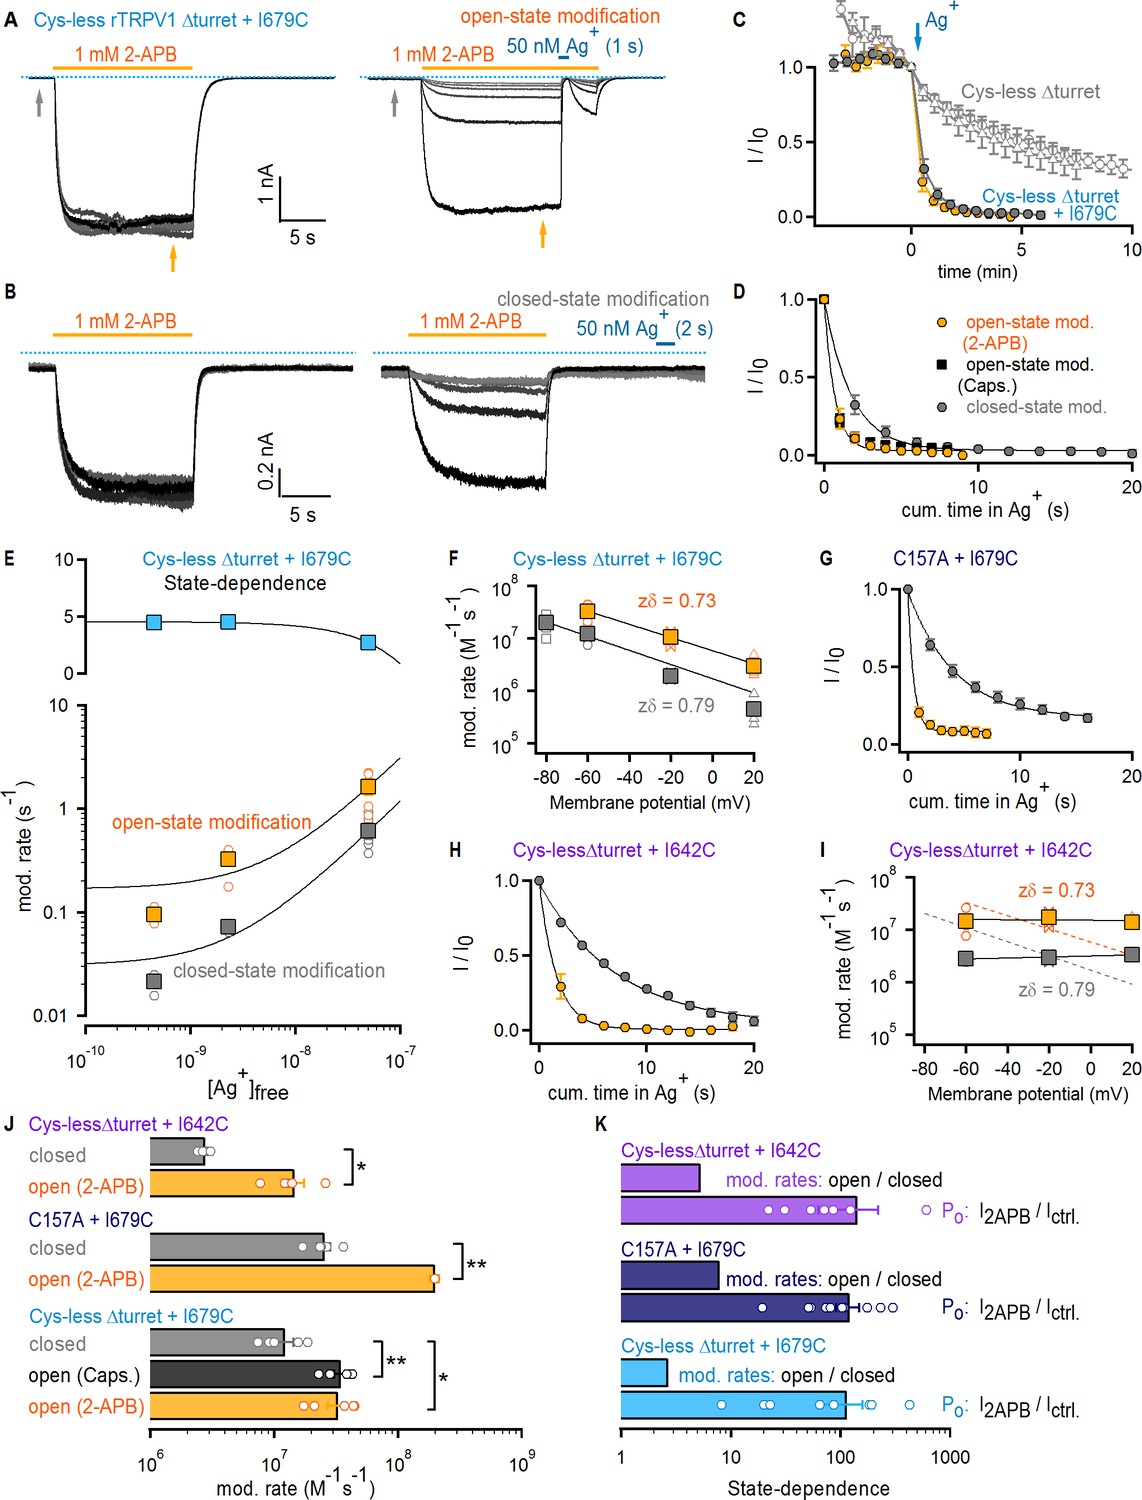
The selectivity filter of TRPV1 does not gate access to Ag+.
(A) Current traces of Cys- less Δturret rTRPV1 + I679C channels from a representative Ag+-modification experiment in the open state at – 60 mV. The first six traces on the left panel were obtained without exposure to Ag+, followed by an exposure of 1 s duration per trace shown on the right panel. Only the first six traces with Ag+-exposure are shown. The grayscale-intensity of each trace decreases with repetition number, with the first trace in black. The dotted blue lines denote the zero-current level. (B) Representative current traces from a Ag+-modification experiment in the closed state at – 60 mV, including the first six traces without exposure to Ag+ on the left panel, and the first six traces with an exposure to Ag+ of 2 s duration per trace on the right panel. (C) Mean Cys-less Δturret rTRPV1 + I679C time-courses for Ag+-modification at −60 mV in the open (yellow) or closed (gray) states from experiments as in (A) and (B), respectively, and plotted as a function of total experiment time. To only quantify the irreversible component of Ag+-inhibition, we plotted the steady-state currents in 2-APB before Ag+-application for each trace (yellow arrow in panel (A), right). t = 0 was set at the first sweep with Ag+-exposure (blue arrow) (mean ± SEM, n = 5), and was used to normalize each of the curves in the figure. The six data points before t = 0 correspond to the current values from the first recorded traces without exposure to Ag+ (see left panels in [A] and [B] and Figure 3—figure supplement 1A), and reflect rundown caused by the repeated activation and de-activation of channels. The open gray symbols are data from experiments as in (A) for Cys-less Δturret rTRPV1 exposed to Ag+ after t = 0 for 2 (triangles, n = 3) or 4 s (circles, n = 4) in the open state (see Figure 3—figure supplement 1A). (D) Mean time-courses of Ag+-modification in the open (yellow, 2-APB; black, capsaicin – see Figure 3—figure supplement 1B) and closed (gray) states at −60 mV obtained by plotting the data in (C) after t = 0 as a function of cumulative time in Ag+. Solid lines are fits to mono-exponential functions of time with parameters in (J). (E) Rates of modification in the open (yellow) and closed (gray) states obtained as in (A) and (B) at −60 mV and at different concentrations of free Ag+ (0.45 nM, 2.3 nM and 50 nM). The black curves are fits to a line with a slope of 2.94 × 10⁷ M-1 s-1(open state) or 1.16 × 10⁷ M-1 s-1 (closed state). The colored squares are the mean ± SEM (n = 5), and the open circles are data from individual experiments. Representative traces for modification experiments at the two lower Ag+ concentrations, as well as their corresponding time-courses of modification, are shown in Figure 3—figure supplement 4. The blue symbols in the upper panel are the ratios between the rates of modification in the open and closed states for each Ag+-concentration, with a fit to a line shown in black. (F) Rates of Cys-less Δturret rTRPV1 + I679C modification by Ag+ in the open (yellow) or closed (gray) states obtained from fits to data as in (D) at different voltages (see Figure 3—figure supplement 1C–F). The mean ± SEM are shown as squares (n = 5), and the rates from individual cells as open symbols. The black lines are fits to k(V)=k(0 mV) x exp(-zδ x VF/RT), with k(0)open = 5.8 x 10⁶ M−1s−1; k(0)closed = 1.7 x 10⁶ M−1s−1. (G) Mean time-courses of rTRPV1 C157A + I679C Ag+-modification in the open (yellow) or closed (gray) states at −60 mV (see Figure 3—figure supplement 1G,H for representative traces and the time-courses including the initial data points without exposure to Ag+) (mean ± SEM, n = 5). (H) Mean time-courses of Cys-less Δturret rTRPV1 + I642C Ag+-modification in the open (yellow) or closed (gray) states at −60 mV (see Figure 3—figure supplement 1I,J for representative traces and the time-courses including the initial data points without exposure to Ag+) (mean ± SEM, n = 5). (I) Rates of Cys-less Δturret rTRPV1 + I642C modification by Ag+ in the open (yellow) and closed (gray) states obtained from fits to data as in (H) at different voltages (see Figure 3—figure supplement 1I–K). The mean ± SEM are shown as squares (n = 5), and the rates from individual cells as open symbols. Fits as in (F) are shown for data from I679C (dotted curves) or I642C (black curves): k(0)open = 1.5 x 10⁷ M−1s−1; k(0)closed = 3.2 x 10⁶ M−1s−1. (J) Mean modification rates at −60 mV (bars, mean ± SEM, n = 5). Rates from individual experiments are shown as open circles. The asterisks denote statistical significance as estimated from a heteroscedastic two-tailed t-test, with * for p<0.05 and ** for p<0.01. (K) Ratios between the current magnitude in the presence and absence of 2-APB (I2APB/Ictrl, see yellow and gray arrows in (A); data pooled from all modification experiments in the open and closed states at −60 mV), or between the rate of modification in the open and closed states at −60 mV.
Figure 3—figure supplement 1
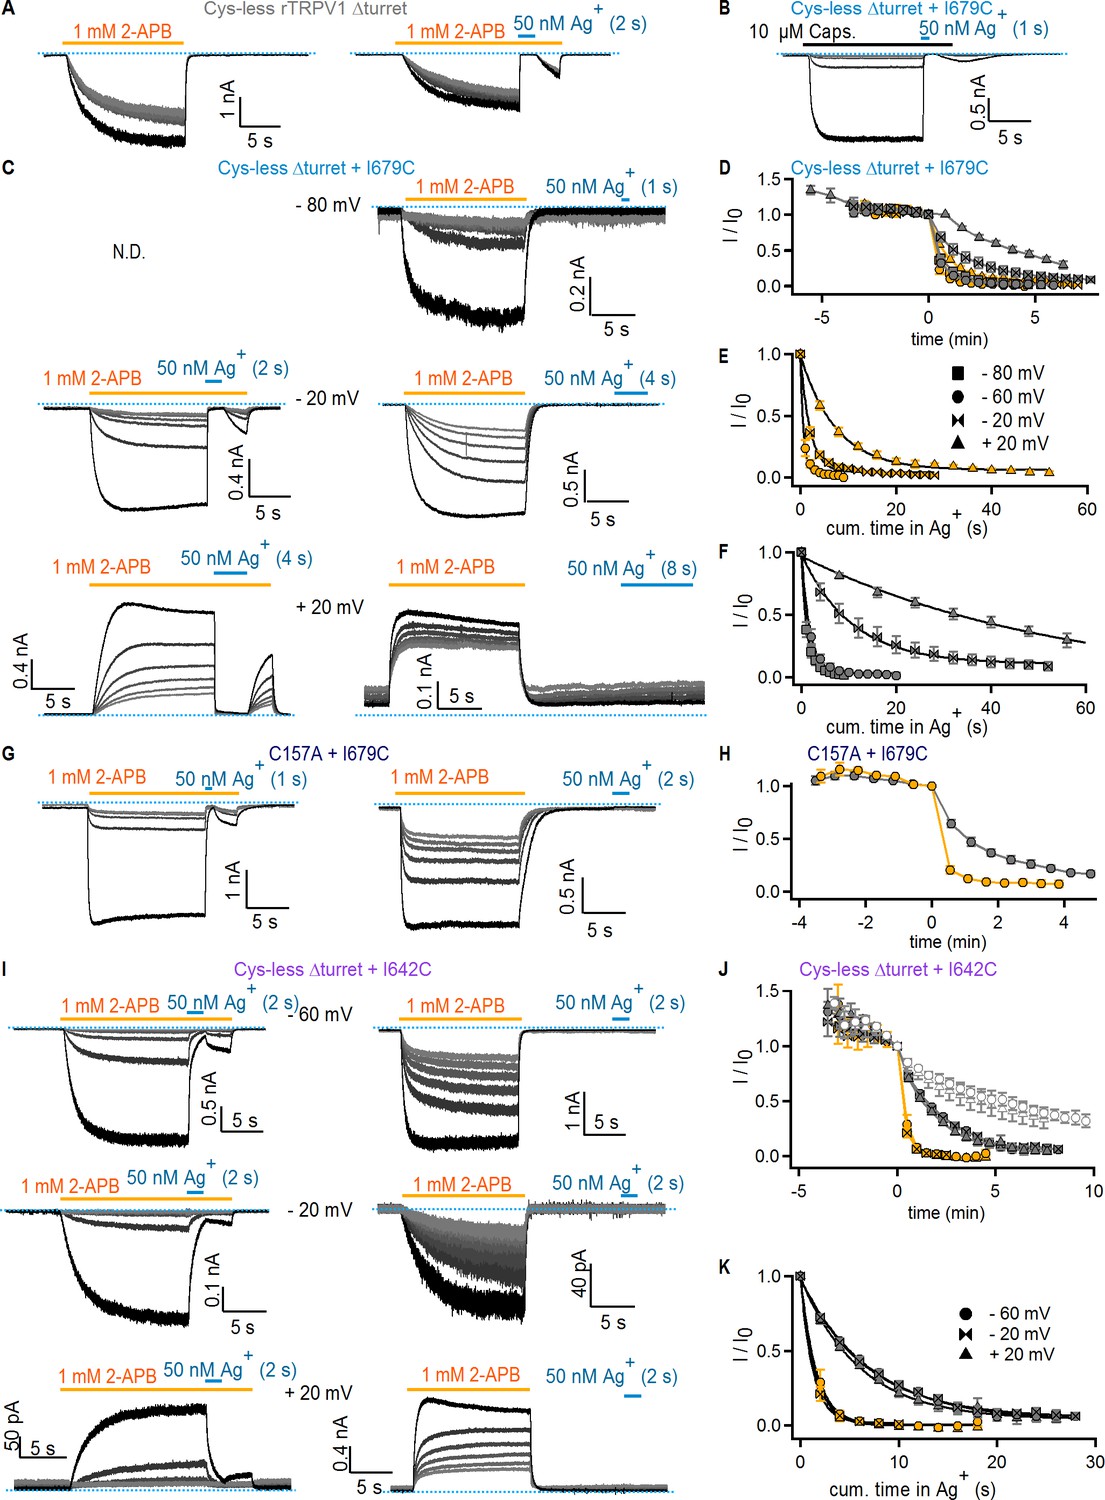
State-dependence of Ag+-accessibility in rTRPV1 channel mutants.
(A) Current traces of Cys-less Δturret rTRPV1 channels from a representative experiment at −60 mV with Ag+-exposure in the open state. The first six traces (left panel) were obtained to estimate rundown without Ag+-exposure upon cycles of activation (2-APB application, yellow line) followed by agonist washout. The cell was then (right panel) exposed to Ag+ for 2 s per sweep (horizontal blue line). Only the first six repetitions with Ag+-exposure are shown. For each panel, the grayscale-intensity of each trace decreases with repetition number, with the first recorded trace shown in black. The dotted blue lines denote the zero-current level. (B) Representative current traces of Cys-less Δturret rTRPV1 + I679C channels at −60 mV with Ag+-exposure in the open state stimulated by capsaicin. (C) Representative current traces of Cys-less Δturret rTRPV1 + I679C channels at various voltages with Ag+-exposure in the open (left panel) or closed states (right panel). Only the first six repetitions with Ag+-exposure are shown for each representative experiment. (D) Mean time-courses for Ag+-modification of Cys-less Δturret rTRPV1 + I679C channels at various voltages (check symbols in E) in the open (yellow) and closed (gray) states obtained from experiments as in (C) and Figure 3A–B, and plotted as a function of total experiment time, with t = 0 at the first sweep with Ag+-exposure (mean ± SEM, n = 5), which was used to normalize data for each individual time-course. The data-points at t < 0 represent the initial six traces obtained without Ag+-exposure. (E, F) Mean time-courses of Ag+-modification in the open (E) or closed (F) states at multiple voltages obtained by plotting the data in (D) as a function of cumulative time of exposure to Ag+ after t = 0. Solid lines are fits to mono-exponential functions of time, with obtained parameters shown in Figure 3F. Data shown as mean ± SEM (n = 5). (G) Current traces of rTRPV1 C157A + I679C channels from two representative experiments at −60 mV with Ag+-exposure in open (left panel) or closed (right panel) states. (H) Mean time-courses of Ag+-modification in the open (yellow) or closed (gray) states at – 60 mV obtained from data as in (G) and plotted as a function of total experiment time, with t = 0 at the first sweep with Ag+-exposure (mean ± SEM, n = 5), which was used to normalize data for each individual time-course. (I) Current traces of Cys-less Δturret rTRPV1 + I642C channels from representative experiments at various voltages with Ag+-exposure in the open (left panel) or closed states (right panel). (J) Mean time-courses for Ag+-modification of Cys-less Δturret rTRPV1 + I642C channels at various voltages in the open (yellow) and closed (gray) states obtained from experiments as in (I), and plotted as a function of total experiment time, with t = 0 at the first sweep with Ag+-exposure (mean ± SEM, n = 5), which was used to normalize data for each individual time-course. The data-points at t < 0 represent the initial six traces obtained without Ag+-exposure. The open symbols are data from experiments as in (A) for Cys-less Δturret rTRPV1 channels exposed to Ag+ for 2 (triangles, n = 3) or 4 s (circles, n = 4) per trace in the open state (representative experiment in A). (K) Mean time-courses of Ag+-modification of Cys-less Δturret rTRPV1 + I642C channels in the open (yellow) or closed (gray) states at multiple voltages obtained by plotting the data in (J) as a function of cumulative time of exposure to Ag+. Solid lines are fits to mono-exponential functions of time, with obtained parameters shown in Figure 3I. Data shown as mean ± SEM (n = 5).
Figure 3—figure supplement 2
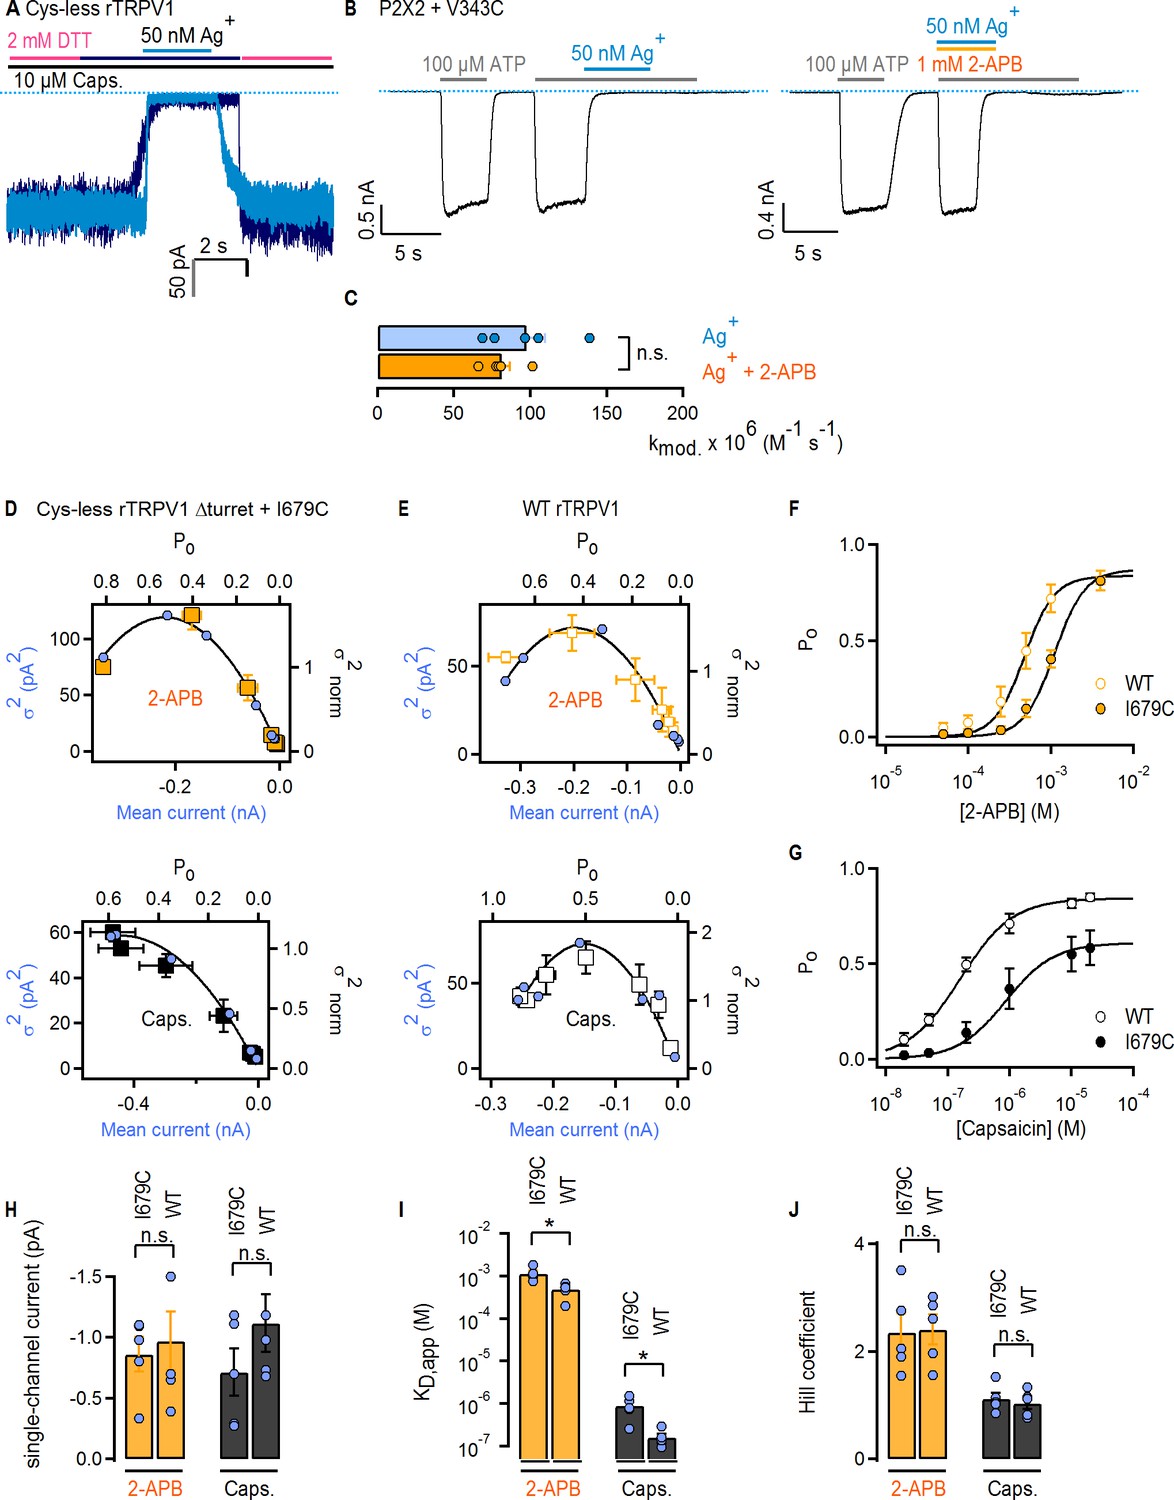
Characterizing experimental conditions for Ag+-modification experiments in cysteine-insertion constructs of TRPV1.
(A) Current traces from two representative experiments showing block by external Ag+-ions at −60 mV, with (dark blue trace) our without (light blue trace) treatment with 2 mM DTT (magenta lines). Exposure to Ag+ was longer in the experiment with DTT (dark blue line) than in the recording without DTT (light blue line). The blue dotted line denotes the zero-current level. (B) Two representative experiments at – 60 mV of ATP-activated currents (denoted by gray lines) from P2 × 2 + V343C-expressing cells exposed to external ATP and Ag+ (left panel) or ATP + Ag+ + 2-APB (right panel). The blue dotted line denotes the zero-current level. (C) Rates of Ag+ modification of P2 × 2 + V434C channels in the absence and presence of 2-APB. The rates were calculated as (1/τ) / [Ag+]free, where τ was obtained from the mono-exponential fits to time-courses as in (B), and [Ag+]free is the estimated concentration of free Ag+. The bars are the mean ± SEM (n = 5), and the circles are the rates from individual cells. No statistically-significant difference was detected (p=0.284; heteroscedastic two-tailed t-test). (D) Variance vs mean current relations for Cys-less Δturret rTRPV1 + I679C channels obtained from two representative noise-analysis experiments in the inside-out configuration at −60 mV (blue circles), using 2-APB (top panel) or capsaicin (bottom panel) as agonists. The black curve is a fit to Equation 1 (see Materials and methods). Mean normalized variance (σ2)-open probability (Po) relations are shown as squares, and were obtained by scaling the mean currents from individual experiments at the highest agonist concentration to the calculated Po (mean ± SEM in both axis, n = 5). (E) Mean normalized variance-Po relations (squares) and data from two representative noise-analysis experiments (blue circles) obtained at −60 mV from inside-out patches of WT rTRPV1-expressing cells activated by either 2-APB (top panel) or capsaicin (bottom panel) (mean ± SEM in both axis, n = 5). (F, G) Dose-response relations for 2-APB (F) or capsaicin (G) activation of Cys-less Δturret rTRPV1 + I679C (solid symbols) or WT rTRPV1 (empty symbols), obtained from the data in (D) or (E). Continuous curves are fits to the Hill equation with parameters in (I) and (J). (H) Single-channel current amplitudes at −60 mV obtained from noise-analysis experiments in inside-out patches. The mean ± SEM (n = 5) is given by the bars, and the circles are the values from individual experiments. No statistically-significant differences were detected (p2APB = 0.714; pcaps = 0.227; heteroscedastic two-tailed t-test). (I) Apparent dissociation constants for 2-APB or capsaicin activation of Cys-less Δturret rTRPV1 + I679C or WT rTRPV1 channels obtained from fits of the Hill equation to individual dose-response curves obtained from the noise-analysis data, as in (F) or (G). The mean ± SEM (n = 5) is given by the bars, and the circles are the values from individual experiments. The asterisks denote statistical significance (p2APB = 0.021 < 0.05; pcaps = 0.025 < 0.05; heteroscedastic two-tailed t-test). (J) Hill-coefficients for 2-APB or capsaicin activation of Cys-less Δturret rTRPV1 + I679C or WT rTRPV1 channels obtained from the same fits of the Hill equation as in (I). The mean ± SEM (n = 5) is given by the bars, and the circles are the values from individual experiments. No statistically-significant differences were detected (p2APB = 0.92; pcaps = 0.6; heteroscedastic two-tailed t-test).
Figure 3—figure supplement 3
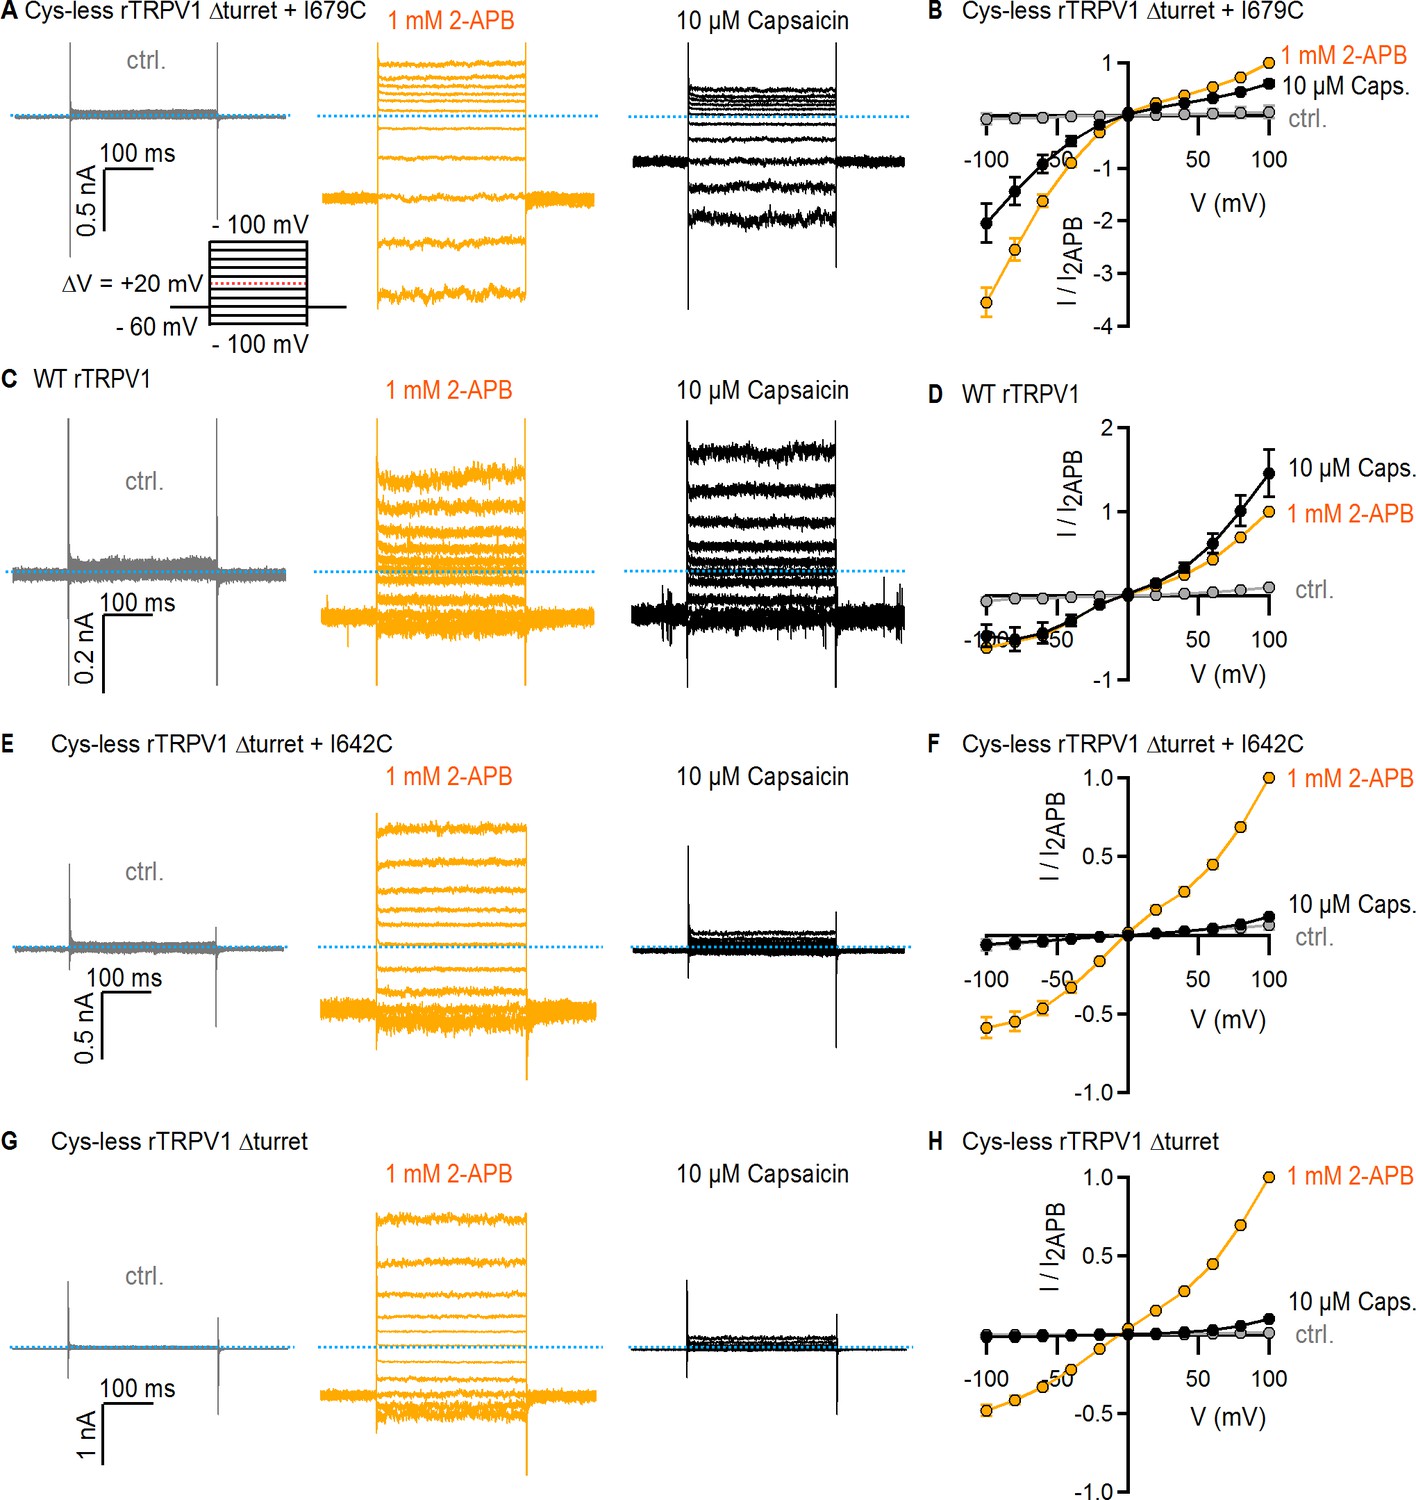
Current-voltage relations for TRPV1 constructs used in the Ag+-accessibility experiments.
(A) Representative superimposed current traces obtained from a cell expressing Cys-less Δturret rTRPV1 + I679C channels, elicited by voltage steps as indicated in the voltage protocol on the lower insert, and activated with 1 mM 2-APB or 10 µM capsaicin. The blue dotted line denotes the zero-current level. (B) Mean current-voltage relations obtained from current traces as in (A) from the steady-state current at each voltage and normalized to the current at +100 mV in the presence of 2-APB (mean ± SEM, n = 4). (C) Representative current traces obtained as in (A) from a WT rTRPV1-expressing cell. (D) Mean current-voltage relations for WT rTRPV1, obtained from traces as in (C) and normalized to the steady-state current value at +100 mV and 2-APB (mean ± SEM, n = 4). (E) Representative current traces obtained as in (A) from a cell expressing Cys-less Δturret rTRPV1 + I642C channels. (F) Mean current-voltage relations for Cys-less Δturret rTRPV1 + I642C channels obtained from traces as in (E) and normalized to the steady-state current value at +100 mV and 2-APB (mean ± SEM, n = 4). (G) Representative current traces obtained as in (A) from a cell expressing Cys-less Δturret rTRPV1 channels. (H) Mean current-voltage relations for Cys-less Δturret rTRPV1 channels obtained from traces as in (G) and normalized to the steady-state current value at +100 mV and 2-APB (mean ± SEM, n = 4).
Figure 3—figure supplement 4
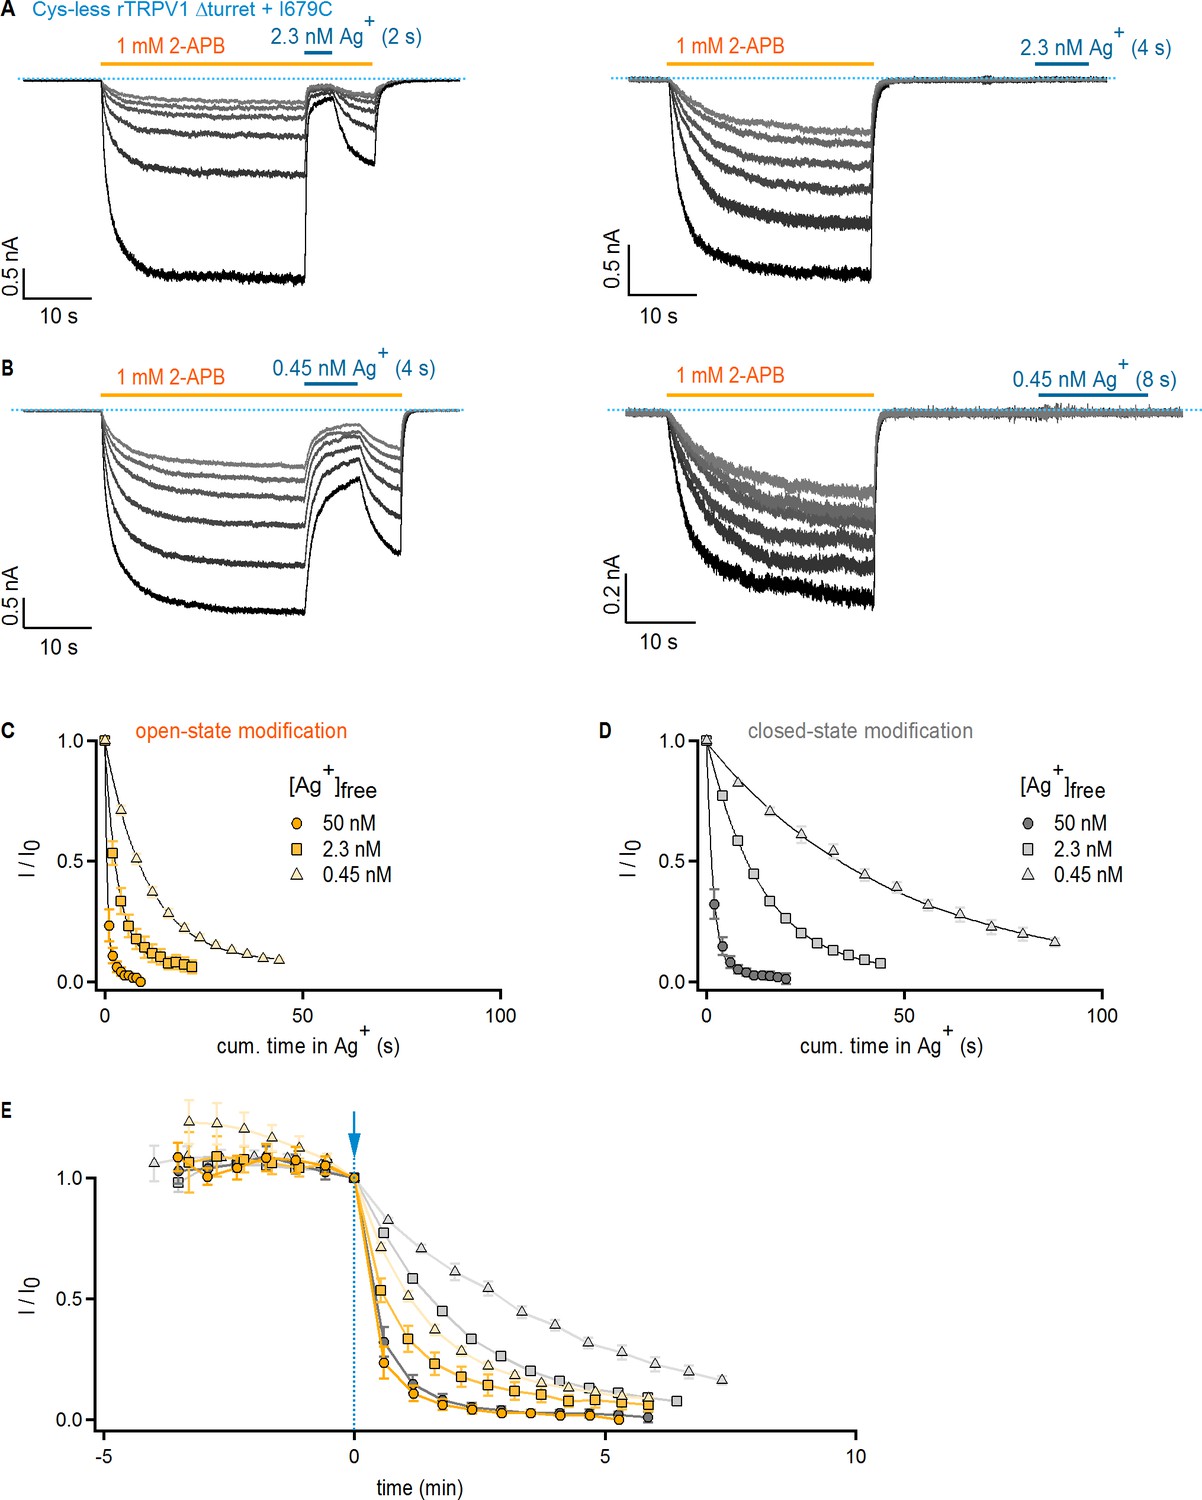
State-independent modification of Cys-less Δturret + I679C rTRPV1 channels at decreasing free Ag+ concentrations.
(A, B) Current traces of Cys-less Δturret + I679C rTRPV1 channels from four representative experiments at −60 mV with Ag+-exposure ([A], 2.3 nM free Ag+; [B], 0.45 nM free Ag+; thick blue horizontal lines) in the presence (left panels) or absence (right panels) of agonist (1 mM 2-APB, thick yellow horizontal lines). The blue dotted lines denote the zero-current level. (C, D) Mean time-courses of Ag+-modification in the open (C) or closed (D) states at −60 mV at three different free Ag+-concentrations obtained from data as in (A) and (B), normalized to steady-state current value in 2-APB right before the first exposure to Ag+. The black curves are fits to mono-exponential functions of time with rates shown in Figure 3E. Data are shown as mean ± SEM (n = 5). (E) Time-courses of modification by three distinct Ag+-concentrations in the open and closed states (data from C,D and Figure 3C) shown as a function of total recording time, including the initial six sweeps at t < 0 obtained without exposure to Ag+ to assess Ag+-independent rundown. The symbols are the same as in C and D. The blue arrow denotes t = 0, which is the first sweep in which cells were exposed to Ag+ and that was used to normalize each time-course.
Figure 3—figure supplement 5
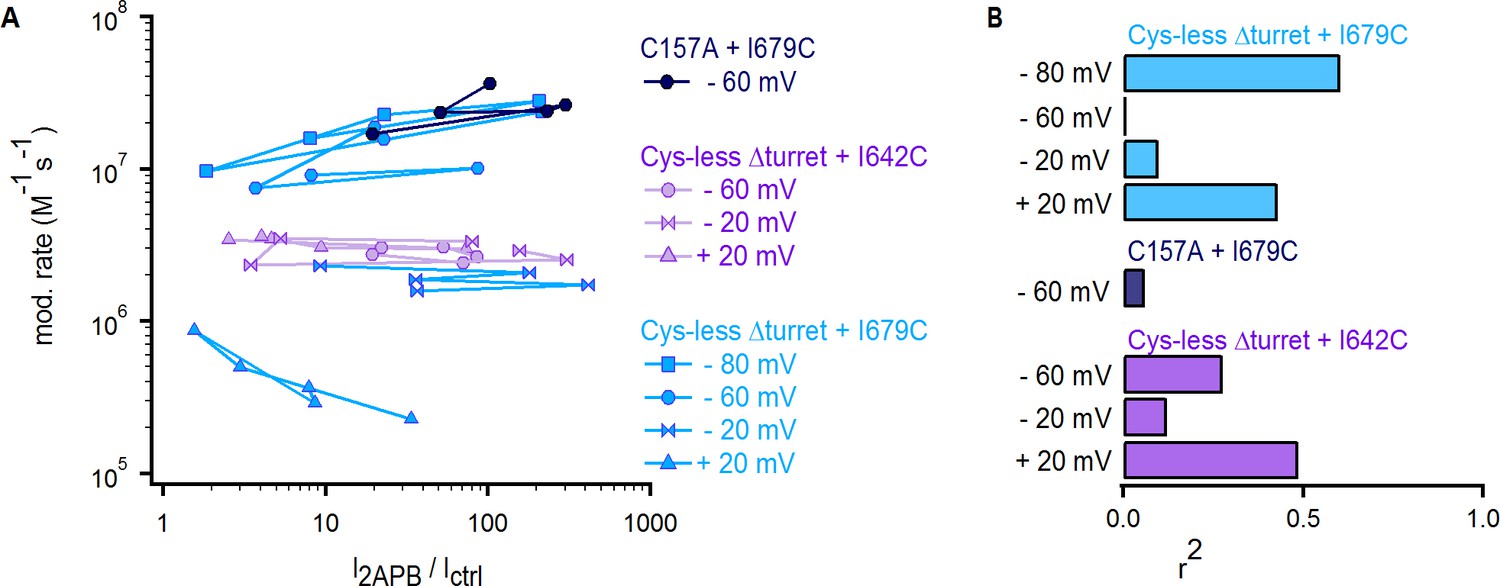
Lack of correlation between the rates of modification by Ag+ in the closed state and the estimated open probability of cysteine-insertion constructs of TRPV1.
(A) I2APB/Ictrl vs the corresponding rates of modification in the closed state at various membrane potentials for each individual experiment performed for Cys-less Δturret rTRPV1 + I679C (light blue), rTRPV1 C157A + I679C (dark blue) and Cys-less Δturret rTRPV1 + I642C (purple). (B) Correlation coefficients (r2) calculated from linear regressions to the data in (A) for each construct and voltage.
Figure 4
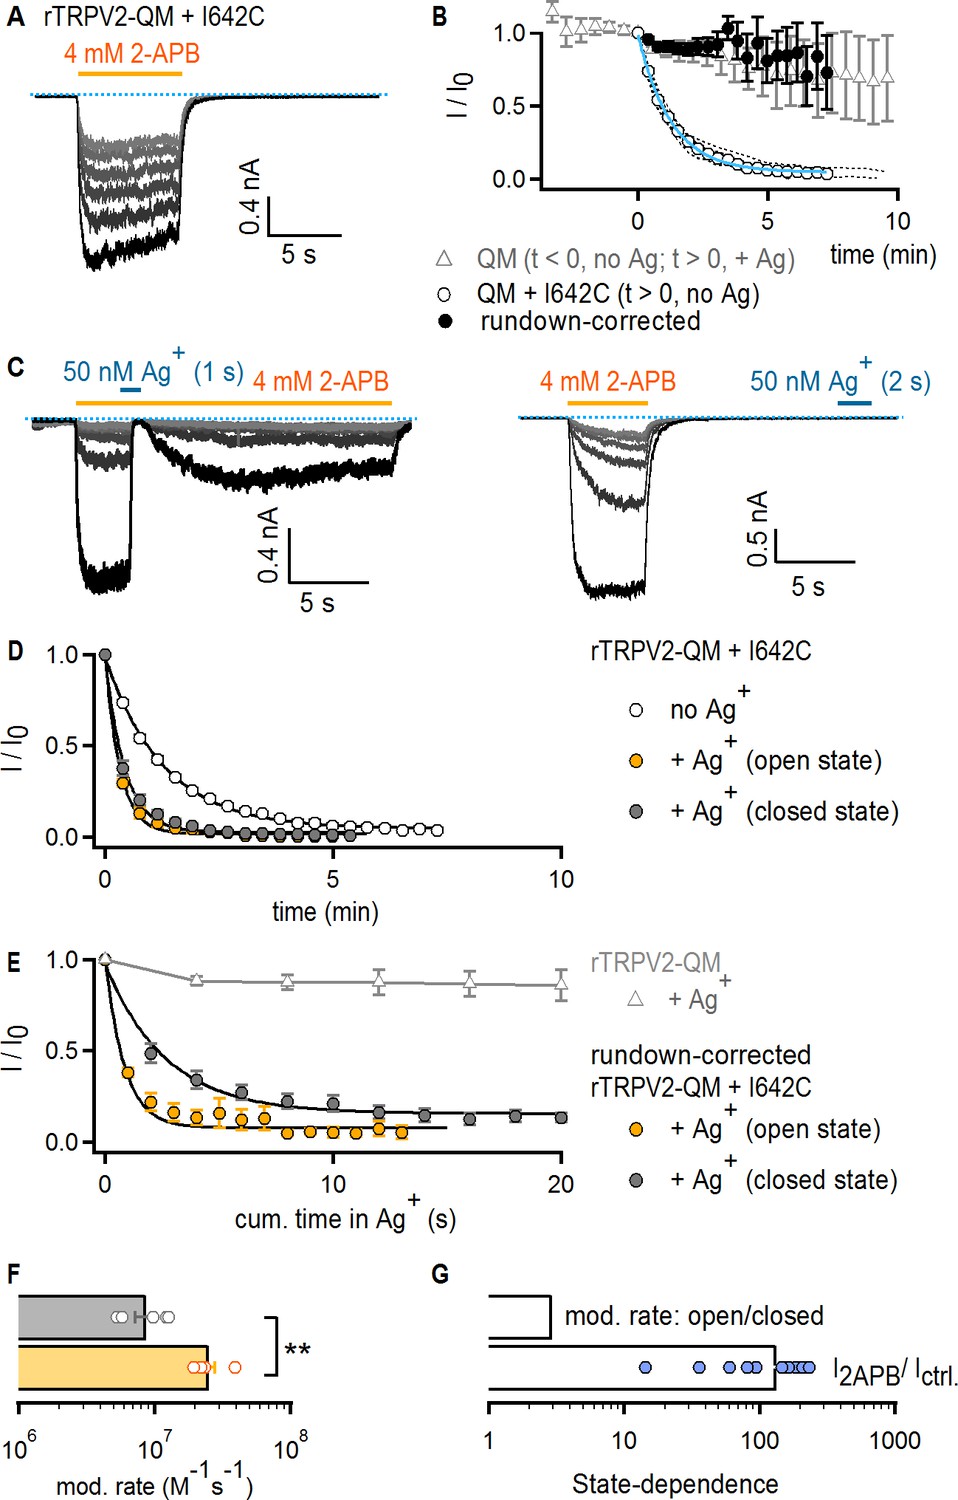
The TRPV2 channel does not gate access via the filter.
(A) Representative current traces obtained by repeatedly activating channels with 2-APB (yellow horizontal line) at −60 mV without any exposure to Ag+ in a cell expressing rTRPV2-QM + I642C channels. The first recorded sweep is shown in black, with the subsequent five stimulations with agonist shown in decreasing grayscale-intensity. The blue dotted line denotes the zero-current level. (B) The empty circles are the time course of spontaneous rTRPV2-QM + I642C channel current decay (i.e. no Ag+-exposure) obtained from experiments as in (A) (mean ± SEM, n = 10; individual experiments are shown as dotted curves), and fit with: Ifit(t) = (1–0.045) * exp(-t/84.57 s) + 0.045 (blue curve). The filled black symbols are the resulting mean time course for rTRPV2-QM + I642C (and no Ag+-exposure) after correcting each individual experiment for rundown using the exponential fit in blue (see Materials and methods). The time course for rTRPV2-QM (without any cysteine insertions) is shown in empty gray triangles (mean ± SEM, n = 9; see Figure 5—figure supplement 1A for representative current traces). For this construct, data at t < 0 correspond to the steady-state current values in 2-APB from the first six sweeps recorded without exposing cells to Ag+, whereas data at t > 0 correspond to subsequently recorded sweeps in which cells were exposed to Ag+ for 4 s per sweep in the presence of agonist. The data point at t = 0, right before the first exposure to Ag+ was used for normalization. (C) Representative rTRPV2-QM + I642C current traces stimulated with 2-APB (yellow thick lines) and exposed to Ag+ (blue thick lines) in the open (left panel) or closed (right panel) states at – 60 mV. The blue dotted line denotes the zero-current level. (D) Mean time-courses for Ag+-modification in the open (yellow) or closed (gray) states (mean ± SEM, n = 5), together with the spontaneous current decrease measured from the same construct in experiments where cells are not exposed to Ag+ (open circles, same data as in B). (E) Mean rundown-corrected time-courses for Ag+-modification (see Materials and methods) in the open (yellow) and closed (gray) states as a function of cumulative time in Ag+. The black curves are fits to mono-exponential functions, with parameters in (F). Empty gray triangles represent the data for TRPV2-QM + Ag+ shown in (B) for t ≥ 0. (F) Mean rates of rTRPV2-QM + I642C modification in the open (yellow) and closed (gray) states obtained from mono-exponential fits to data as in (E). Bars are the mean ± SEM, with rates from individual experiments shown as open symbols (n = 5). The asterisks denote statistical significance as estimated from a heteroscedastic two-tailed t-test (p=0.001 < 0.01). (G) Ratios between the steady-state current magnitudes in the presence and absence of 2-APB (I2APB / I ctrl.; pooled from all modification experiments in the closed and open states), or between the rate of modification in the open and closed states as shown in (F).
Figure 5 with 1 supplement
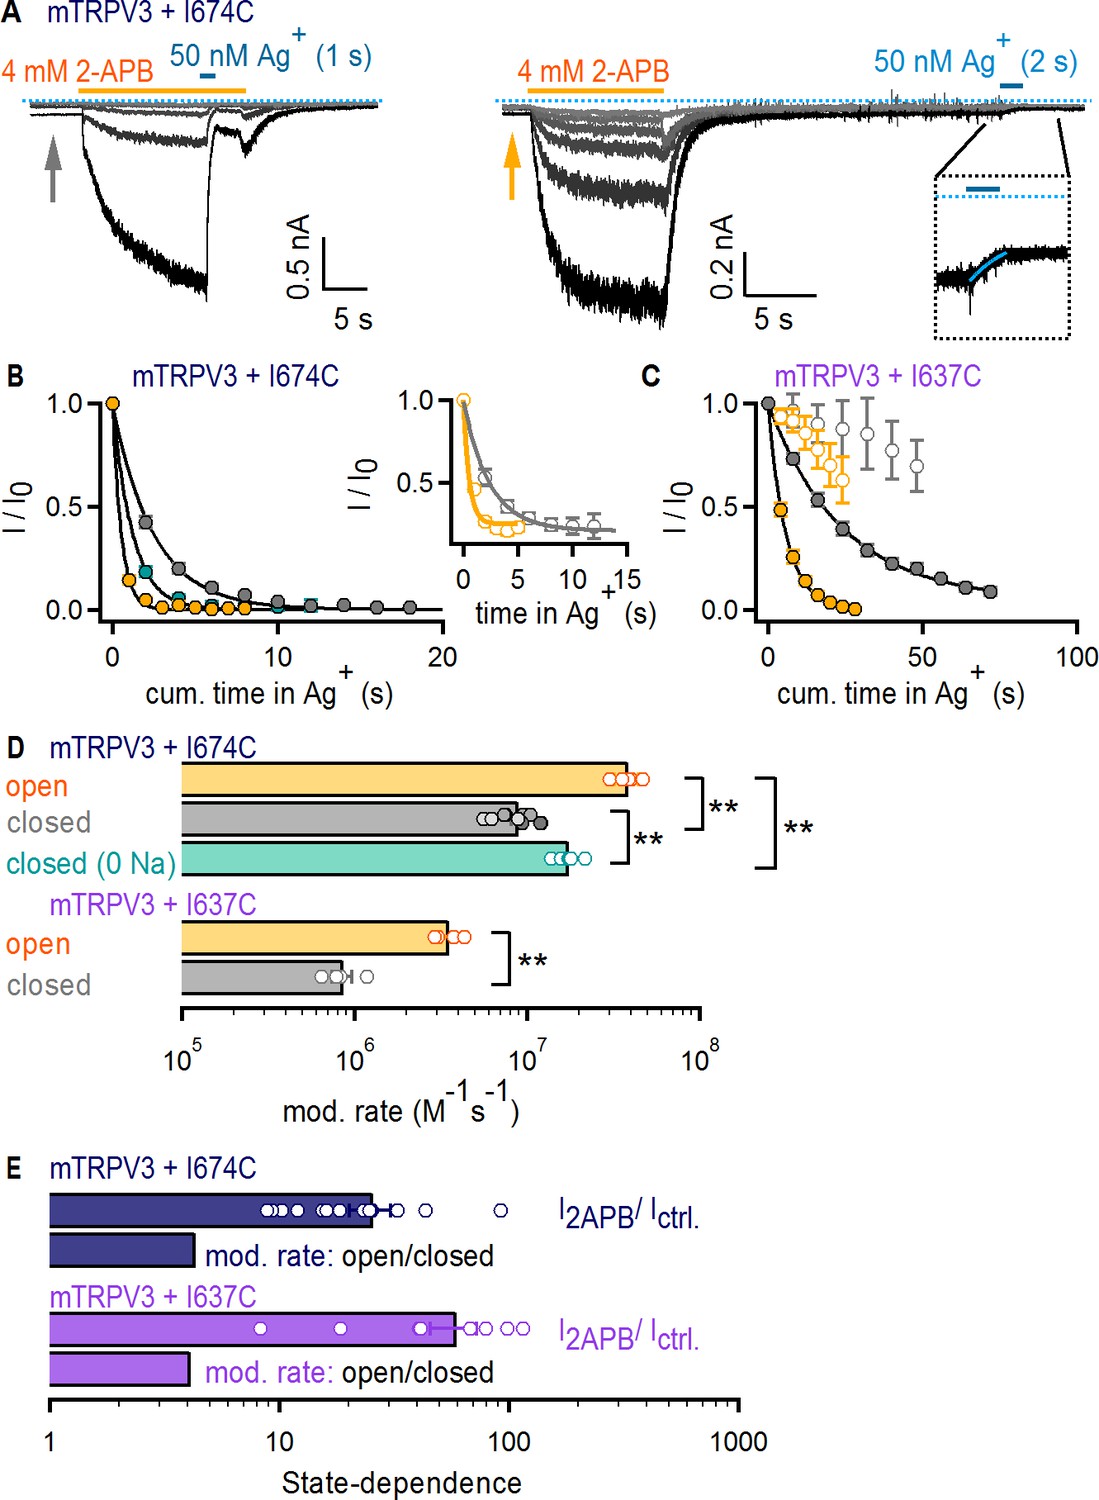
The filter does not function as an activation gate in the TRPV3 channel.
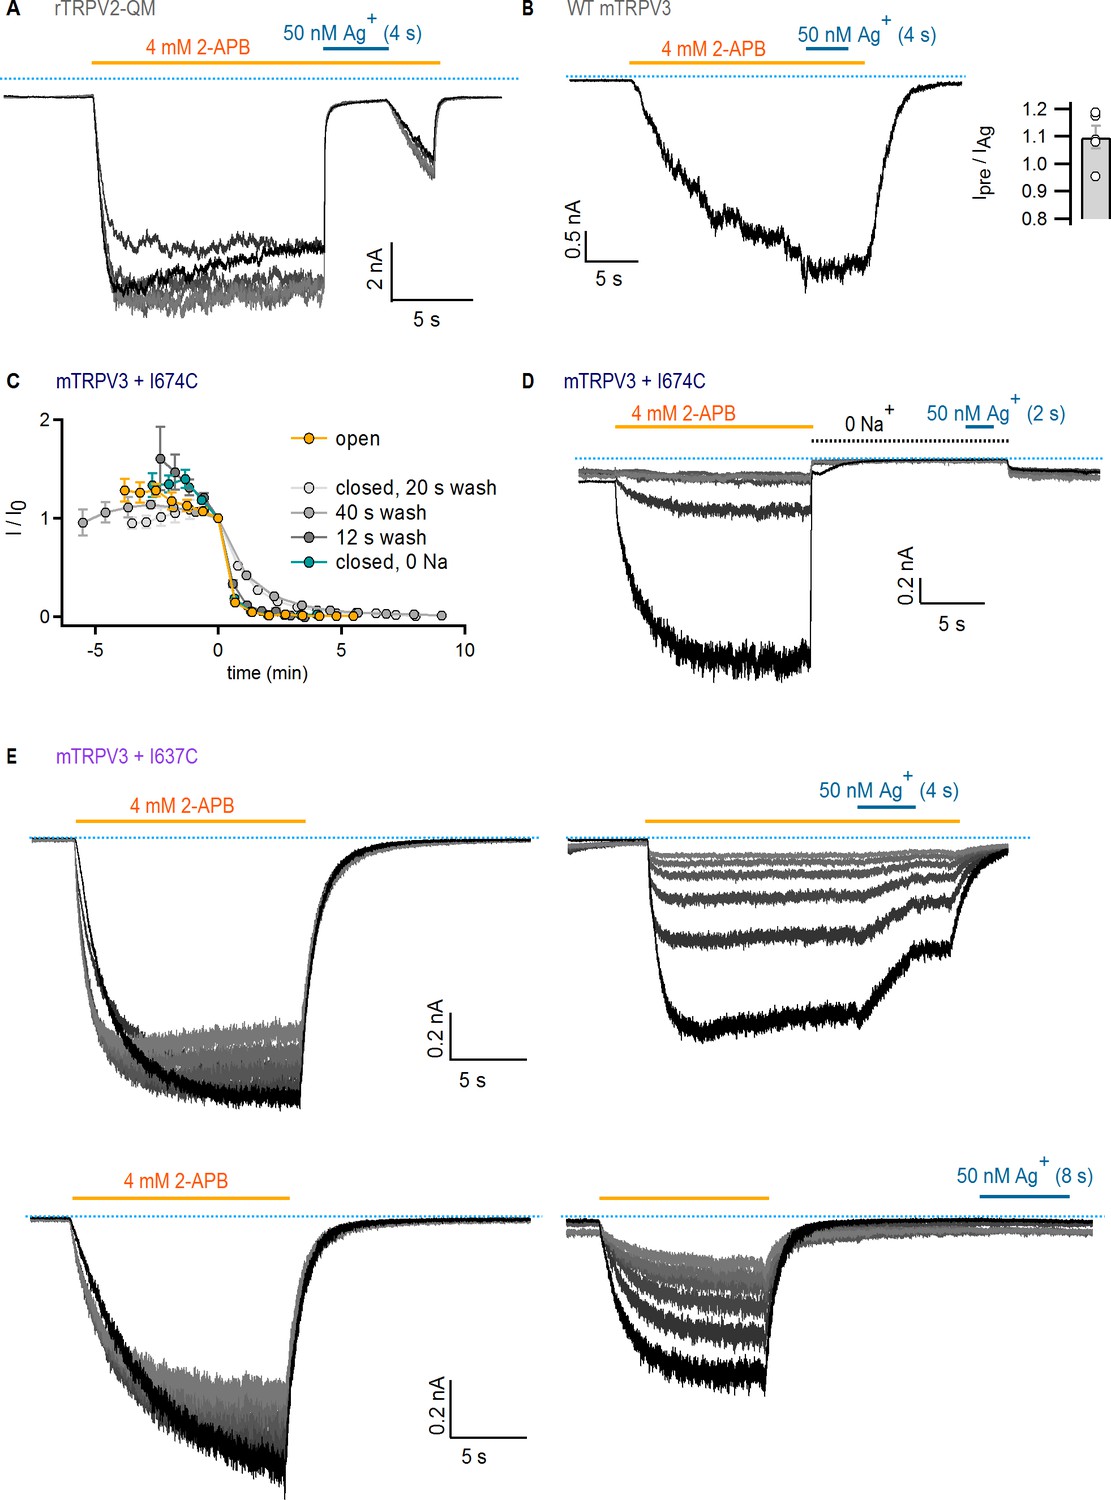
(A) Current traces of mTRPV3 + I674C channels stimulated with 2-APB (yellow thick lines) from representative Ag+-modification experiments in the open (left panel) or closed (right panel) states at – 60 mV. The zoomed view at the insert shows the Ag+-dependent decrease in baseline current at the first sweep, fit with a mono-exponential function in blue. The blue dotted line denotes the zero-current level. (B) Mean time-courses for Ag+-modification in the open (yellow) and closed (gray) states as a function of cumulative time in Ag+ (mean ± SEM, n = 5–9; see Figure 5—figure supplement 1C for the time courses that include the first six initial recordings at t < 0 in each experiment, which were obtained without exposing cells to Ag+). The turquoise symbols are data for Ag+-modification in the closed state in the absence of external Na+ (mean ± SEM, n = 6; see Figure 5—figure supplement 1D for representative current traces, and Figure 5—figure supplement 1C for the full time-course with data at t < 0). The black curves are fits to mono-exponential functions of time with associated rate-constants shown in (D, top panel). The insert shows the mean time courses for modification in the open (yellow) and closed (gray) states calculated from the baseline currents (gray and yellow arrows in A) (mean ± SEM, n = 7). (C) Mean time-courses for Ag+-modification of mTRPV3 + I637C channels in the open (filled yellow symbols) and closed (gray filled symbols) states as a function of cumulative time in Ag+ (mean ± SEM, n = 5). The black curves are fits to mono-exponential functions, with associated rate constants shown in (D) (see Figure 5—figure supplement 1E for representative current traces). The open symbols represent the initial six traces obtained without exposing cells to Ag+ (Figure 5—figure supplement 1E, left panel). (D) Modification rates for mTRPV3 channel mutants. The mean ± SEM are shown as bars (n = 5–9), with rates from individual cells shown as open circles. The asterisks denote statistical significance as estimated from a heteroscedastic two-tailed t-test, with ** for p<0.01. (E) Ratios between the steady-state current magnitude in the presence and absence of 2-APB (I2APB / I ctrl., pooled from all recordings in the closed and open states), or between the rates of modification in the open and closed states shown in (D).
Figure 5—figure supplement 1
State-dependence of Ag+-accessibility in TRPV2 and TRPV3 channels with substituted cysteines.
(A) Current traces of rTRPV2-QM channels from a representative experiment at −60 mV with Ag+-exposure in the open state. Only the first six sweeps are shown. The grayscale-intensity of each trace decreases with repetition number, with the first recorded trace shown in black. The dotted blue lines denote the zero-current level. (B) Representative current recording at −60 mV showing a lack of effect of external Ag+-ions on WT mTRPV3 channels. The bar at the insert to the right shows the mean ± SEM (n = 5) for the ratio of current magnitudes before and during Ag+-exposure, and the data from individual experiments are shown as open symbols. (C) Mean time-courses for Ag+-modification of mTRPV3 + I674C channels at −60 mV in the open (yellow) and closed states obtained from the steady-state currents in 2-APB from experiments as in (D) and Figure 5A, and plotted as a function of total experiment time, with t = 0 at the first sweep in which cells were exposed to Ag+ (mean ± SEM; open state, n = 5; closed state with 150 mM external Na+, n = 3–4, see below; closed state with 0 M external Na+, n = 6). The data-points at t < 0 represent six initial traces obtained in each experiment in which cells were not exposed to Ag+. All experiments were normalized to the steady-state current value at t = 0. Three different protocols were used for modification experiments in the closed state, with 2-APB washout periods of 12 s (n = 3), 20 s (n = 3) and 40 s (n = 4). (D) Current traces of mTRPV3 + I674C channels from a representative experiment at −60 mV with Ag+-exposure in the closed state (right panel), applied in the absence of external Na+ ions. For the length of the black dotted line, a solution where all Na+ was substituted with NMDG+ was used. Only the first six repetitions with Ag+-exposure are shown, with the first recorded in black and subsequent sweeps in decreasing grayscale intensity. The dotted blue lines denote the zero-current level. (E) Current traces of mTRPV3 + I637C channels from two representative experiments at −60 mV with Ag+-exposure in the open (top panel) or closed (bottom panel) states. The first six traces in each experiment (left panels) were obtained to estimate rundown without Ag+-exposure. The cells were then exposed to Ag+ for 4 s per sweep (horizontal blue line, right panels). Only the first six repetitions with and without Ag+-exposure are shown. For each panel, the grayscale-intensity of each trace decreases with repetition number, with the first recorded trace shown in black. The dotted blue lines denote the zero-current level.
Figure 6 with 1 supplement
Large organic cations permeate through the filter of TRPV1.
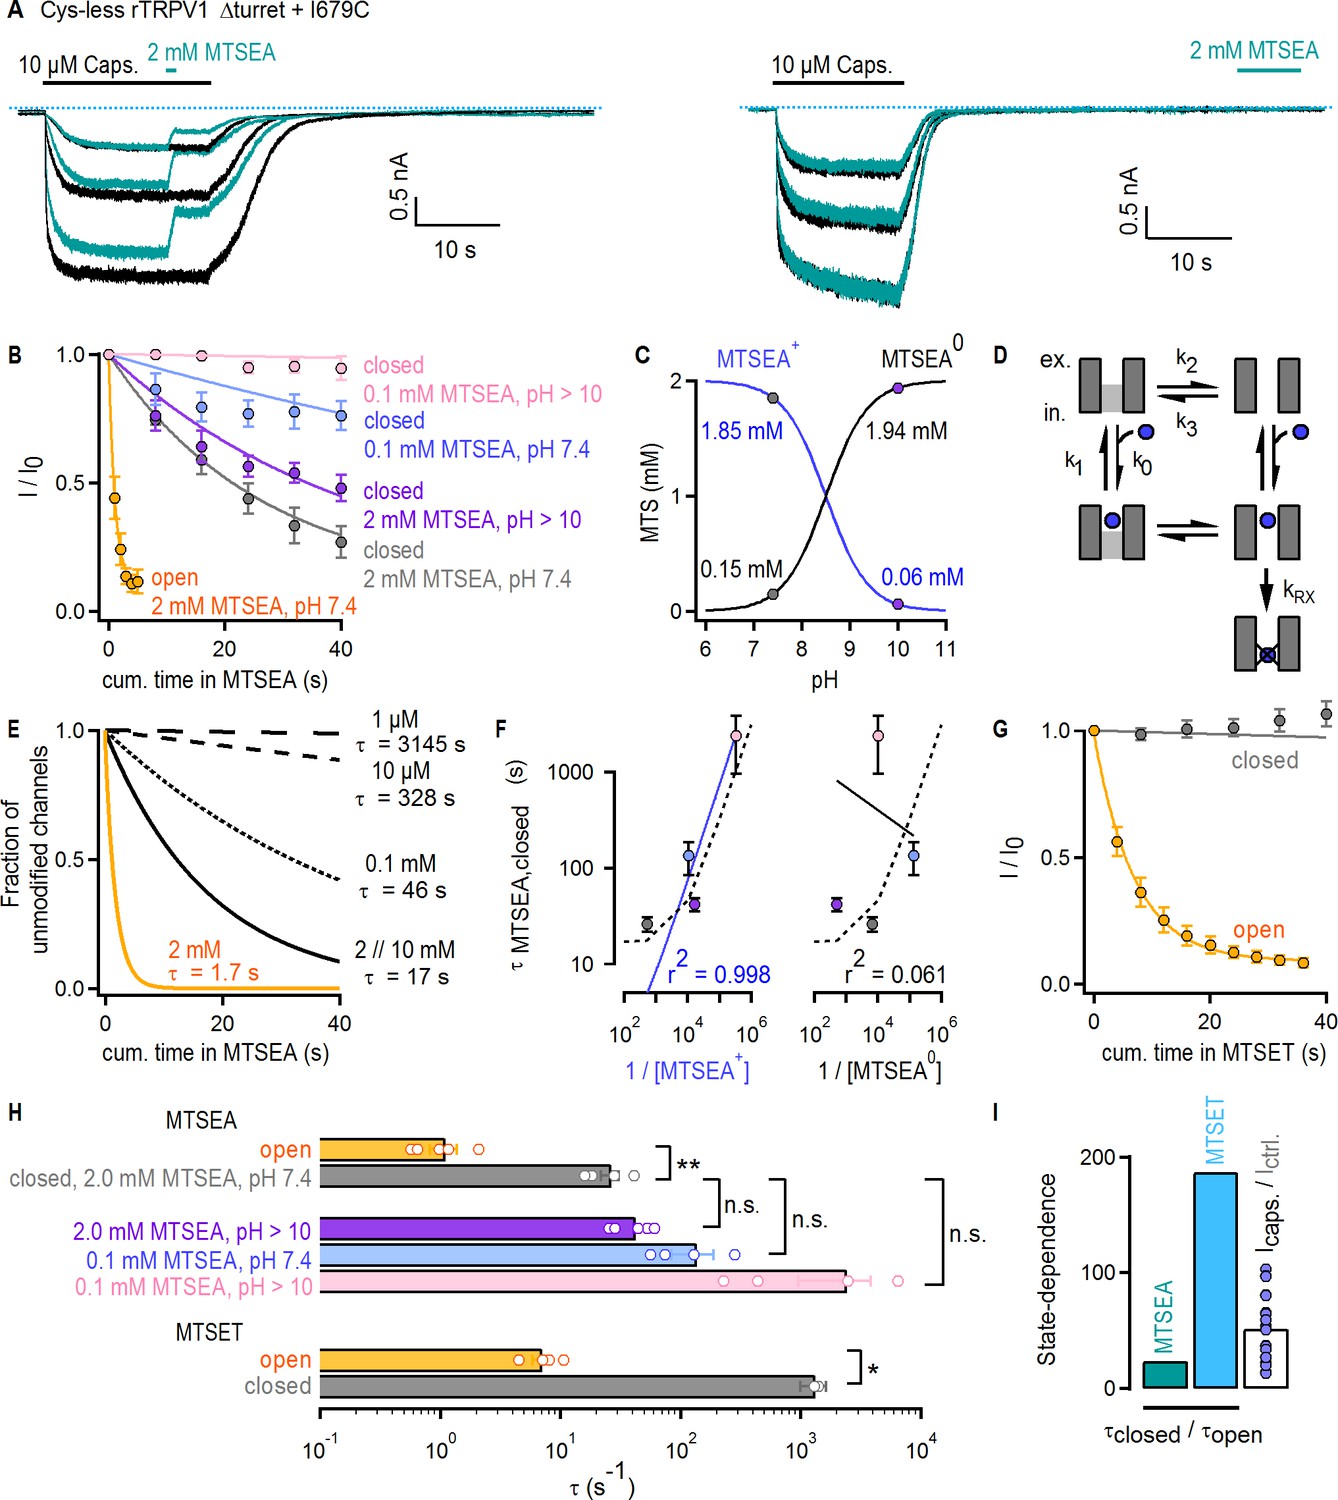
(A) Current traces of Cys-less Δturret rTRPV1 + I679C channels activated by capsaicin (thick black horizontal lines) from representative MTSEA-modification experiments in the open (left panel) or closed (right panel) states at – 60 mV. Recordings without (black traces) or with MTSEA exposure (turquoise traces) were acquired in an alternate fashion in the same experiment. The blue dotted lines denote the zero-current level. (B) Mean time-courses for MTSEA-modification as a function of cumulative time in MTSEA in the open (yellow) or closed states (mean ± SEM, n = 5 for 2 mM MTSEA; n = 4 for 0.1 mM MTSEA). All time-courses were corrected for rundown (see Materials and methods and Figure 6—figure supplement 1D for the time-courses depicting data before rundown correction and the time courses for rundown alone). The continuous curves are fits to mono-exponential functions of the form: Inorm(t)=0.9 x exp(-t/τ) + 0.1, with associated time-constants (τ) shown in (F) and (H). (C) Approximate concentrations of protonated (MTSEA+) and de-protonated (MTSEA0) MTSEA as a function of pH and a pKa = 8.5 (Holmgren et al., 1996) from 2 mM total MTSEA. The gray and purple circles mark the estimated concentration of each species at the pH in which experiments were done (either 7.4 or ~10). (D) Model for MTSEA-modification of TRPV1 channels. MTSEA (blue circle) binding and unbinding is given by rate constants k0 x [MTSEA] and k1, respectively. The equilibrium between two distinct channel states has rate constants k2 and k3. The rate of irreversible cysteine modification by MTSEA is given by kRX. (E) Time-courses of modification by different MTSEA concentrations predicted by the model in (D), with parameters: k0 = 0.5×10⁵ M−1s−1 and k1 = 50 s−1; ‘with agonist’, k2 = 0.6 s−1 and k3 = 10 s−1 (yellow curve, [MTSEA]=2 mM); ‘no agonist’, k2 = 0.06 s−1 and k3 = 10 s−1 (black curves); kRX = 500 s−1. MTSEA concentrations are shown to the right of the curves, together with the corresponding time-constant obtained from fits to a mono-exponential function of time as in (B). (F) Time-constants of modification in the closed state obtained from fits to data as in (B), plotted as a function of the inverse of the concentration of either of the two MTSEA species as calculated for each experimental condition (see Materials and methods) following the color-scheme in (B). The continuous curves are fits to a line, with the corresponding coefficient of determination (r2) shown at the bottom of the graph. The dashed lines are the values from the model in (D and E). (G) Mean time-courses for MTSET-modification as a function of cumulative time in MTSET in the open (yellow) or closed (gray) states at −60 mV (mean ± SEM, n = 5; see Figure 6—figure supplement 1E for representative current traces). Data for modification in the closed state was corrected for rundown (see Materials and methods and Figure 6—figure supplement 1F for the time-courses depicting data before rundown correction and the time courses for rundown alone). The continuous curves are fits to mono-exponential functions of time, with associated time constants shown in (H). (H) Time-constants (τ) for MTSEA or MTSET modification obtained from fits to data as in (B) or (G). The bars are the mean ± SEM, and the open circles are data from individual experiments (n = 5 for 2 mM MTSEA and MTSET; n = 4 for 0.1 mM MTSEA). Statistical significance between different data-sets was assessed from heteroscedastic two-tailed t-tests, with n.s. (non-significant) for p>0.05, * for p<0.05 and ** for p<0.01. (I) Ratios between time-constants of MTSEA (2 mM, pH 7.4) or MTSET modification in the closed and open states, as shown in (H), or between the steady-state current magnitude in capsaicin vs control conditions (i.e. no agonist) (mean ± SEM, n = 16). Blue circles are data from individual cells.
Figure 6—figure supplement 1
MTSEA and MTSET modification of TRPV1 channels with substituted cysteines at position 679.
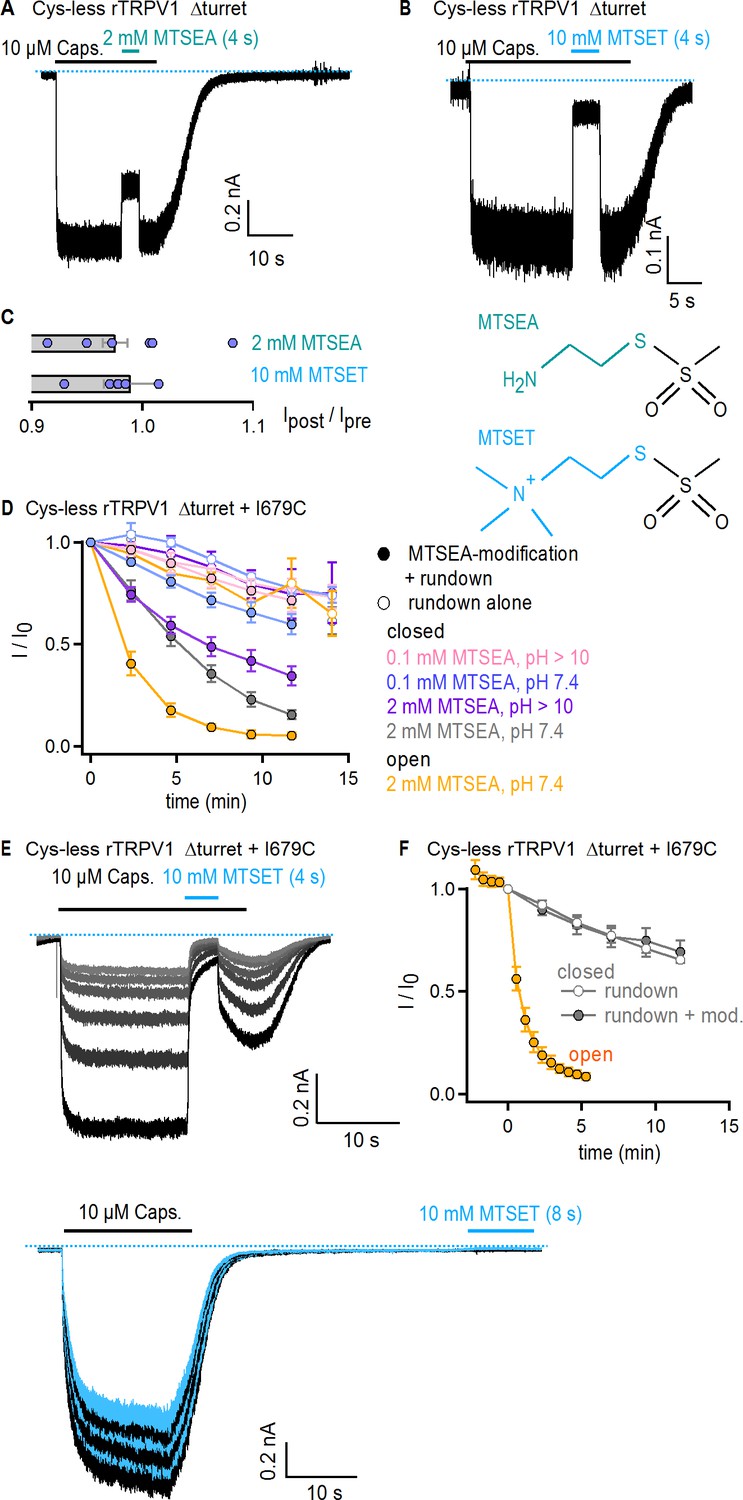
(A–B) Representative current traces showing reversibility of block of Cys-less Δturret rTRPV1 channels by external MTSEA (A) or MTSET (B) at −60 mV in the presence of capsaicin. The blue dotted line denotes the zero-current level. (C, left) The bars show the mean ± SEM (n = 6) for the ratio of current magnitudes before and after MTS-reagent exposure, and the data from individual experiments are shown as open symbols. (C, right) Scheme of an MTSEA (top) or MTSET (bottom) molecule. The colored moieties become covalently attached to cysteines upon reaction. (D) Mean time-courses for Cys-less Δturret rTRPV1 + I679C channels stimulated with capsaicin and plotted as a function of total experiment time with one data point per trace measured from the steady-state current amplitude in capsaicin (mean ± SEM, n = 4–5). Time courses from traces in which the cells were exposed to MTSEA in either the open or closed states are shown as filled symbols (see turquoise traces in Figure 6A) and represent the decrease in current due to both rundown and covalent cysteine modification by MTSEA, and those from traces without exposure to MTSEA (see black traces in Figure 6A) are shown as empty symbols and represent the current decrease due to rundown alone. (E) Current traces of Cys-less Δturret rTRPV1 + I679C channels from two representative experiments at −60 mV with MTSET-exposure in the open (top panel) or closed (bottom panel) states. Only the first six repetitions with MTSET-exposure are shown for modification in the open state. The grayscale-intensity of traces decreases with repetition number, with the first recorded trace shown in black. In the MTSET-modification experiments in the closed state, current recordings without (black traces) or with MTSET exposure (blue traces) were acquired in an alternate fashion, with only the first six traces shown. The dotted blue lines denote the zero-current level. (F) Mean time-courses for Cys-less Δturret rTRPV1 + I679C channels stimulated with capsaicin and plotted as a function of total experiment time with one data point per trace measured from the steady-state current amplitude in capsaicin (mean ± SEM, n = 5). The time course from traces in which the cells were exposed to MTSET in the closed state (see blue traces in E) are shown as filled gray symbols, and represent the decrease in current caused by both rundown and covalent cysteine modification by MTSET, whereas the time course obtained from traces without exposure to MTSET (see black traces in E) is shown with empty gray circles and represents the decrease in current due to rundown alone. For modification by MTSET in the open state, the data at t < 0 represent four initial recordings obtained without any exposure to MTSET, followed by exposures of 4 s duration per sweep after t = 0.
Figure 7

The external pore region could function as an actuator for TRP channel activation.
In the absence of activating stimuli, the gating equilibrium of the TRPV1 channel is shifted towards the closed state; in most channels from a large ensemble, the S6 helix gate prevents permeation, whereas the selectivity filter (S.F.) is in a dynamic equilibrium between different conformations (gray/white shading) that still enable access of extracellular metal cations into the inner cavity. Upon stimulation, the conformational equilibrium of the outer pore shifts to favor a distinct set of conformations (orange/white shading) that may have a wider opening of the filter that facilitates access of large extracellular organic cations. We propose that this conformational shift within the selectivity filter and the external pore of the channel that occurs upon stimulation also contributes to stabilizing the open state of the S6 gate, effectively serving as an actuator for stimuli that interact with the extracellular surface of the channel.
Additional files
-
Supplementary file 1
TRP channel structures used in the structural alignment of the pore domain.
All TRP channel structures included in the alignment are listed, indicating the PDB ID, the name of the channel, the DOI for the manuscripts where each structure is described, and the name of the species from which the proteins were cloned.
- https://cdn.elifesciences.org/articles/51212/elife-51212-supp1-v2.xlsx
-
Transparent reporting form
- https://cdn.elifesciences.org/articles/51212/elife-51212-transrepform-v2.pdf
Download links
A two-part list of links to download the article, or parts of the article, in various formats.
Downloads (link to download the article as PDF)
Open citations (links to open the citations from this article in various online reference manager services)
Cite this article (links to download the citations from this article in formats compatible with various reference manager tools)
The ion selectivity filter is not an activation gate in TRPV1-3 channels
eLife 8:e51212.
https://doi.org/10.7554/eLife.51212


