Defective lytic transglycosylase disrupts cell morphogenesis by hindering cell wall de-O-acetylation in Neisseria meningitidis
- Unité Biologie et Génétique de la Paroi Bactérienne, Institut Pasteur; Groupe Avenir, INSERM 75015, France
- Tumour Immunology and Immunotherapy, Institut Gustave Roussy, France
- Unité des Infection Bactériennes Invasives, Institut Pasteur, France
- Universté Paris Descartes, Sorbonne Paris Cité, France
- Department of Medical Microbiology and Immunology, University of Wisconsin-Madison, United States
- Unité Technologie et Service BioImagerie Ultrastructural, Institut Pasteur, France
- Unité Technologie et Service Spectrométrie de Masse pour la Biologie, Institut Pasteur; UMR 3528, CNRS 75015, France
- Plate-forme de Cristallographie-C2RT, Institut Pasteur; UMR3528, CNRS 75015, France
- Department of Microbiology, Harvard Medical School, United States
Figures
Figure 1 with 2 supplements
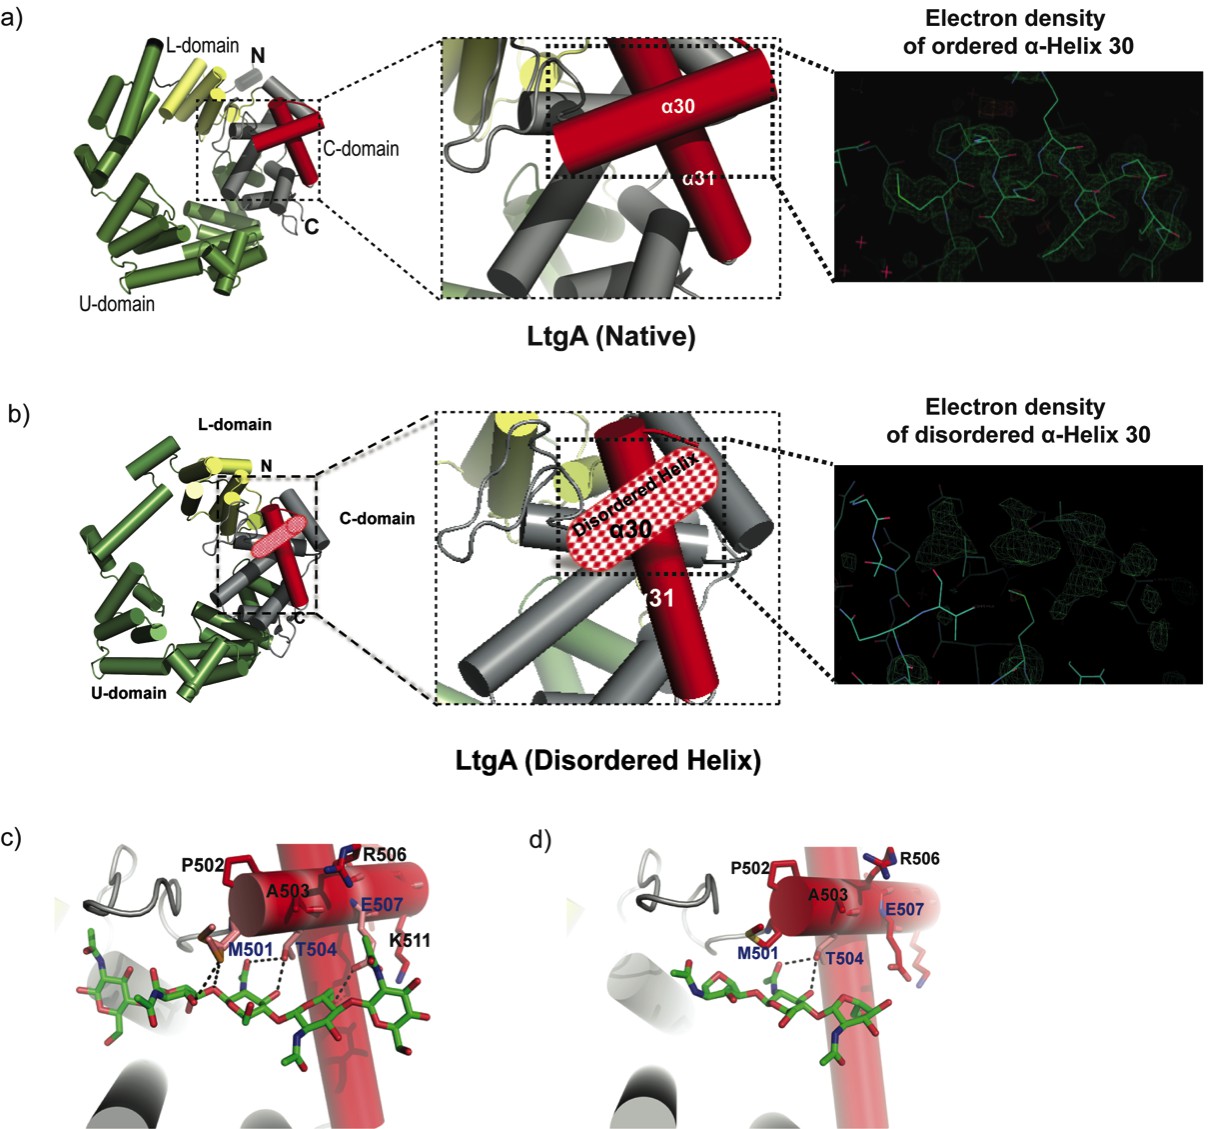
Molecular architecture of LtgA alpha helix 30 and contacts made with reaction.
intermediates. (a) Native structure of LtgA. Ribbon model of LtgA displaying a helical structure consisting of 37 alpha helices. LtgA consists of three domains: A C-domain (gray and red), which houses the putative catalytic domain, and the L (yellow) and U (green) domains, which are of unknown function. A long N-terminal extension interacts with the L-domain, which closes the structure (PDB ID: 5O29). Clear and consistent density for helix 30 was depicted by the Fo-Fc omit map (green) (b) LtgA with a disordered conformation of helix 30. Clear and consistent density for helix 30 was absent as depicted by the Fo-Fc omit map (green) of helix 30 (PDB ID: 6H5F). (c) LtgA plus trapped intermediates (chitotetraose and a GlcNAc sugar) (PDB ID: 5O2N). (d) LtgA plus anhydro product (1,6-anhydro-chitotriose) (PDB ID: 5OIJ).
Figure 1—figure supplement 1
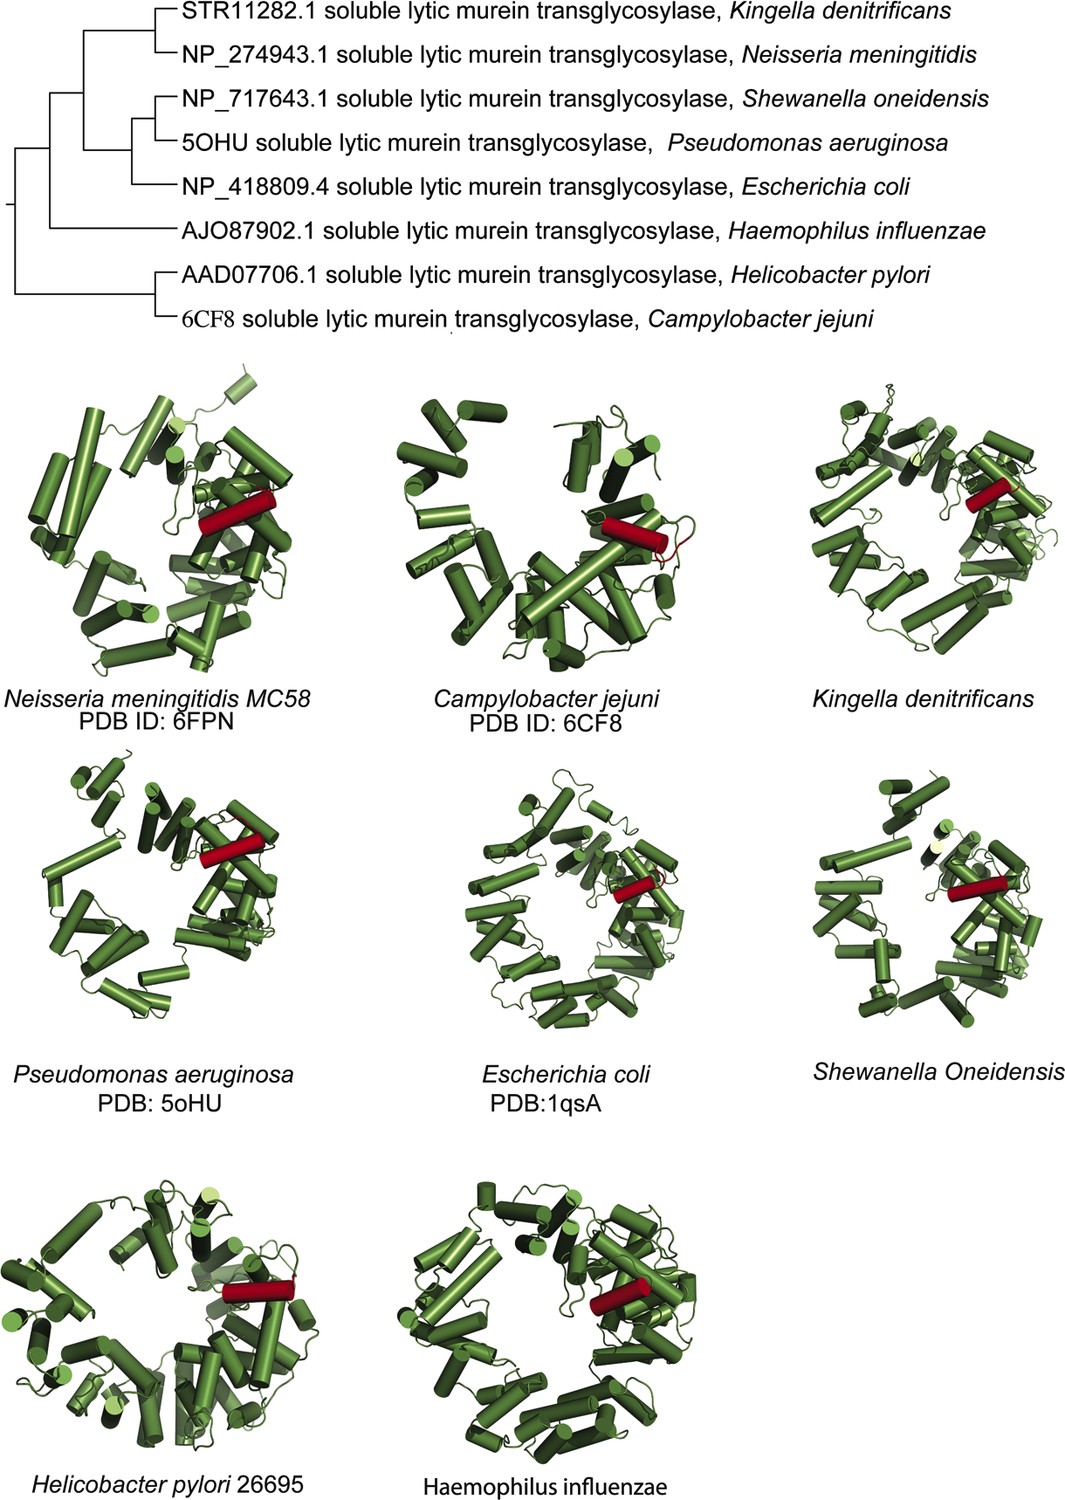
Conservation of alpha helix 30 amongst diverse lytic transglycosylases.
Phylogenetic tree of lytic transglycosylases from various organisms complemented with various structures or predicted structures of lytic transglycosylases highlighing the conserved alpha helix 30 (PDB: protein data bank).
Figure 1—figure supplement 2
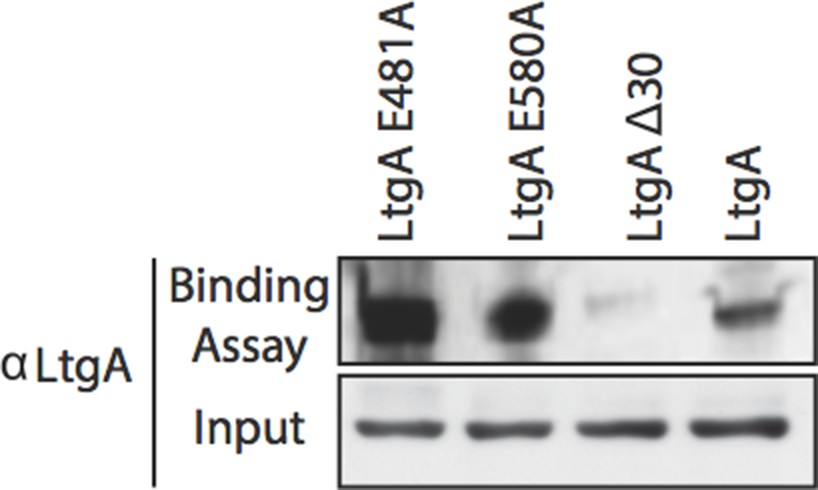
Binding of LtgA to the Peptidoglycan.
Heterologously expressed purified proteins of LtgA E481, LtgA E508A, and LtgAΔ30 were tested for their ability to bind Neiserria PG. Equal concentrations of purified protein (5 μg) were mixed with Neisseria PG and subjected to high-speed centrifugation. The western blot reflects proteins bound to insoluble PG. Comparatively, LtgAΔ30 appears to be defective in PG binding.
Figure 2
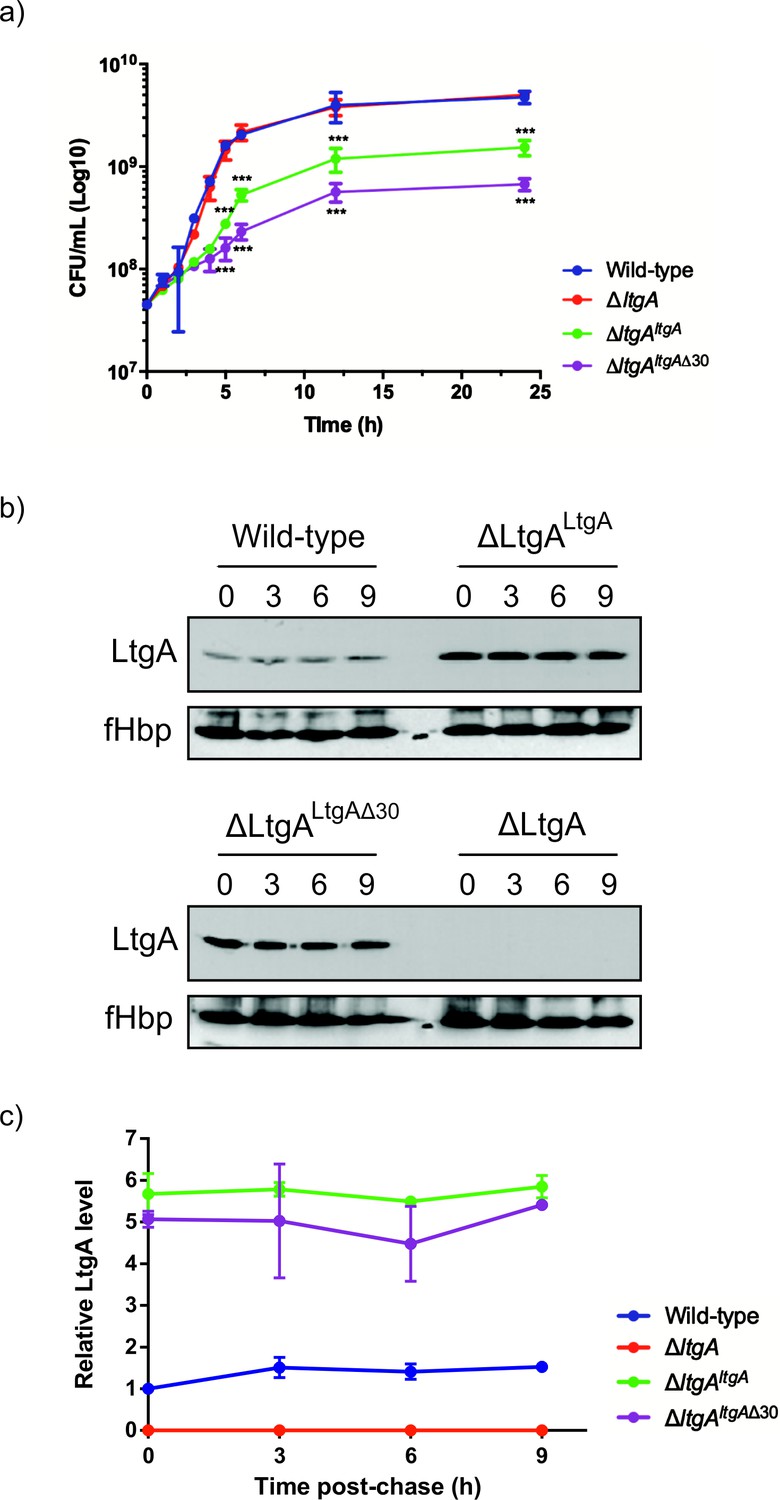
The LtgA helix 30 mutant leads to a growth defect and is stable.
(a) Growth kinetics of N. meningitidis wild-type, ΔltgA, ΔltgAltgA and ΔltgAltgAΔ30 strains. Data represent three independent experiments. (b) Exponentially grown bacteria were treated with chloramphenicol (2 μg/ml) to block protein synthesis and survey the stability of LtgA for the indicated periods of time (in hours). Immunoblots were performed probing with anti-LtgA antibody. The expression of the outer membrane protein fHbp was used as an loading control. (c) The levels of LtgA over the time were analyzed and plotted as a stability curve by quantifying the band intensities using ImageJ software. For each strain, the LtgA intensity at time zero is referred to as 100%, while the simultaneously fHbp was used for loading control.
-
Figure 2—source data 1
Figure 2a – Analysis associated with growth kinetics of N. meningitidis wild-type, ΔltgA, ΔltgA ltgA and ΔltgA ltgAΔ30 strains.
- https://cdn.elifesciences.org/articles/51247/elife-51247-fig2-data1-v2.xlsx
-
Figure 2—source data 2
Figure 2c – The stability of LtgA over time.
- https://cdn.elifesciences.org/articles/51247/elife-51247-fig2-data2-v2.xlsx
Figure 3 with 2 supplements
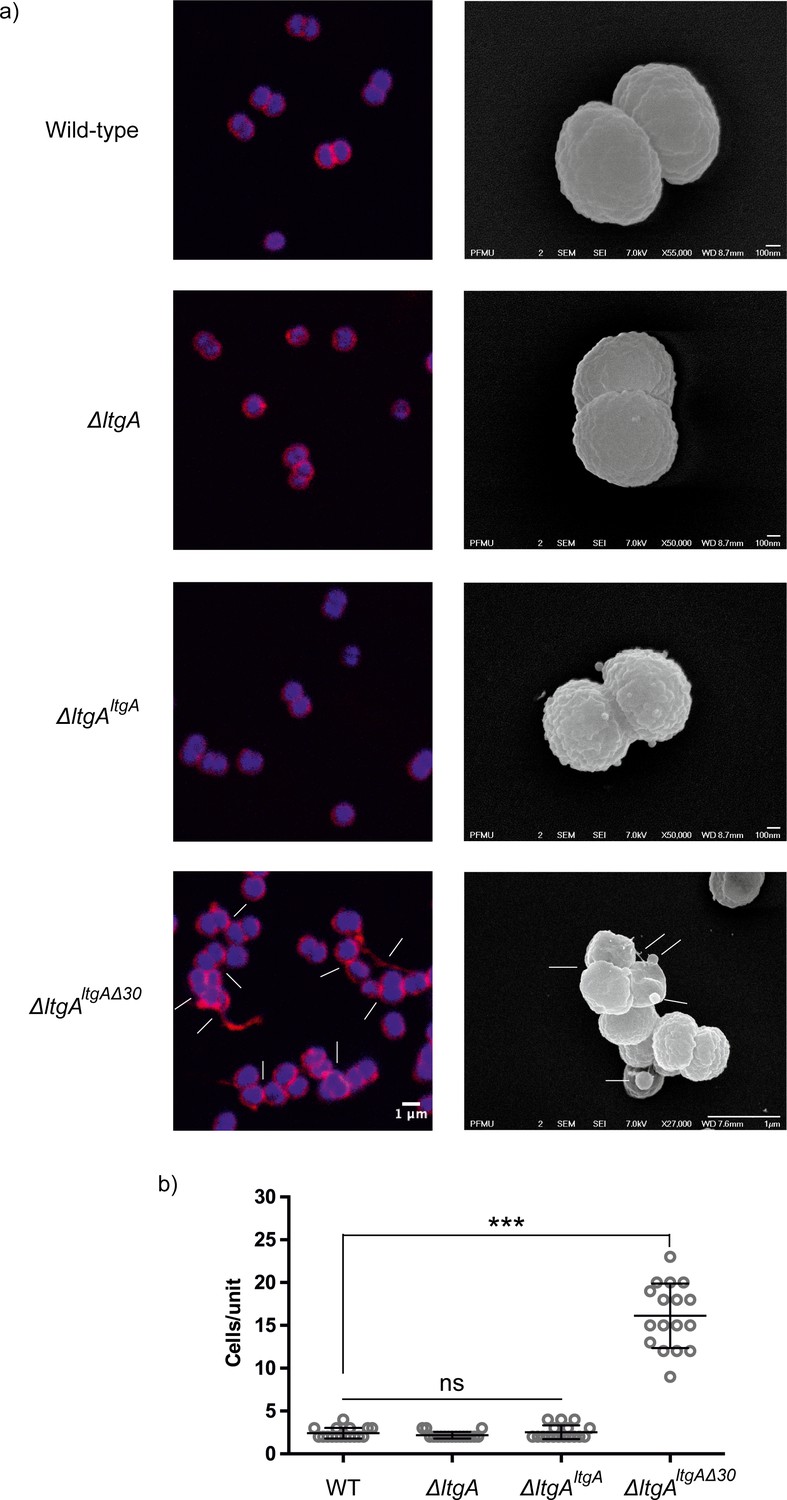
The LtgA helix 30 mutant shows morphological abnormalities.
(a) Morphological differences between the wild type and strains expressing the mutant lytic transglycosylases were determined by fluorescence microscopy (left panel) and scanning electron microscopy (SEM) (rightpanel). White arrows in the images of ΔltgAltgAΔ30 strain (left panel) point to cells defective in division and separation, as well as extracellular material. White arrows in the right panel points to, irregular cell surfaces, high-molecular-weight blebs (not observed in other strains), asymmetrical diplococci, and ghost cells (see Figure 3—figure supplement 1 for other images detailing additional morphological abnormalities). (b) Quantification of the confocal microscopy data. The different fields were manually counted to evaluate the number of cells per unit. Each unit is defined as an isolated cluster of cells that it is not in contact with other cells. Whenever in contact two cells were defined as apart of the same unit.
Figure 3—figure supplement 1
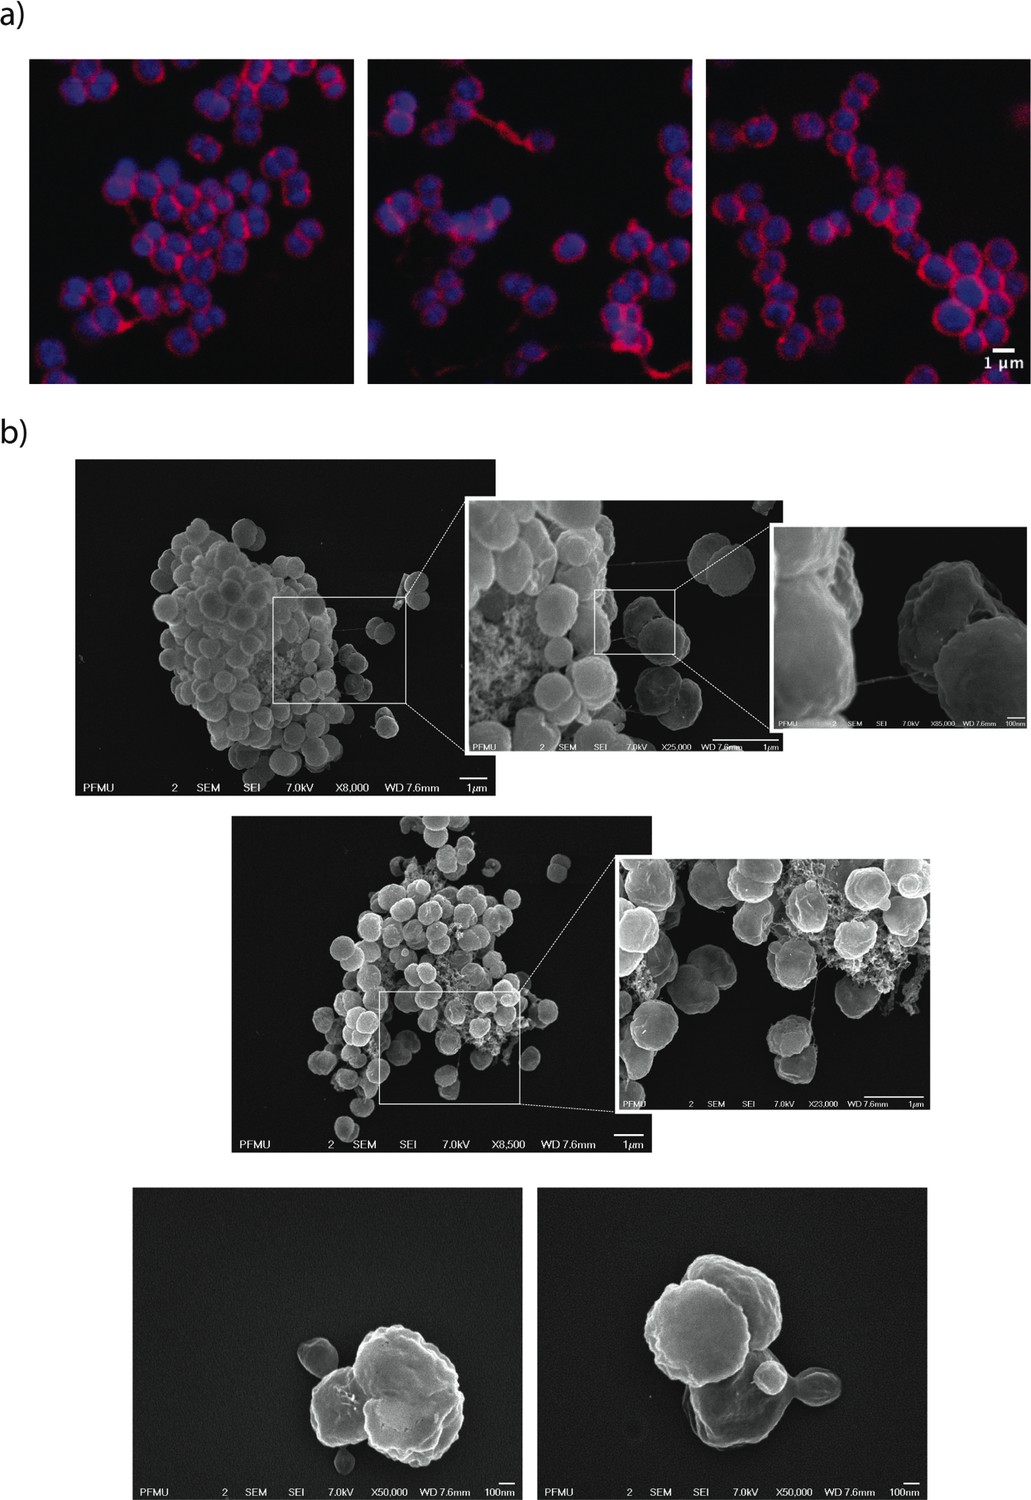
Morphological abnormalities of LtgA alpha helix 30 mutant.
(a) Fluorescent microscopy of ΔltgAltgAΔ30 strain highlighting aggregated cells that are defective in division and separation. (b) Scanning electron microscopy of ΔltgAltgAΔ30 strain detailing additional morphological abnormalities such as, aggregation of extracellular material that resembles type IV pilin protein structures that stretches between diplococcic bacteria.
Figure 3—figure supplement 2
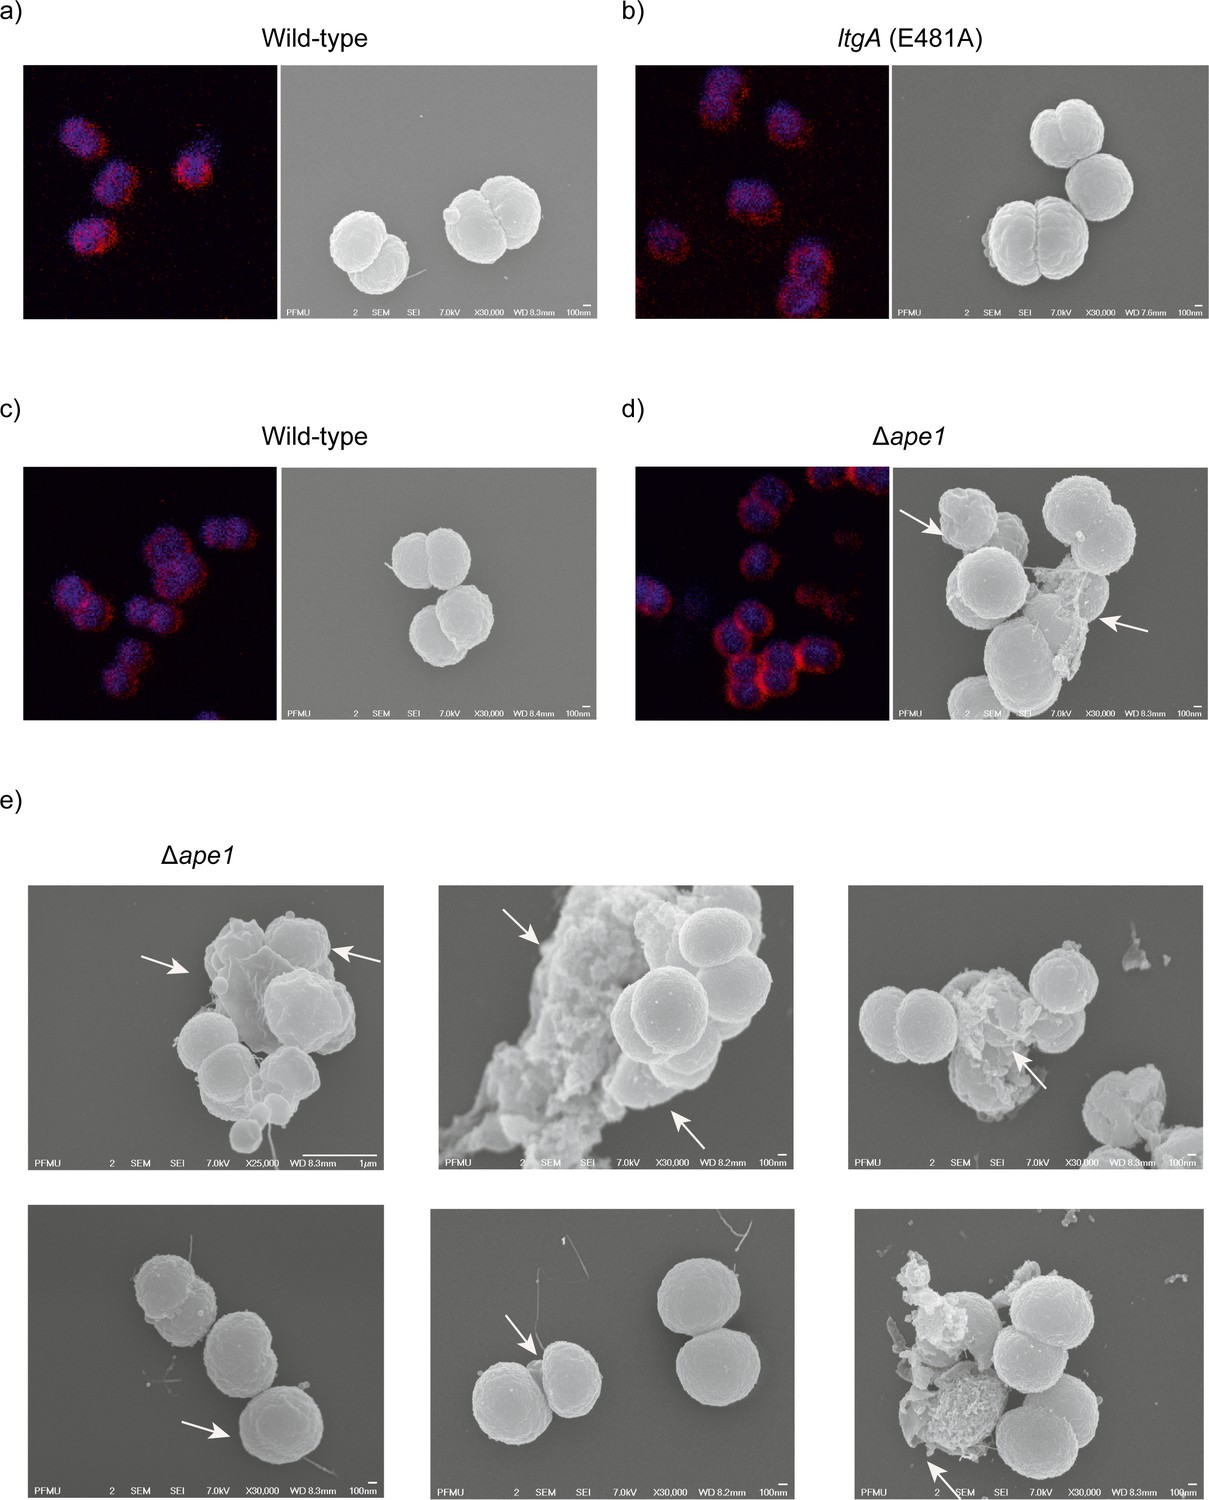
Morphological abnormalities of the Δape1 strain.
(a) Strains (8013) expressing wild-type lytic transglycosylase were imaged using fluorescent microscopy (right panel) and scanning electron microscopy (SEM) (left panel). (b) Strains (8013) expressing mutant lytic transglycosylases (E481A) were imaged by fluorescent microscopy (right panel) and scanning electron microscopy (SEM) (left panel). (c) Strains (MC58) expressing wild-type lytic transglycosylase were imaged using fluorescent microscopy (right panel) and scanning electron microscopy (SEM) (left panel), (d–e) The Δape1 strains were imaged using fluorescent microscopy (right panel) and scanning electron microscopy (SEM) (left panel). White arrows in the images points to, irregular cell surfaces, high-molecular-weight blebs (not observed in other strains), asymmetrical diplococci, and lysed bacteria.
Figure 4 with 2 supplements
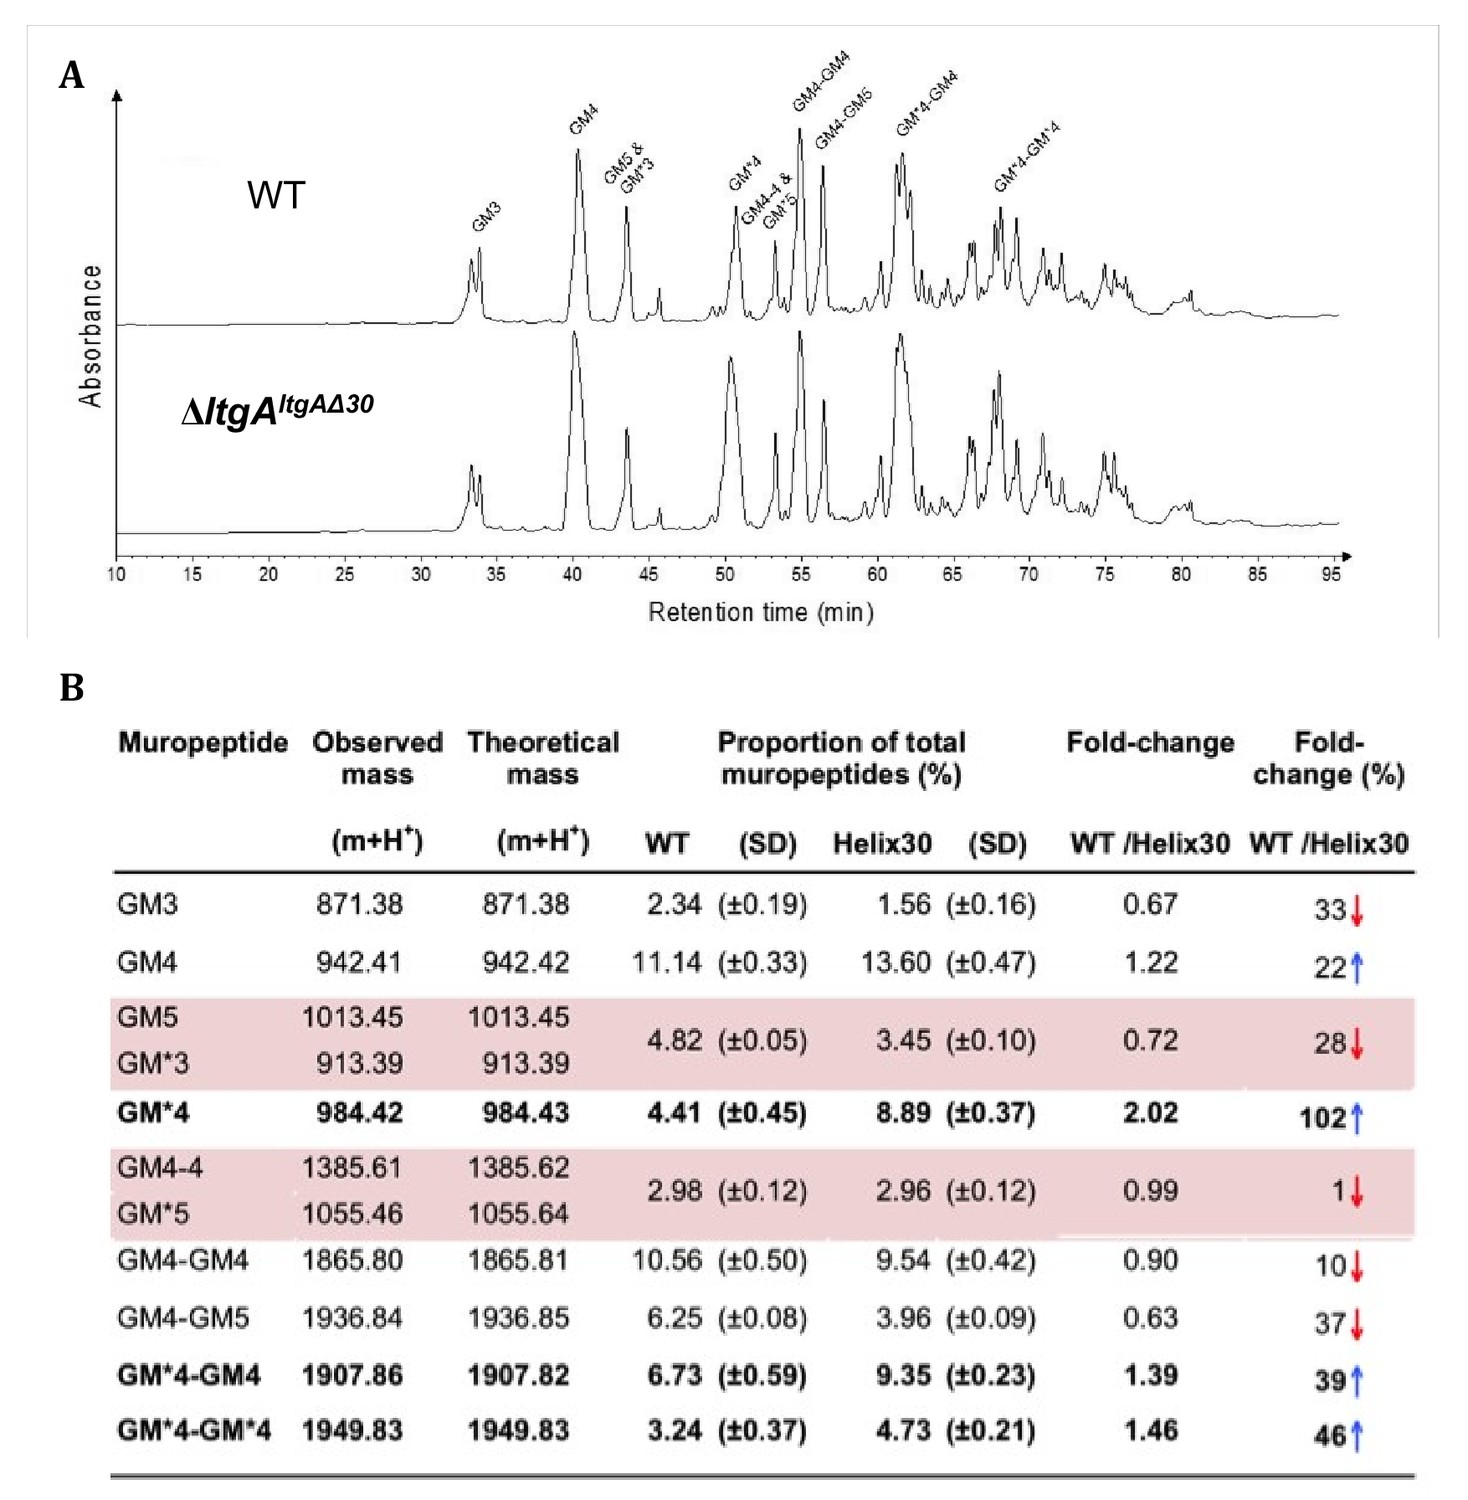
Muropeptide composition of PG isolated from wild-type and ΔltgAltgAΔ30.
(a) The chromatogram represents purified PG digested by the muramidse, mutanolysin and the resulting muropeptides were reduced, and analyzed by LC/MS. The results were reproducible over four biological replicates. Peak identifications correspond to (b). Quantitation and analysis of muropeptides identified by mass spectrometry. * indicates O-acetylated MurNAc. Acetylated GM*4 is highlighted in bold. Multiple muropeptides coeluted as a single peak are shaded in pink. Red arrows indicate a decrease and blue arrows an increase in muropeptide abundance. The table displays the observed and theoretical masses and the proportion of total muropeptides.
-
Figure 4—source data 1
Table associated with the muropeptide composition of PG isolated from wild-type, ΔltgA, ΔltgAltgA.
- https://cdn.elifesciences.org/articles/51247/elife-51247-fig4-data1-v2.docx
-
Figure 4—source data 2
Raw data associated with themuropeptide composition of PG isolated from wild-type and ΔltgAltgAΔ30.
- https://cdn.elifesciences.org/articles/51247/elife-51247-fig4-data2-v2.xlsx
Figure 4—figure supplement 1
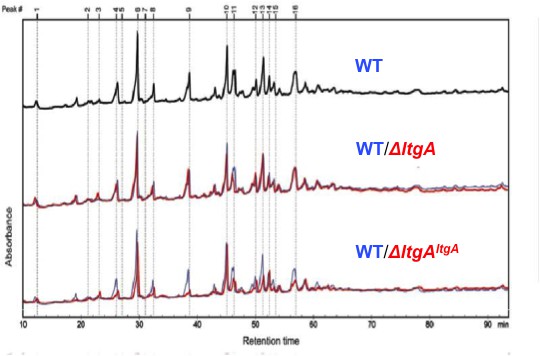
Muropeptide composition of PG isolated from wild-type, ΔltgA, ΔltgAltgA.
The purified PG was digested by muramidase mutanolysin, and the resulting muropeptides were reduced and then analyzed by LC/MS. The results were reproducible over four biological replicates. The wild-type chromatogram (blue) is overlaid on mutant chromatograms (red). Peak numbers correspond to Supplementary file 1.
Figure 4—figure supplement 2
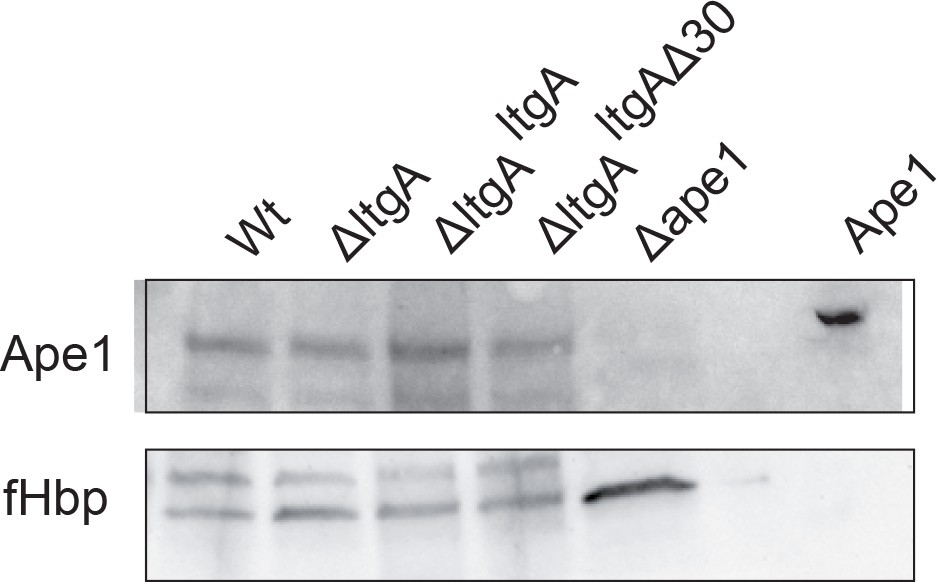
The expression of Ape1.
The levels of Ape1 were assessed using Immunoblot and probing with anti-Ape1 antibody of the wild-type, ΔltgA, ΔltgAltgA, and ΔltgAltgAΔ30 strains. The expression of the outer membrane protein fHbp was used as an loading control. The Δape1 strain and purified recombinantly expressed Ape1 (2 ng) were used as a control to show specificity of anti-Ape1 antibody.
Figure 5 with 1 supplement
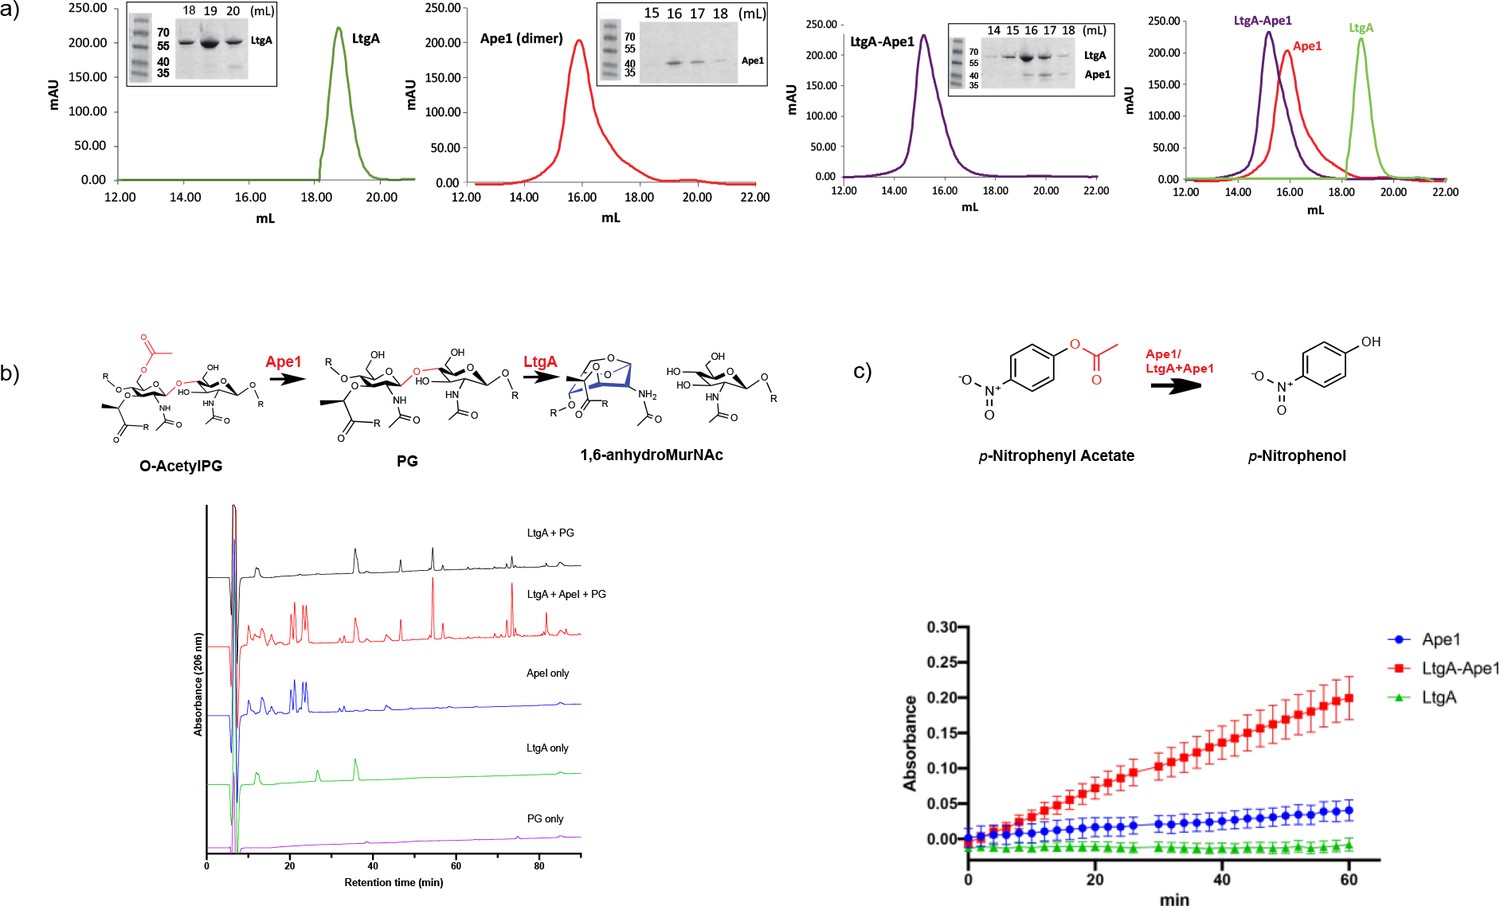
LtgA stimulates and stabilizes the enzymatic activity of Ape1.
(a) Chromatogram of the size exclusion analysis of purified (panel 1) LtgA, (panel 2)Ape1, (panel 3) Ape1-LtgA 105 kDa. Overlay of the chromatograms corresponding to purified LtgA, Ape1, and LtgA-Ape1 protein complex (panel 4). Each insert represents SDS-PAGE analysis of peak fractions containing proteins. Lanes are labeled with corresponding volumes. (b) Ape1 stimulates the activity of LtgA toward the acetylated PG of N. meningitidis. (c) LtgA stimulates and stabilizes Ape1 activity toward p-nitrophenol acetate. Ape1 utilizes p-nitrophenol acetate as a substratewhile LtgA does not. Error bars show the standard deviation of triplicate.
-
Figure 5—source data 1
Figure 5b – LtgA stimulation assay.
- https://cdn.elifesciences.org/articles/51247/elife-51247-fig5-data1-v2.xlsx
-
Figure 5—source data 2
Figure 5c – Ape1 stimulation assay.
- https://cdn.elifesciences.org/articles/51247/elife-51247-fig5-data2-v2.xlsx
Figure 5—figure supplement 1
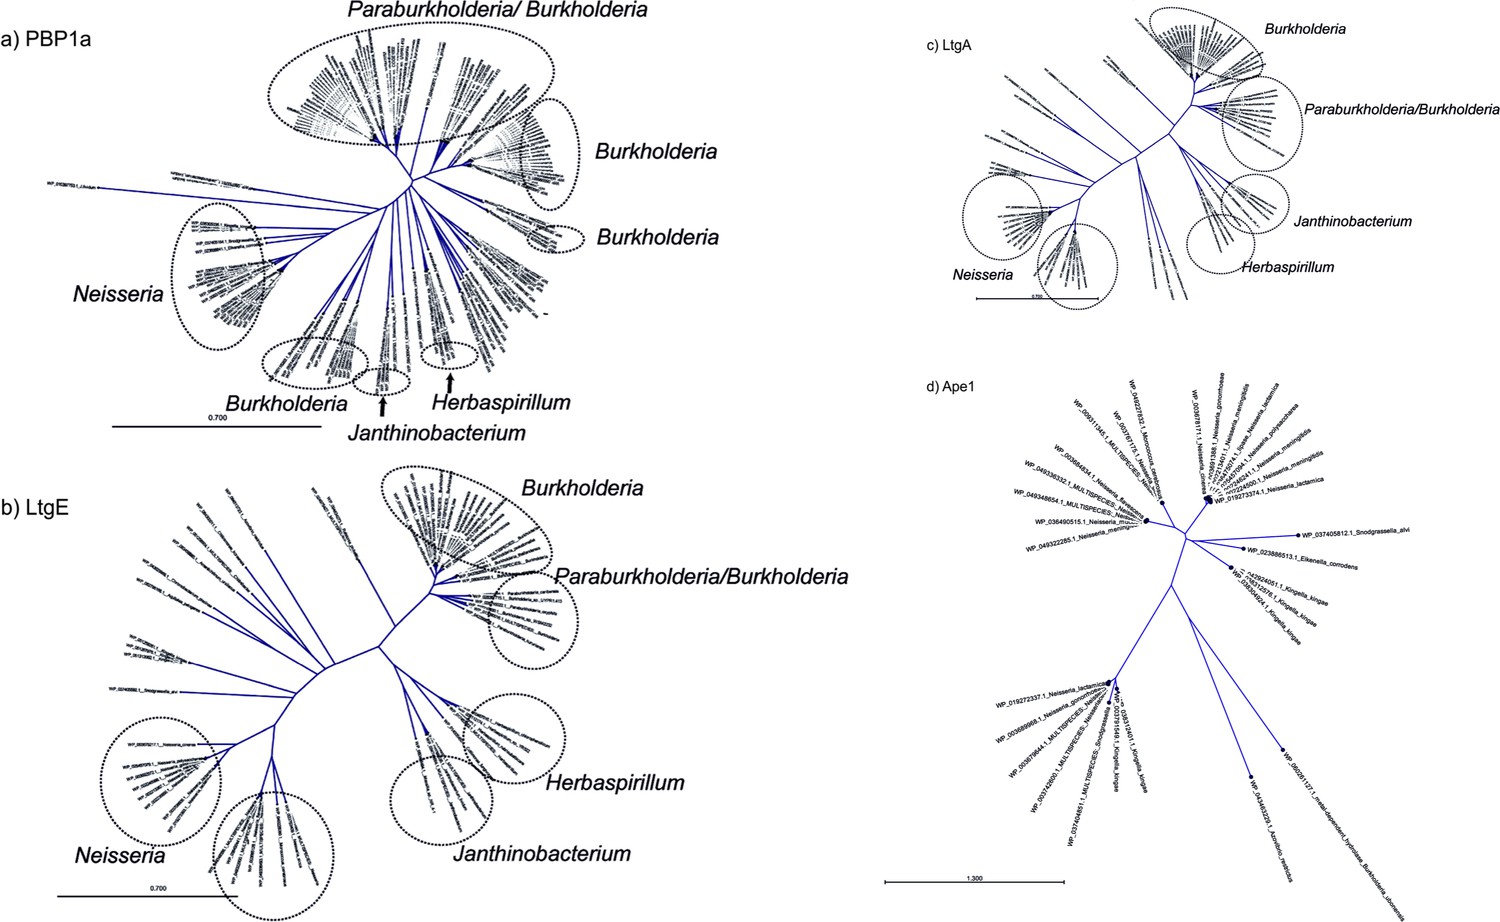
Phylogenetic tree showing the the co-conservation of Ape1.
(a–d) Phylogenetic tree showing PBP1a, LtgA, LtgE and Ape1 co-conservation.
Figure 6
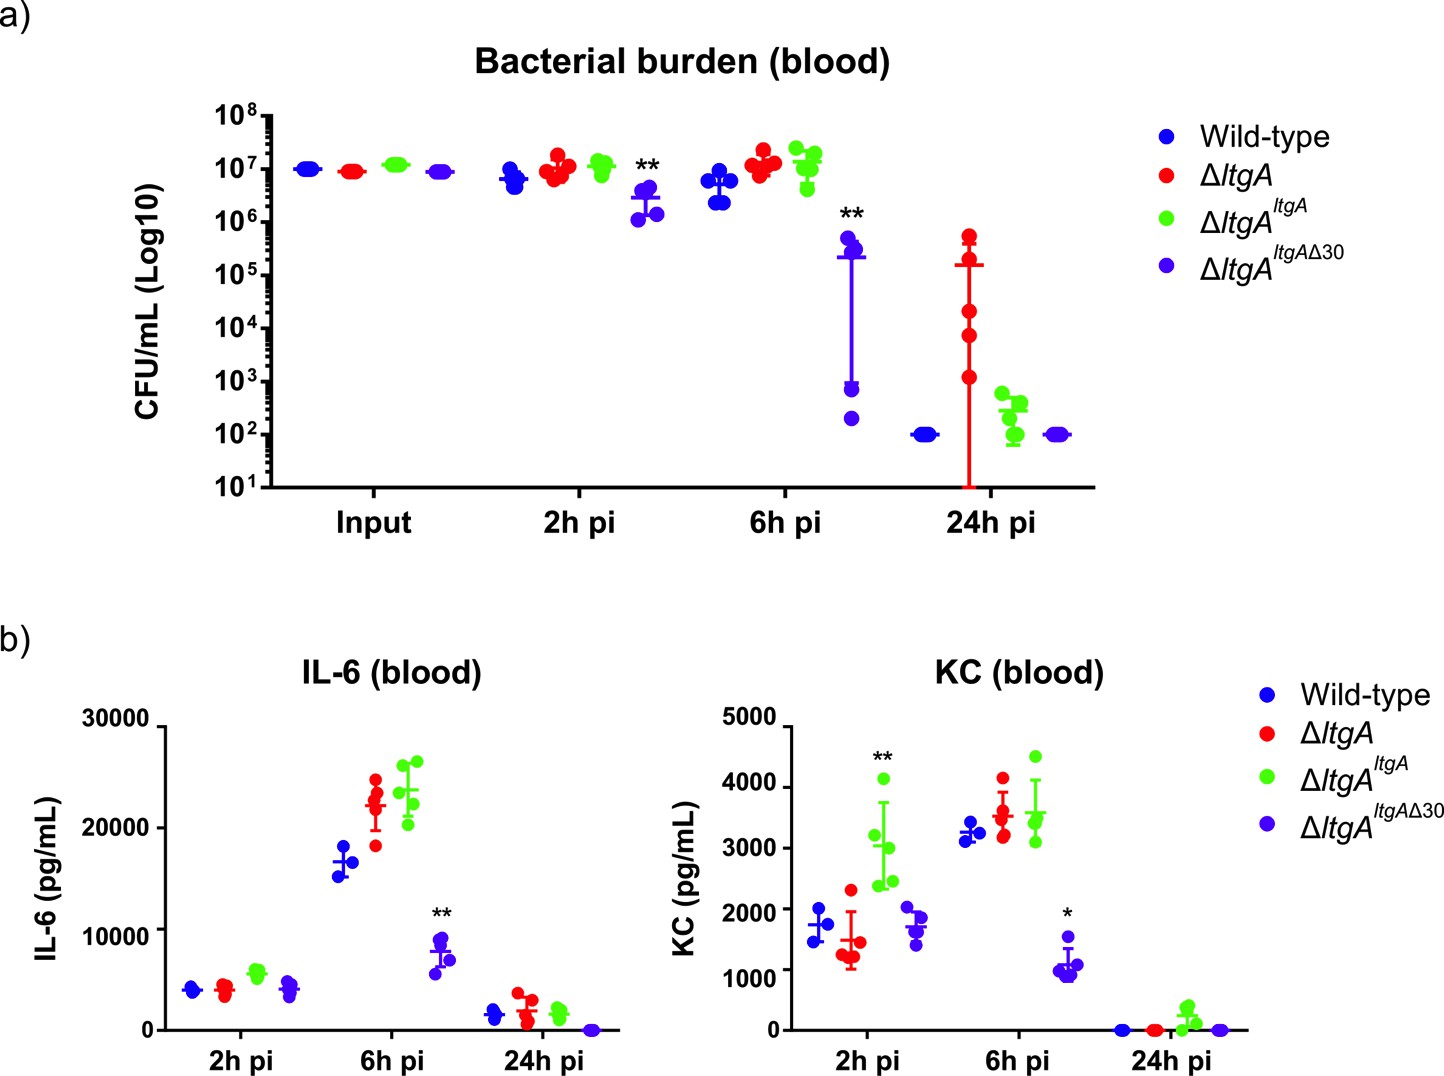
Helix 30 of LtgA plays a role in N.meningitidis host adaptation and virulence.
N.meningitidis wild-type, ΔltgA, ΔltgAltgA and ΔltgAltgAΔ30 were administered to transgenic mice expressing human transferrin via an intraperitoneal route. (a) Bacterial burden was determined by enumeration of CFUs in blood 2, 6 and 24 hr pi. These data show that the strain complemented with a deletion in helix 30 is cleared faster than the other strains. (b) Pro-inflammatory cytokine (IL-6) and chemokine (KC) profile in blood of infected mice was evaluated 2, 6 and 24 hr post-infection by ELISA. The ΔltgAltgAΔ30 strain induced the production of lower levels of inflammatory mediators production upon infection compared to the other strains. Data represent three independent experiments with n = 5. Statistical analysis was done by Kruskal-Wallis non-parametric comparison against the complemented strain with a p-value<0.01.
-
Figure 6—source data 1
Figure 6a – Quantification of bacterial burden.
- https://cdn.elifesciences.org/articles/51247/elife-51247-fig6-data1-v2.xlsx
-
Figure 6—source data 2
Figure 6b – Raw files associated with pro-inflammatory cytokines.
- https://cdn.elifesciences.org/articles/51247/elife-51247-fig6-data2-v2.xlsx
Figure 7

Peptidoglycan degrading complexes can modulate enzymatic function.
(a) The removal of the O-acetyl group by Ape1 allows LtgA to efficiently metabolize the PG. There was normal cell growth, division and separation (yellow triangle represent acetyl groups, glycan strand are colored in green and orange, and stem peptides are represented in blue and yellow circles). (b) Removal of LtgA does not affect the function of Ape1. Normal cell growth, division and or separation was observed. (c) Deletion of alpha helix 30 of LtgA affects the function of Ape1, disrupts, growth, cell division and cell separation and bacterial survival in the host.
Videos
Video 1
Video of LtgA cleaving a glycan strand.
Tables
Key resources table
| Reagent type (species) or resource | Designation | Source or reference | Identifiers | Additional information |
|---|---|---|---|---|
| Gene (include species here) | ltgA (Neiserria meningitidis MC58/8013) | This paper | ||
| Strain, strain background (include species and sex here) | ltgAltgAΔ30 Neiserria meningitidis MC58/8013) | This paper | ||
| Strain, strain background (include species and sex here) | ltgAltgA (Neiserria meningitidis MC5/8013) | This paper | ||
| Strain, strain background (include species and sex here) | ΔltgA (Neiserria meningitidis MC58/8013 | This paper | ||
| Strain, strain background (include species and sex here) | Δape1Neiserria meningitidis MC58 | doi:10.1111/mmi.12153 | ||
| Strain, strain background (include species and sex here) | ltgA(E481A)Neiserria meningitidis 8013 | This paper | ||
| Antibody | LtgA Guinea pig polyclonal Antibody | This paper | 1:250 | |
| Antibody | Ape1 mouse polyclonal Antibody | This paper | 1:250 | |
| Recombinant DNA reagent | pGEX-4T1-LtgA | doi: 10.3390/antibiotics6010008 | ||
| RecombinantDNA reagent | pGEX-4T1-Ape1 | doi:10.1111/mmi.12153 | ||
| Software, algorithm | GraphPad Prism | RRID:SCR 002798 | https://www.graphpad.com/scientific-software/prism/ |
Additional files
-
Supplementary file 1
Muropeptides identified by mass spectrometry.
* indicates O-acetylated MurNAc. Acetylated muropeptides are highlighted in pink. Where multiple muropeptides coeluted as a single peak, bold text indicates the most abundant mass detected.
- https://cdn.elifesciences.org/articles/51247/elife-51247-supp1-v2.docx
-
Supplementary file 2
Crystallography data collection and refinement statistics of LtgA.
- https://cdn.elifesciences.org/articles/51247/elife-51247-supp2-v2.docx
-
Transparent reporting form
- https://cdn.elifesciences.org/articles/51247/elife-51247-transrepform-v2.docx
Download links
A two-part list of links to download the article, or parts of the article, in various formats.
Downloads (link to download the article as PDF)
Open citations (links to open the citations from this article in various online reference manager services)
Cite this article (links to download the citations from this article in formats compatible with various reference manager tools)
Defective lytic transglycosylase disrupts cell morphogenesis by hindering cell wall de-O-acetylation in Neisseria meningitidis
eLife 9:e51247.
https://doi.org/10.7554/eLife.51247


