Gene regulatory network reconstruction using single-cell RNA sequencing of barcoded genotypes in diverse environments
- New York University, United States
- Simons Foundation, United States
Figures
Figure 1 with 1 supplement
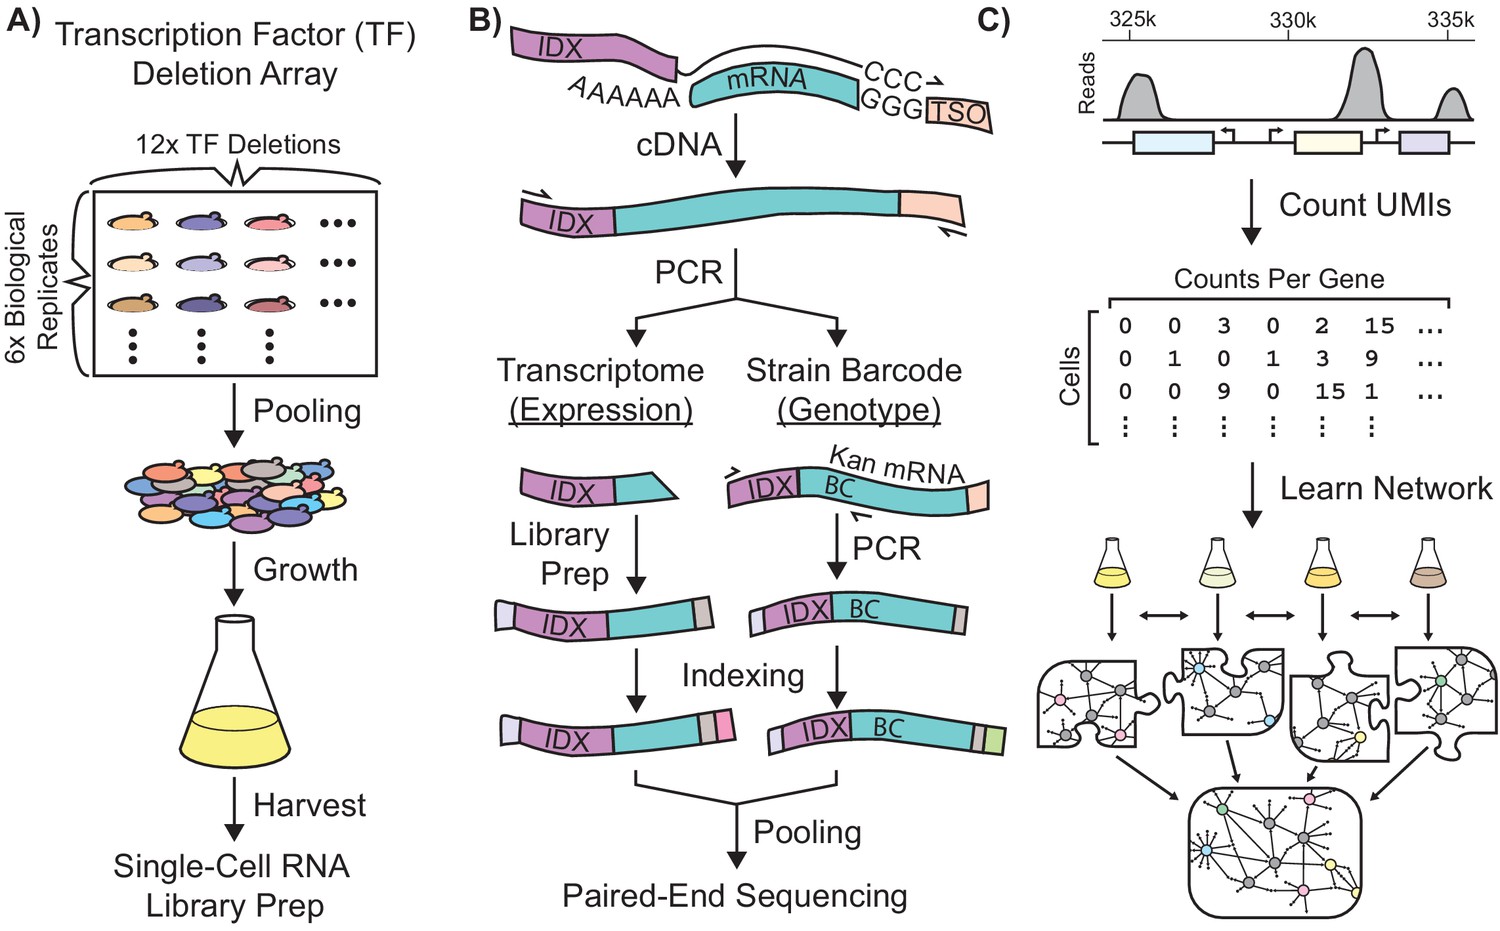
Single-Cell RNA-Seq Experimental Workflow in Saccharomyces Cerevisiae.
Schematic workflows for: (A) Growth of a transcriptionally-barcoded pool of 11 nitrogen metabolism transcription factor (TF) knockout strains and a wild-type control strain each analyzed with six biological replicates (B) Synthesis in microfluidic droplets of single-cell cDNA with a cell-specific index sequence (IDX) attached to the oligo-dT primer, and a common template switch oligo (TSO). cDNA is processed for whole-transcriptome libraries, to quantify gene expression. In parallel, PCR products are amplified containing the genotype-specific transcriptional barcode (BC) encoded on the KanR antibiotic resistance marker mRNA, to identify cell genotype. Expression DNA libraries and PCR products are separately indexed for multiplexed sequencing (C) Processing of single-cell sequencing data using Unique Molecular Identifiers (UMI) into a count matrix which is used to learn a gene regulatory network using multi-task network inference from several different growth conditions.
Figure 1—figure supplement 1

Strain Construction Workflow and Validation.
(A) Construction of KanMX[BC] deletion cassettes containing degenerate barcodes in the 3’ untranslated region, followed by transformation into yeast to create a transcription factor knockout array (B) Spotting of the deletion array onto YPD (control) and media containing different nitrogen sources plates. Each column is a separate TF deletion, and each spot is a uniquely barcoded biological replicate. There are six biological replicates for each of 12 genotypes, for a total of 72 unique strains in the array.
Figure 2 with 4 supplements
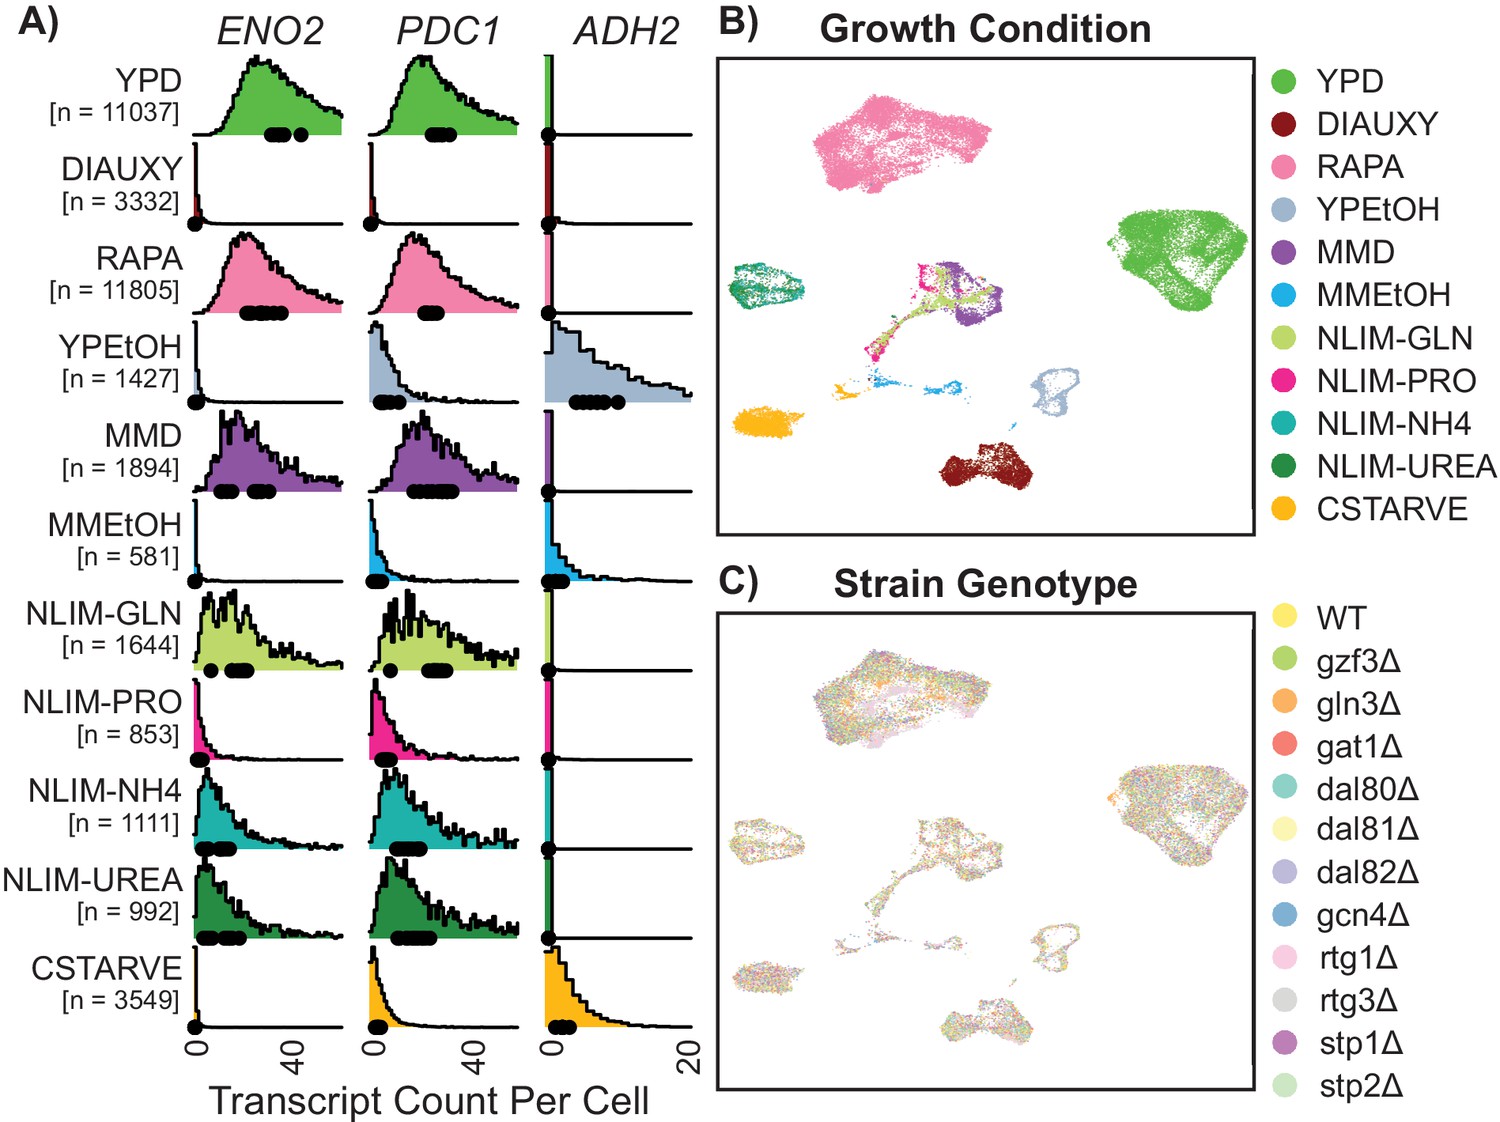
Gene expression of single Yeast Cells Cluster Based on Environmental Growth Condition.
(A) Normalized density histograms of raw UMI counts of the core glycolytic genes ENO2 and PDC1, and the alcohol respiration gene ADH2 in each environmental growth condition. Mean UMI count for each of the 12 different strain genotypes within each growth condition are plotted as dots on the X axis. (B–C) Uniform Manifold Approximation and Projection (UMAP) projection of log-transformed and batch-normalized scRNAseq data. Axes are dimensionless variables V1 and V2 with arbitrary units, here omitted. Individual cells are colored by environmental growth condition (B) or by strain genotype (C). Growth conditions are abbreviated as in Table 1.
Figure 2—figure supplement 1
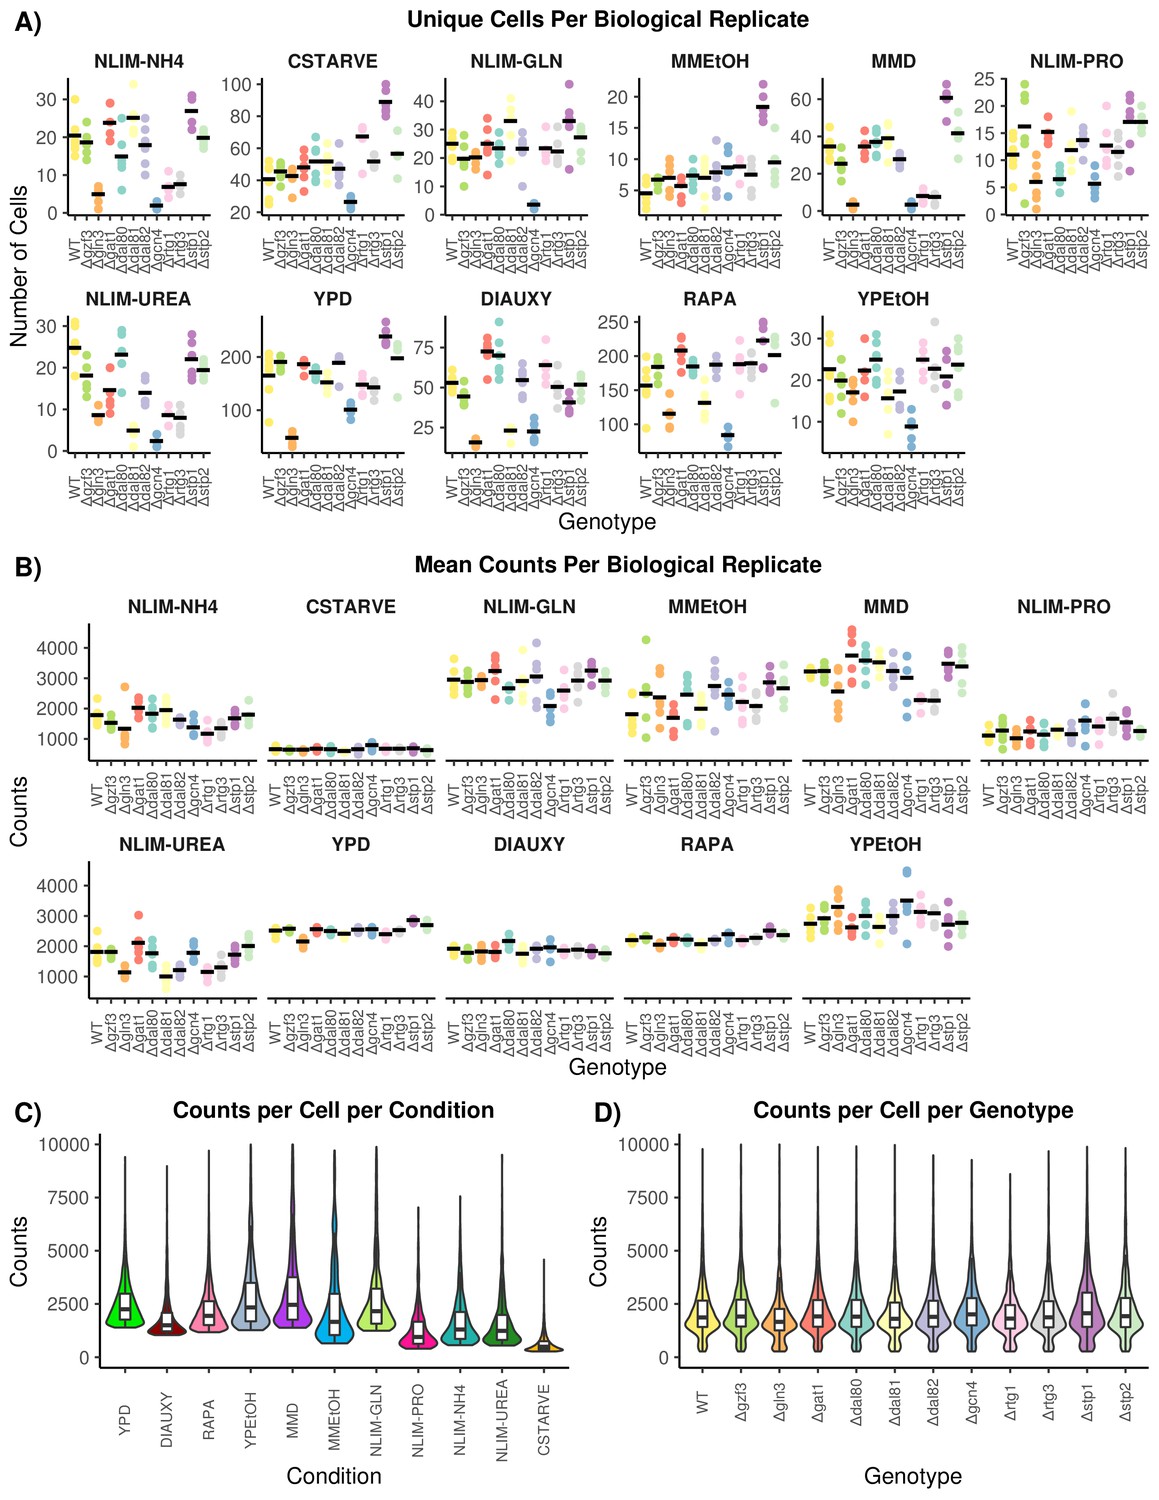
Quality Control of Single-Cell RNA Sequencing Data.
(A) The number of cells that pass all quality control and preprocessing filters for each growth condition. Each genotype has multiple independently barcoded biological replicates that are plotted separately within each condition. The mean number of cells for each genotype within a condition is plotted as a horizontal line. (B) The mean count of unique transcripts, determined by UMI, for each growth condition. Biological replicates are plotted separately for each genotype within each condition. The mean number of transcripts per genotype is plotted as a horizontal line. (C) The distribution of unique transcript count per cell across all growth conditions. (D) The distribution of unique transcript counts per cell across all genotypes.
Figure 2—figure supplement 2
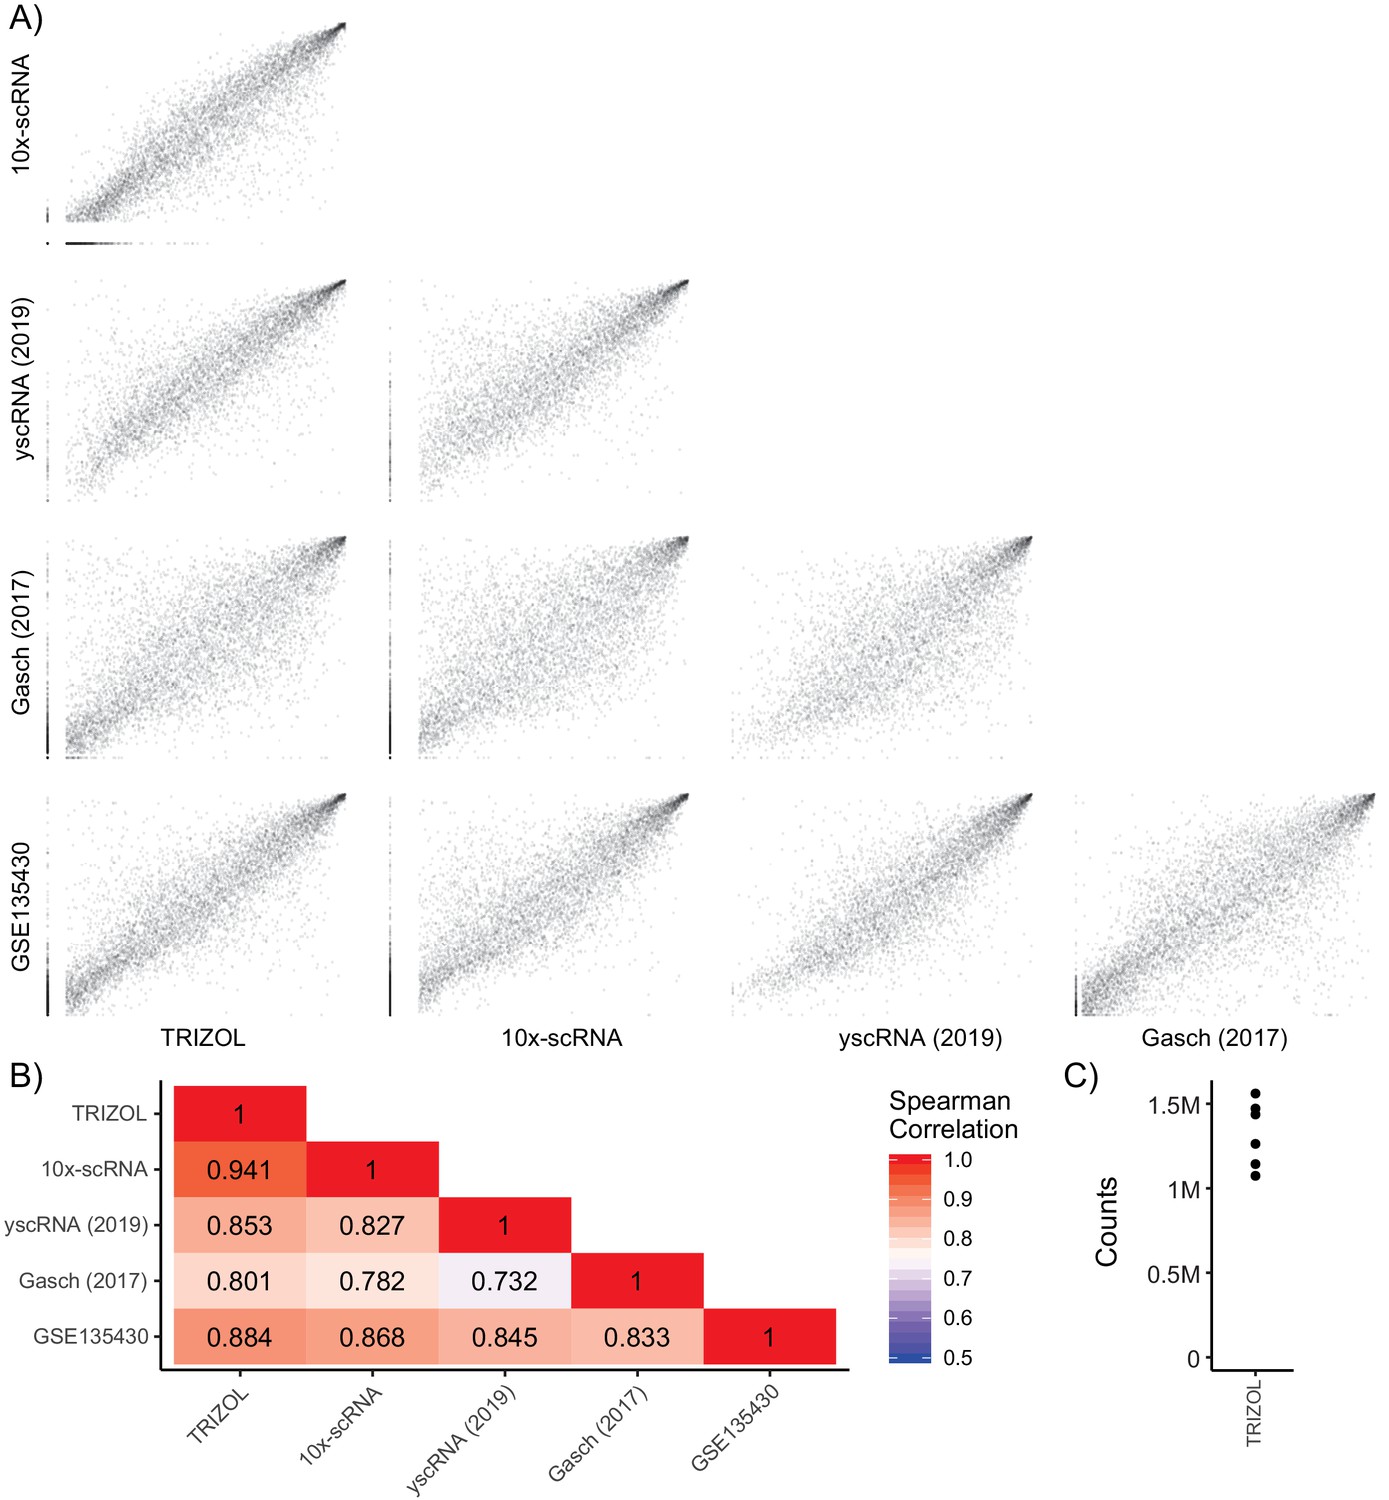
Single-Cell RNA Expression Comparison.
(A) Pairwise ranked gene expression plots of cells grown in YPD to mid-log phase. Data sets are bulk counts [TRIZOL] from FY4/FY5 diploids (n = 6), 10x-based 3’ end-labeled single-cell counts [10x-scRNA] from FY4/FY5 diploids (n = 976), 5’ end-labeled single-cell counts [yscRNA (2019)] from BY4741 haploids (n = 127), SCnorm-calculated normalized counts Gasch et al. (2017) from BY4741 haploids (n = 163), and bulk transcripts per kilobase million [GSE135430] from BY4741 haploids (n = 12). (B) Correlation heatmap showing spearman’s rank correlation between each sample. (C) Counts per sample after sequencing and de-artifacting with UMIs for the bulk experiment on FY4/FY5 wild-type RNA extracted with TRIZOL (n = 6).
Figure 2—figure supplement 3

Expression of Categories of Genes in Single Cells.
UMAP projection of log-transformed and batch-normalized scRNAseq data, colored by: (A) Condition, as Figure 2B (B) Total raw count of transcripts (C) Percentage of transcripts which are ribosomal genes (D) Percentage of transcripts which are ribosomal biogenesis genes (E) Percentage of transcripts which are induced environmental stress response (iESR) genes (F) Percentage of transcripts which are mitochondrially-encoded genes.
Figure 2—figure supplement 4
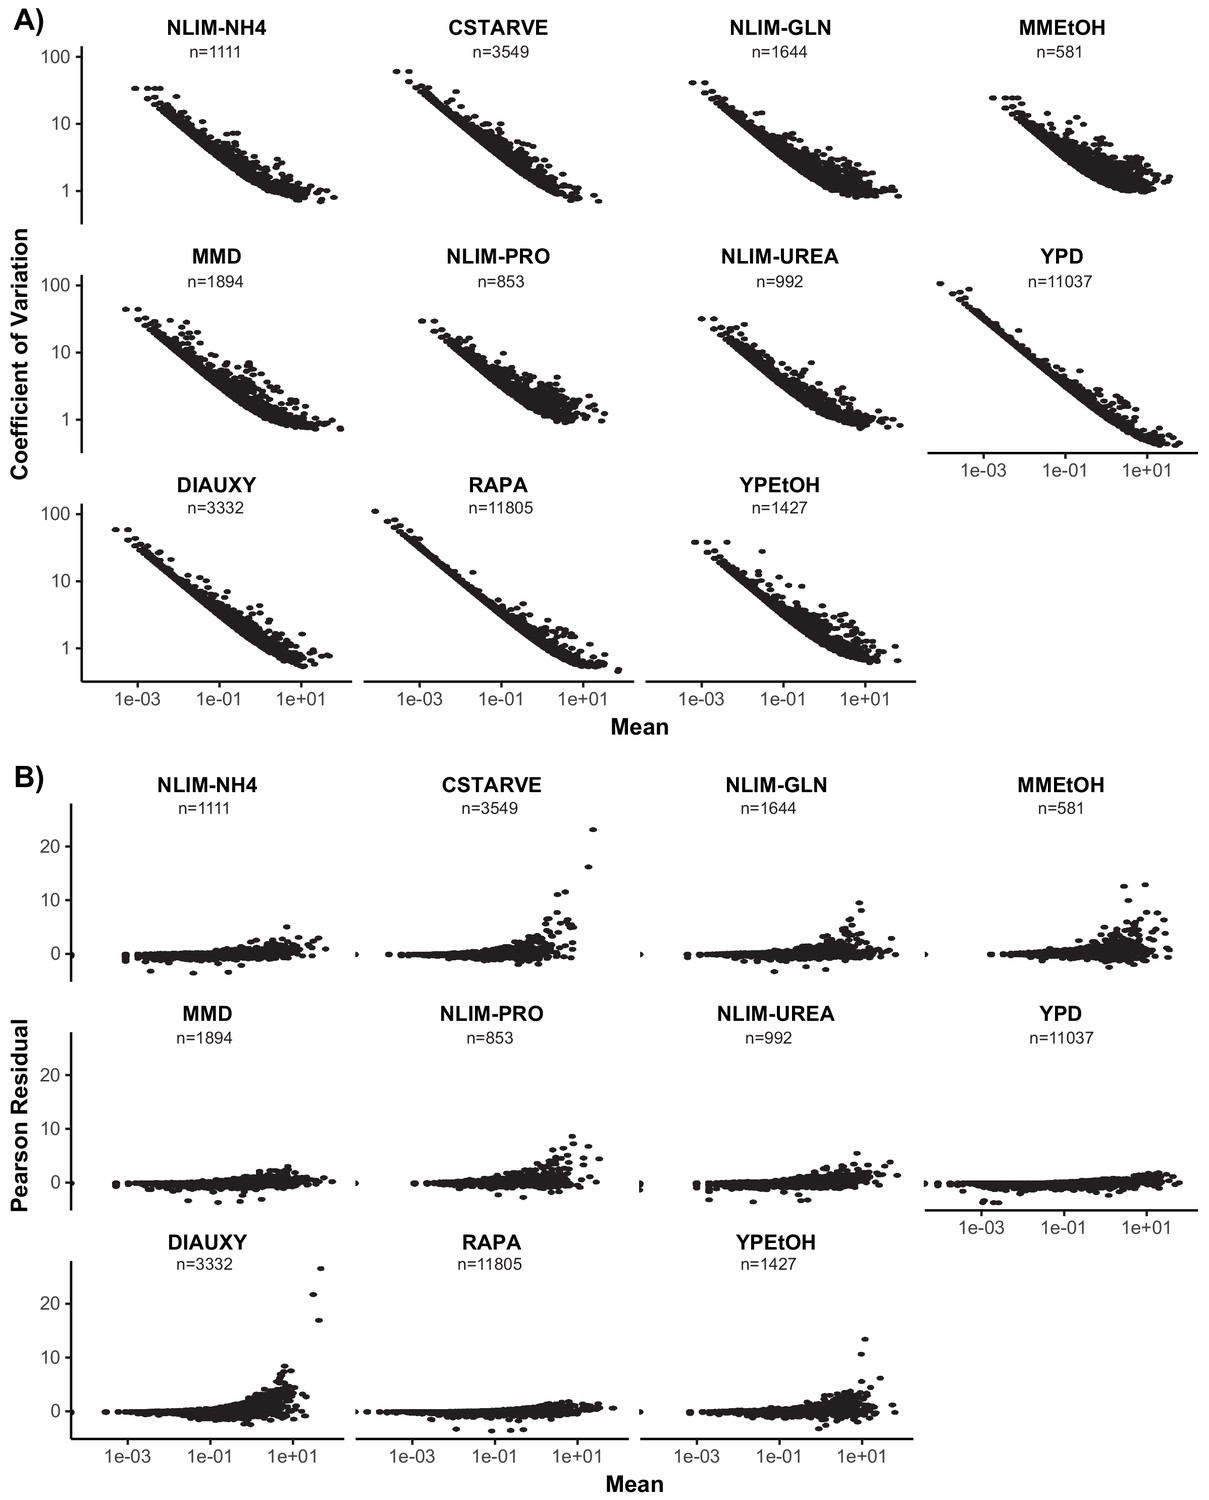
Measures of Gene Variance in Each Condition.
(A) Coefficient of variation (standard deviation over mean) plotted against mean of each gene for each growth condition. Both axes are plotted on a log scale. (B) The mean pearson residuals (residuals over expected standard deviation) of a regularized negative binomial regression model calculated for each gene by the R package sctransform. The mean gene expression is plotted on a log scale.
Figure 3 with 2 supplements
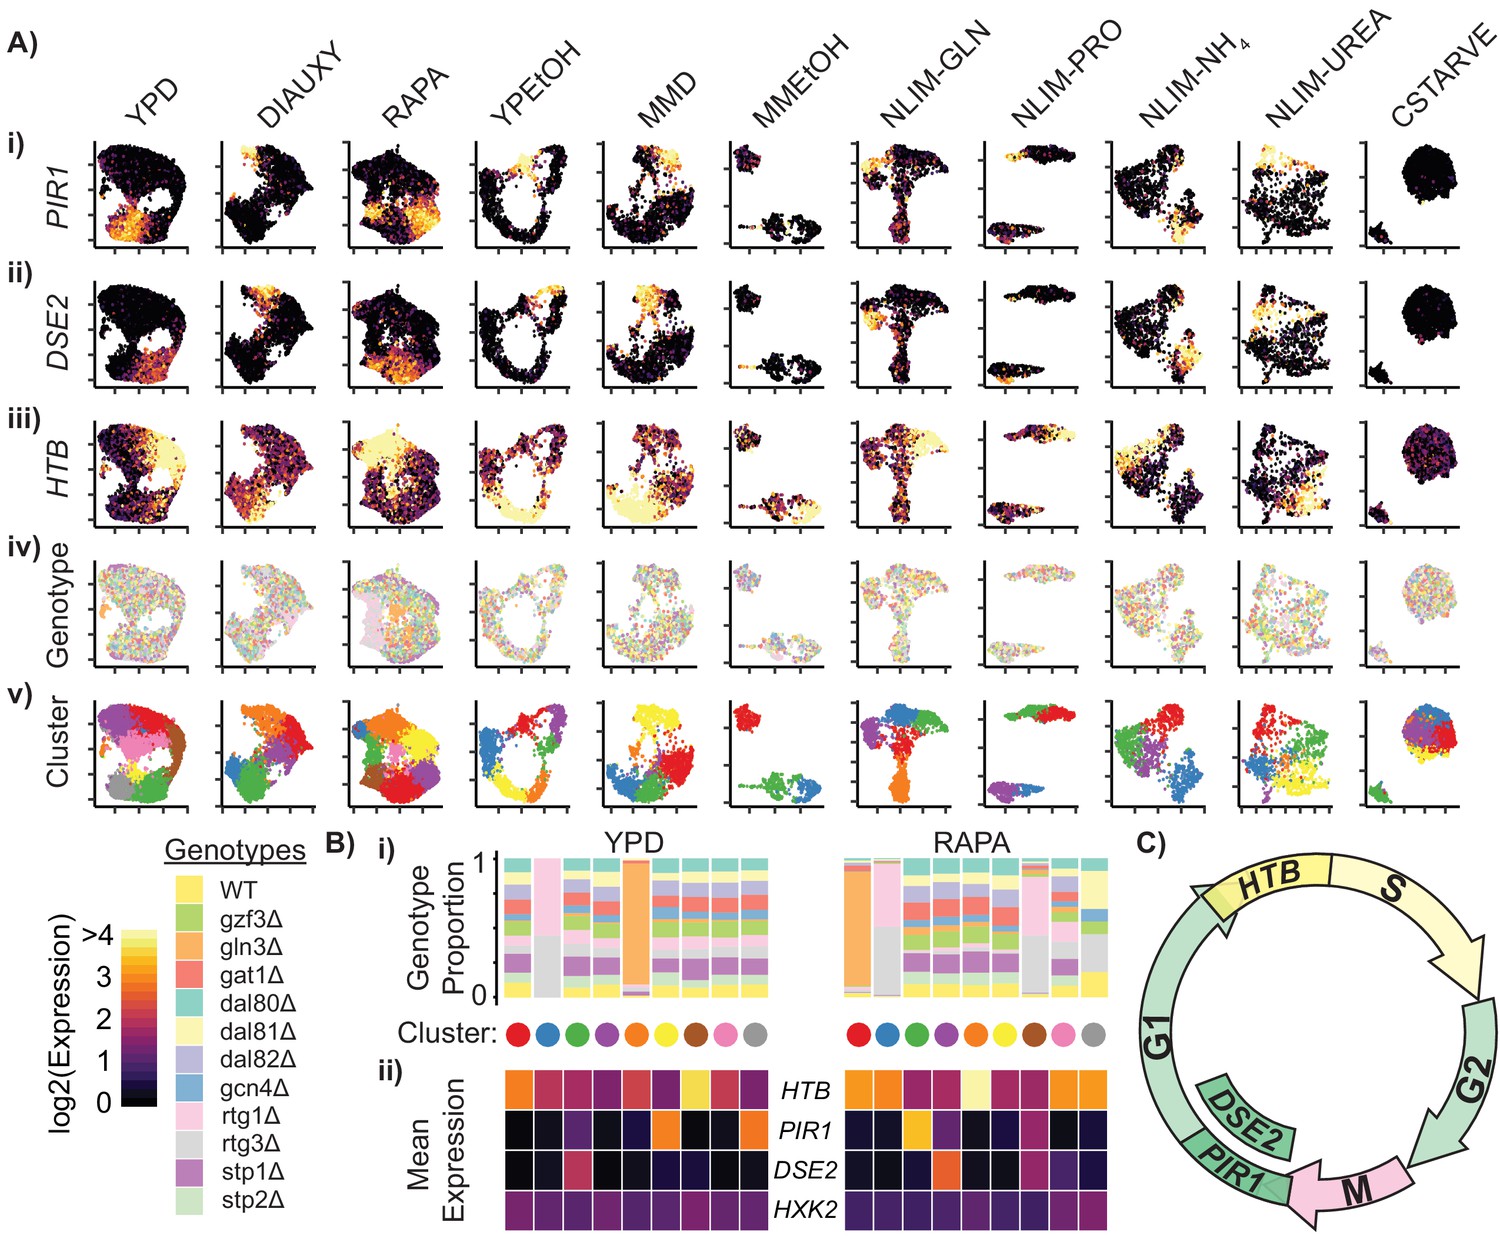
Cells Within Conditions Cluster According to Cell Cycle Genes.
(A) Cells from each growth condition were separately normalized and transformed into 2-dimensional space using UMAP. The log-transformed, normalized expression for each cell of (i) the G1-phase specific marker PIR1, (ii) the G1-phase daughter-cell specific marker DSE2, (iii) the S-phase specific marker histone 2B (HTB) is shown; (iv) the genotype and (v) the cluster membership of each cell. (B) Summary of clustered single cell expression within the YPD and RAPA growth conditions (i) Proportion of cells from a specific strain genotype within each cluster (ii) The mean log-transformed, normalized expression of the G1- and S-phase marker genes, as well as a hexokinase gene HXK2 for each cluster (C) Schematic of the mitotic cell cycle with expression of DSE2, PIR1, and HTB genes annotated.
Figure 3—figure supplement 1
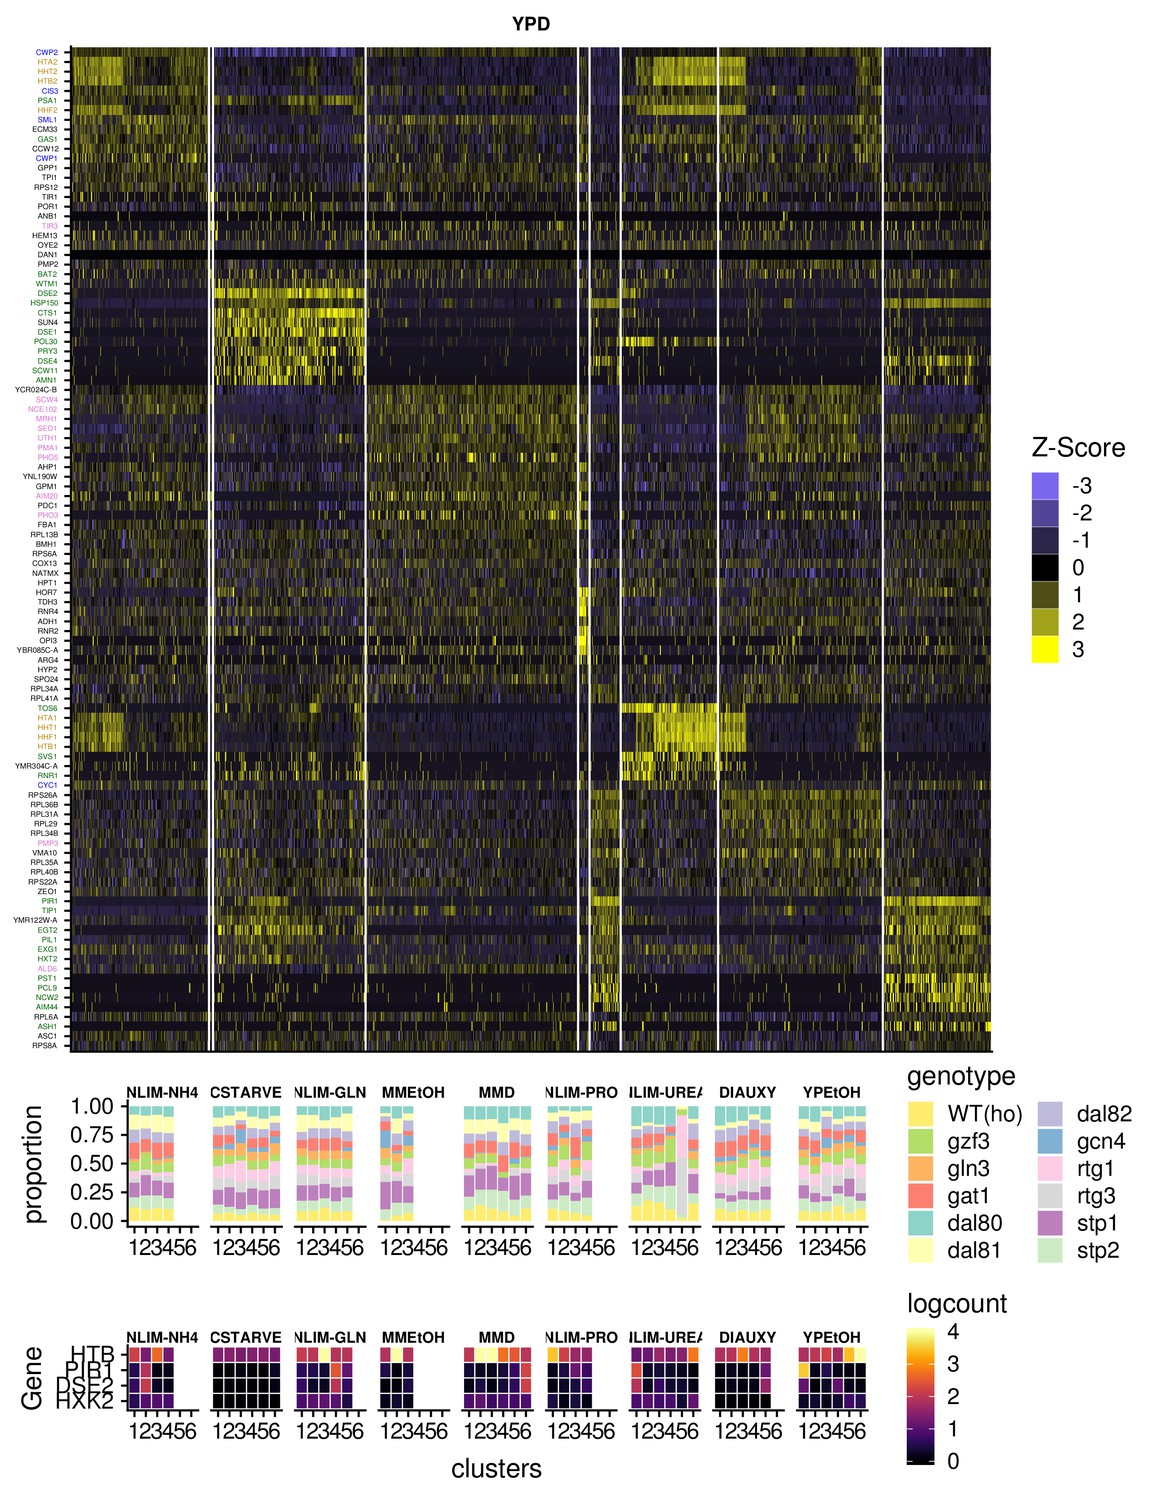
Expression of Important Genes For Clustering.
(A) Gene expression heatmap of genes that are specific for clusters of cells in YPD. Genes name are colored green for G1 phase genes, yellow for S phase genes, blue for G2 phase genes, and purple for M phase genes (B) Summary of clustered single cells within growth conditions (i) Proportion of cells within each cluster that consist of a specific strain genotype (ii) The mean within each cluster of log-transformed, normalized expression of the G1- and S-phase marker genes, as well as a hexokinase gene HXK2 that is unlikely to be responding to cell cycle.
Figure 3—figure supplement 2
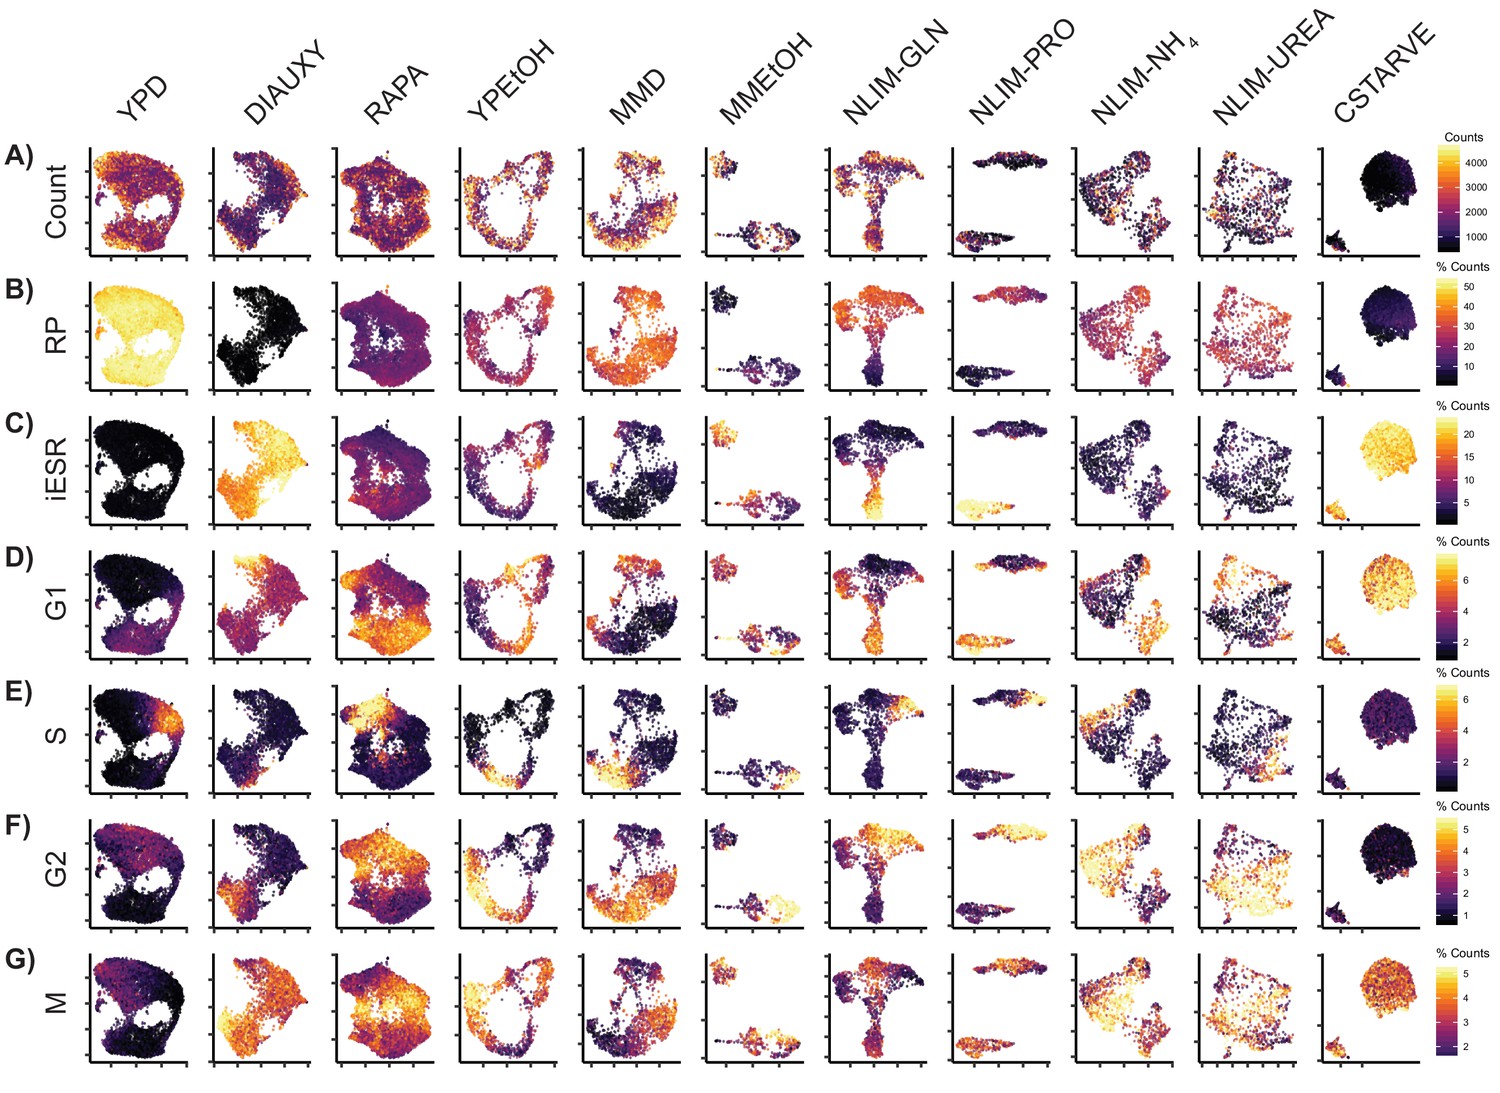
Some Conditions Have Stress Response Clusters Cells from each growth condition were separately normalized and transformed into 2-dimensional space using UMAP.
These single cells are colored by (A) Total raw UMI count (B) Percentage of transcripts which are ribosomal genes (C) Percentage of transcripts which are induced environmental stress response (iESR) genes (D) Percentage of transcripts which annotated as G1 phase genes (E) Percentage of genes which are annotated as S phase genes (F) Percentage of genes which are annotated as G2 phase genes (G) Percentage of genes which are annotated as M phase genes.
Figure 4 with 1 supplement
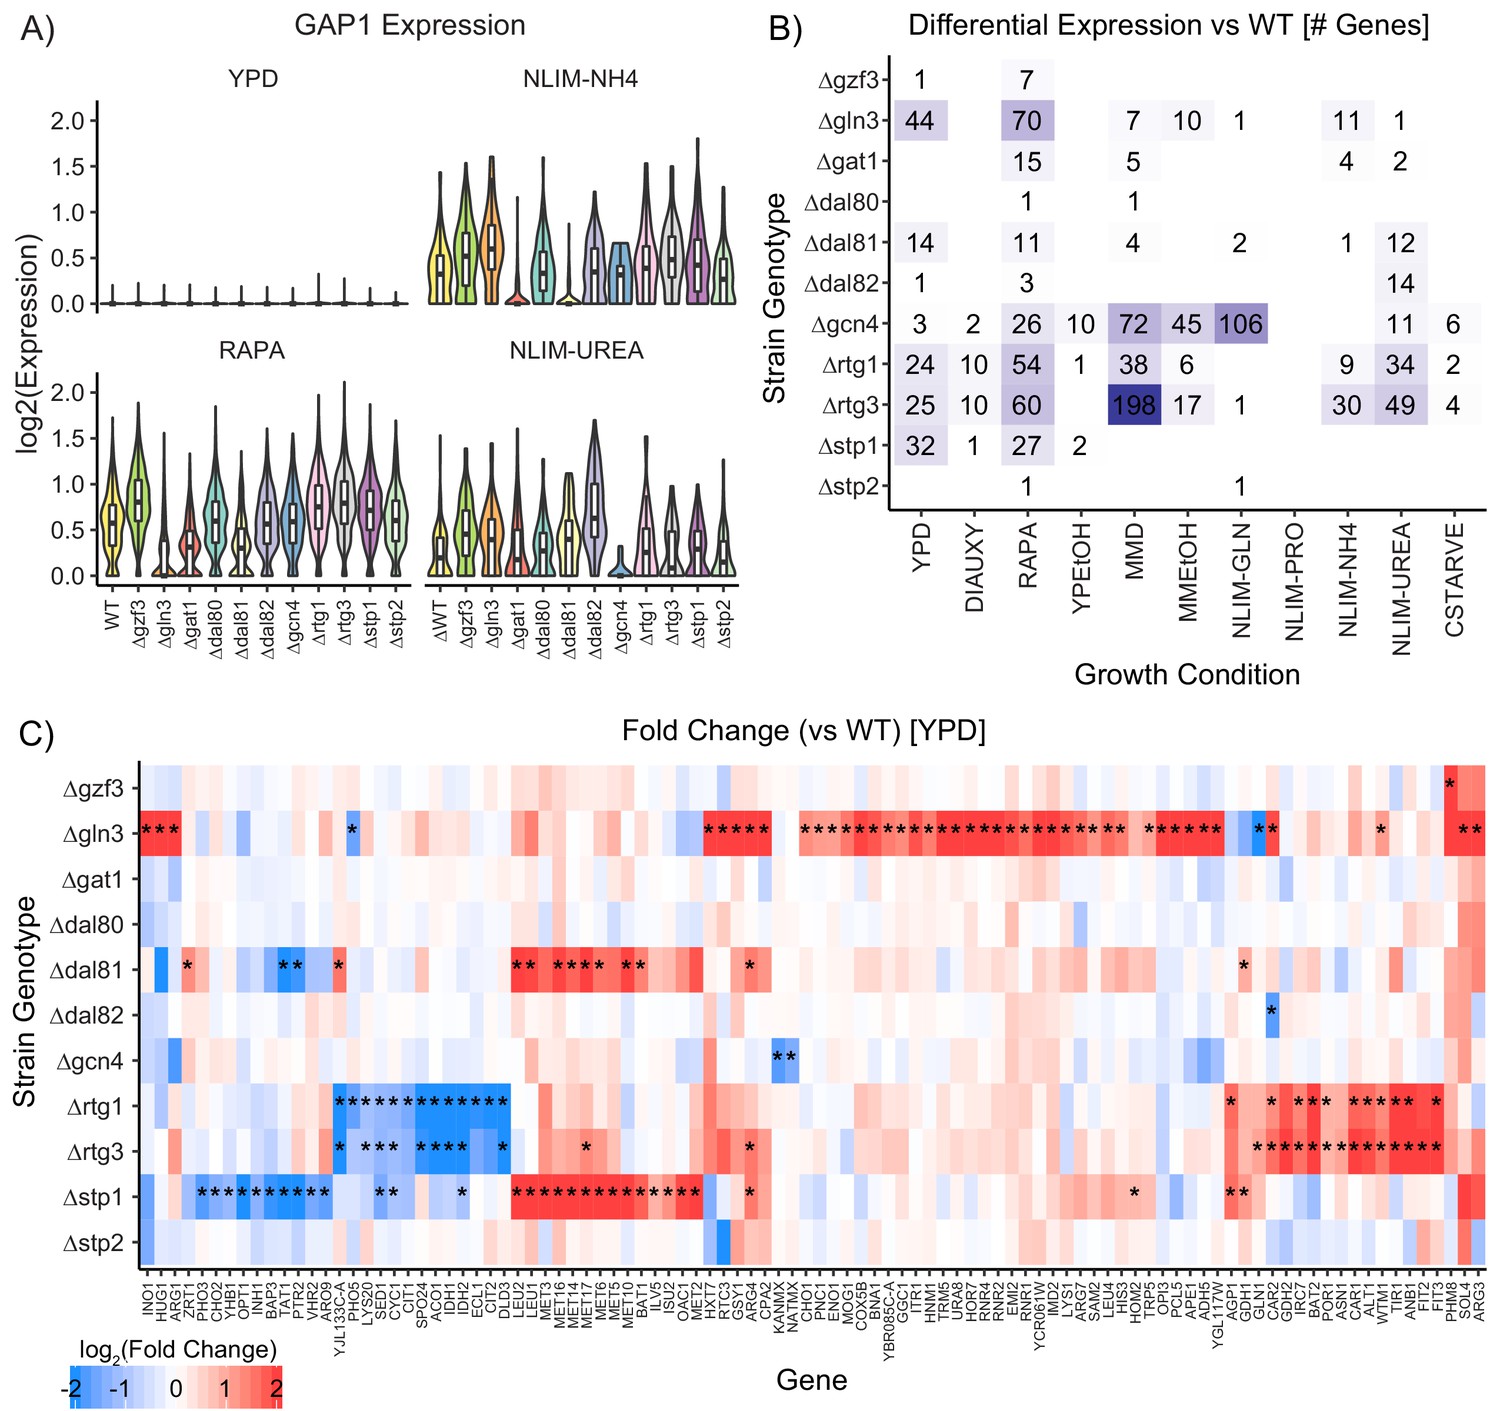
Impact of Deleting Transcription Factors on Gene Expression.
(A) Violin plots of the log2 batch-normalized expression of the general amino acid permease gene GAP1 in YPD, RAPA, ammonium-limited media, and urea-limited media. (B) Count of differentially expressed genes in each combination of growth condition and strain genotype. Data were transformed to pseudobulk values by summing all counts for each the six biological replicates for each genotype and then analyzed for differential gene expression using DESeq2 [1.5-fold change; p.adj <0.05]. (C) Log2(fold change) of genes differentially expressed in TF knockout strains compared to wildtype, when grown in YPD. Asterisks denote statistically significant differences in gene expression [1.5-fold change; p.adj <0.05].
Figure 4—figure supplement 1
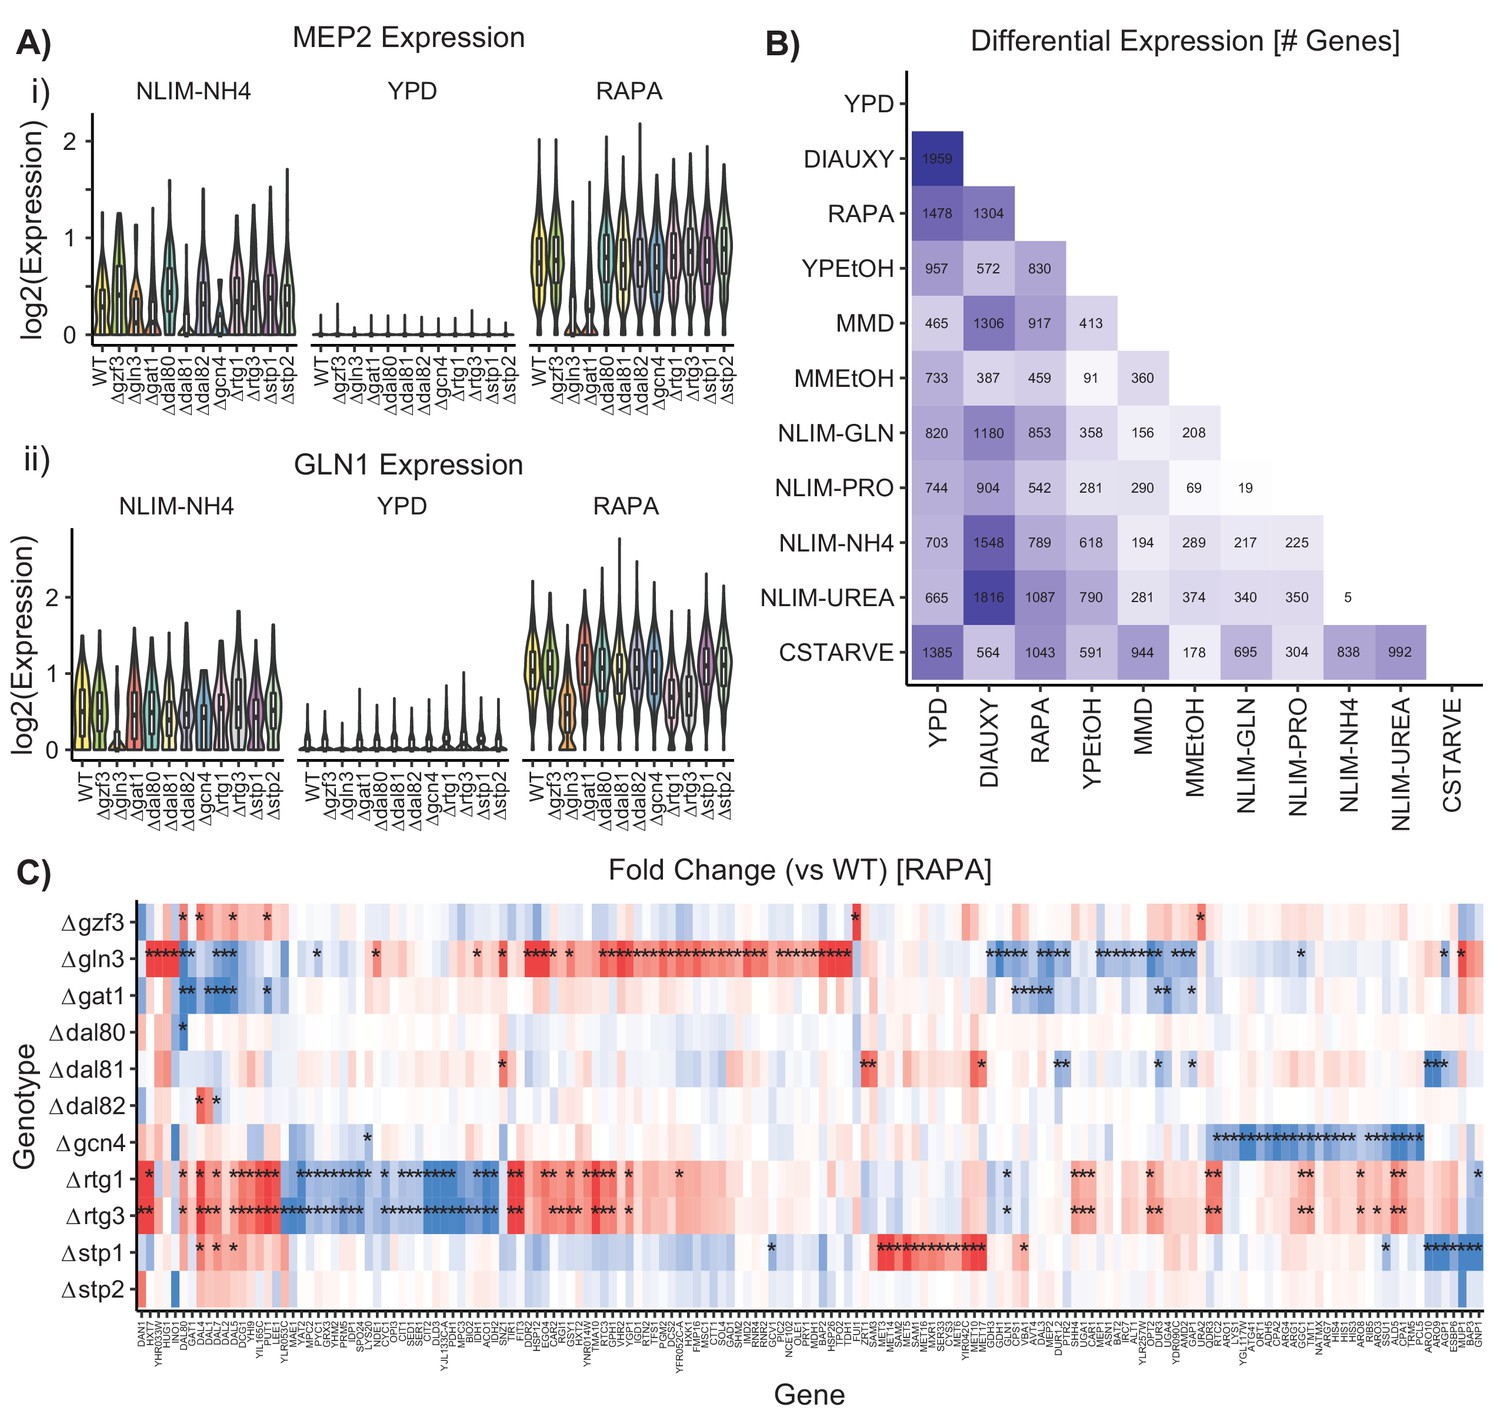
Differential Gene Expression Varies by Condition.
(A) Distribution by strain genotype of the log2 batch-normalized expression of the ammonium permease gene MEP2 and the glutamine synthetase gene GLN1 in YPD, RAPA, and ammonium limitation. (B) Number of differentially expressed genes identified after bulking between wild-type cells in each growth condition (C) Log2(fold change) of genes differentially expressed in TF knockout strains compared to wildtype, when grown in YPD and then treated with rapamycin. Asterisks denote statistically significant differences in gene expression [1.5-fold change; p.adj <0.05].
Figure 5 with 1 supplement
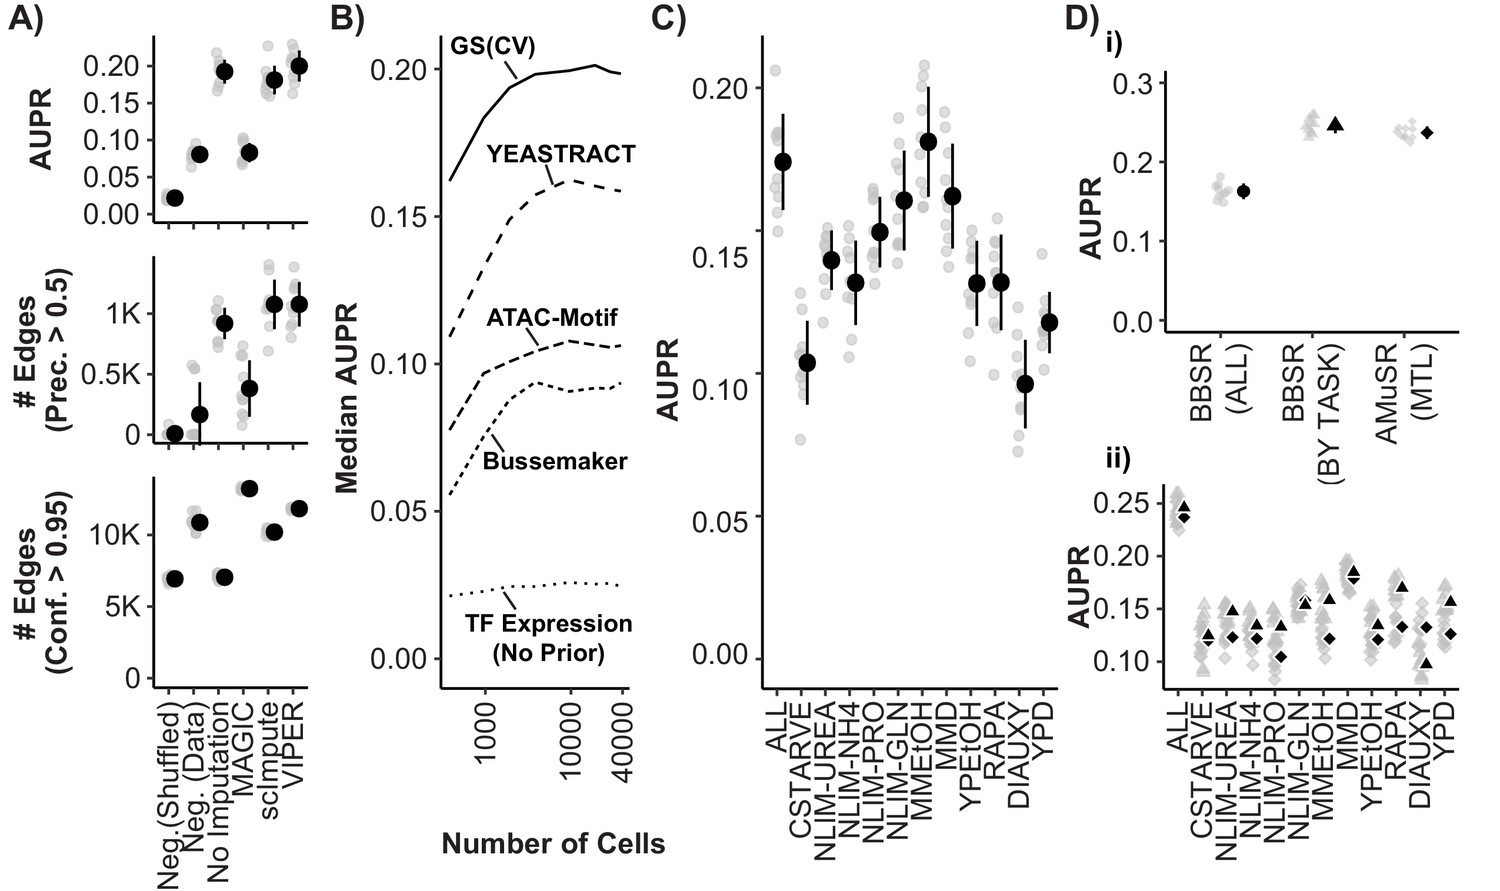
Model Performance and Impact of Data Imputation, Prior Selection, and Multitask learning on Network Inference using the Inferelator.
(A) Model performance of Inferelator (TFA-BBSR) network inference after shuffling priors [Neg.Shuffled], on a simulated negative data set [Neg. Data], on the unaltered count matrix [No Imputation], and after imputing missing data from the count matrix using the MAGIC, ScImpute, and VIPER packages. Model performance is shown using area under the precision-recall curve [AUPR], as well as the number of network edges using a precision (>0.5) cutoff, and the number of network edges using a confidence (>0.95) cutoff. Each point plotted in gray is a separate cross-validation analysis, with mean + /- one standard deviation plotted in black (n = 10). (B) Median AUPR after cross-validation (n = 10) and resampling to different numbers of cells, for priors extracted from the gold standard [GS], the YEASTRACT database, Bussemaker et al, priors predicted from ATAC-seq data and motif searching, and no prior data. (C) AUPR of separate cross-validation network inference using cells from all growth conditions, or from individual conditions separately. Each cross-validation (n = 10) was downsampled to the same number of cells. (D) Cross-validation (n = 10) using the YEASTRACT prior data. Networks are learned for all conditions together [BBSR (ALL) ●], for all conditions individually with TFA-BBSR followed by combination [BBSR (BY TASK) ▲], and for all conditions together in multi-task learning followed by combination [AMuSR (MTL) ◆]. Models are evaluated by (i) AUPR on the aggregate, final network and (ii) AUPR for each task-specific subnetwork from BBSR (BY TASK) (▲) and AMuSR (MTL) (◆).
Figure 5—figure supplement 1
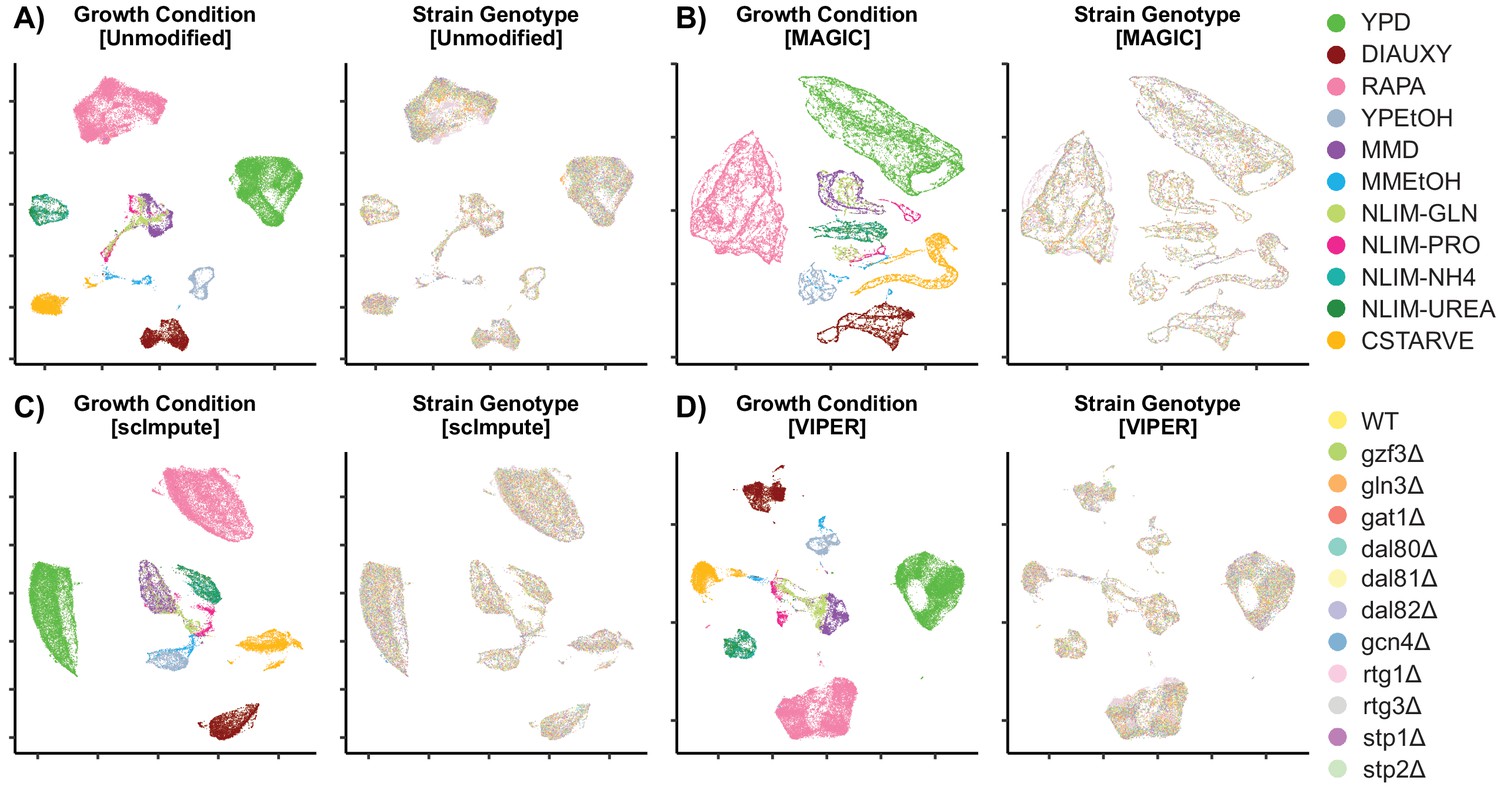
Low-Dimensional Clustering of Imputed Data Scatter plot after UMAP into 2-dimensional space.
Unmodified data (A) is compared to imputation methods to recover missing data using MAGIC (B), ScImpute (C), and VIPER (D).
Figure 6 with 1 supplement
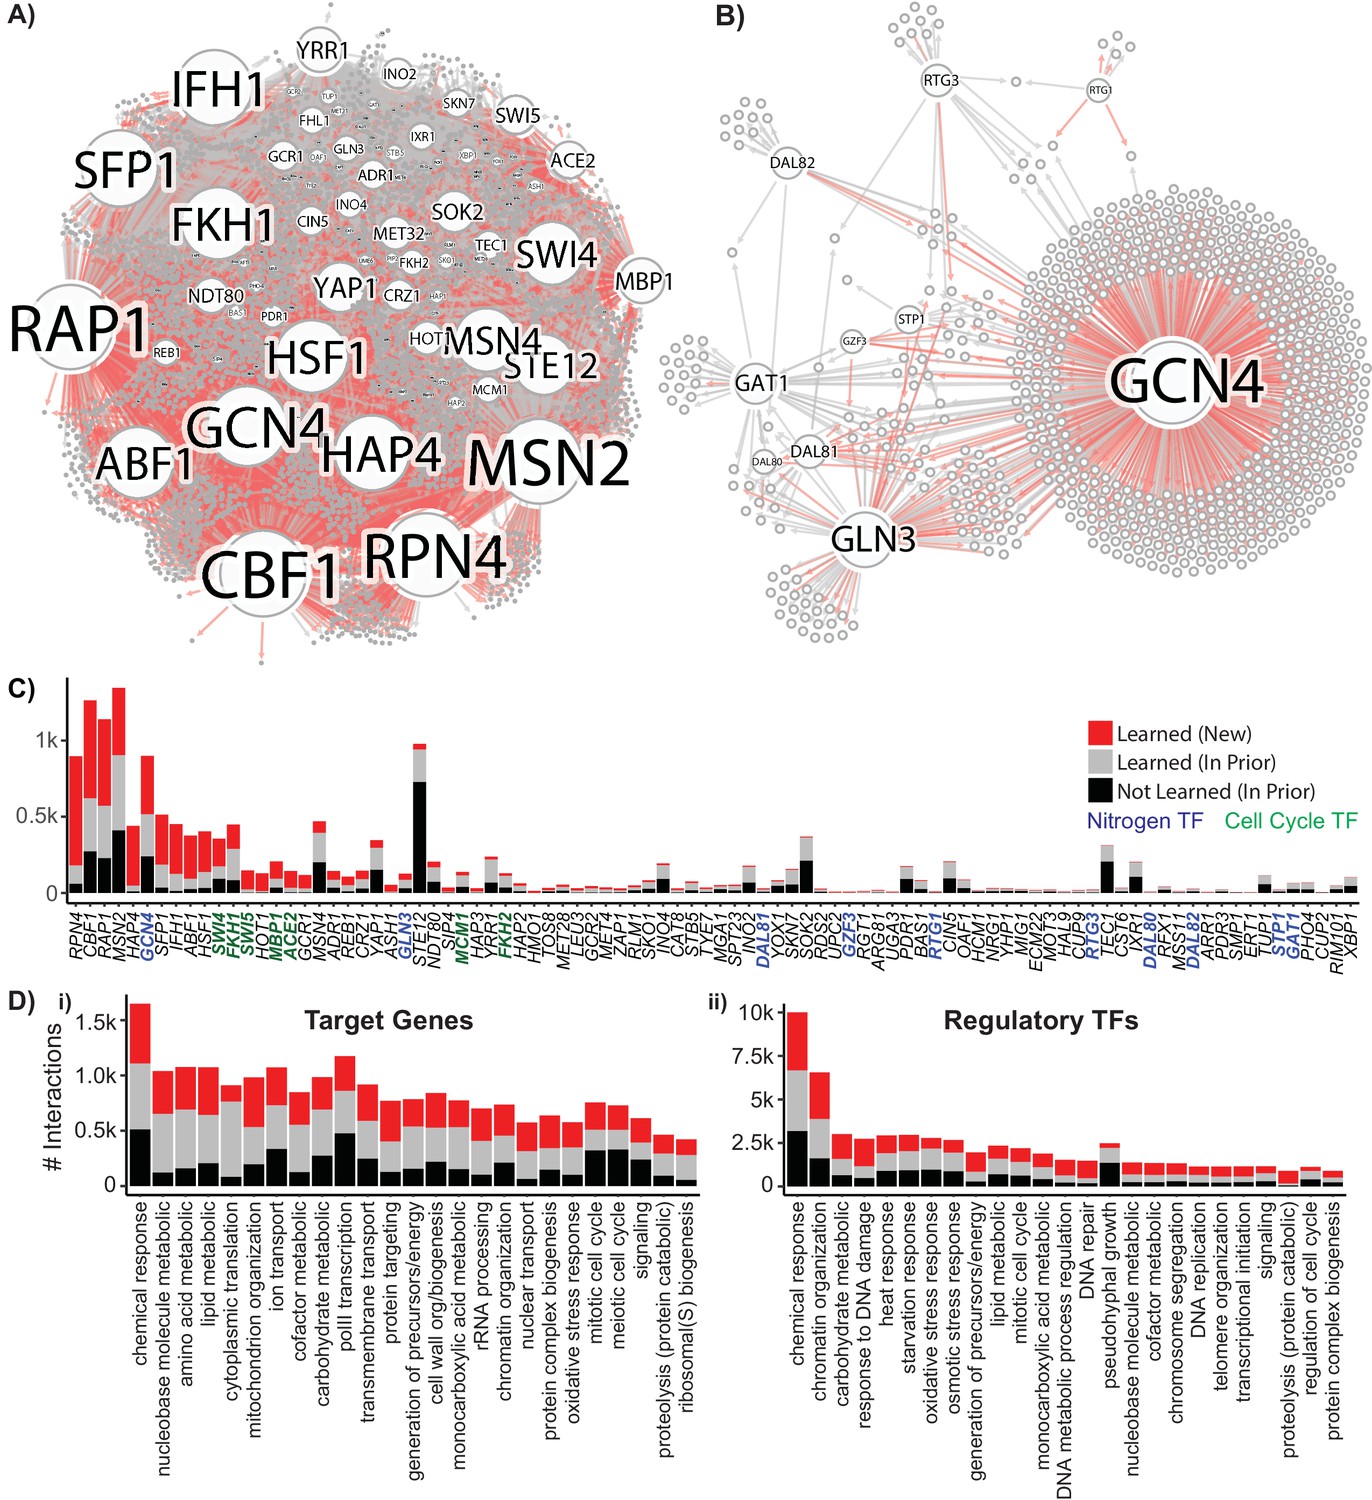
Reconstruction of a Gene Regulatory Network Identifies New Regulatory Relationships.
A network inferred from the single-cell expression data using multi-task learning and the YEASTRACT TF-gene interaction prior, with a cutoff at precision >0.5. (A) Network graph with known interaction edges from the prior in gray and new inferred interaction edges in red (B) Network graph of the 11 nitrogen-responsive transcription factors with known edges from the prior in gray and new edges in red (C) The number of interactions for each TF; interaction edges present in the prior that are not in the final network are included in black. The nitrogen TFs knocked out in this work are labeled in blue, and TFs with gene ontology annotations for mitotic cell cycle are annotated in green (D) Gene ontology classification of network interactions by the GO slim biological process terms annotated for the target gene and the regulatory TF (the GO term transcription from RNA pol II is omitted from the annotations for regulatory TFs).
Figure 6—figure supplement 1
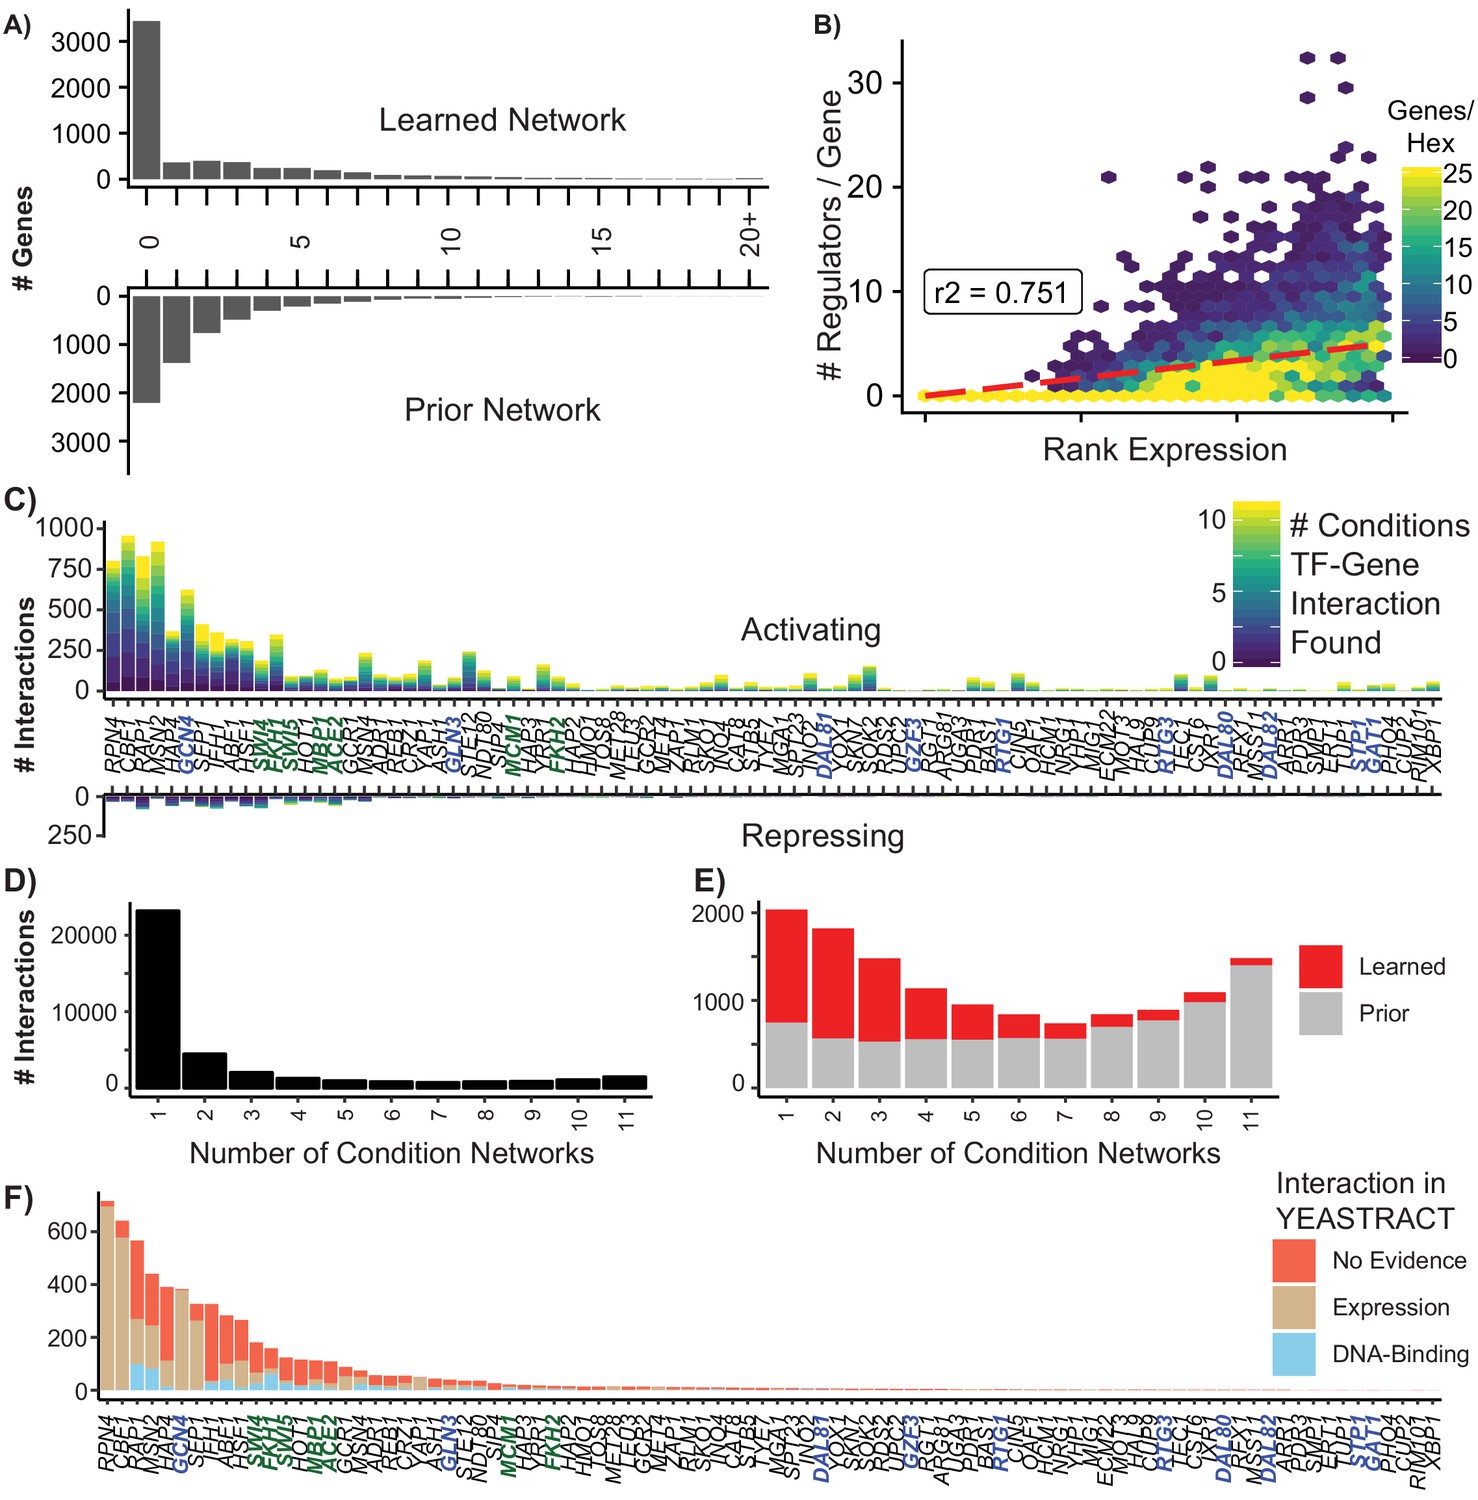
Summary of Learned GRN.
(A) Histogram of the number of regulators per target gene in the learned and prior network (B) Hexagonal heatmap of the ranked expression of a gene against the number of regulators for that gene; r2 is calculated using Spearman’s Rank correlation (C) The number of interactions for a TF that are activating (positive) or repressing (negative). Bars are colored by the number of separate conditions in which the interaction is identified, with condition-specific networks selected using a precision threshold of 0.5 (D) The number of unique TF-gene interactions identified in condition-specific networks (E) The distribution of learned and prior interactions from the final, aggregate network in condition-specific networks (F) Evidence for learned network edges which are not in the prior. Interactions where YEASTRACT has evidence for a change in gene expression when the TF is perturbed are in tan. Interactions where YEASTRACT has evidence that the TF physically localizes to the gene are in blue. Interactions where YEASTRACT has no annotated evidence are in red.
Figure 7 with 1 supplement
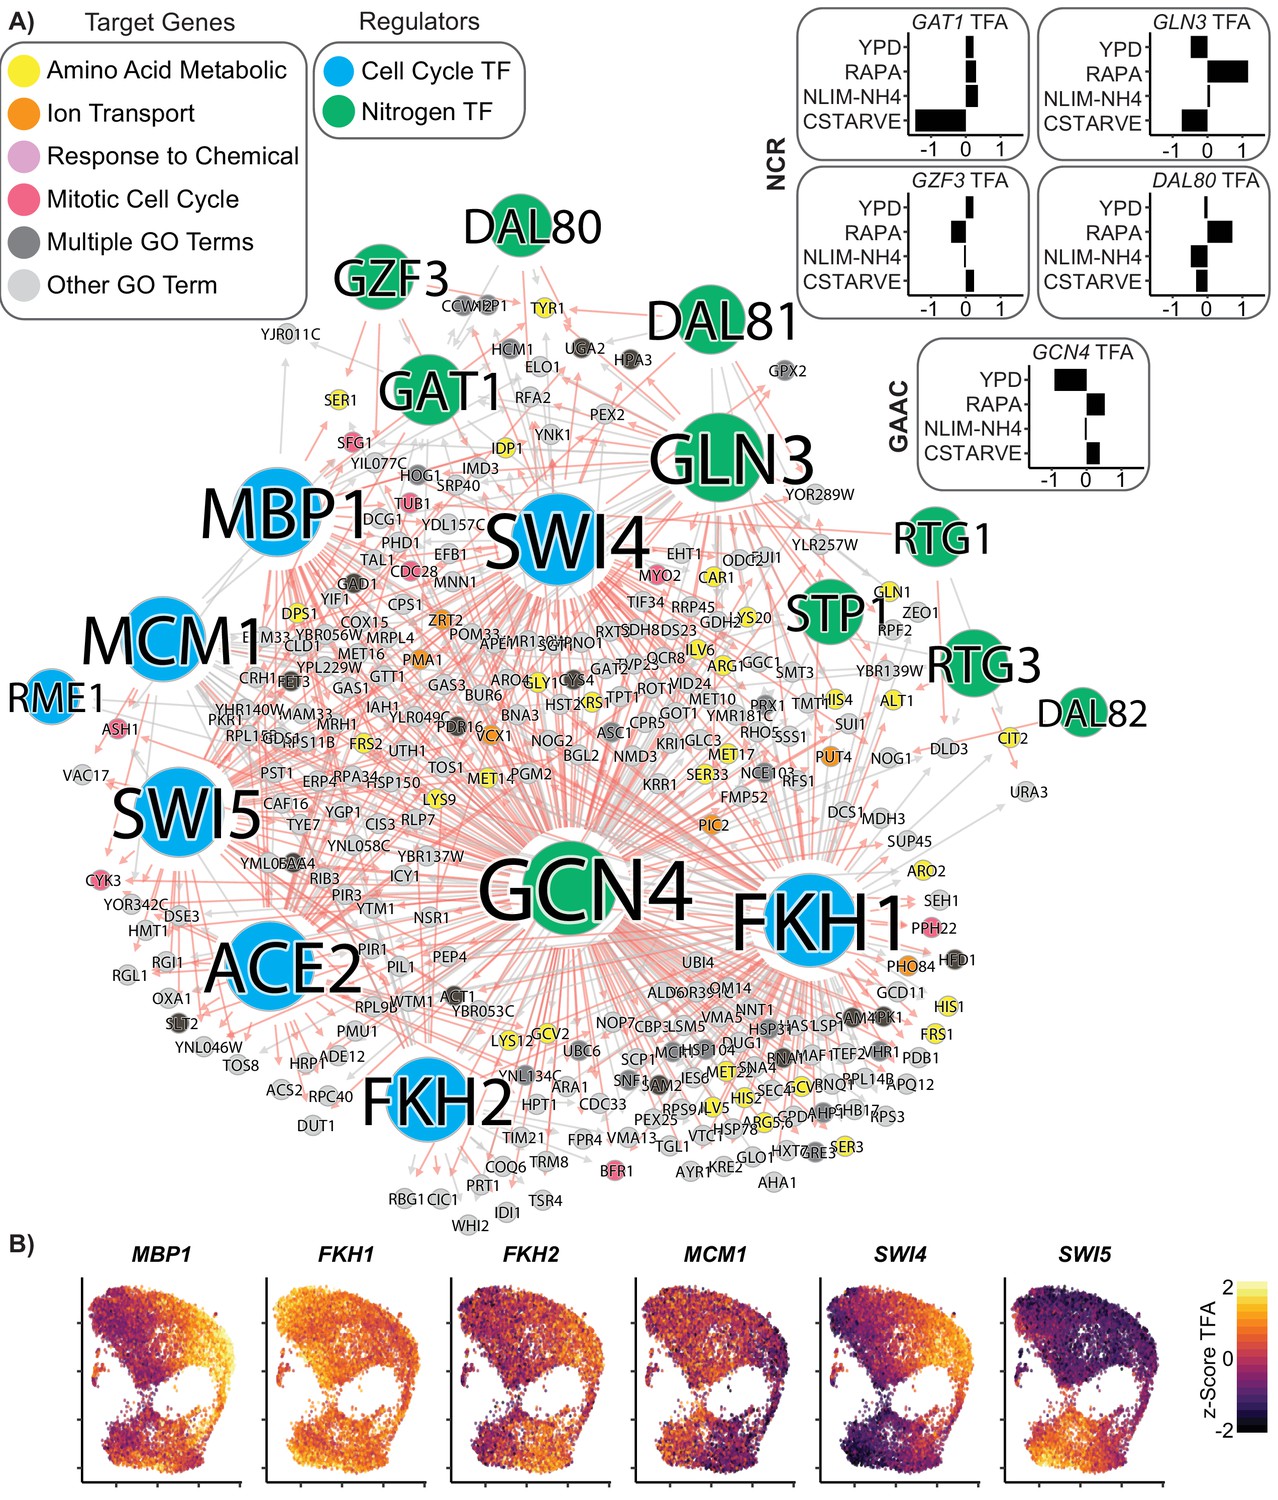
Coordinated regulation of Nitrogen Response and Cell Cycle.
(A) A gene regulatory network showing target genes that are regulated by at least one nitrogen TF (blue) and at least one cell cycle TF (green). Target gene nodes are colored by GO slim term. Newly inferred regulatory edges are red and known regulatory edges from the prior are in gray. Transcription factor activity (TFA) is calculated from the learned network and then scaled to a z-score over all cells which do not have that TF deleted (e.g. gcn4Δ cells are omitted from the calculation for GCN4 TFA). The mean TFA z-score for four selected conditions is inset for GAAC and NCR TFs (B) TFA for cell cycle TFs for each cell in the YPD growth condition.
Figure 7—figure supplement 1

Cell Cycle TF Activity Clusters within Growth Conditions.
Cells grown in YPD are plotted after UMAP with (A–B) z-Score of the calculated transcription factor activity (TFA) based on the learned network for (A) select nitrogen TFs and (B) cell cycle TFs (C) Log2 of the expression of cell cycle TFs (D) Log2 of the expression of cell cycle target genes.
Tables
Table 1
Environmental Growth Conditions.
Environmental growth conditions are listed with their respective nitrogen and carbon sources. Yeast Extract + Peptone (YP) is a rich, complex nitrogen source. YP + Dextrose [YPD] is standard yeast rich media. Minimal media contains a standard base of trace metals, vitamins, and salts. All cultures were harvested 4 hr after inoculation, except for the culture harvested after the diauxic shift [DIAUXY], which was harvested 10 hr after inoculation. Rapamycin was added to YPD in the [RAPA] culture 30 min prior to harvest. Specific media formulations are listed in Supplementary file 1-Supplemental Table 4.
| Growth condition | Abbrv. | Nitrogen source | Carbon source |
|---|---|---|---|
| Yeast Extract, Peptone, Glucose | YPD | YP | D-Glucose |
| YPD (Harvested after Post-Diauxic Shift) | DIAUXY | YP | D-Glucose |
| YPD + 200 ng/mL Rapamycin | RAPA | YP | D-Glucose |
| Yeast Extract, Peptone, Ethanol | YPEtOH | YP | Ethanol |
| Minimal Media (Glucose) | MMD | 20 mM (NH4)2SO4 | D-Glucose |
| Minimal Media (Ethanol) | MMEtOH | 20 mM (NH4)2SO4 | Ethanol |
| Nitrogen Limited Minimal Media (with Glutamine) | NLIM-GLN | 0.8 mM L-Glutamine | D-Glucose |
| Nitrogen Limited Minimal Media (with Proline) | NLIM-PRO | 0.8 mM L-Proline | D-Glucose |
| Nitrogen Limited Minimal Media (with NH4) | NLIM-NH4 | 0.8 mM (NH4)2SO4 | D-Glucose |
| Nitrogen Limited Minimal Media (with Urea) | NLIM-UREA | 0.8 mM Urea | D-Glucose |
| Carbon Starvation | CSTARVE | 1 mM (NH4)2SO4 | None |
Additional files
-
Source code 1
A ‘tar.gz’ archive containing R scripts used to generate Figures 2–7 and accompanying supplementary figures with a README detailing the necessary R environment to run them locally.
It also contains a data folder with the raw count matrix as a TSV file (103118_SS_Data.tsv.gz), the simulated negative data count matrix as a TSV file (110518_SS_NEG_Data.tsv.gz), a gene name metadata TSV file (yeast_gene_names.tsv), supplemental tables 5 (STable5.tsv) and 6 (STable6.tsv) as TSV files, and the yeast gene ontology slim mapping as a TAB file (go_slim_mapping.tab). Source code 1 also contains a priors folder with the Gold Standard, the three sets of priors data tested in this work, and the YEASTRACT comparison data, all as TSV files. Source code 1 also contains a network folder with the network learned in this paper (signed_network.tsv) as a TSV file, and the networks for each experimental condition (COND_signed_network.tsv) as 11 separate TSV files. Source code 1 also contains an inferelator folder with the python scripts used to generate the networks for Figures 5, 6, 7.
- https://cdn.elifesciences.org/articles/51254/elife-51254-code1-v2.gz
-
Source code 2
The raw count matrix as a gzipped TSV file.
This file contains 38,225 observations (cells). Doublets and low-count cells have already been removed; gene expression values are unmodified transcript counts after deartifacting using UMIs (these values are directly produced by the cellranger count pipeline)
- https://cdn.elifesciences.org/articles/51254/elife-51254-code2-v2.gz
-
Source code 3
The network learned in this paper as a TSV file.
- https://cdn.elifesciences.org/articles/51254/elife-51254-code3-v2.tsv
-
Source code 4
A ‘.tar.gz’ archive containing the sequences used for mapping reads.
It also contains a FASTA file containing the genotype-specific barcodes (bcdel_1_barcodes.fasta), a FASTA file containing the yeast S288C genome modified with markers (Saccharomyces_cerevisiae.R64-1-1.dna.toplevel.Marker.fa), and a GTF file containing the yeast gene annotations modified to include untranslated regions at the 5’ and 3’ end, and with markers (Saccharomyces_cerevisiae.R64-1-1.Marker.UTR.notRNA.gtf).
- https://cdn.elifesciences.org/articles/51254/elife-51254-code4-v2.gz
-
Source code 5
A zipped HTML document containing the raw R output figures for Figures 2–7 and accompanying supplementary Figures.
The R markdown file to create this document is contained in Source code 1.
- https://cdn.elifesciences.org/articles/51254/elife-51254-code5-v2.zip
-
Supplementary file 1
An excel file containing Supplemental Tables 1-6.
Supplemental Table 1 contains all primer sequences used in this work. Supplemental Table 2 contains all Saccharomyces cerevisiae strains used in this work. Supplemental Table 3 contains all plasmids used in this work. Supplemental Table 4 contains all media formulations used in this work. Supplemental Table 5 contains the source data for modeling performance (as AUPR) that is reported graphically in Figure 5. Supplemental Table 6 contains the gene categorizations (cell cycle stage, RP, RiBi, etc) used in Figure 3.
- https://cdn.elifesciences.org/articles/51254/elife-51254-supp1-v2.xlsx
-
Transparent reporting form
- https://cdn.elifesciences.org/articles/51254/elife-51254-transrepform-v2.pdf
Download links
A two-part list of links to download the article, or parts of the article, in various formats.
Downloads (link to download the article as PDF)
Open citations (links to open the citations from this article in various online reference manager services)
Cite this article (links to download the citations from this article in formats compatible with various reference manager tools)
Gene regulatory network reconstruction using single-cell RNA sequencing of barcoded genotypes in diverse environments
eLife 9:e51254.
https://doi.org/10.7554/eLife.51254


