Dopaminergic modulation of the exploration/exploitation trade-off in human decision-making
- Department of Systems Neuroscience, University Medical Center Hamburg-Eppendorf, Germany
- Department of Psychology, Biological Psychology, University of Cologne, Germany
- Institut du Cerveau et de la Moelle épinière - ICM, Centre de NeuroImagerie de Recherche - CENIR, Sorbonne Universités, Groupe Hospitalier Pitié-Salpêtrière, France
- German Center for Addiction Research in Childhood and Adolescence, University Medical Center Hamburg-Eppendorf, Germany
Figures
Figure 1
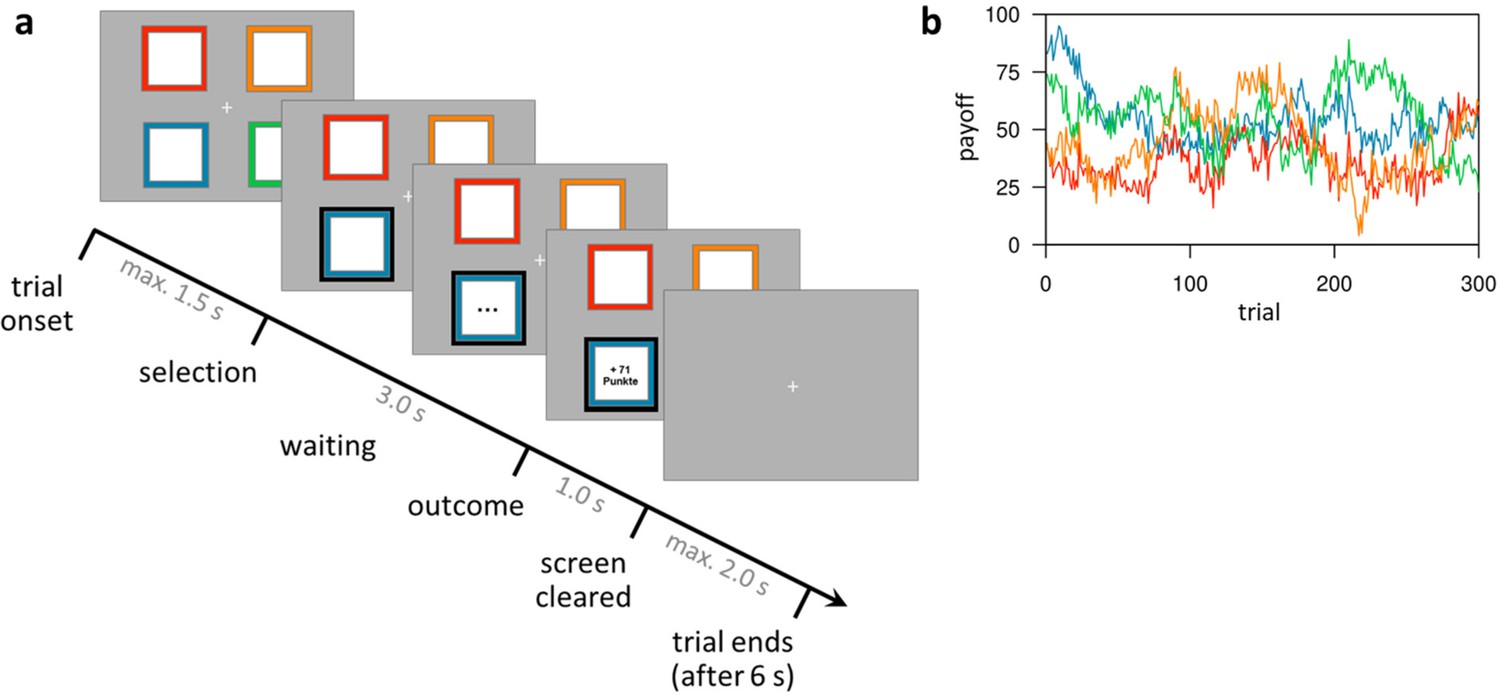
Task design of the restless four-armed bandit task (Daw et al., 2006).
(a) Illustration of the timeline within a trial. At trial onset, four colored squares (bandits) are presented. The participant selects one bandit within 1.5 s, which is then highlighted and, after a waiting period of 3 s, the payoff is revealed for 1 s. After that, the screen is cleared and the next trial starts after a fixed trial length of 6 s plus a variable intertrial interval (not shown) with a mean of 2 s. (b) Example of the underlying reward structure. Each colored line shows the payoffs of one bandit (mean payoff plus Gaussian noise) that would be received by choosing that bandit on each trial.
Figure 2
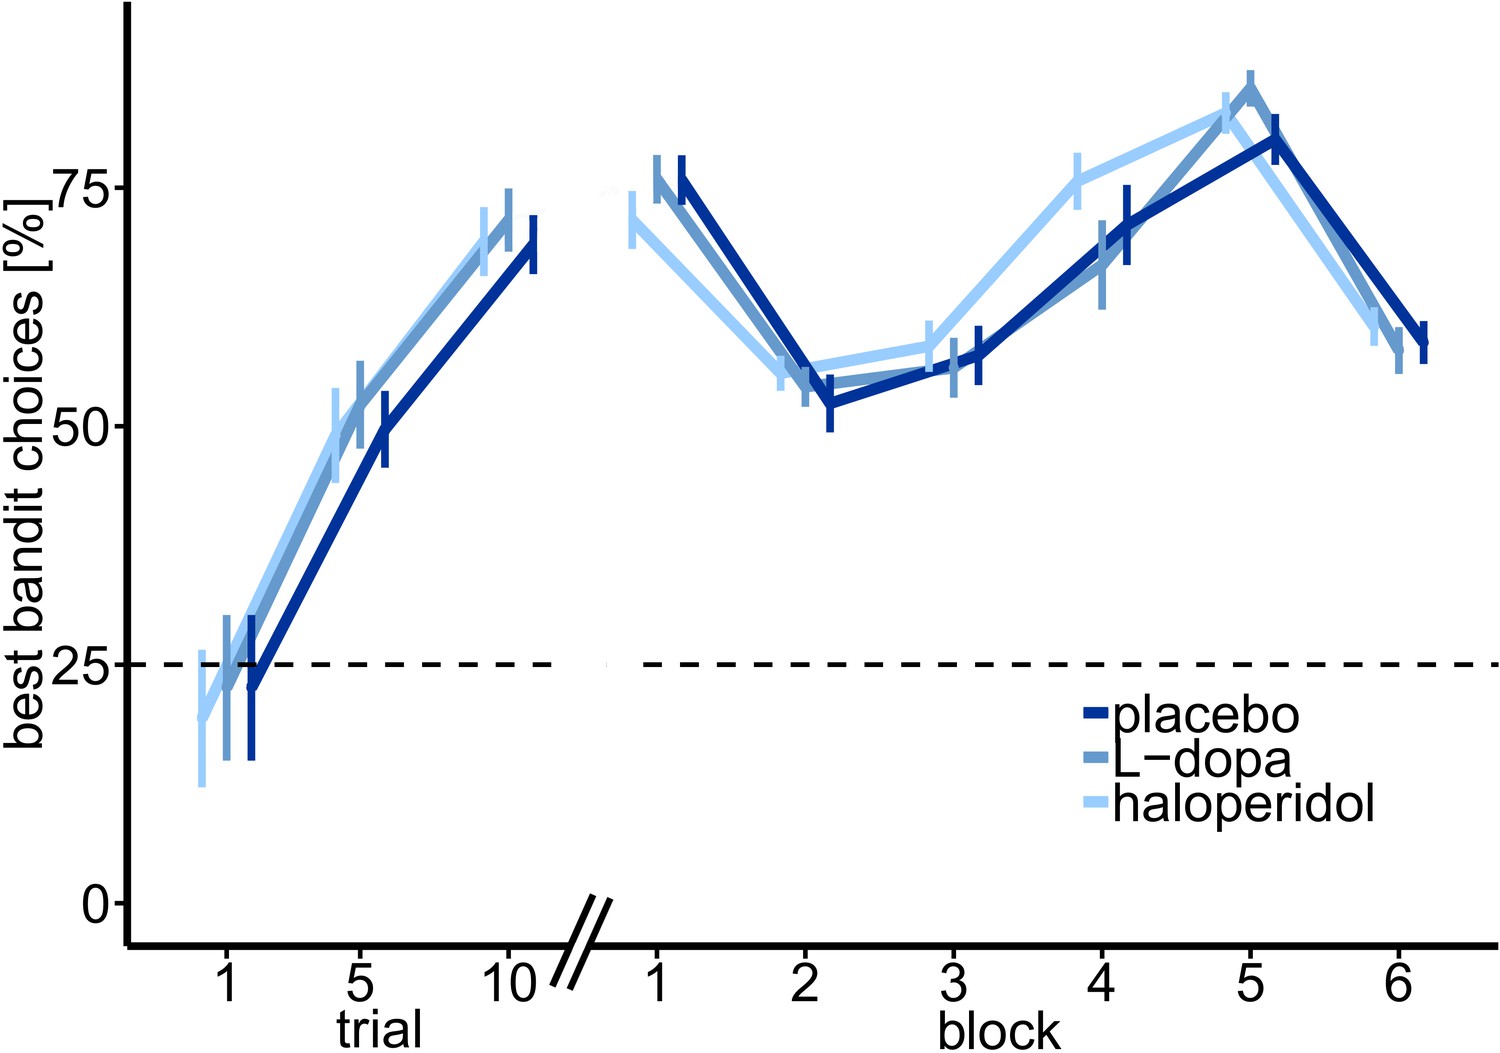
Percentage of optimal choices (highest payoff) throughout the task.
Shown are the mean percentage of choosing the best bandit in trials 1–10, and over task blocks of trials 11–50 (block 1) and 51–300 separated in 5 blocks of 50 trials each, over all participants, and for each drug session separately. Participants started with randomly (~25%) choosing one bandit in trial 1 (21.5% ± 7.49%, M ± SE). After five trials participants already chose the most valuable bandit with 49.03 ± 4.98% (M ± SE).
Figure 3
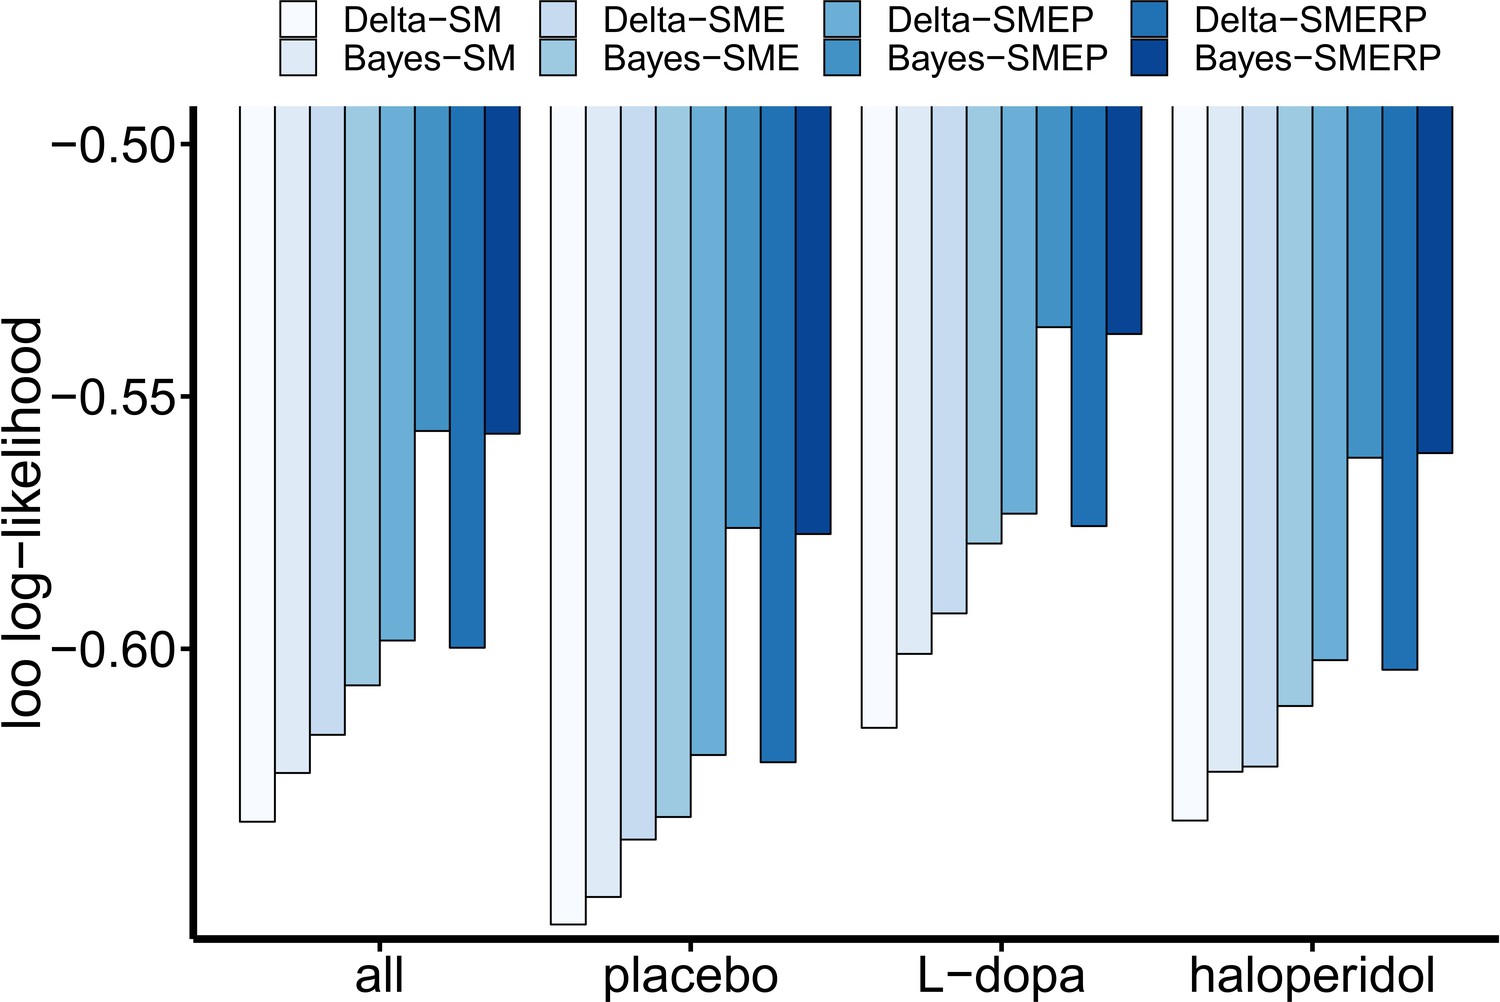
Results of the cognitive model comparison.
Leave-one-out (LOO) log-likelihood estimates were calculated over all drug conditions (n = 31 subjects with t = 3*300 trials) and once separately for each drug condition (n = 31 with t = 300). All LOO estimates were divided by the total number of data points in the sample (n*t) for better comparability across the different approaches. Note that the relative order of LOO estimates is invariant to linear transformations. Delta: simple delta learning rule; Bayes: Bayesian learner; SM: softmax (random exploration); E: directed exploration; R: total uncertainty-based random exploration; P: perseveration.
Figure 4
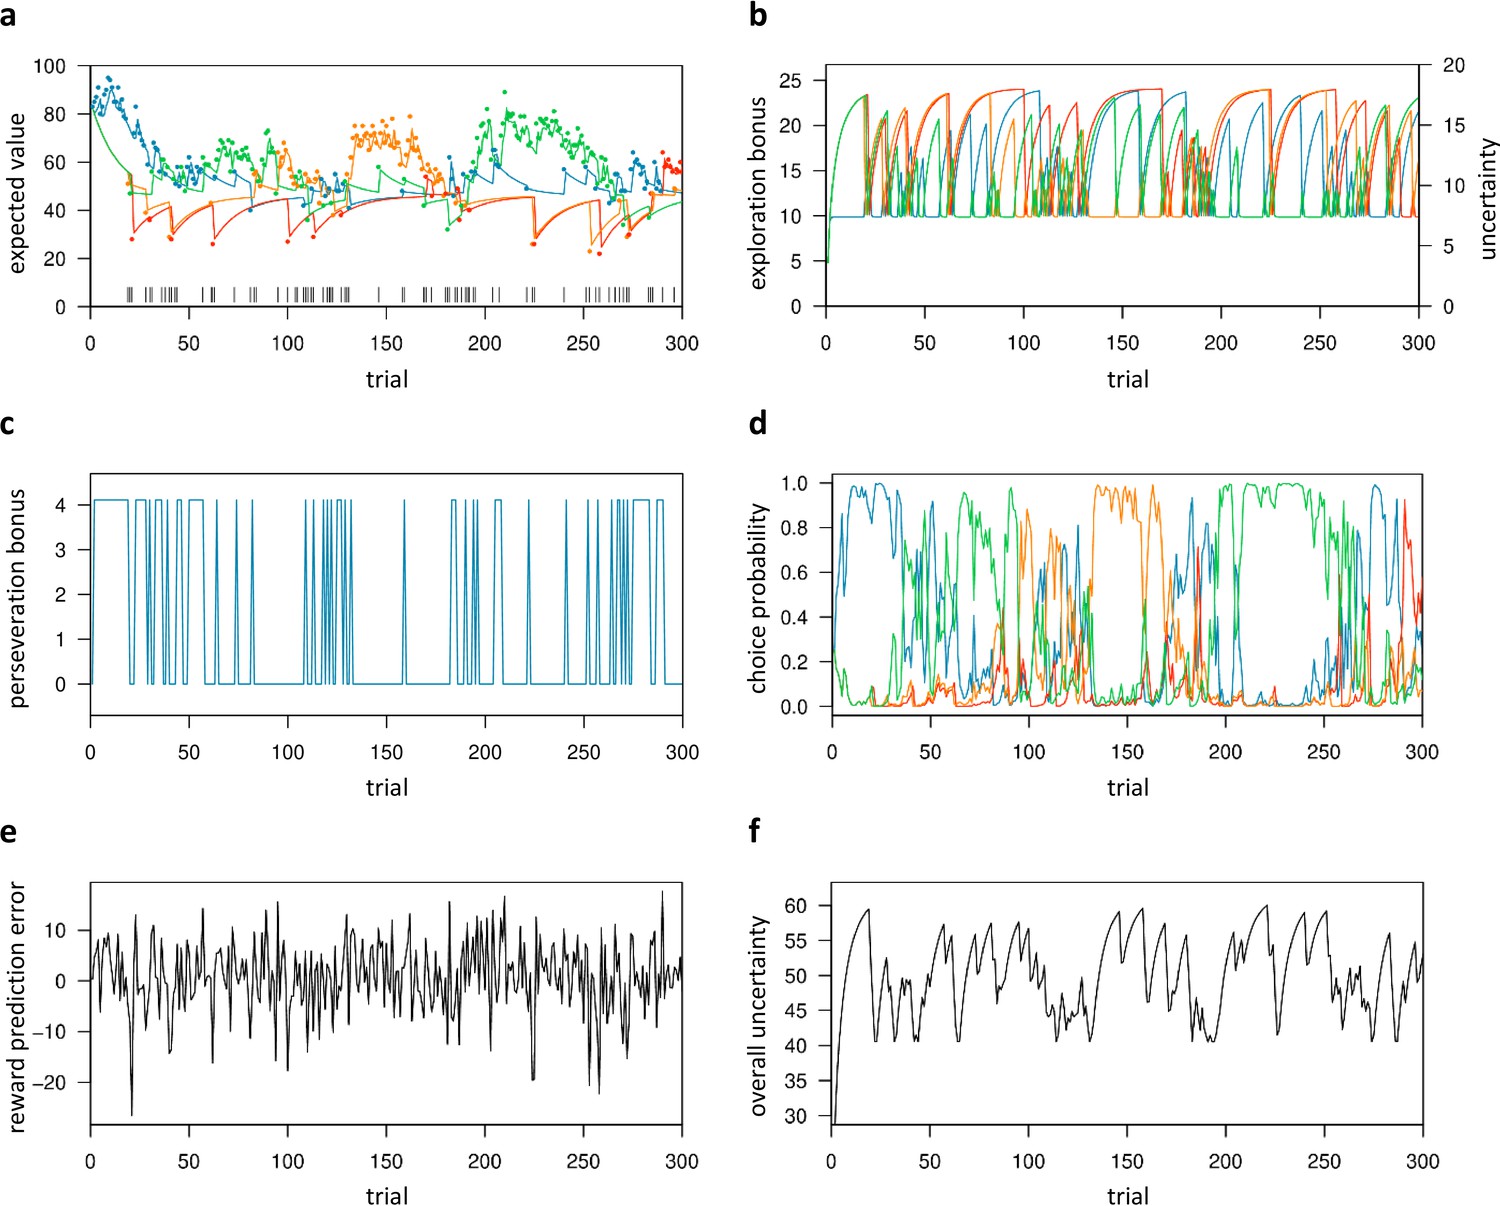
Trial-by-trial variables of the best-fitting Bayesian model (Bayes-SMEP).
Trial-by-trial estimates are shown for the placebo data of one representative subject with posterior medians: β=0.29, = 1.34, and ρ=4.11 (random exploration, directed exploration, and perseveration). (a) Colored lines depict the expected values () of the four bandits, whereas colored dots denote actual payoffs. Vertical black lines mark trials classified as exploratory (Daw et al., 2006). (b) Exploration bonus () and uncertainty () for each bandit. (c) Perseveration bonus (Iρ). This bonus is a fixed value added only to the bandit chosen in the previous trial, shown here for one bandit. (d) Choice probability (). Each colored line represents one bandit. (e) Reward prediction error (). (f) The subject’s overall uncertainty (), that is the summed uncertainty over all four bandits.
Figure 5
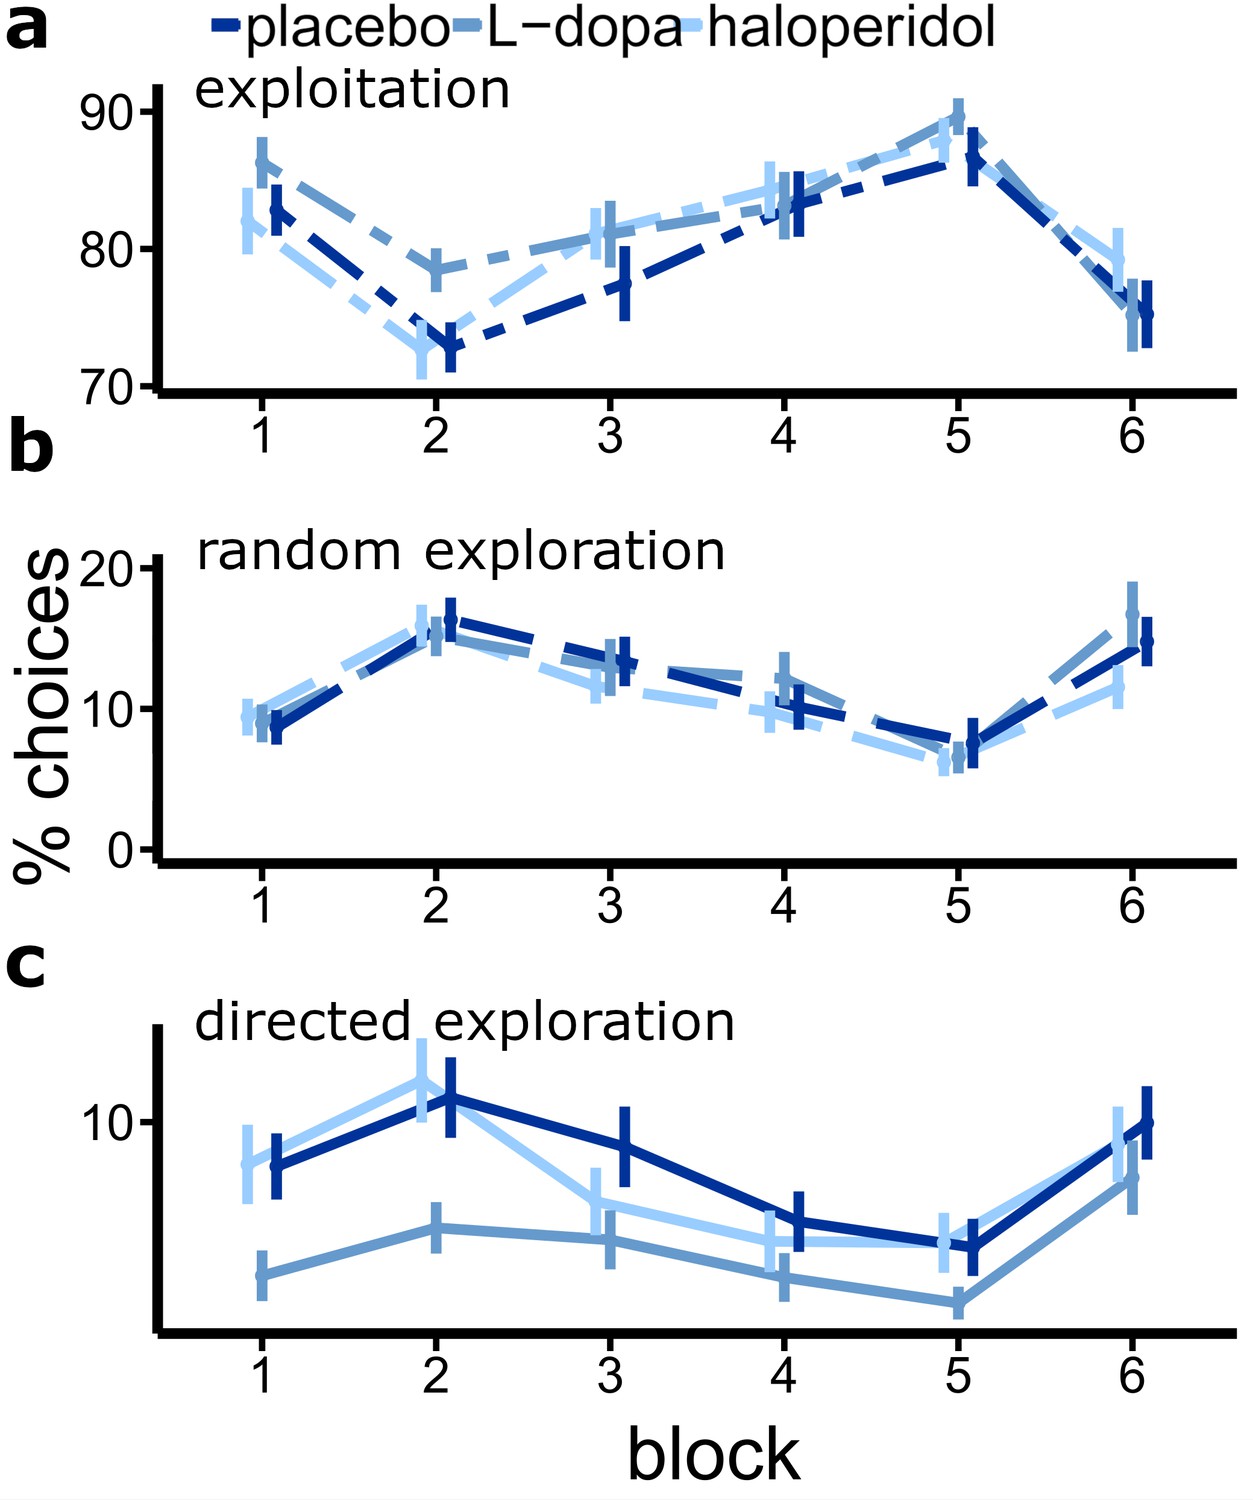
Drug effects on the percentage of exploitations and explorations (bandit with highest uncertainty is chosen).
Shown are the mean percentage of directed explorations for each drug session over six blocks of 50 trials each (error bars indicate standard error of the mean).
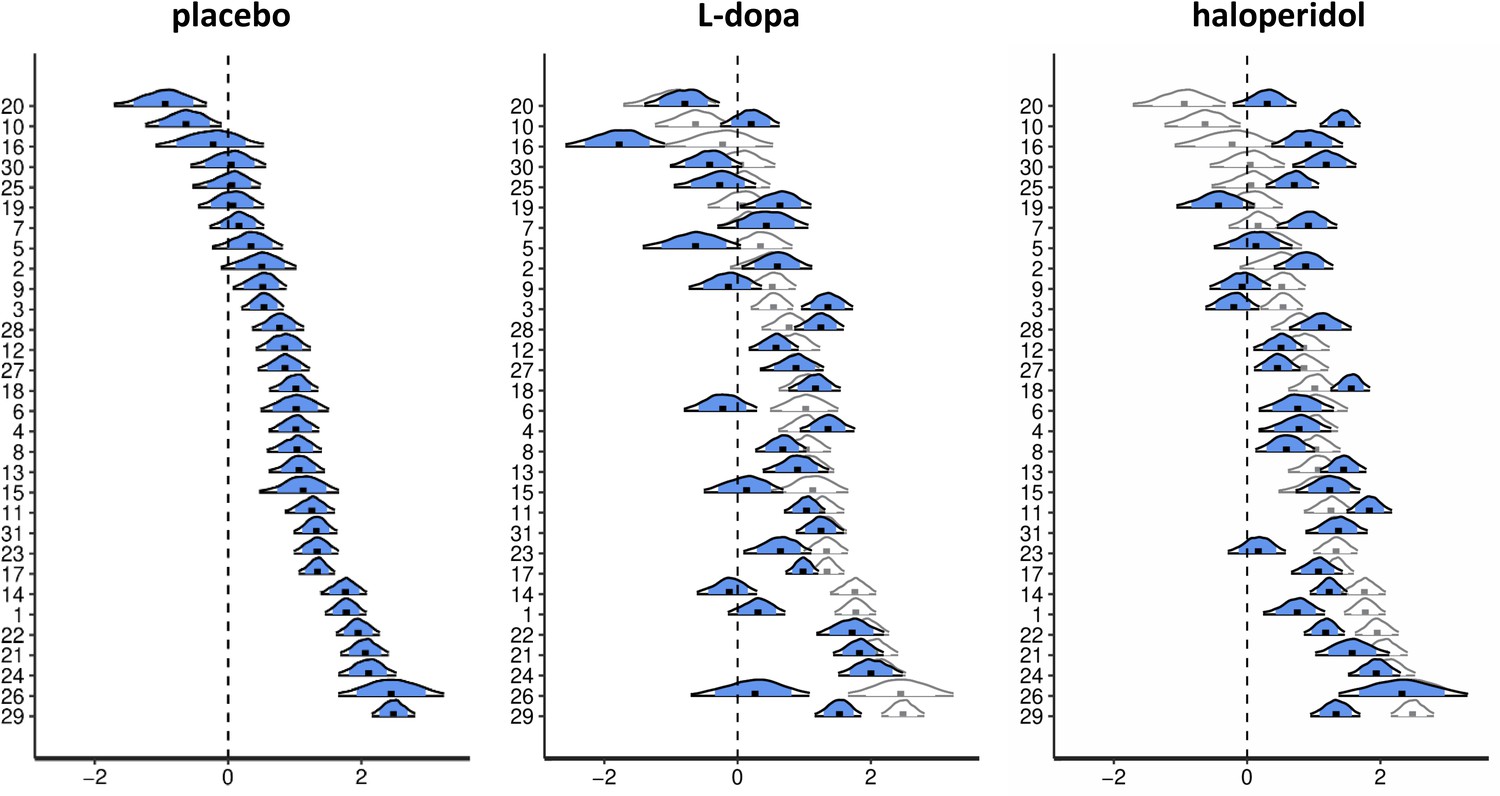
Figure 6
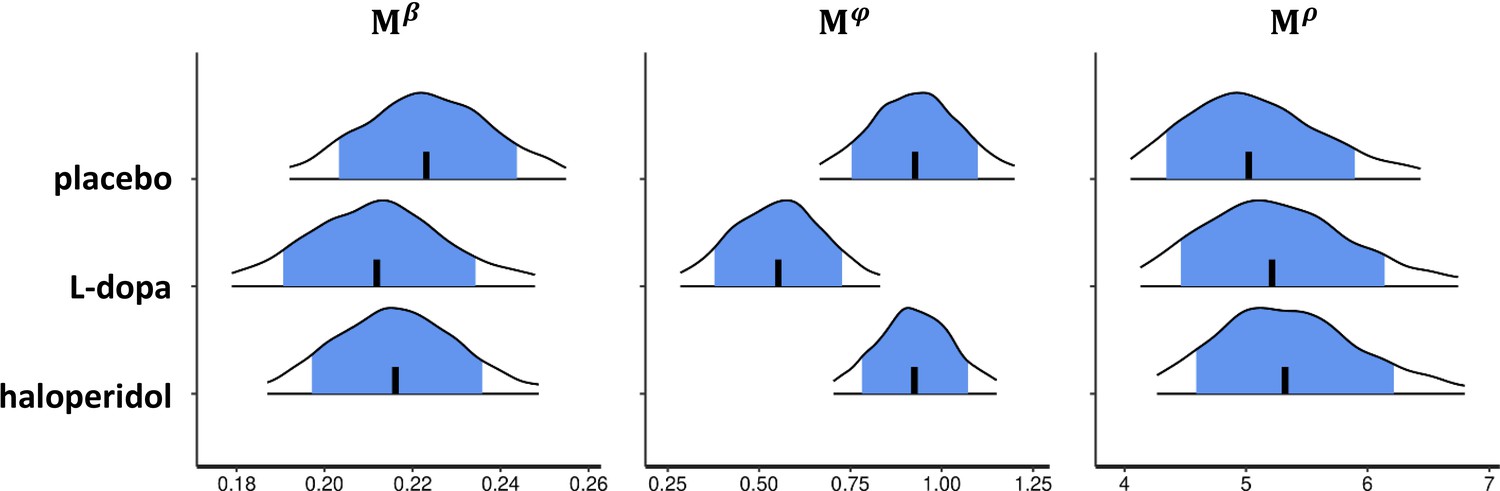
Drug effects for the group-level parameter estimates of the best-fitting Bayesian model.
Shown are posterior distributions of the group-level mean () of all choice parameters (β, , ρ), separately for each drug condition. Each plot shows the median (vertical black line), the 80% central interval (blue (grey) area), and the 95% central interval (black contours); β: random exploration, : directed exploration; ρ: perseveration parameter. For drug effects on the standard deviation of the group-level median parameters and ρ see Appendix 1—figure 1a. See Appendix 1—figure 1b and c for pairwise drug-related differences of the group-level mean (M) and (c) standard deviation () of .
Figure 7
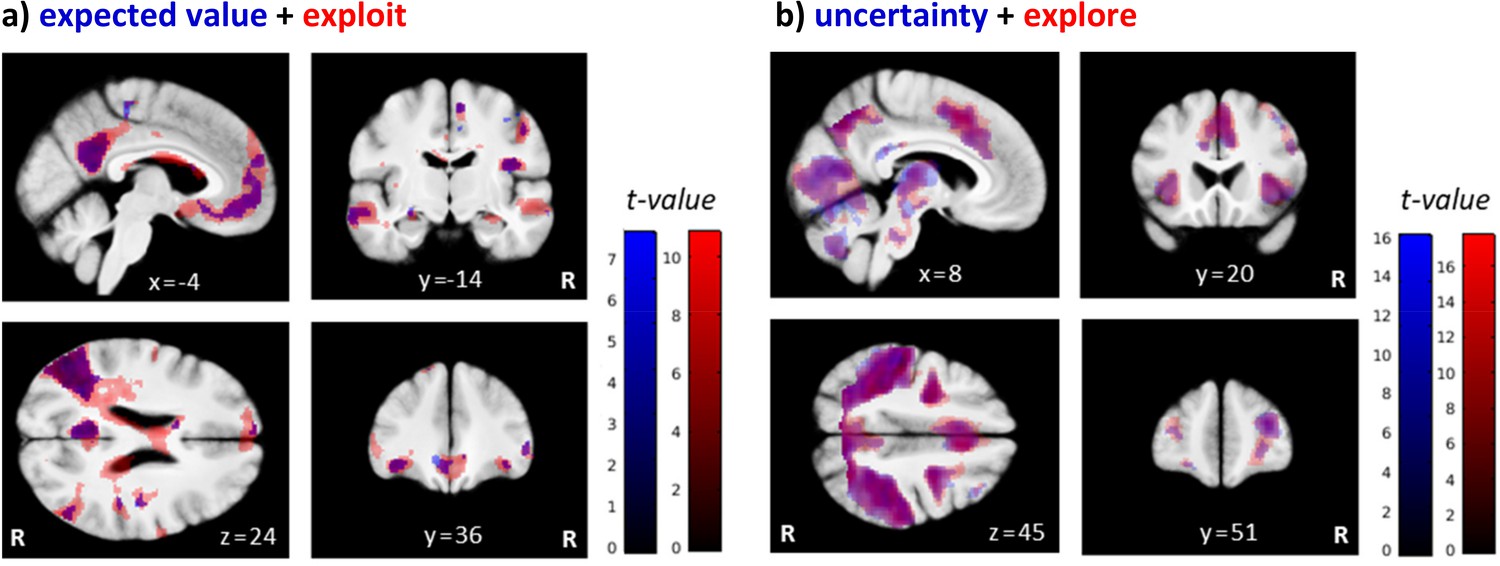
Brain regions differentially activated by exploratory and exploitative choices.
Shown are overlays of statistical parametric maps (SPMs) for the contrast (a) the parametric regressor expected value ( of the chosen bandit (in blue) and the binary trial classification related contrast exploit > explore (‘exploit’ in red), and for (b) the parametric regressor uncertainty () (in blue) and the contrast explore > exploit (‘explore’ in red), over all drug conditions. For visualization purposes: thresholded at p<0.001, uncorrected. R: right.
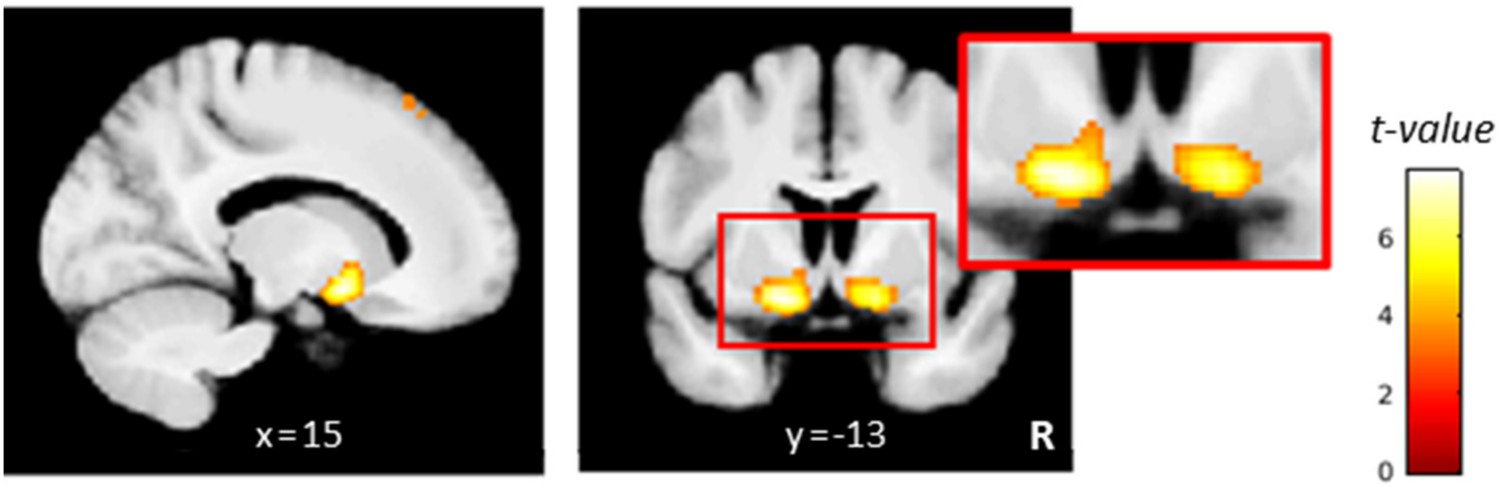
Figure 8

L-dopa effects on neural coding of overall uncertainty.
(a) Regions in which activity correlated positively with the overall uncertainty in the placebo condition included the dorsal anterior cingulate cortex (dACC) and left posterior insula (PI). (b) Regions in which the correlation with overall uncertainty was reduced under L-dopa compared to placebo included the dACC and left anterior insula (AI). Thresholded at p<0.001, uncorrected. R: right.
Figure 9
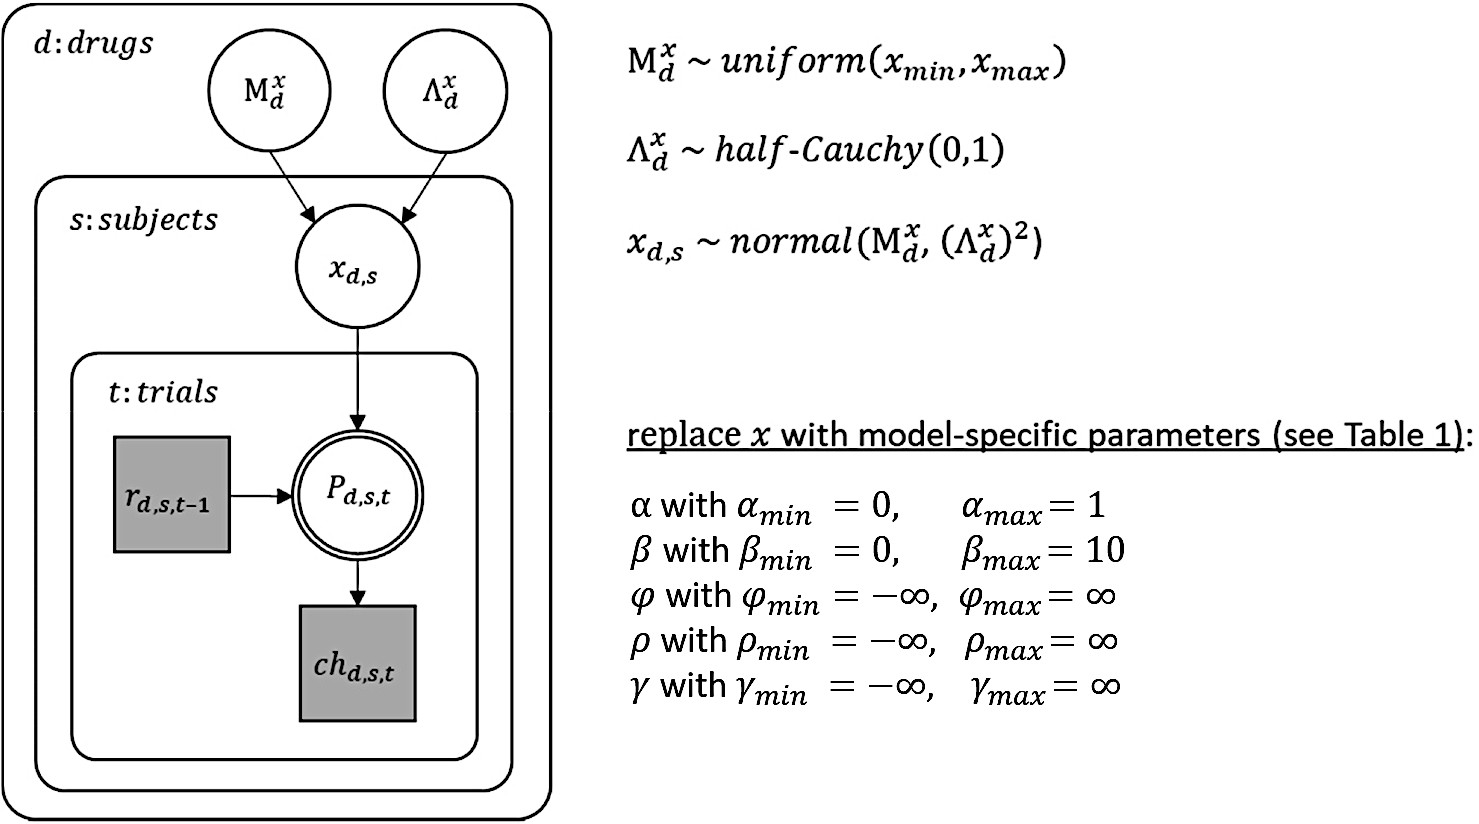
Graphical description of the hierarchical Bayesian modeling scheme.
In this graphical scheme, nodes represent variables of interest (squares: discrete variables; circles: continuous variables) and arrows indicate dependencies between these variables. Shaded nodes represent observed variables, here rewards () and choices () for each trial (), subject (), and drug condition (). For each subject and drug condition, the observed rewards until trial t-1 determine (deterministically) choice probabilities () on trial , which in turn determine (stochastically) the choice on that trial. The exact dependencies between previous rewards and choice probabilities are specified by the different cognitive models and their model parameters (). Note that the double-bordered node indicates that the choice probability is fully determined by its parent nodes, that is the reward history and the model parameters. As the model parameters differ between all applied cognitive models, they are indicated here by an as a placeholder for one or more model parameter(s). Still, the general modeling scheme was the same for all models: Model parameters were estimated for each subject and drug condition and were assumed to be drawn from a group-level normal distribution with mean and standard deviation for any parameter . Note that group-level parameters were estimated separately for each drug condition. Each group-level mean () was assigned a non-informative (uniform) prior between the limits and as listed above. Each group-level standard deviation () was assigned a half Cauchy distributed prior with location parameter 0 and scale 1. Subject-level parameters included , , and depending on the cognitive model (see Table 1).
Appendix 1—figure 1

Group-level parameter estimates of the winning model .
Shown are the posterior distributions of the (a) group-level standard deviation () for all choice parameters ( of the winning model, separately for each drug condition, and (b) of the pairwise drug-related differences of the group-level mean (M) and (c) standard deviation () of . For each posterior distribution, the plot shows the median (vertical black line), the 80% central interval (blue/grey area), and the 95% central interval (black contours). : softmax parameter; : exploration bonus parameter; : perseveration bonus parameter.
Appendix 1—figure 2
Drug effects for the subject-level parameter estimates of the directed exploration parameter .
Shown are posterior distributions of the subject-level parameter from the best-fitting Bayesian model, separately for each drug condition. Each plot shows the median (black dot), the 80% central interval (blue area), and the 95% central interval (black contours). For the L-dopa and haloperidol conditions, posterior distributions (in blue) are overlaid on the posterior distributions of the placebo condition (in white) for better comparison.
Appendix 1—figure 3
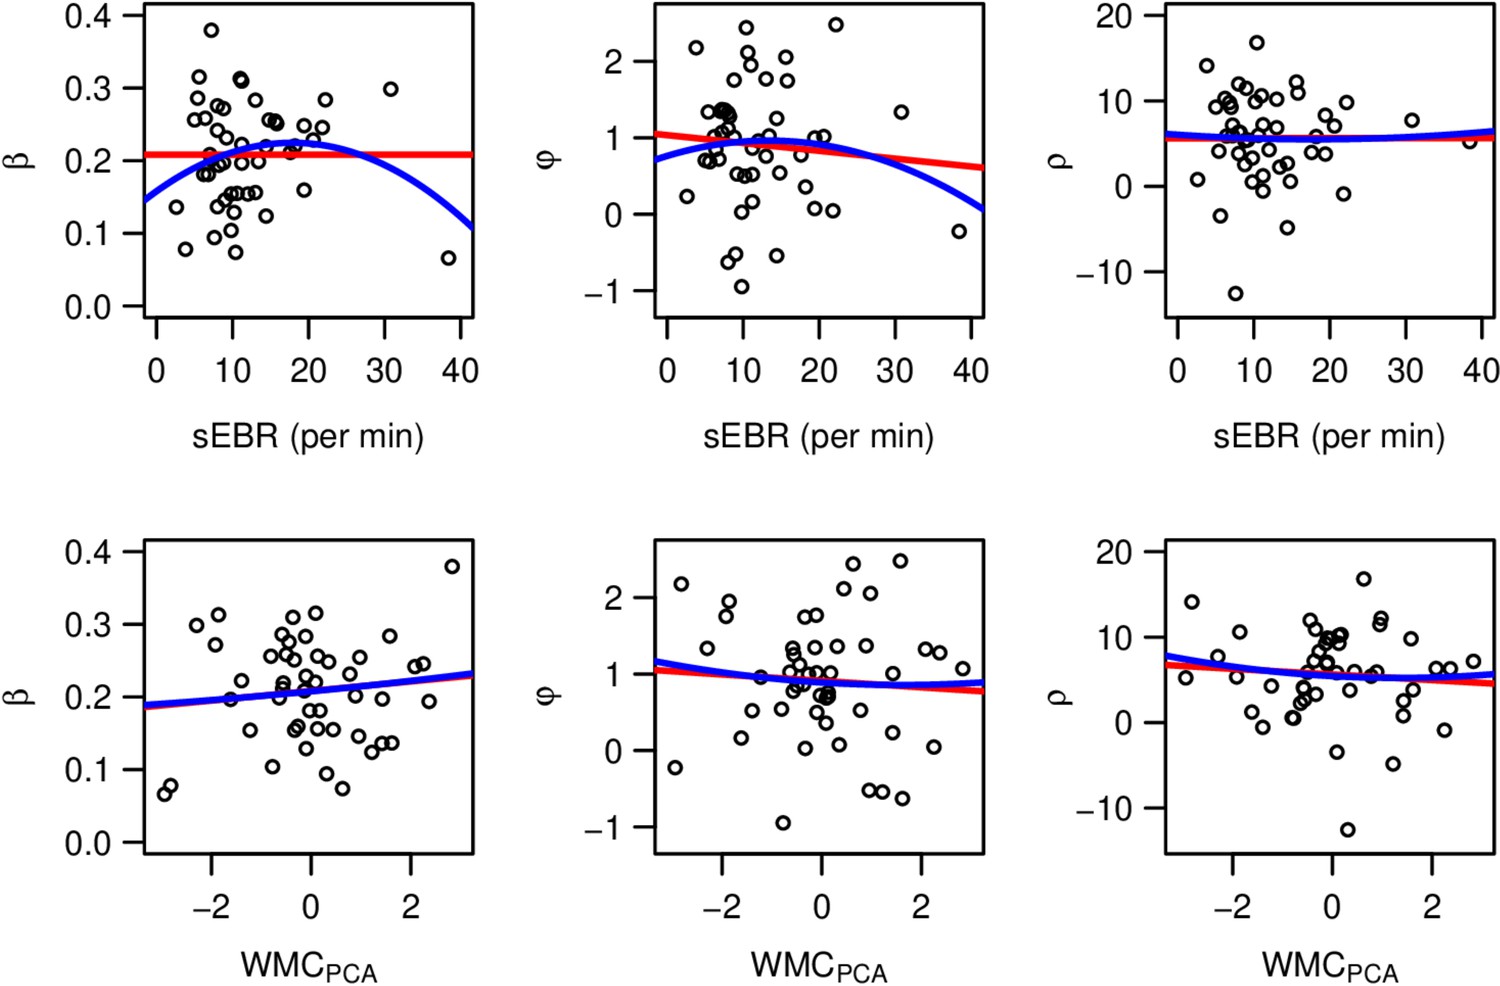
Test for an inverted-U relationship between DA baseline proxy measures (spontaneous eye blink rate (sEBR) & working memory capacity (WMCPCA)) and the posterior medians of the three choice parameters () of the winning (Bayes-SMEP) model.
Model parameters: : softmax parameter; : exploration bonus parameter; : perseveration bonus parameter.
Appendix 1—figure 4

Test for an inverted-U relationship between choice behavior and DA baseline.
Choice behavior was assessed by four model-free choice variables (payout, %bestbandit, meanrank, %switches). DA baseline function was assessed by the two DA proxies spontaneous eyeblink rate (sEBR) and working memory capacity (WMC). For the latter, the first principal component across three different WMC tasks was used, denoted by WMCPCA. Each plot shows two regression lines that were fitted to the data, one for the “linear model” (red line) and one for the “quadratic model” (blue line). Note that data from a pilot study and the placebo condition of the main study were combined for this analysis to increase the sample size to n=47. : softmax parameter; : exploration bonus parameter; : perseveration bonus parameter.
Appendix 1—figure 5

Brain regions differentially activated by exploratory and exploitative choices.
Shown are statistical parametric maps (SPMs) for (a) the contrast explore > exploit and (b) the contrast exploit > explore over all drug conditions. AG: angular gyrus; AI: anterior insula; Cb: cerebellum; dACC: dorsal anterior cingulate cortex; FPC: frontopolar cortex; HC: hippocampus; IPS: intraparietal sulcus; vmPFC: ventromedial prefrontal cortex; OFC: orbitofrontal cortex; PCC: posterior cingulate cortex; SMA: supplementary motor area; T: thalamus. For visualization purposes thresholded at p<0.001, uncorrected. R: right.
Appendix 1—figure 6

Brain activation patterns for different types of explorations .
Shown are pairwise overlays of the statistical parametric maps for the contrasts explore > exploit (‘overall’ in green), directed > exploit (‘directed’ in red), and random > exploit (‘random’ in blue) over all drug conditions. While the first contrast is based on a binary choice classification according to which all choices not following the highest expected value are explorations, the other two contrast are based on a trinary choice classification, which further subdivides explorations into choices following the highest exploration bonus (directed) and choices not following the highest exploration bonus (random). All activation maps thresholded at p<0.05, uncorrected for display purposes. R: right.
Appendix 1—figure 7
Striatal coding of the model-based prediction error (PE).
Activity in the bilateral ventral striatum correlated positively with the PE signal. For visualization purposes thresholded at p<0.001, uncorrected. R: right.
Author response image 1

Shown are leave-one-out (LOO) log-likelihood estimates calculated for our winning model (BAYES-SMEP), the model with an additional term capturing uncertainty-based random exploration (BAYES-SMERP), and the respective alternative model formulations (‘shift’) over all drug conditions (n=31 subjects with t=3*300 trials) and once separately for each drug condition (n=31 with t=300).
All LOO estimates were divided by the total number of data points in the sample (n*t) for better comparability across the different approaches. Bayes: Bayesian learner; SM: softmax (random exploration); E: directed exploration; R: total uncertainty-based random exploration; P: perseveration.
Tables
Table 1
Free and fixed parameters of all six computational models.
| Delta rule | Bayes learner rule | |||
|---|---|---|---|---|
| Choice rule 1 | fixed: | fixed: | ||
| Choice rule 2 | fixed: | fixed: | ||
| Choice rule 3 | fixed: | fixed: | ||
| Choice rule 4 | fixed: | fixed: | ||
-
Note: Free parameters are only listed for the subject-level. Hierarchical models contained for each free subject-level parameter two additional free parameters () on the group-level (Figure 9). Choice rule 1: softmax; Choice rule 2: softmax with exploration bonus; Choice rule 3: softmax with exploration bonus and perseveration bonus; : learning rate; : softmax parameter; : exploration bonus parameter; : perseveration bonus parameter; : uncertainty-based random exploration parameter; : initial expected reward values for all bandits; : decay parameter; : decay center; : observation variance; : diffusion variance; : initial mean of prior expected rewards for all bandits; : initial standard deviation of prior expected rewards for all bandits.
Table 2
Brain regions in which activity was significantly correlated with the overall uncertainty (fourth GLM), shown for the placebo condition and for pairwise comparison with L-dopa.
| Region | MNI coordinates | peak | cluster | ||
|---|---|---|---|---|---|
| x | y | z | z-value | extent (k) | |
| Placebo | |||||
| L posterior insula | −34 | −20 | 8 | 4.63 | 198 |
| R supplementary motor cortex | 8 | 10 | 52 | 3.98 | 92 |
| R/L dorsal anterior cingulate cortex, L supplementary motor cortex | -3 | 21 | 39 | 3.96 | 176 |
| R anterior insula | 42 | 15 | -6 | 3.46 | 38 |
| R thalamus | 8 | −10 | 2 | 3.41 | 18 |
| Placebo > L-dopa | |||||
| L posterior insula | −34 | −20 | 8 | 5.05* | 82 |
| L anterior insula, L frontal operculum | −38 | 6 | 14 | 4.88 | 222 |
| L opercular part of the inferior frontal gyrus | −42 | 9 | 26 | 4.01 | 80 |
| L precentral gyrus | −54 | 3 | 12 | 3.47 | 23 |
| R dorsal anterior cingulate cortex | 4 | 14 | 28 | 3.41 | 32 |
| R precentral gyrus | 39 | -9 | 44 | 3.39 | 16 |
| L dorsal anterior cingulate cortex | -2 | 36 | 33 | 3.32 | 17 |
| L-dopa > placebo | |||||
| no suprathreshold activation | |||||
-
Note: Thresholded at p<0.001, uncorrected, with k ≥ 10 voxels; L: left; R: right.
*p=0.031, FWE-corrected for whole-brain volume.
Appendix 1—table 1
Correspondence between model parameters and fraction of random exploration, directed exploration and exploitation trials.
| % explorations | β | ϕ | ρ |
|---|---|---|---|
| overall | -.65*** | .30* | 0.18 |
| random | -.68*** | 0.09 | -.22 |
| directed | 0.28 | .64*** | 0.09 |
-
Note that overall explorations were defined according to the binary choice classification, while directed and random explorations were defined according to the trinary choice classification. β: RE parameter; : DE parameter; ρ: CP parameter. *p<0.05. ***p<0.001.
Appendix 1—table 2
Drug effects on the exploration bonus parameter () on the group-level.
| % above 0 | 90% HDI | % above 0 | 90% HDI | |
|---|---|---|---|---|
| placebo - L-dopa | 97.5 | [0.05, 0.69] | 47.5 | [−0.18, 0.16] |
| placebo - haloperidol | 49.3 | [−0.30, 0.27] | 90.0 | [−0.04, 0.29] |
| L-dopa - haloperidol | 1.7 | [−0.70,–0.10] | 90.8 | [−0.02, 0.31] |
-
Note: Results refer to the posterior drug differences of the group-level mean () and standard deviation () for the parameter of the winning model. For each posterior difference, the table shows the percentage of samples with values above zero (column: % above 0) and the 90% highest density interval (column: 90%HDI).
Appendix 1—table 3
Test for an inverted-U relationship between choice behavior and DA baseline.
| LooLM - LooQM | ß2 estimate | ß2p-value | ||||
|---|---|---|---|---|---|---|
| sEBR | WMC | sEBR | WMC | sEBR | WMC | |
| model-based: | ||||||
| −0.06 | −0.04 | −2.09e−04 | 2.98e−04 | .132 | .949 | |
| −3.60 | −2.57 | −1.13e−03 | 1.27e−02 | .470 | .809 | |
| −53.09 | −49.68 | 1.69e−03 | 1.20e−01 | .869 | .726 | |
| model-free: | ||||||
| payout | −0.95 | −1.05 | −6.04e−04 | 1.37e−02 | .582 | .710 |
| %bestbandit | 198.06 | −245.78 | −2.45e−02 | 7.40e−02 | .149 | .897 |
| meanrank | 0.06 | −0.10 | −5.29e−04 | −3.45e−03 | .080 | .733 |
| %switches | −484.04 | −700.67 | −2.09e−04 | 6.58e−01 | .222 | .509 |
-
Note. Choice behavior was assessed by the three choice parameters of the winning (Bayes-SM+E+P) model (upper part) and four model-free choice variables (lower part). Baseline dopamine (DA) function was assessed by the two behavioral DA proxies spontaneous eye blink rate (sEBR) and working memory capacity (WMC). For the latter, the first principal component across three different WMC tasks was used, denoted by WMCPCA. The column “LOOLM-LOOQM” denotes the difference of the squared distances for the linear model (LM) minus the quadratic model (QM) from the leave-one-out (LOO) model comparison. Note that negative values for LOOLM - LOOQM indicate better predictive accuracy of the LM. The columns “β2 estimate” and “β2 p-value” show for each quadratic model the estimated value and p-value of the β2 regression coefficient, respectively. Note that data from a pilot study (n=16) and the placebo condition of the main study were combined for this analysis to increase the sample size to n=47. : softmax parameter; : exploration bonus parameter; : perseveration bonus parameter.
Appendix 1—table 4
Test for a linear relationship between drug-related effects on model-parameters and DA baseline.
| R² | ß1 estimate | ß1p-value | ||||
|---|---|---|---|---|---|---|
| sEBR | WMC | sEBR | WMC | sEBR | WMC | |
| (P-D) | 2.13e−5 | 1.52e−3 | 4.75e−05 | 2.25e−03 | .98 | .84 |
| (P-D) | 1.87e−2 | 4.25e−2 | 1.40e−02 | −1.19e−01 | .46 | .27 |
| (P-D) | 5.91e-3 | 2.42e-3 | −4.89e−03 | −1.76e−01 | .68 | .79 |
| (P-H) | 2.47e−2 | 2.93e−2 | 1.64e−03 | 1.01e−02 | .40 | .36 |
| (P-H) | 9.58e−3 | 3.36e−2 | −1.01e−02 | −1.06e−01 | .60 | .32 |
| (P-H) | 4.61e−2 | 1.18e−2 | −9.01e−03 | −2.57e−01 | .25 | .56 |
| (D-H) | 1.57e−3 | 7.83e−3 | 1.57e−03 | 7.83e−03 | .43 | .49 |
| (D-H) | 1.02e−3 | 2.95e−4 | −3.93e−03 | 1.20e−02 | .86 | .93 |
| (D-H) | 4.11e-3 | 5.69e-4 | −4.07e−02 | −8.54e−02 | .73 | .90 |
-
Note. Drug-related differences (P: placebo, D: L-dopa, H: haloperidol) of model parameters for all participants (n = 31). Baseline dopamine (DA) function was assessed by the two behavioral DA proxies spontaneous eye blink rate (sEBR) and working memory capacity (WMC). For the latter, the first principal component across three different WMC tasks was used, denoted by WMCPCA. The column ‘R²’ denotes the R²-values of the linear regressions. The columns ‘β1 estimate’ and ‘β1 p-value’ show for each linear model the estimated value and p-value of the β1 regression coefficient, respectively. β: softmax parameter; φ: exploration bonus parameter; ρ: perseveration bonus parameter
Appendix 1—table 5
Regions used for small volume correction.
| region of | peak voxel (mm) | reference for | ||
|---|---|---|---|---|
| small volume correction | x | y | z | peak voxel |
| rFPC (right frontopolar cortex) | 27 | 57 | 6 | Daw et al., 2006 |
| lFPC (left frontopolar cortex) | −27 | 48 | 4 | Daw et al., 2006 |
| rIPS (right intraparietal sulcus) | 39 | −36 | 42 | Daw et al., 2006 |
| lIPS (left intrapareital sulcus) | −29 | −33 | 45 | Daw et al., 2006 |
| rAIns (right anterior insula) | 32 | 22 | -8 | Blanchard and Gershman, 2018 |
| lAIns (left anterior insula) | −30 | 16 | -8 | Blanchard and Gershman, 2018 |
| dACC (dorsal anterior cingulate cortex) | 8 | 16 | 46 | Blanchard and Gershman, 2018 |
-
Note: Each small volume correction used a 10-mm-radius sphere around the listed voxel coordinates, which mark brain regions that have previously been associated with exploratory choices.
Appendix 1—table 6
Brain regions showing higher activity for exploratory than exploitative choices (first GLM).
| Region | MNI coordinates | peak | cluster | ||
|---|---|---|---|---|---|
| x | y | z | z-value | extent (k) | |
| R/L intraparietal sulcus, R/L postcentral gyrus, R/L precuneus, L precentral gyrus | −48 | −33 | 52 | 10.45 | 15606 |
| R precentral gyrus | 26 | -8 | 50 | 9.32 | 2297 |
| R/L supplementary motor cortex, R/L dorsal anterior cingulate cortex | 8 | 12 | 45 | 8.47 | 2552 |
| R cerebellum/fusiform gyrus | 18 | −51 | −22 | 8.09 | 2574 |
| R middle frontal gyrus (FPC) | 39 | 34 | 28 | 7.56 | 1291 |
| R cerebellum | 24 | −57 | −54 | 7.35 | 128 |
| L precentral gyrus | −51 | 0 | 34 | 7.31 | 430 |
| L cerebellum, L fusiform gyrus | −40 | −54 | −32 | 7.28 | 1419 |
| L thalamus | −10 | −20 | 6 | 6.96 | 556 |
| R/L calcarine cortex | -8 | −74 | 14 | 6.90 | 1222 |
| R anterior insula | 36 | 20 | 3 | 6.87 | 511 |
| L anterior insula | −36 | 15 | 3 | 6.69 | 557 |
| R precentral gyrus | 51 | 8 | 24 | 6.49 | 434 |
| R thalamus | 10 | −18 | 8 | 6.32 | 331 |
| R cerebellum | 30 | −44 | −48 | 6.24 | 28 |
| L middle frontal gyrus (FPC) | −42 | 27 | 27 | 6.07 | 97 |
| R cerebellum | 14 | −62 | −45 | 5.88 | 61 |
| R pallidum | 15 | 6 | -4 | 5.83 | 25 |
| R calcarine cortex | 9 | −94 | 6 | 5.74 | 104 |
| vermis | 3 | −75 | −34 | 5.70 | 52 |
| R supramarginal gyrus | 51 | −42 | 28 | 5.69 | 46 |
| L middle frontal gyrus (FPC) | −30 | 46 | 15 | 5.67 | 47 |
| L pallidum | −10 | 6 | -4 | 5.64 | 51 |
| R anterior orbital gyrus | 24 | 54 | -9 | 5.60 | 33 |
| L posterior cingulate cortex | -3 | −32 | 26 | 5.51 | 21 |
| L caudate nucleus | −16 | −14 | 18 | 5.33 | 28 |
| R caudate nucleus | 12 | -8 | 16 | 5.24 | 16 |
| L lingual gyrus | −16 | −84 | −12 | 5.21 | 10 |
| R anterior cingulate cortex | 10 | 27 | 21 | 5.13 | 10 |
-
Note: Thresholded at p<0.05, FWE-corrected for whole-brain volume, with k ≥ 10 voxels; L: left; R: right.
Appendix 1—table 7
Brain regions showing higher activity for exploitative than exploratory choices (first GLM).
| Region | MNI coordinates | peak | cluster | ||
|---|---|---|---|---|---|
| x | y | z | z-value | extent (k) | |
| L angular gyrus | −42 | −74 | 34 | 8.04 | 2530 |
| L posterior cingulate cortex/precuneus | -6 | −52 | 15 | 7.40 | 1087 |
| R angular gyrus | 52 | −68 | 28 | 7.02 | 185 |
| R postcentral gyrus | 33 | −26 | 54 | 6.80 | 503 |
| R cerebellum | 27 | −78 | −38 | 6.28 | 452 |
| R rostral anterior cingulate cortex | 4 | 18 | −14 | 5.90 | 125 |
| L superior temporal gyrus | −62 | −36 | 3 | 5.89 | 70 |
| L lateral orbital gyrus | −38 | 34 | −14 | 5.81 | 102 |
| R central operculum | 45 | −14 | 20 | 5.73 | 83 |
| L middle temporal gyrus | −62 | -4 | −22 | 5.67 | 193 |
| R/L medial frontal cortex (vmPFC) | -2 | 40 | −10 | 5.67 | 233 |
| L superior frontal gyrus | −10 | 54 | 30 | 5.54 | 20 |
| L superior frontal gyrus | −10 | 51 | 36 | 5.45 | 10 |
| L middle temporal gyrus | −60 | −51 | -2 | 5.38 | 61 |
| R superior temporal gyrus | 52 | −12 | -9 | 5.35 | 25 |
| R middle temporal gyrus | 62 | 4 | −21 | 5.30 | 10 |
| L rostral anterior cingulate cortex | -6 | 46 | 4 | 5.17 | 13 |
| L inferior frontal gyrus | −50 | 27 | 2 | 5.16 | 20 |
-
Note: Thresholded at p<0.05, FWE-corrected for whole-brain volume, with k ≥ 10 voxels; L: left; R: right
Additional files
Download links
A two-part list of links to download the article, or parts of the article, in various formats.
Downloads (link to download the article as PDF)
Open citations (links to open the citations from this article in various online reference manager services)
Cite this article (links to download the citations from this article in formats compatible with various reference manager tools)
Dopaminergic modulation of the exploration/exploitation trade-off in human decision-making
eLife 9:e51260.
https://doi.org/10.7554/eLife.51260


