A viral fusogen hijacks the actin cytoskeleton to drive cell-cell fusion
- UC Berkeley–UC San Francisco Graduate Group in Bioengineering, United States
- Department of Bioengineering & Biophysics Graduate Group, University of California, Berkeley, United States
- Division of Biological Systems and Engineering, Lawrence Berkeley National Laboratory, United States
- Chan Zuckerberg Biohub, United States
Figures
Figure 1 with 1 supplement
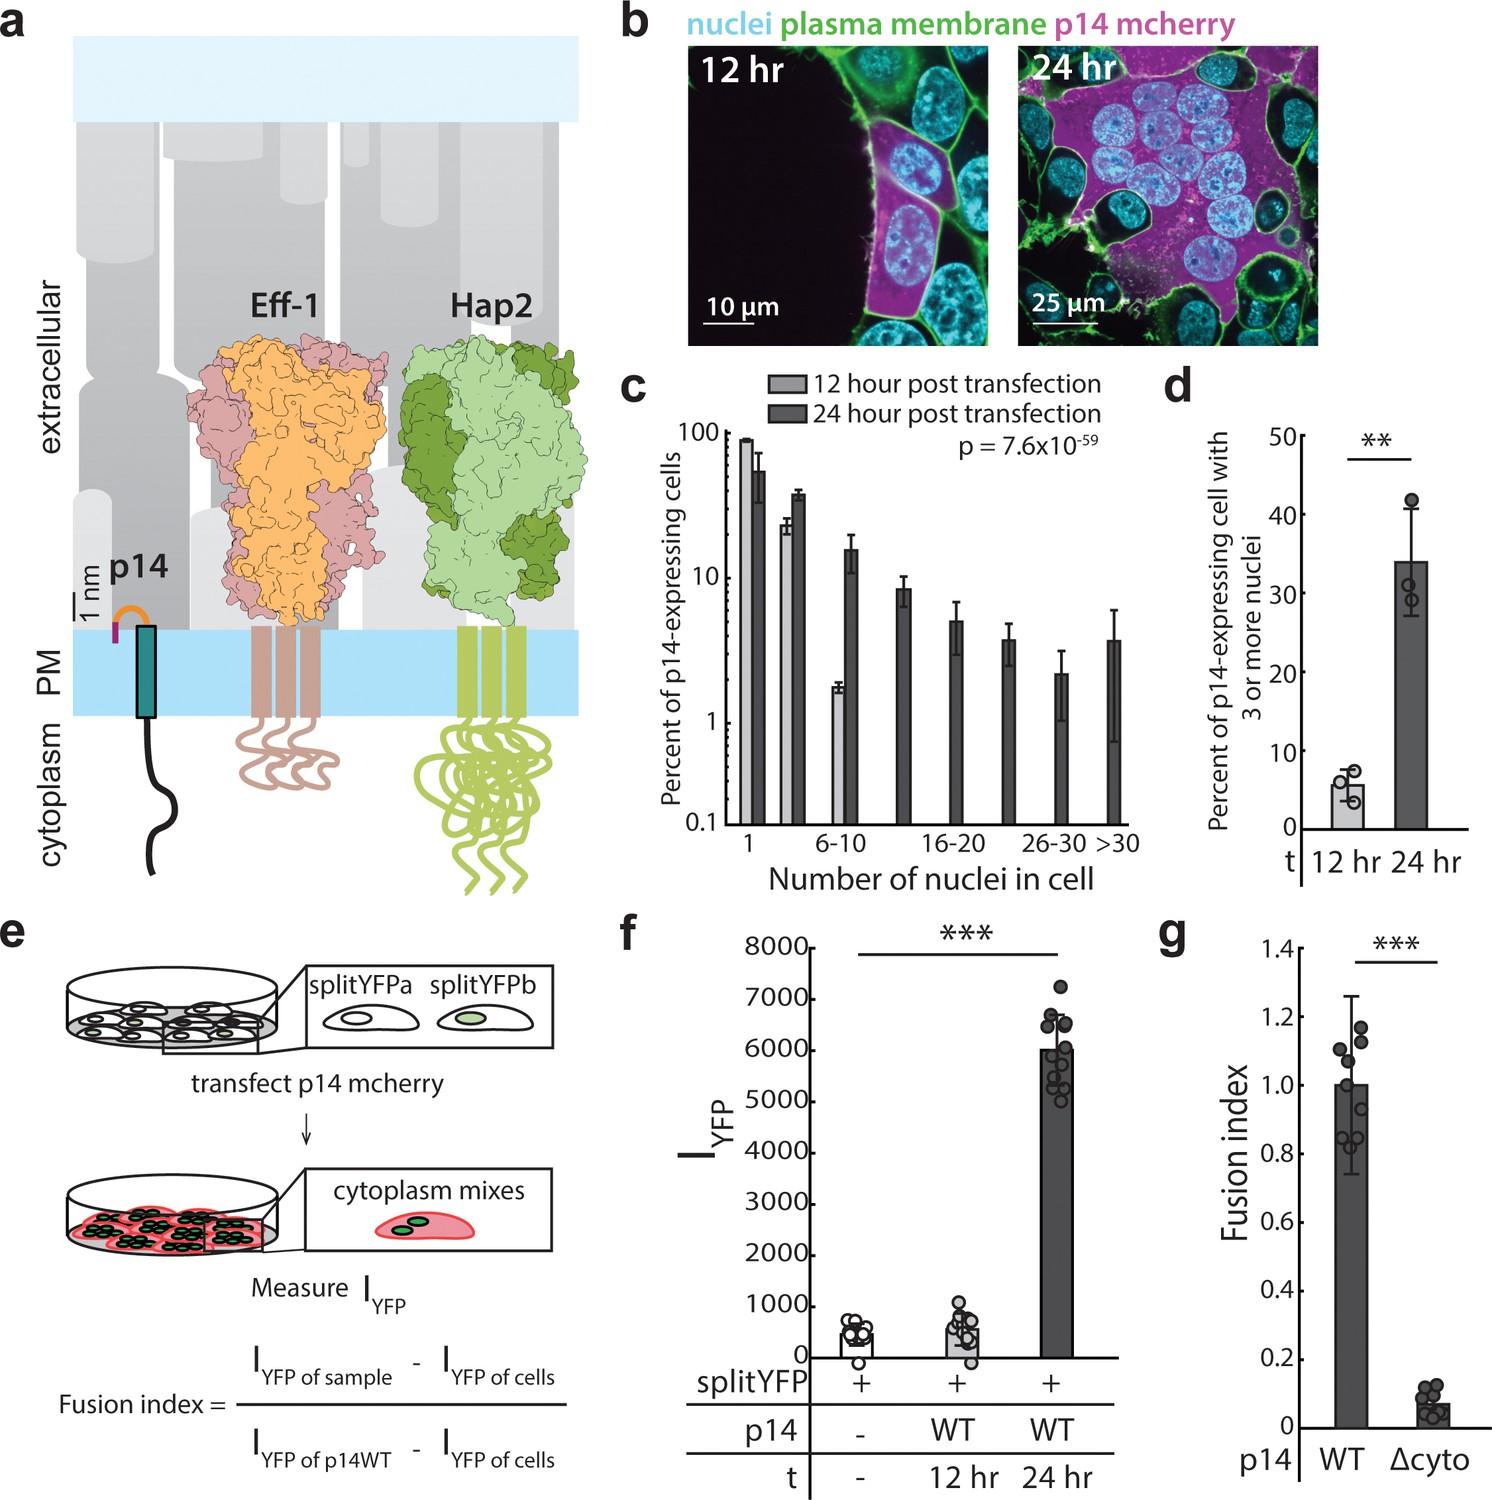
Expression of p14 drives cell-cell fusion and is quantified with a splitYFP fluorescent assay.
(a) Schematic of fusion-associated small transmembrane protein, p14, in proportion to post-fusion trimeric structure of cell-cell fusogens, Eff-1 (PDB:4OJC) and Hap2 (PDB: 5MF1), on the plasma membrane. (b) Expression of p14 in HEK293T cells drives cell-cell fusion forming large multinucleated cells that increases size and number of nuclei over time. (c) Average nuclei count of HEK293T cells expressing p14 at 12 hr and 24 hr. P-values are ks-test and error bars represent standard deviation from 3 independent transfections (See also Figure 1—source data 1). (d) Percent of p14 expressing nuclei in cells with 3 or more nuclei at 12 hr and 24 hr. P-values are two-tailed, two-sample Student’s t-test where ** = p<0.01, and error bars represent standard deviations from 3 independent transfections (e) Schematic of the splitYFP fluorescence assay to quantify cell-cell fusion. IYFP of sample is the YFP fluorescence intensity of the sample, IYFP of sample is the YFP fluorescence intensity of the non-transfected cells, and IYFP of sample is the YFP fluorescence intensity of cells transfected with p14 WT. (f) Average YFP fluorescence intensity of HEK293T cells expressing p14 at 12 hr and 24 hr with error bars representing standard deviations from 3 independent transfections of 3 wells each. P-values are two-tailed, two-sample Student’s t-test where *** = p<0.001 (See also Figure 1—figure supplement 1c, (d). (g) Average fusion index of p14 cytoplasmic truncation mutant with error bars representing standard deviations from 3 independent transfections of 3 wells each. P-values are two-tailed, two-sample Student’s t-test where *** = p<0.001 (See also Figure 1—figure supplement 1e, (f).
-
Figure 1—source data 1
Excel Spreadsheet of counts and distribution for p14-expressing HEK293T cells at 12 hr and 24 hr post transfection for Figure 1c and d.
- https://cdn.elifesciences.org/articles/51358/elife-51358-fig1-data1-v1.xlsx
Figure 1—figure supplement 1
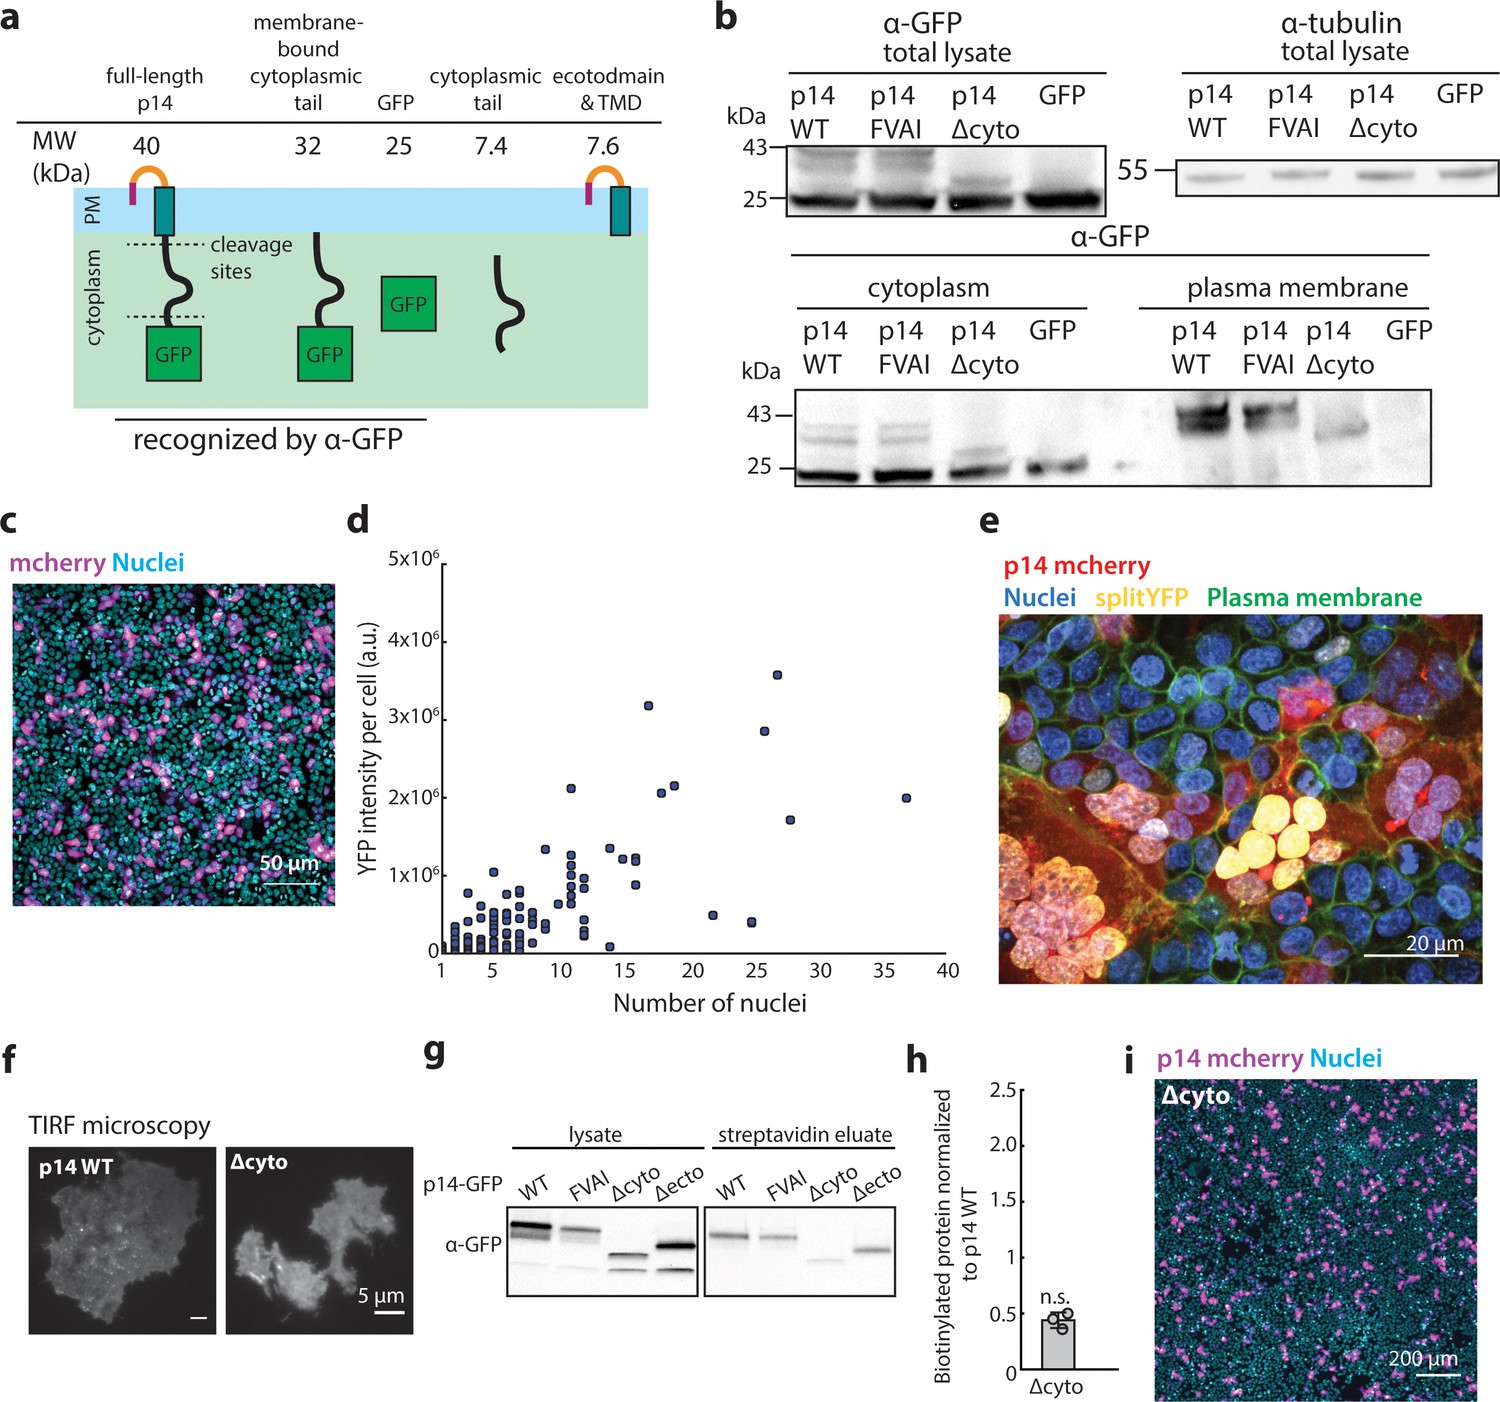
Characterization of p14 cytoplasmic tail cleavage and the splitYFP cell-cell fusion assay.
(a) Schematic of hypothesized cleavage sites in p14 cytoplasmic tail based on molecular weights of cleaved fragments. (b) Membrane fractionation of p14 WT, p14 FVAI, Δcyto and GFP only, showing similar expression of each construct at the plasma membrane and molecular weights cleaved fragments. (c) Representative confocal image of HEK293T cells expressing mCherry (magenta) and nuclei stained with Hoechst 33342. (d) YFP intensity per cell vs number of nuclei in cell. Each point represents a single cell. (e) Representative confocal image of splitYFP cells expressing p14 WT mcherry (red). Nuclei are labeled with Hoechst 33342 (cyan), plasma membrane are labeled with CellMaskDeepRed (green). splitYFP has FOS and JUN coiled-coiled motif that directs splitYFP to the nucleus (yellow). (g) p14 WT and p14 Δcyto labeled with C-terminus mcherry tag are trafficked to the plasma membrane as visualized with TIRF microscopy. (g) Western blot of surface biotinylated GFP-tagged p14 WT, FVAI and Δcyto. (h) Average biotinylated p14 Δcyto normalized to that of p14 WT. Error bars represent standard deviations from three independent transfections and biotinylation. P-values are two-tailed two-sample Student’s t-test to p14 WT where n.s. = p>0.05. (i) Representative field of view of HEK293T cells expressing p14 Δcyto mCherry (magenta), nuclei stained with Hoechst 33342 (cyan).
-
Figure 1—figure supplement 1—source data 1
Excel Spreadsheet of surface biotinylation of p14-WT-GFP and p14-Δcyto-GFP for Figure 1—figure supplement 1h.
- https://cdn.elifesciences.org/articles/51358/elife-51358-fig1-figsupp1-data1-v1.xlsx
Figure 2 with 1 supplement
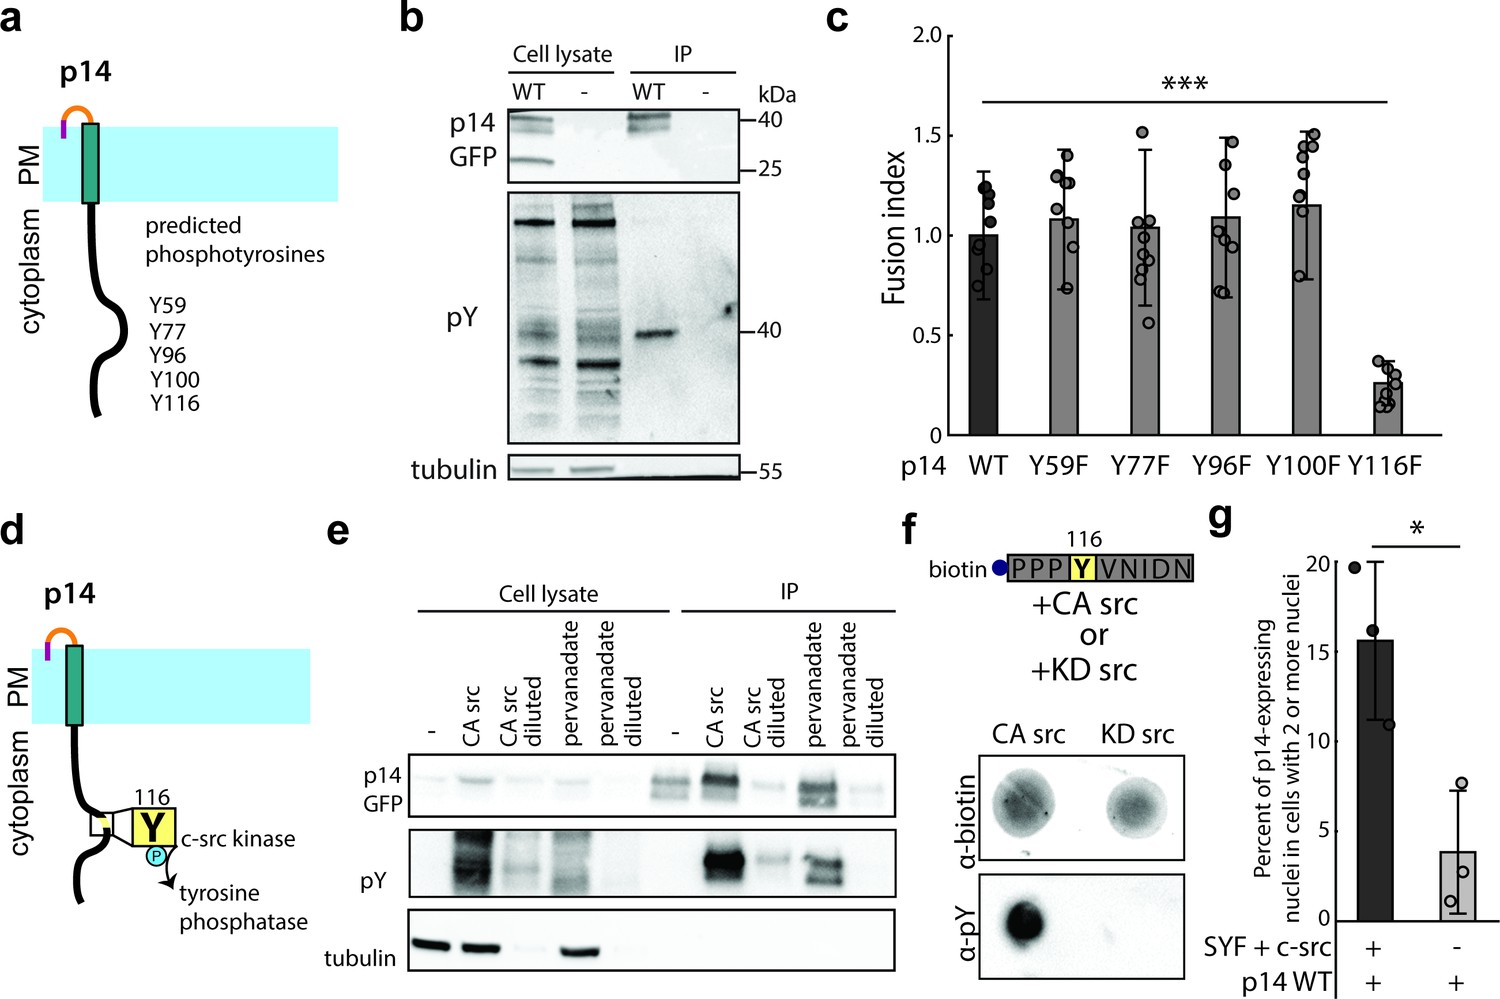
p14 Y116 in the cytoplasmic tail is necessary for cell-cell fusion and is phosphorylated by c-src kinase.
(a) Schematic of predicted phosphotyrosines in p14 cytoplasmic tail (See also Figure 2—figure supplement 1a). (b) Western blot probed with α-phosphotyrosine confirming that p14 WT is phosphorylated. (c) Average fusion index of p14 phosphotyrosine mutants with error bars representing standard deviations from 3 independent transfections of 3 wells each. p-values are two-tailed, two-sample Student’s t-test where *** = p<0.001 (See also Figure 2—figure supplement 1b). (d) Schematic of c-src kinase and a tyrosine phosphatase activity on p14 Y116. (e) Western blot probed with α-phosphotyrosine confirming that p14 Y116 phosphorylation is increased with co-expression of constitutively active c-src kinase and with addition of pervanadate. (f) Dot blot of p14 cytoplasmic tail peptide phosphorylated in vitro with constitutively-active (Y527F) and kinase-dead c-src kinase (Y527F, K295R) (See also Figure 2—figure supplement 1c, (d). (g) Average percent of p14-expressing cells with 2 or more nuclei in SYF and SYF + c-src cells with error bars representing standard deviations from 3 independent transfections. p-values are two-tailed, two-sample Student’s t-test, where * = p<0.05 (See also Figure 2—figure supplement 1e).
-
Figure 2—source data 1
Excel Spreadsheet of counts for p14-expressing SYF and SYF+c-src cells for Figure 2g.
- https://cdn.elifesciences.org/articles/51358/elife-51358-fig2-data1-v1.xlsx
Figure 2—figure supplement 1
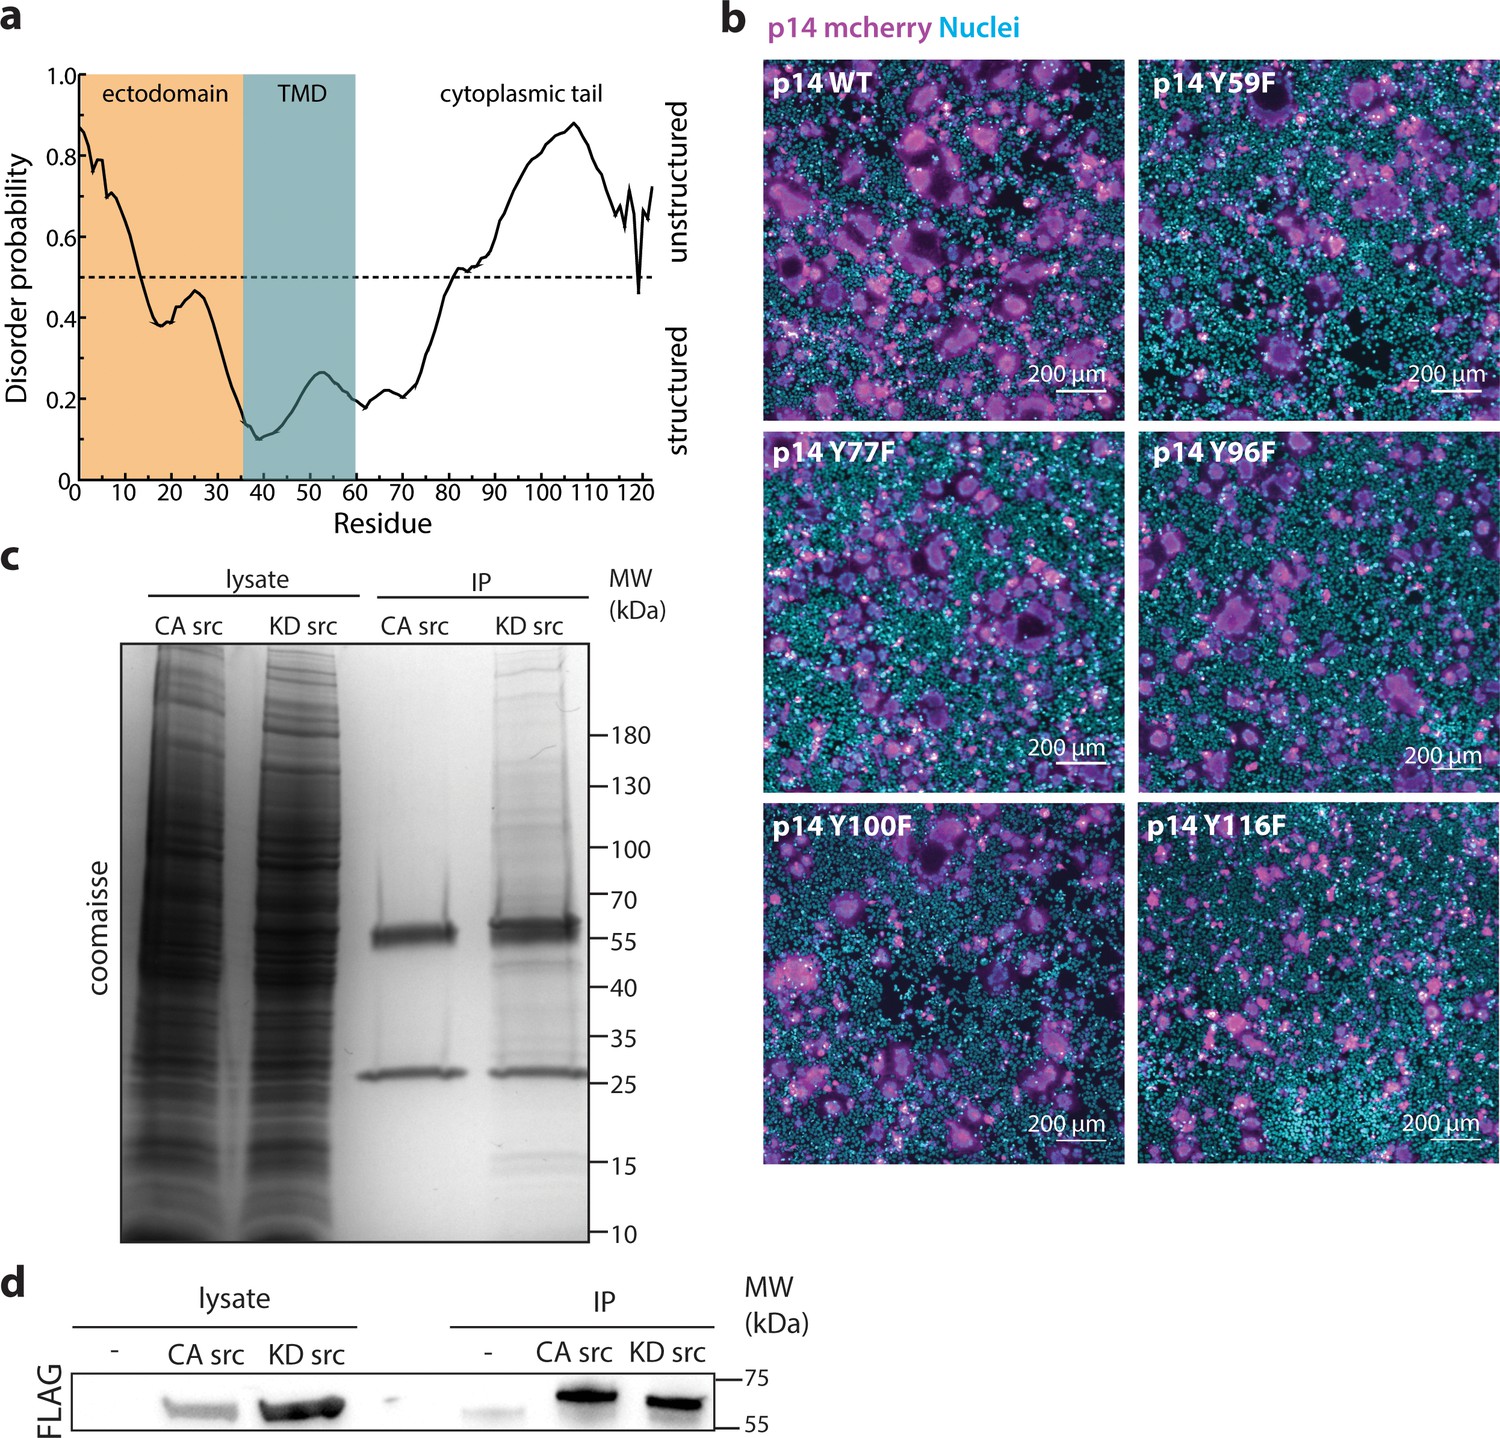
Characterization of p14 cytoplasmic tail and Y116.
(a) Disorder probability of p14 cytoplasmic tail as calculated with DisEMBL (http://dis.embl.de/). (b) Representative field of view of HEK293T cells expressing p14 WT and p14 mutants with p14 labeled with C-terminus mcherry (magenta), nuclei stained with Hoechst 33342 (cyan). (c) Coomassie stain of immunoprecipitation of FLAG-tagged constitutively active src kinase (CA src) and kinase dead src kinase (KD src) from HEK293T cells. (d) Western blot of immunoprecipitation of FLAG-tagged constitutively active src kinase (CA src) and kinase dead src kinase (KD src) probed with α-FLAG.
Figure 3 with 1 supplement
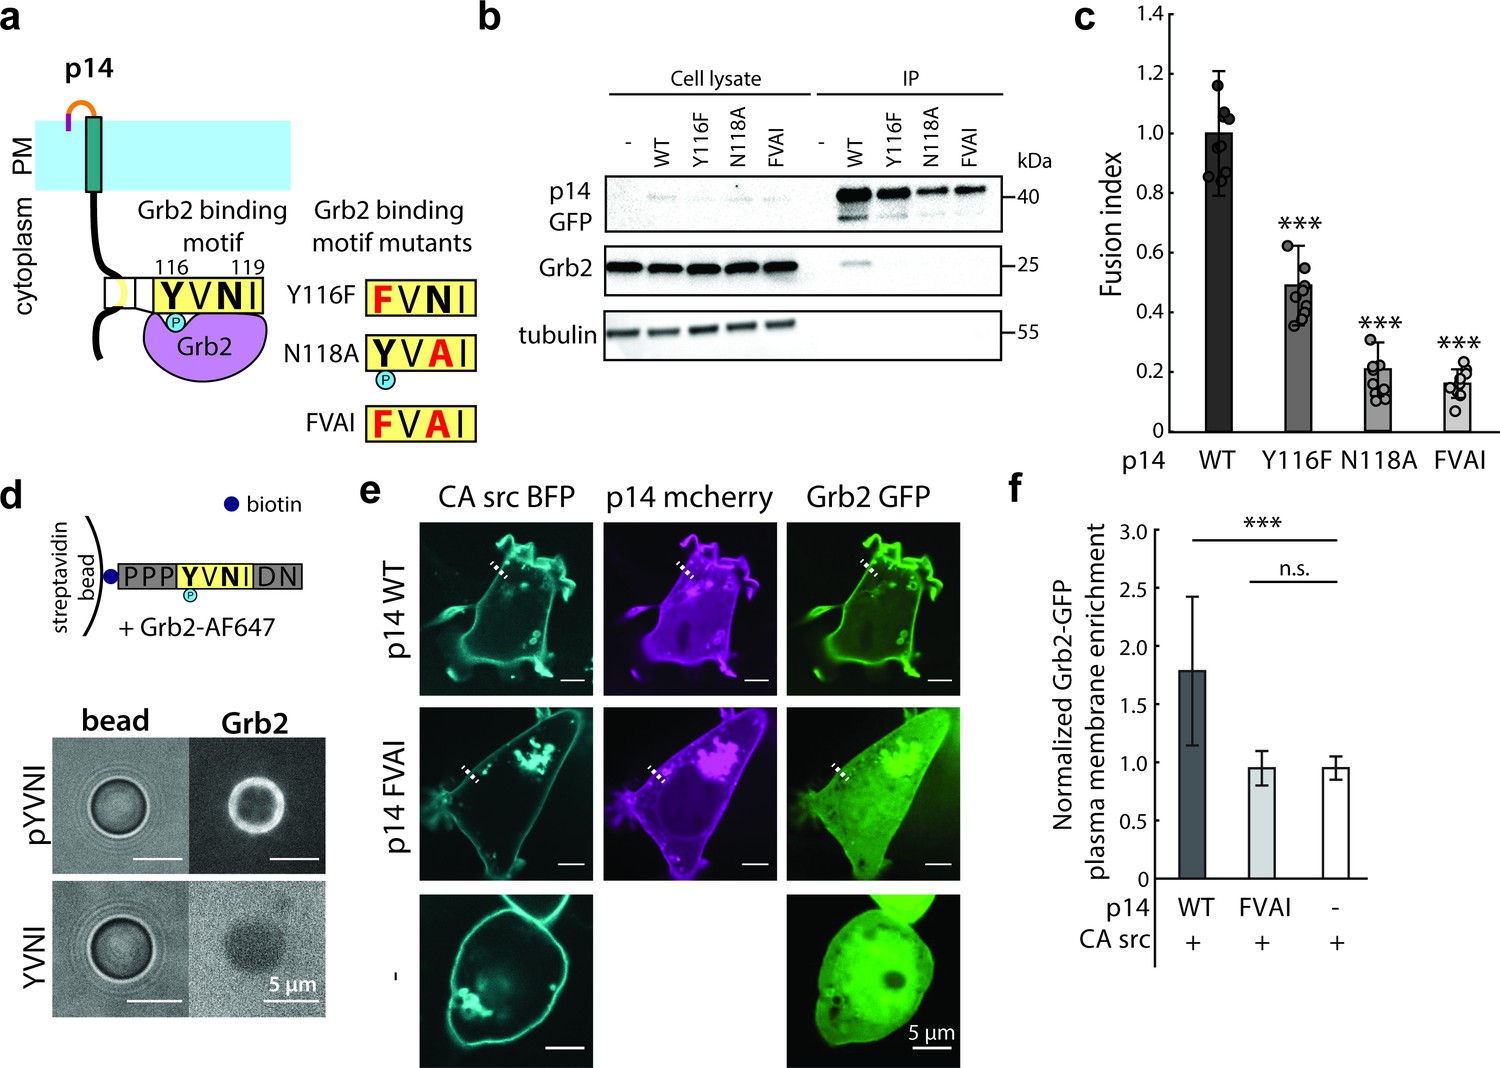
p14 Y116 in the cytoplasmic tail binds to Grb2.
(a) Schematic of p14 mutants that disrupt predicted Grb2 binding motif. (b) Western blot of co-immunoprecipitation of p14 with Grb2 (lane 7) and p14 mutants, Y116F, N118A, FVAI, that does not bind Grb2 (lane 8, 9, 10). (c) Average fusion index of p14 mutants with error bars representing standard deviations from 3 independent transfections of 3 wells each. P-values are two-tailed, two-sample Student’s t-test where *** = p<0.001 (See also Figure 3—figure supplement 1a, (b). (d) Streptavidin beads with biotinylated phosphorylated and non-phosphorylated Y116 p14 cytoplasmic tail peptide encoding (P113-N121) binds and did not bind to purified Grb2 respectively (See also Figure 3—figure supplement 1c, (d). (e) Confocal images of Grb2-GFP (green) enrichment to the plasma membrane of cells co-expressing p14 WT, p14 FVAI mCherry (magenta) and wildtype HEK293T with constitutively active c-src kinase (cyan). (f) Average normalized Grb2-GFP plasma membrane enrichment in cells co-expressing constitutively active c-src and either p14 WT (n = 33 cells) or p14 FVAI (n = 26 cells) or expressing constitively active c-src alone (n = 24 cells). Error bars represent standard deviations from three independent transfsections. P-values are two-tailed, two-sample Student’s t-test where *** = p<0.001 and n.s. = p>0.05.
-
Figure 3—source data 1
Excel Spreadsheet of plasma membrane enrichment of Grb2-GFP in cells expressing CA-src alone or with p14-WT-mcherry or with p14-FVAI mcherry.
- https://cdn.elifesciences.org/articles/51358/elife-51358-fig3-data1-v1.xlsx
Figure 3—figure supplement 1
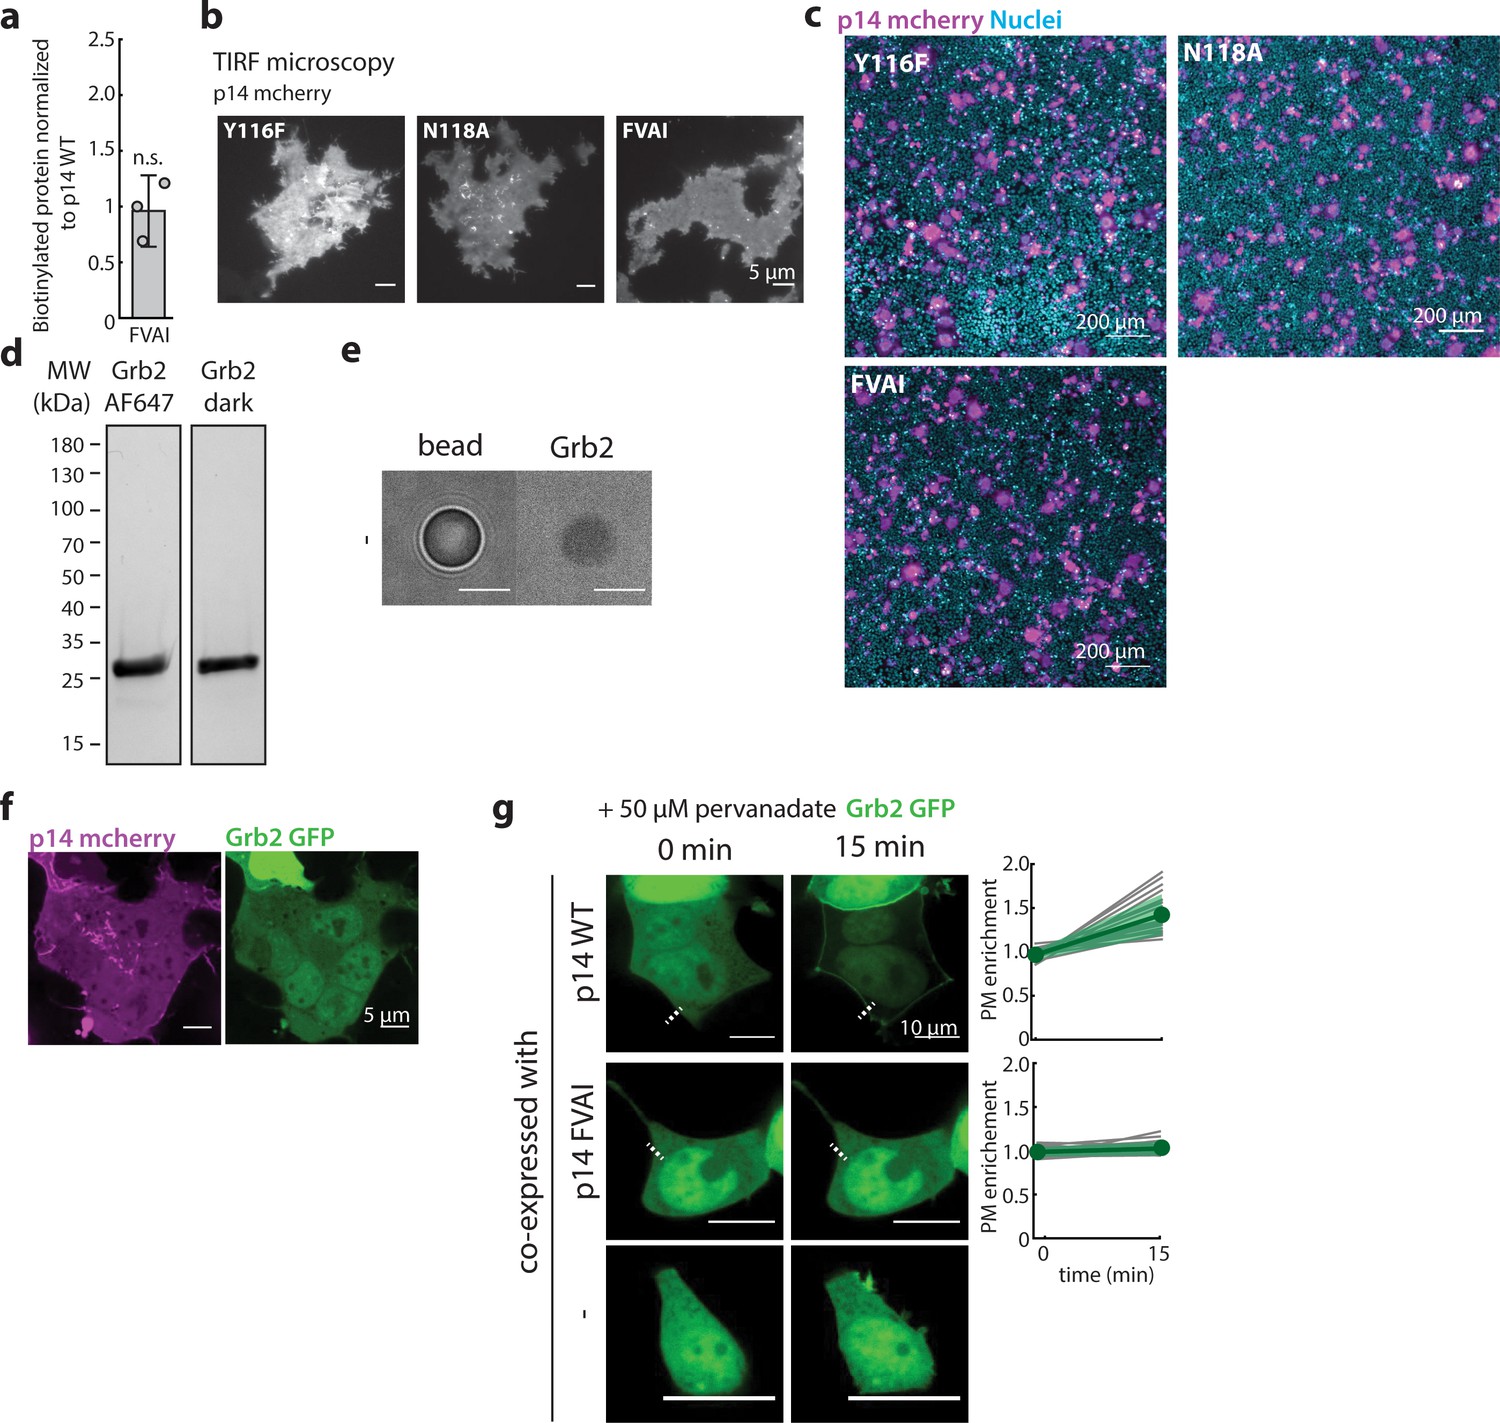
Characterization of Grb2 binding to p14.
(a) Average biotinylated p14 FVAI to that of p14 WT. Error bars represent standard deviations from three independent transfections and biotinylation. P-values are two-tailed two-sample Student’s t-test to p14 WT n.s. = p>0.05. Representative western blot is in Figure 1—figure supplement 1g. (b) p14 mutants, Y116F, N118A, FVAI, are trafficked to the plasma membrane as visualized with TIRF microscopy. (c) Representative field of view of HEK293T cells expressing p14 WT and p14 mutants with p14 labeled with C-terminus mcherry (magenta), nuclei stained with Hoechst 33342 (cyan). (d) Coomaisse stain of purified human Grb2 (right) and labeled with AlexaFluor647 (left). (e) Biotin bead incubated with purified Grb2 has minimal binding. (f) p14-WT-mcherry (magenta) co-expressed with Grb2-GFP (green) in non-treated WT HEK293T cells. (g) Confocal images of Grb2 enrichment to the plasma membrane of cells upon treating with pervanadate with line scans of fluorescence intensity of each protein. Green line denotes the average fluorescence intensity from 20 p14 WT-expressing cells and 14 p14 FVAI expressing cells across 3 independent transfections. Grb2 does not re-localize to plasma membrane for p14 FVAI and HEK293T WT cells (bottom two rows).
-
Figure 3—figure supplement 1—source data 1
Excel Spreadsheet of surface biotinylation of p14-WT-GFP and p14-FVAI-GFP for Figure 3—figure supplement 1a.
- https://cdn.elifesciences.org/articles/51358/elife-51358-fig3-figsupp1-data1-v1.xlsx
Figure 4 with 1 supplement
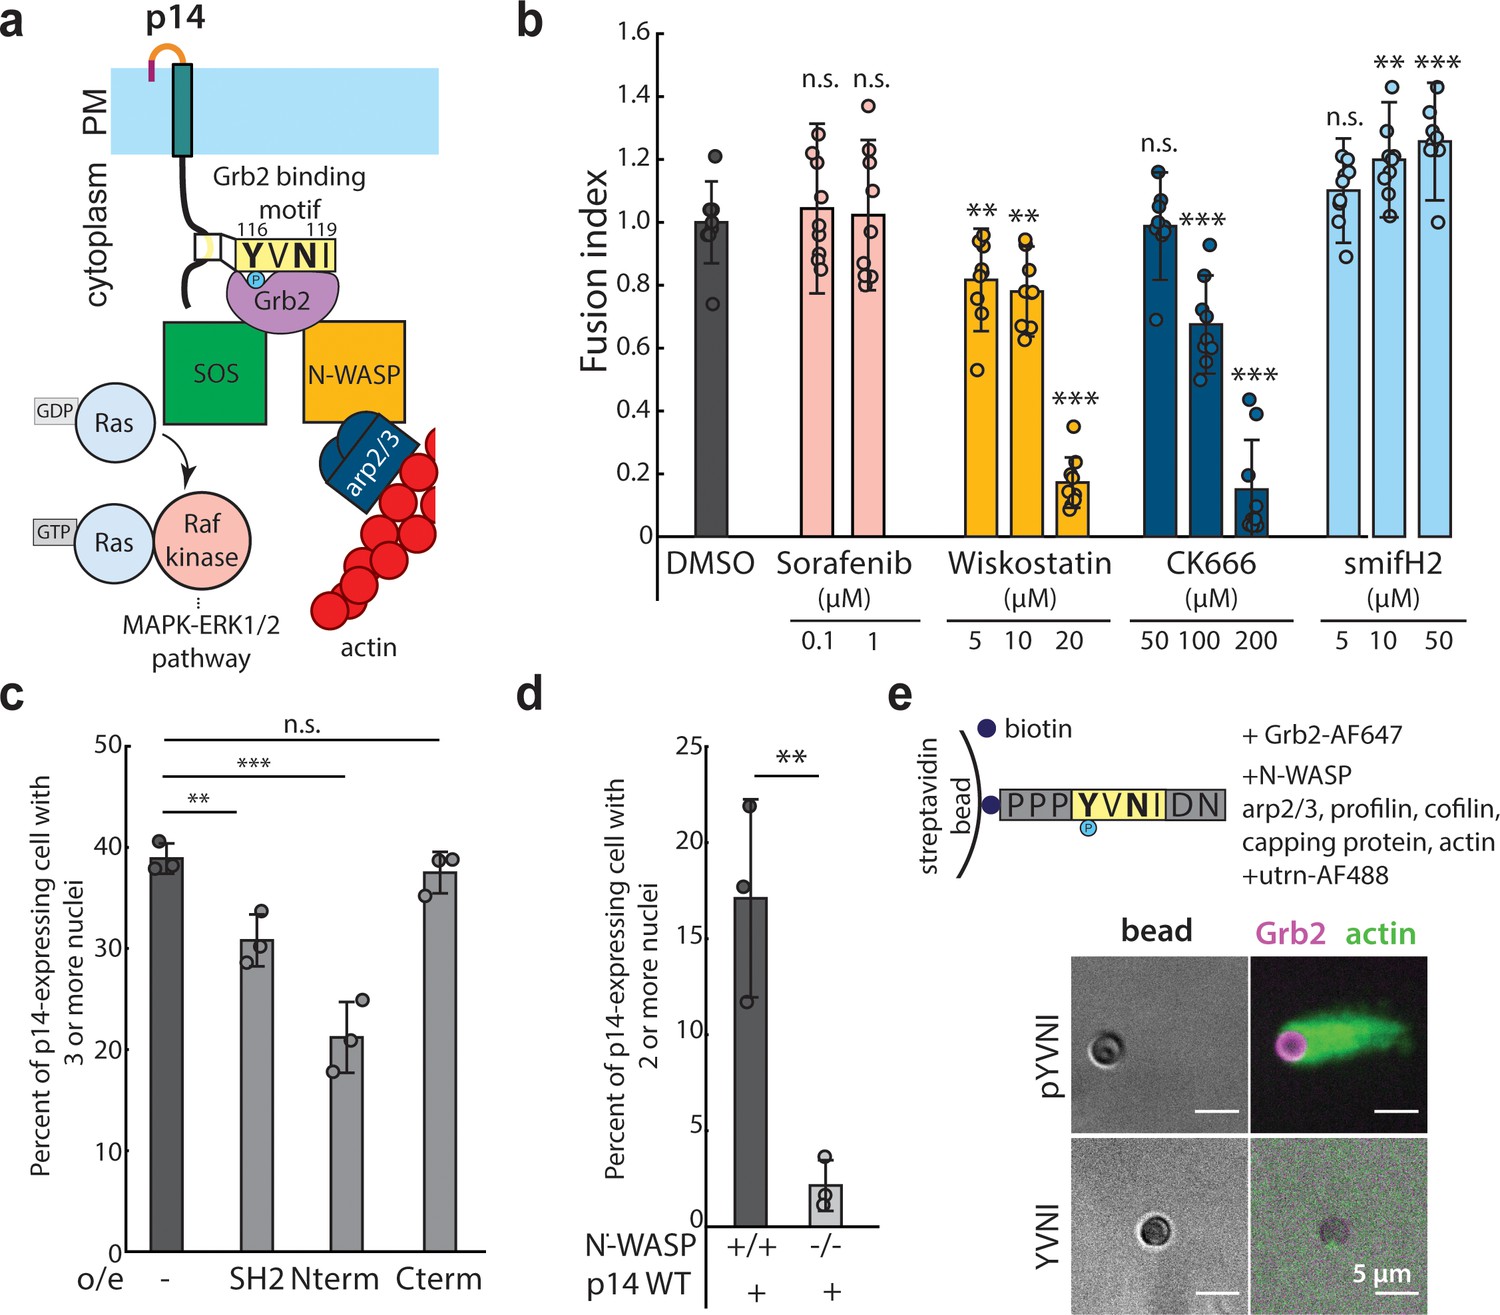
N-WASP-dependent assembly of branched actin network is necessary for cell-cell fusion.
(a) Schematic of Grb2 binding to two potential downstream effectors, SOS and N-WASP (b) Extent of cell-cell fusion quantified with splitYFP fluorescence assay of p14 expressing cells treated sorafenib tosylate targeting Raf kinase, wiskostatin targeting N-WASP, CK-666 targeting Arp2/3 and smifH2 targeting formins, normalized to that of p14 WT treated with vehicle control, DMSO. Error bars indicate standard deviations from 3 independent transfections of 3 wells each. P-values are two-tailed, two-sample Student’s t-test to DMSO where ** = p<0.01, *** = p<0.001 and n.s. = p>0.05. (c) Average percent of p14-expressing cells with 3 or more nuclei in HEK293T WT cells and HEK293T cells overexpressing Grb2 SH2 domain, N-terminus SH2-SH3 mutant and C-terminus SH2-SH3 mutant. P-values are two-tailed, two-sample Student’s t-test where ** = p<0.01, *** = p<0.001 and n.s. = p>0.05. Error bars represent standard deviations from 3 independent transfections (See also Figure 4—figure supplement 1a,b,c,d, and Figure 4—source data 1). (d) Average percent of p14-expressing cells with 2 or more nuclei in N-WASP -/- and +/+ cells with error bars representing standard deviations from 3 independent transfections. P-values are two-tailed, two-sample Student’s t-test where ** = p<0.01 (See also Figure 4—figure supplement 1g). (e) In vitro actin bead motility of phosphorylated p14 cytoplasmic tail peptide conjugated to streptavidin beads in a purified actin motility mixture supplemented with Grb2. Polymerized actin is visualized with AlexaFluor488-labeled utrophin actin binding domain (See also Figure 4—figure supplement 1h).
-
Figure 4—source data 1
Excel Spreadsheet of counts and distribution for p14-expressing HEK293T cells over-expressing Grb2 mutants for Figure 4c.
- https://cdn.elifesciences.org/articles/51358/elife-51358-fig4-data1-v1.xlsx
-
Figure 4—source data 2
Excel Spreadsheet of counts and distribution for p14-expressing N-WASP -/- or +/+ mouse embryonic fibroblasts for Figure 4d.
- https://cdn.elifesciences.org/articles/51358/elife-51358-fig4-data2-v1.xlsx
Figure 4—figure supplement 1
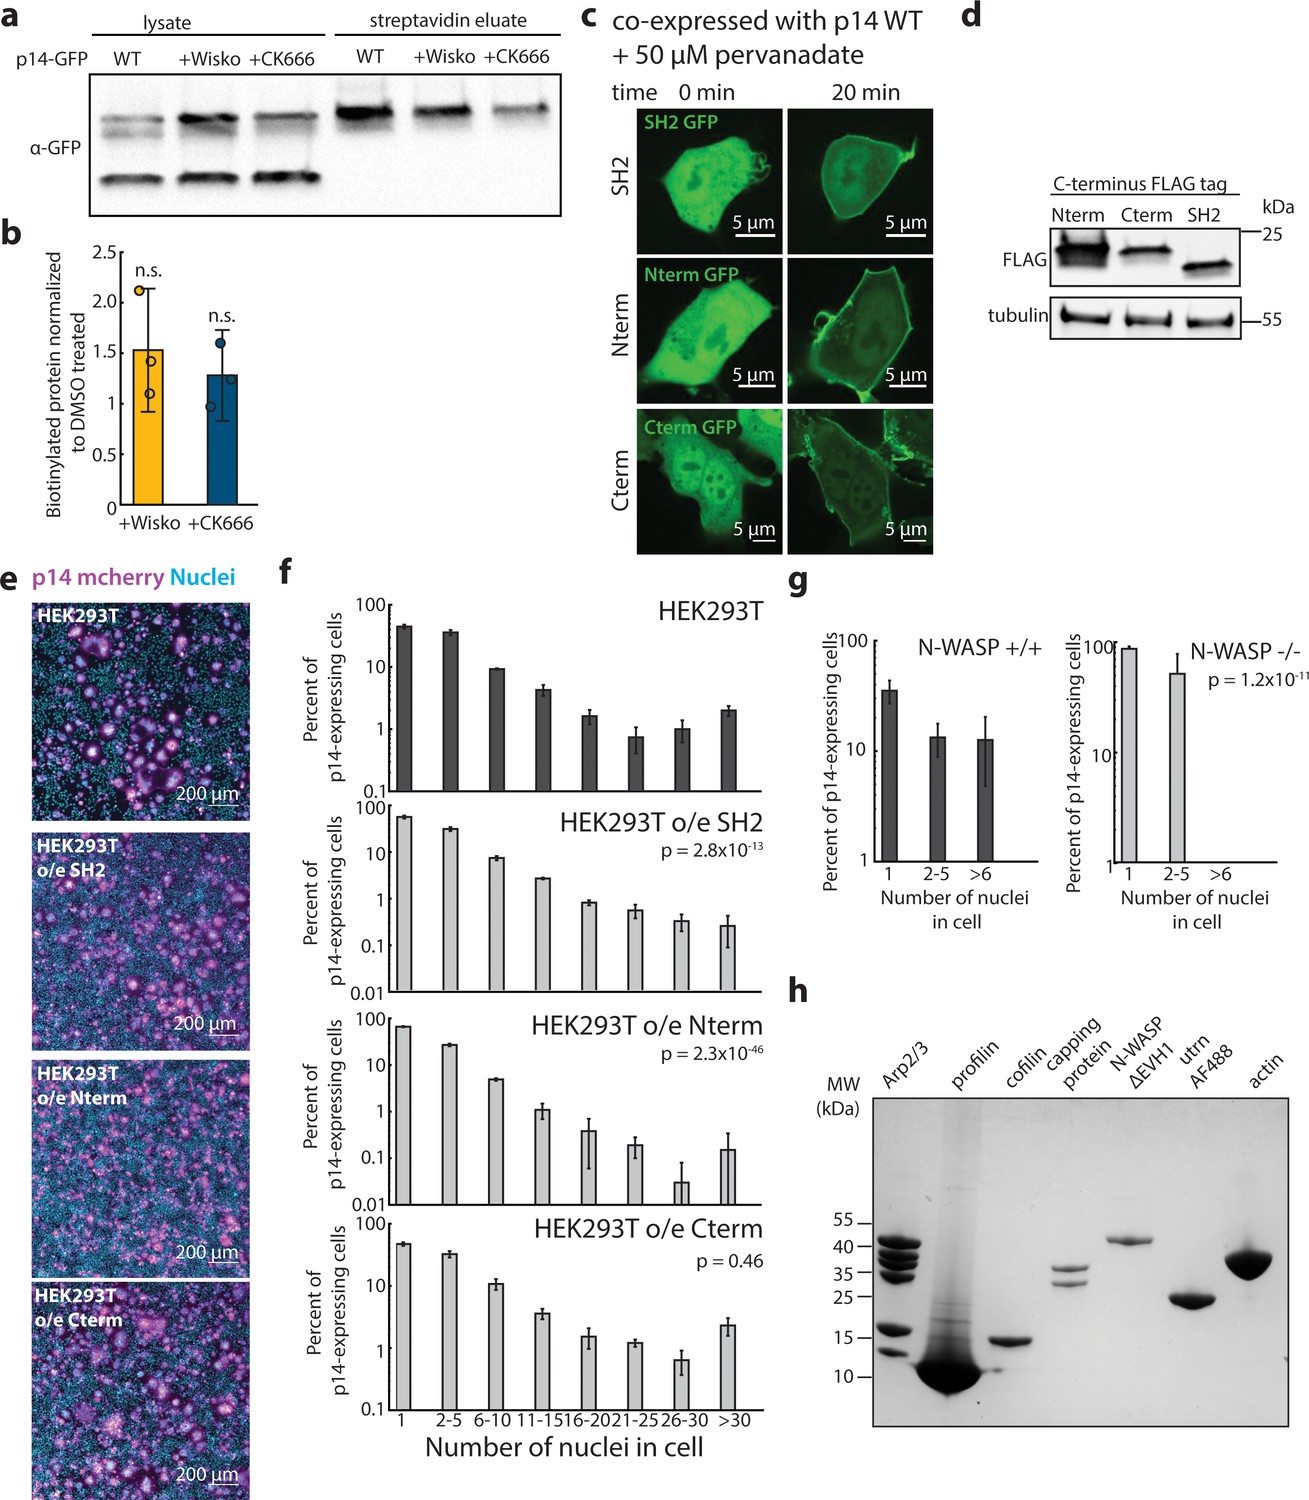
Characterization of over-expression of Grb2 mutants and purified components of actin motility assay.
(a) Western blot of surface biotinylated GFP-tagged p14 WT treated with eitherDMSO, Wiskostatin or CK-666. (b) Average biotinylated p14 WT treated with Wiskostatin and CK-666 normalized to that of DMSO-treated p14 WT. Error bars represent standard deviations from three independent transfections and biotinylation. P-values are two-tailed, two-sample Student’s t-test to p14 WT where n.s. = p>0.05. (c) Representative confocal images of HEK293T cells over-expressing Grb2 mutants tagged with GFP before and after addition of pervanadate to increase p14 phosphorylation. Grb2 mutants are functional, and colocalizes with p14 at the plasma membrane. (d) Western blot of HEK293T cells over-expressing FLAG-tagged Grb2 mutants. (e) Representative field of view of HEK293T cells and HEK293T cells over-expressing Grb2 mutants transfected with p14 WT with p14 labeled with C-terminus mcherry (magenta), nuclei stained with Hoechst 33342 (cyan). (f) Average nuclei count of p14-expressing HEK293T cells and HEK293T overexpressing SH2 domain, N-terminus SH3 and SH2 and C-terminus SH3-SH2 domains of Grb2. P-values are ks-test and error bars represent standard deviation of 3 independent transfections. (g) Average nuclei count of p14-expressing N-WASP -/- and +/+ cells. P-values are ks-test and error bars represent standard deviation from 3 independent transfections. (h) Coomaisse stain of SDS-PAGE of each protein used in vitro actin motility assay.
-
Figure 4—figure supplement 1—source data 1
Excel Spreadsheet of surface biotinylation of p14-WT-GFP treated with wiskostatin and CK-666 for Figure 4—figure supplement 1b.
- https://cdn.elifesciences.org/articles/51358/elife-51358-fig4-figsupp1-data1-v1.xlsx
Figure 5 with 2 supplements
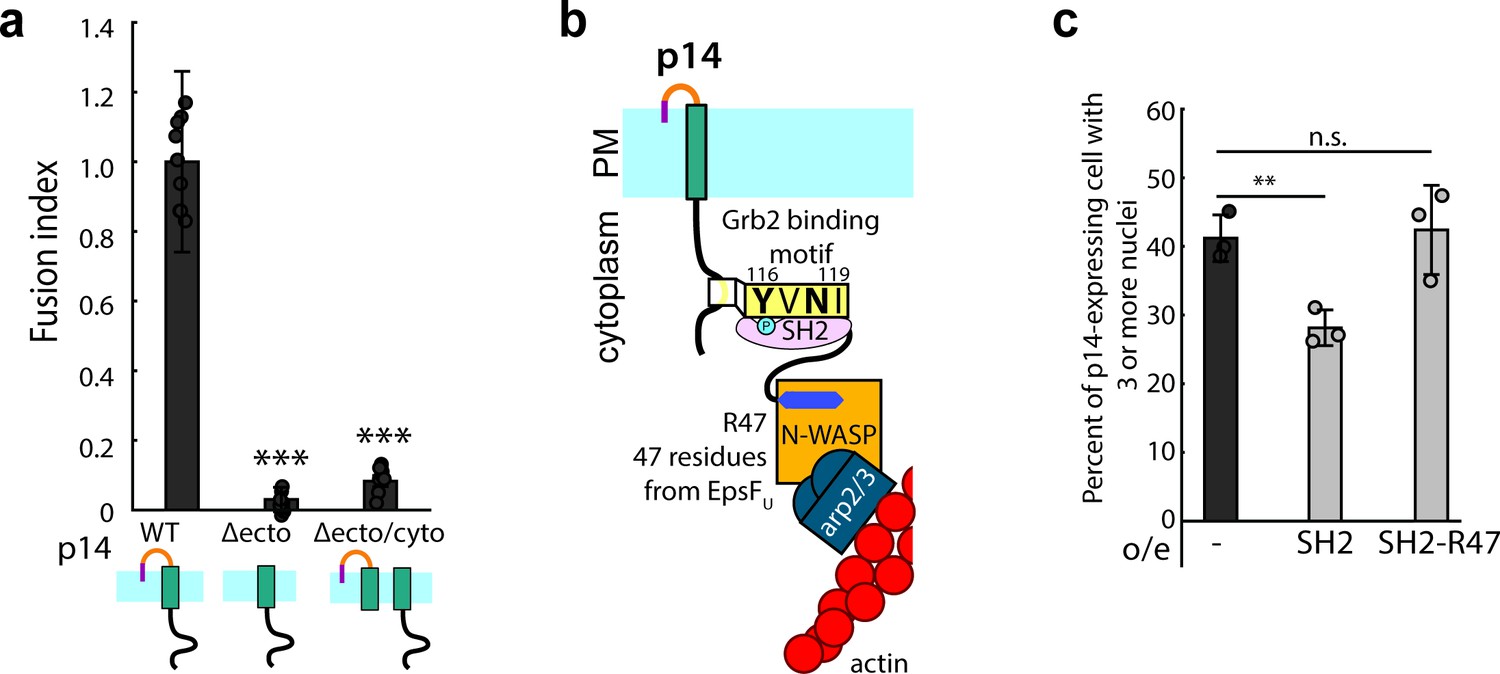
Branched actin assembly directly coupled to p14 cytoplasmic tail drives cell-cell fusion.
(a) Average fusion index of p14 truncation mutants normalized to that of p14 WT. P-values are two-tailed, two-sample Student’s t-test to p14 WT where *** = p<0.001. Error bars indicate standard deviations from 3 independent transfections of 3 wells each (See also Figure 5—figure supplement 1a, (b,c). (b) Schematic of fusion protein coupling actin assembly to p14 cytoplasmic tail consisting of Grb2 SH2 domain and 47 residues from EspFU. (c) Average percent of p14-expressing cell with 3 or more nuclei in HEK293T WT cells and HEK293T cells overexpressing Grb2 SH2 domain and SH2-R47. P-values are two-tailed, two-sample Student’s t-test where ** = p<0.01 and n.s. = p>0.05. Error bars represent standard deviations from 3 independent transfections (See also Figure 5—figure supplement 1d,e,f,g, and Figure 5—source data 1).
-
Figure 5—source data 1
Excel Spreadsheet of counts and distribution for p14-expressing HEK293T cells over-expressing R47 constructs for Figure 5c.
- https://cdn.elifesciences.org/articles/51358/elife-51358-fig5-data1-v1.xlsx
Figure 5—figure supplement 1
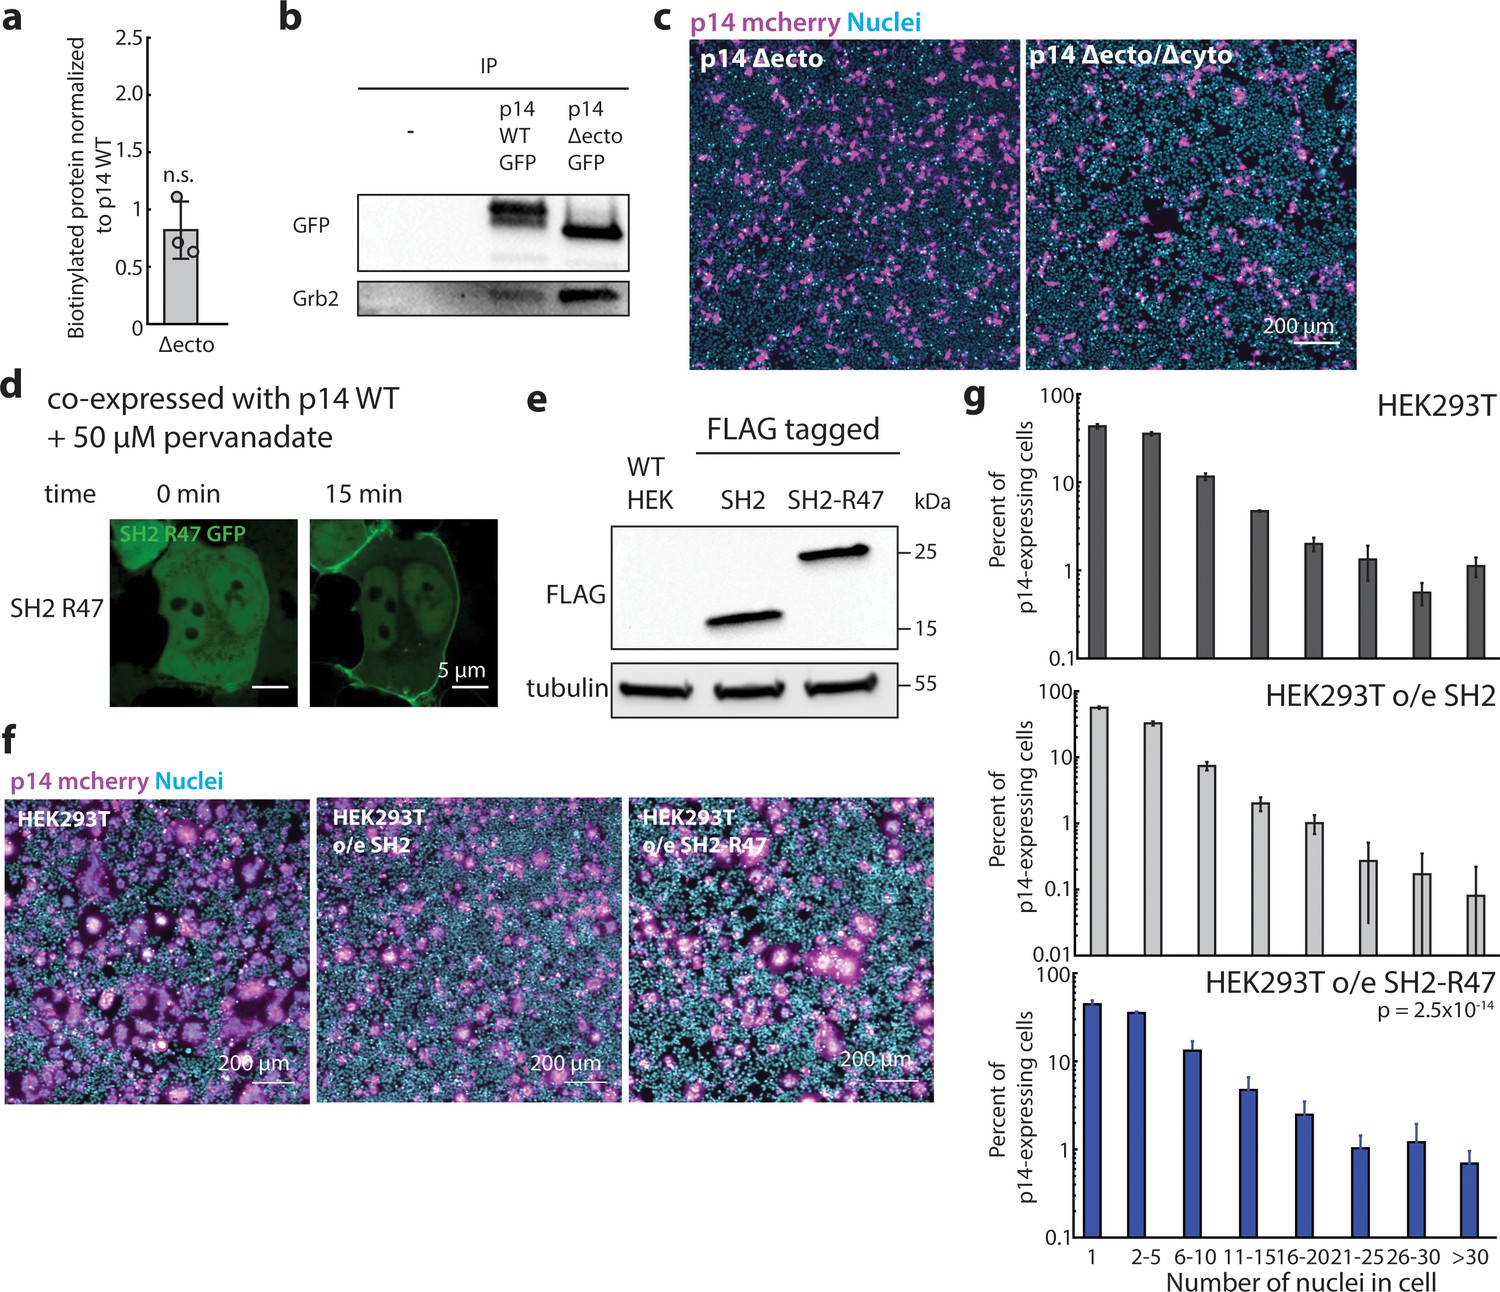
Characterization of p14 Δectodomain and direct coupling of p14 to actin assembly.
(a) Average biotinylated p14 Δecto to that of p14 WT. Error bars represent standard deviations from three independent transfections and biotinylation. P-values are two-tailed two-sample Student’s t-test to p14 WT where n.s. = p>0.05. Representative western blot is in Figure 1—figure supplement 1g. (b) Western blot of co-immunoprecipitation of p14 Δectodomain and p14 WT with Grb2. (c) Representative field of view of HEK293T cells expressing p14 WT and p14 truncation mutants with p14 labeled with C-terminus mcherry (magenta) and nuclei stained with Hoechst 33342 (cyan). (d) Representative confocal images of HEK293T cells over-expressing SH2-47 residues from EpsFu tagged with GFP and p14 WT mcherry (not shown) before and after addition of pervanadate to phosphorylate p14. (e) Western blot of HEK293T cells over-expressing FLAG-tagged SH2 and SH2-47 residues from EpsF(U). (f) Representative field of view of HEK293T cells and HEK293T cells over-expressing SH2 and SH2-47 residues from EpsF(U) transfected with p14 WT with p14 labeled with C-terminus mcherry (magenta) and nuclei stained with Hoechst 33342 (cyan). (g) Average nuclei count of p14-expressing in HEK293T cells and HEK293T over-expressing SH2 and SH2-R47. P-values are ks-test and error bars represent standard deviation from 3 independent transfections.
-
Figure 5—figure supplement 1—source data 1
Excel Spreadsheet of surface biotinylation of p14-WT-GFP and p14-Δecto-GFP for Figure 5—figure supplement 1a.
- https://cdn.elifesciences.org/articles/51358/elife-51358-fig5-figsupp1-data1-v1.xlsx
Figure 5—figure supplement 2
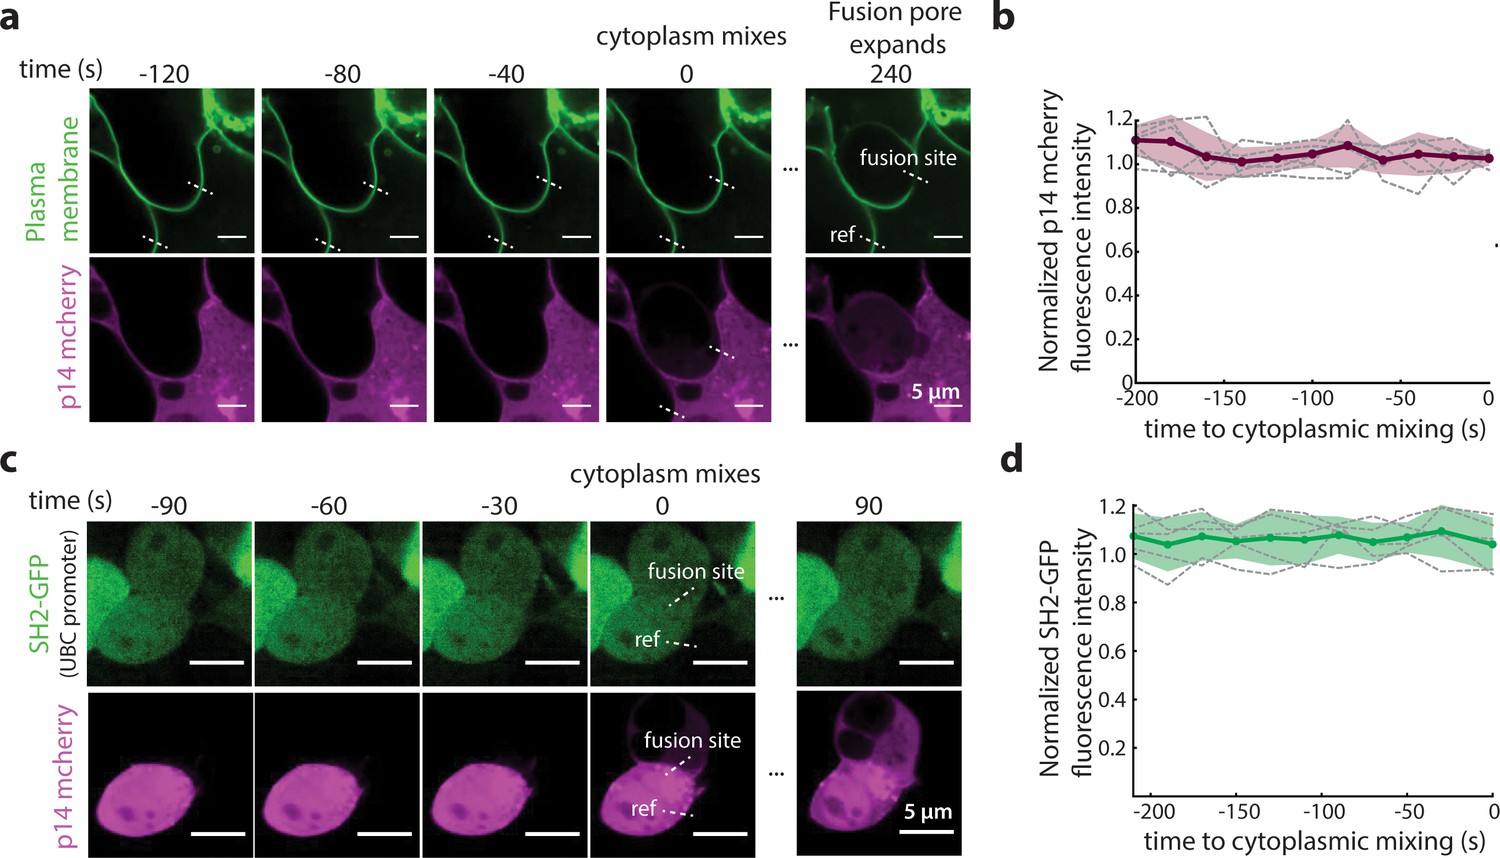
Characterization of p14 at time and site of fusion.
(a) Representative fluorescence images of a fusion site 120 s prior to cytoplasmic mixing. Plasma membrane is marked with GPI-anchored pHluorin (green) and p14-WT mCherry in magenta. Dotted white lines mark the fusion site and a reference membrane site where p14-WT mCherry fluorescence intensity is normalized to. (b) Normalized p14-WT mCherry fluorescence intensity at the fusion site 200 s prior to cytoplasmic mixing for 6 fusion events. Bolded line is average normalized intensity and filled in area are the standard deviations. (c) Representative snapshots of a fusion site 90 s prior to cytoplasmic mixing. SH2-GFP (green) and p14-WT mCherry in magenta. Dotted white lines mark the fusion site and a reference membrane site where SH2-GFP fluorescence intensity is normalized to. (d) Normalized SH2-GFP fluorescence intensity at the fusion site 210 s prior to cytoplasmic mixing for 5 fusion events. Bolded line is average normalized intensity and filled in area are the standard deviations.
-
Figure 5—figure supplement 2—source data 1
Excel Spreadsheet of normalized intensity of p14-WT-mCherry and SH2-GFP at fusion site ~200 s prior to fusion for Figure 5—figure supplement 2b and d.
- https://cdn.elifesciences.org/articles/51358/elife-51358-fig5-figsupp2-data1-v1.xlsx
Author response image 1
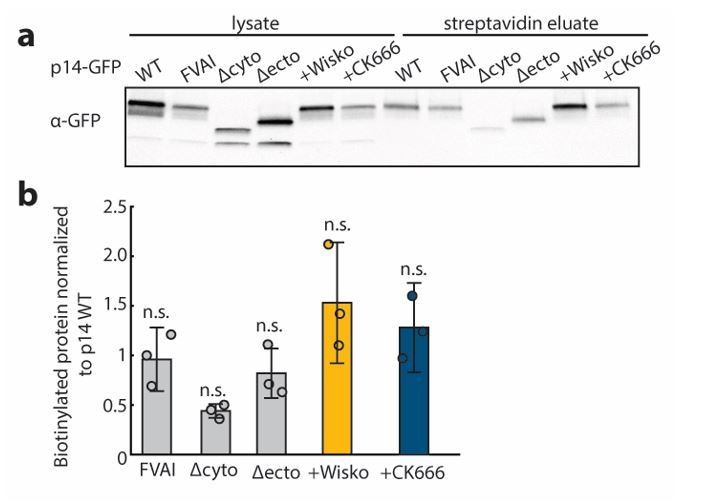
Surface biotinylation of p14, p14 mutants and cells treated with cytoskeletal drugs.
(a) Representative western blot probed with α-GFP of lysate and streptavidin eluate of surface biotinylated cells expressing p14 WT, p14 FVAI, p14 Δcyto, p14 Δecto, and p14 WT expressing cells treated with Wiskostatin and CK-666. (b) Ratio of streptavidin eluate to lysate of p14 FVAI, p14 Δcyto, p14 Δecto, and p14 WT expressing cells treated with Wiskostatin and CK-666 normalizd to that of p14 WT. Average and standard deviations from three independent transfections and blots shown. P-values are two-tailed, two-sample Student’s t-test between condition and p14 WT n.s p>0.05.
Author response image 2
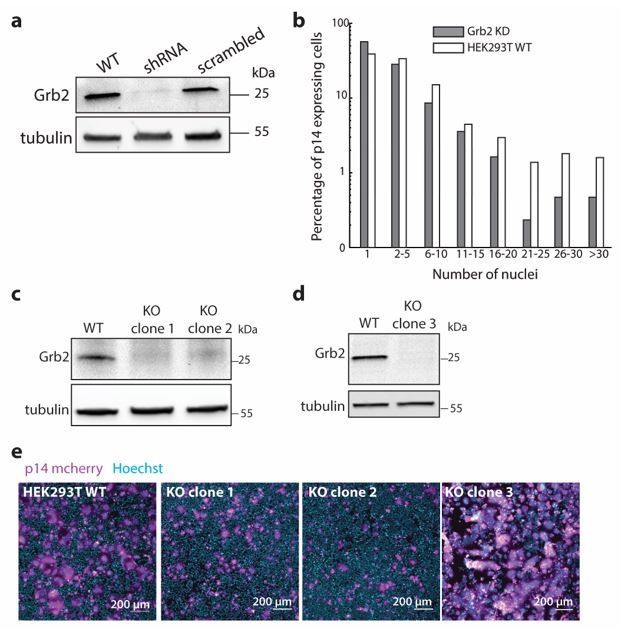
Extent of p14-mediated cell-cell fusion in Grb2 KD and KO cells.
(a) Western blot probed with α-Grb2 of HEK293T with Grb2 knockdown. (b) Extent of p14-mediated cell-cell fusion in Grb2 KD and wild-type HEK293T cells. (c) Western blot probed with α-Grb2 of clone 1 and clone 2 of HEK293T with Grb2 knocked-out using Crispr-Cas9. (d) Western blot probed with α-Grb2 of clone 3 of HEK293T with Grb2 knocked-out using Crispr-Cas9. (e) Representative confocal images of wild-type HEK293T cells, KO clone 1, KO clone 2, KO clone 3 (magenta). Nuclei were stained with Hoechst 33342 (cyan).
Author response image 3
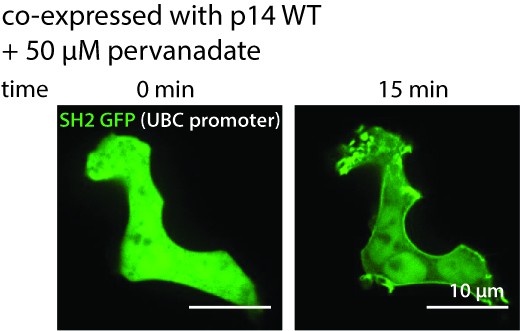
Time-lapse imaging of p14 at sites of fusion using confocal microscopy.
SH2-GFP (green) re-localizes to the plasma membrane when co-expressed with p14-WT mCherry (not shown) and treated with pervanadate to increase phosphorylation of p14.
Author response image 4
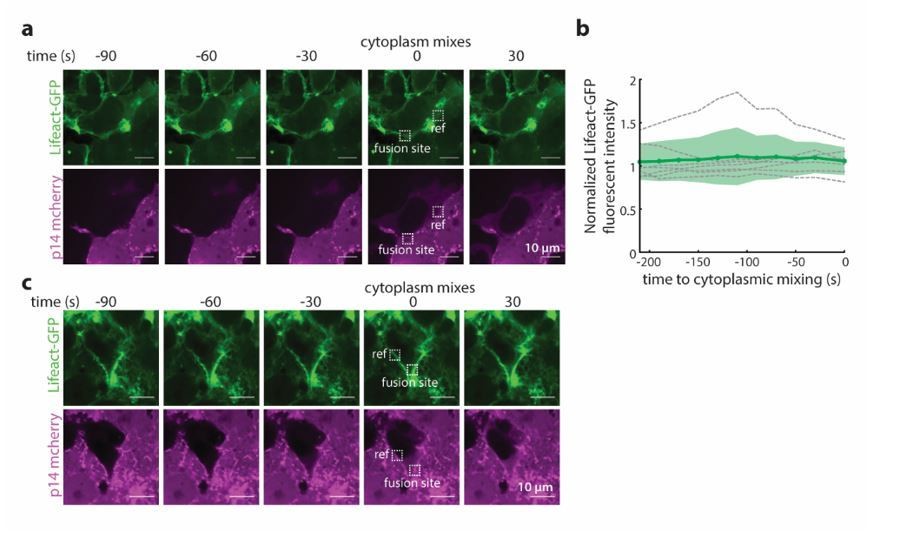
Time-lapse imaging of p14 and actin at times and sites of fusion.
(a) Representative snapshots of a fusion site 90 sec prior to cytoplasmic mixing. Actin is visualized with Lifeact-GFP(green) and p14-WT mCherry in magenta. Boxed region marks the fusion site, where the average lifeact-GFP fluorescence intensity is quantified and normalized to the fluorescence intensity at a reference site on the plasma membrane. Representative fluorescent images of a fusion site 90 sec prior to cytoplasmic mixing. Actin is visualized with Lifeact-GFP(green) and p14-WT mCherry in magenta. Boxed region marks the fusion site, where the average lifeact-GFP fluorescence intensity is quantified and normalized to the fluorescence intensity at a reference site on the plasma membrane. (b) Normalized lifeact-GFP fluorescence intensity at the fusion site 210 sec prior to cytoplasmic mixing for 7 fusion events. Bolded line is average normalized intensity and filled in areas are the standard deviations. (c) Fluorescent images of a fusion site 90 sec prior to cytoplasmic mixing where Lifeact-GFP fluorescence intensity is enriched at the fusion site.
Author response image 5
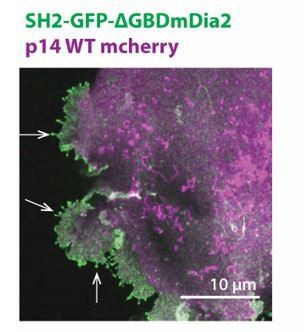
Confocal image of HEK293T cell over-expressing SH2-GFP-ΔGBD-mDia2 and p14-WT-mCherry.
HEK293T cell expressing SH2-GFP- ΔGBD-mDia2 (green) and p14-WT-mCherry (magenta) with filopodia-like protrusions denoted with white arrows.
Videos
Video 1
Phase contrast timelapse of HEK293T cells expressing p14 WT showing extensive syncytium formation.
Video 2
Confocal timelapse of a HEK293T expressing p14-mcherry (magenta) fusing with a WT HEK293T cell that appears dark.
Plasma membrane is marked with gpi-anchored pHluorin (green). Scale bar is 5 μm.
Additional files
-
Supplementary file 1
Key resources table.
- https://cdn.elifesciences.org/articles/51358/elife-51358-supp1-v1.docx
-
Transparent reporting form
- https://cdn.elifesciences.org/articles/51358/elife-51358-transrepform-v1.docx
Download links
A two-part list of links to download the article, or parts of the article, in various formats.
Downloads (link to download the article as PDF)
Open citations (links to open the citations from this article in various online reference manager services)
Cite this article (links to download the citations from this article in formats compatible with various reference manager tools)
A viral fusogen hijacks the actin cytoskeleton to drive cell-cell fusion
eLife 9:e51358.
https://doi.org/10.7554/eLife.51358


