PHF19 mediated regulation of proliferation and invasiveness in prostate cancer cells
- Centre for Genomic Regulation (CRG), The Barcelona Institute of Science and Technology, Spain
- Universitat Pompeu Fabra (UPF), Spain
- ICREA, Spain
Figures
Figure 1 with 1 supplement

PHF19L associates with PRC2 in prostate cancer cells.
(A) Schematic representation of PHF19L and PHF19S and their domains. (B) Western blot analysis showing expression of PHF19L, PHF19S, EZH2, and GAPDH in RWPE1, PC3, and DU145 cells. *, non-specific bands (C) Summary of the main interactors of PHF19L and PHF19S identified by mass spectrometry (MS). PC3 cells stably expressing FLAG-tagged PHF19L or PHF19S, or FLAG-tagged empty vector (control), were subjected to FLAG affinity purification followed by MS. The table displays the score and the peptide count from two independent experiments. (D,E) Endogenous co-immunoprecipitation (IP) of PHF19L with EZH2 or SUZ12 in control (shCTR) and PHF19L-depleted (shPHF19L#1 or shPHF19L#4) PC3 cells (D) or DU145 cells (E). IgG was used as a control. *, non-specific band.
Figure 1—figure supplement 1
PHF19L associates with PRC2 in prostate cancer cells.
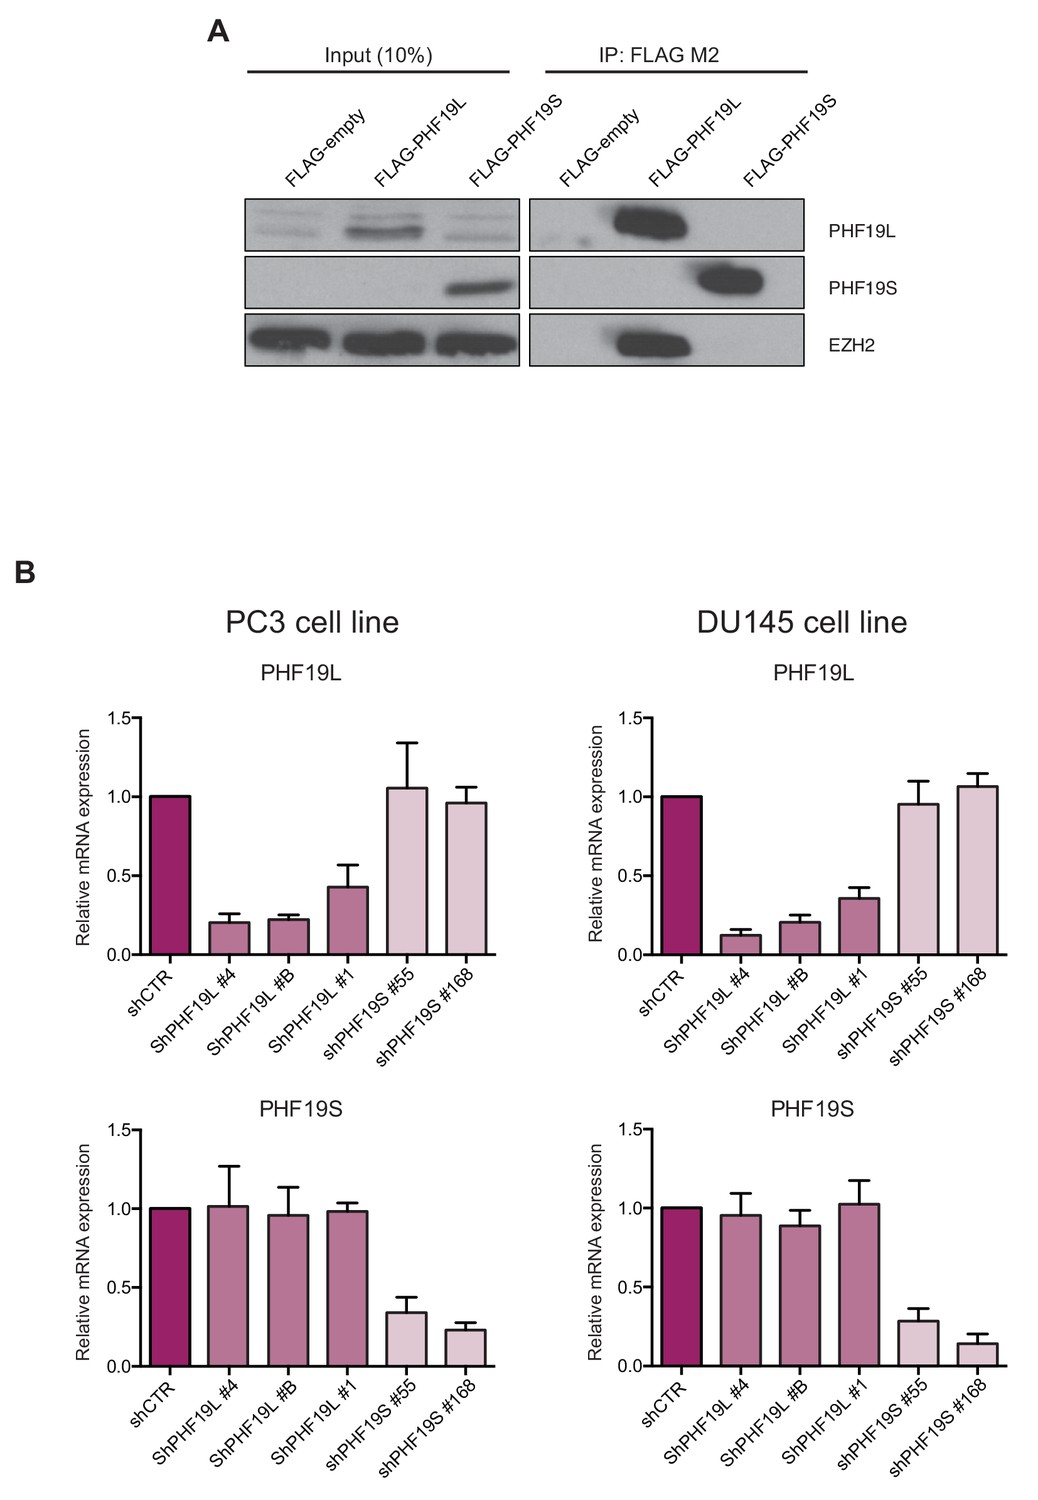
(A) Co-immunoprecipitation (IP) of FLAG-tagged proteins in PC3 cells overexpressing FLAG-PHF19L, FLAG-PHF19S, or FLAG-Empty. IP experiments were performed using anti FLAG-M2 antibody followed by EZH2 and PHF19L detection by Western blot. (B) RT-qPCR showing expression of the PHF19L (upper panels) and PHF19S (lower panels) isoforms in PC3 (left panels) and DU145 (right panels) cells. Cells were transduced with lentivirus expressing different shRNAs against PHF19L (shPHF19L#1, shPHF19L#4 or shPHF19L#B), PHF19S (shPHF19S#55 or shPHF19S#168) or a control shRNA (shCTR). Results are shown relative to shCTR and are normalized to the housekeeping gene RPLPO. Data represent mean ± SD from three biological replicates.
Figure 2 with 1 supplement
PHF19L co-localizes with PRC2 complex on chromatin.
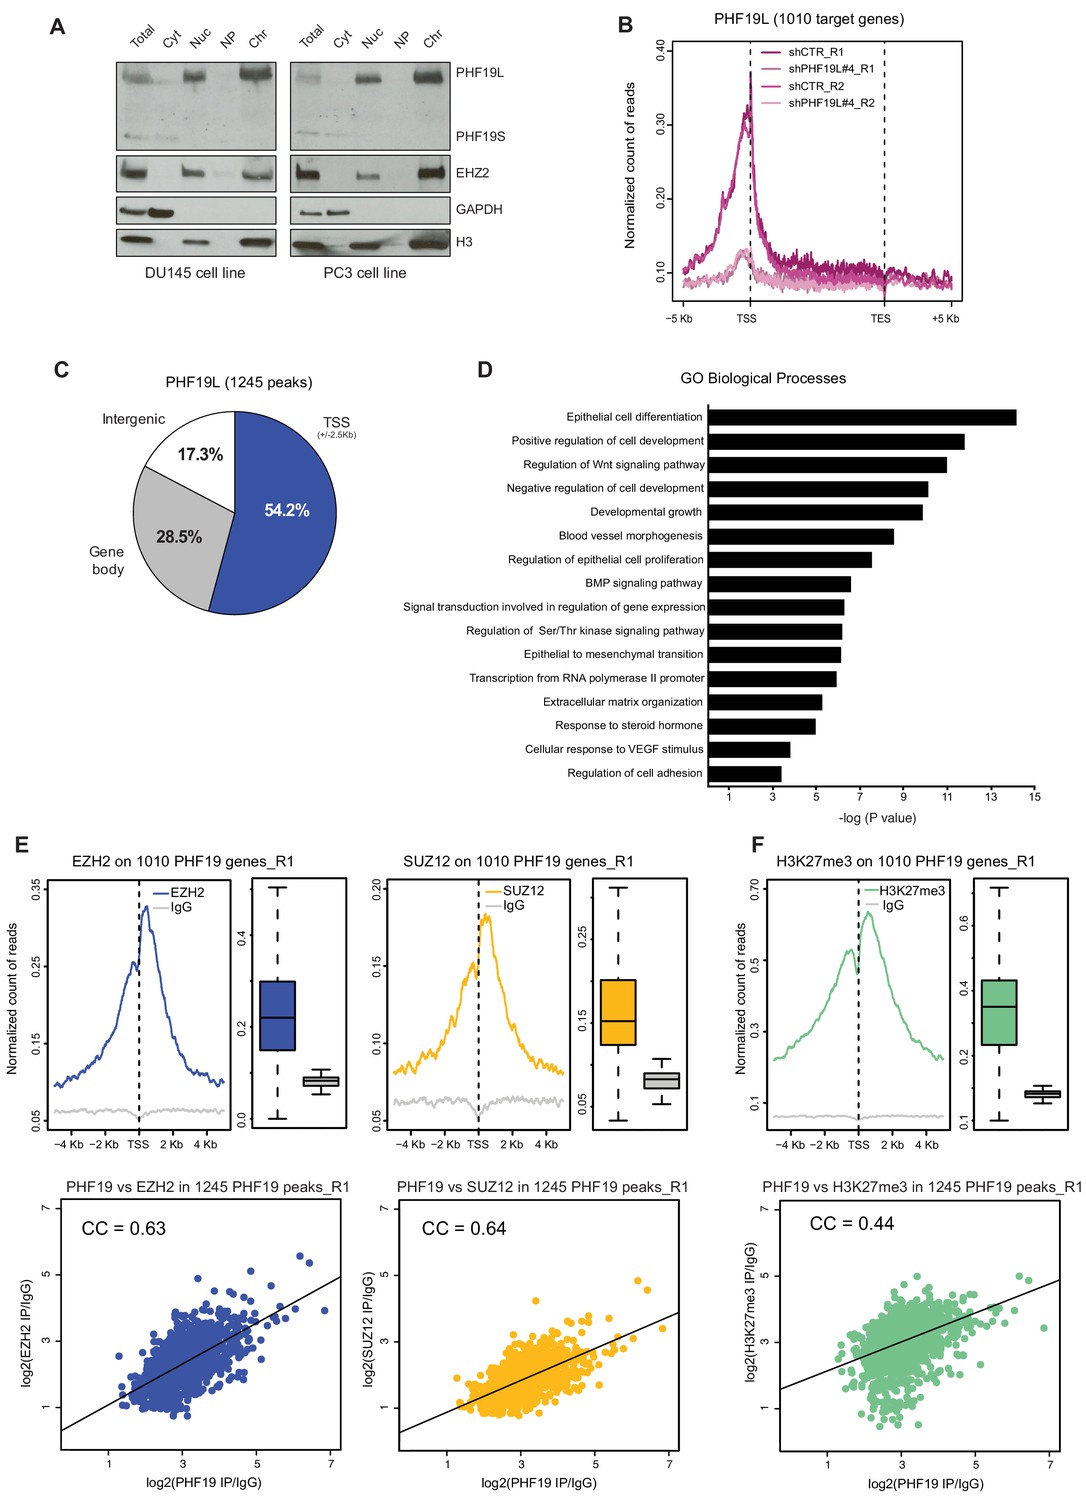
(A) Cell fractionation followed by Western blot analysis in DU145 (left) and PC3 (right) cells, showing that PHF19L is mainly present in the chromatin and PHF19S, in the cytoplasm. Total, total cell extract; Cyt, cytoplasm; Nuc, nucleus; NP, nucleoplasm; Chr, chromatin. (B) Metagene profile showing enrichment of PHF19 ChIP-signal along the 1010 PHF19L target genes in control (shCTR) and PHF19L knockdown (shPHF19L#4) cells, for two independent biological replicates (R1 and R2). Enrichment levels are normalized for the total number of reads of each sample. (C) Pie chart representing the distribution of PHF19L binding sites (ChIP-seq peaks) in the indicated genomic regions. (D) Gene ontology (GO) analysis of biological processes of PHF19L target genes in DU145 cells. (E,F) (Top) TSS (± 5 kb) enrichment plots of the indicated ChIP-seq experiments (Replicate 1) at the 1010 PHF19L target genes in DU145 cells. Boxplots showing the corresponding distribution of values are presented next to each TSS plot. Enrichment levels are normalized for the total number of reads of each sample. (Bottom) Scatter plots comparing the ChIP-seq enrichment signals (IP/IgG) of PHF19L against EZH2 (E, left panel), SUZ12 (E, right panel), or H3K27me3 (F) in the 1245 PHF19L ChIP-peaks. CC is the correlation between each pair of variables (P value ≤ 10−16 in all 3 cases). P values were computed using Pearson’s product-moment correlation.
Figure 2—figure supplement 1
PHF19L co-localizes with PRC2 complex in chromatin.
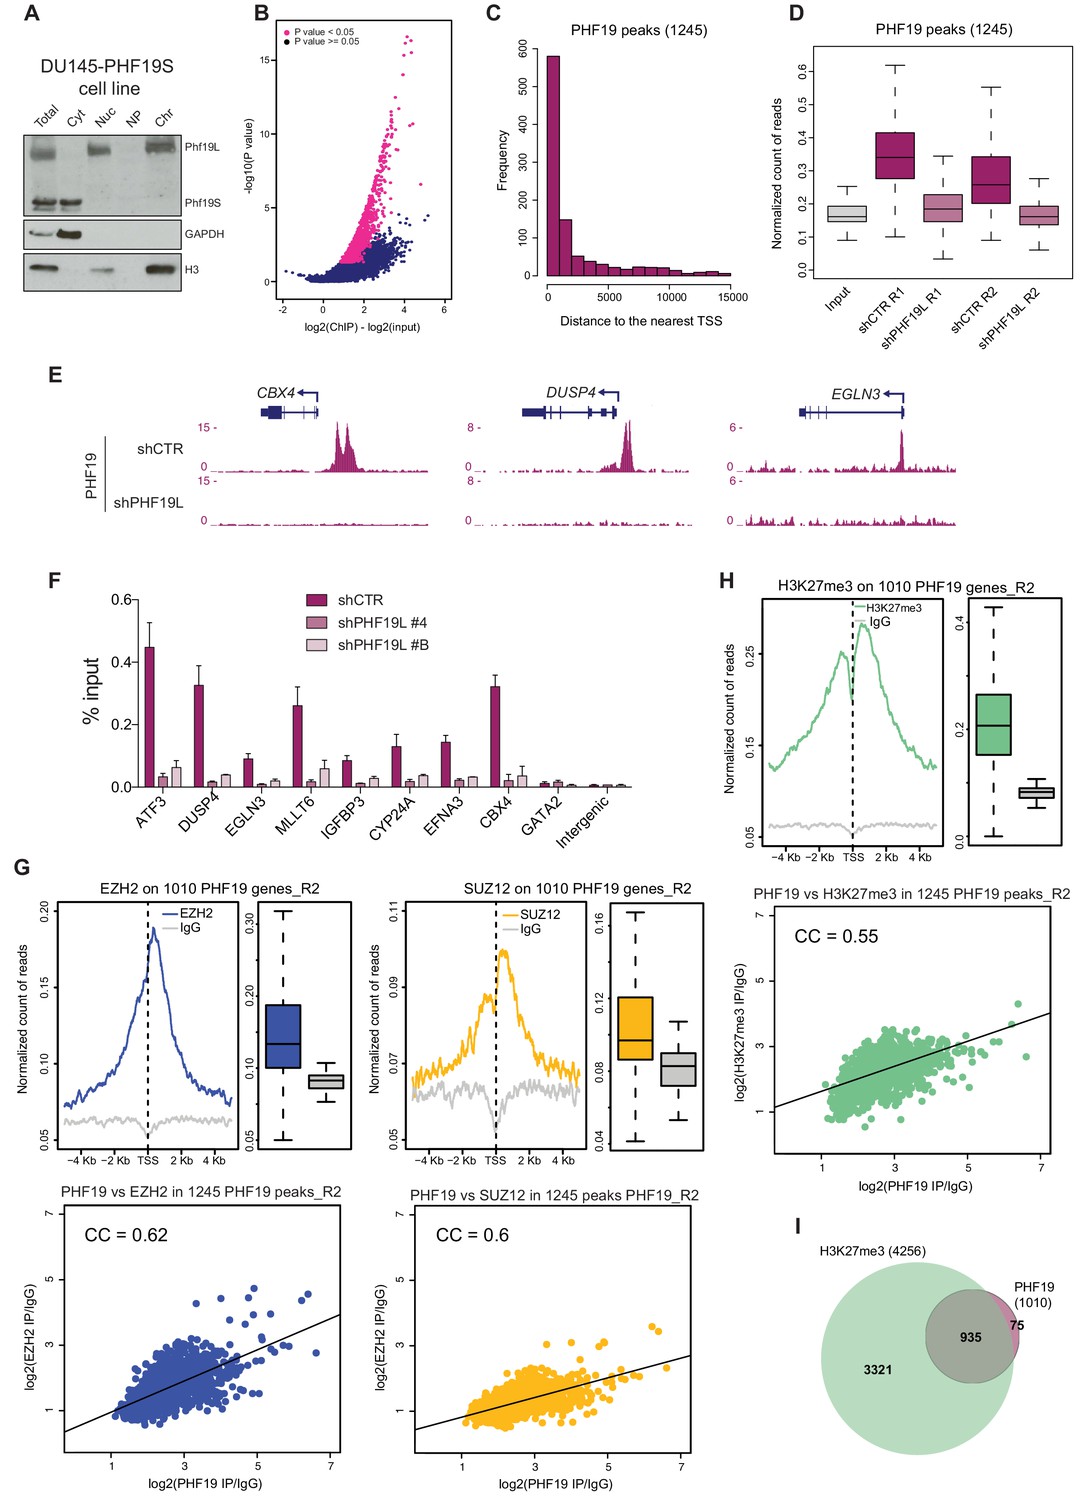
(A) Cell fractionation in DU145 cells overexpressing PHF19S followed by Western blot analysis, showing that PHF19L is present on chromatin, and PHF19S in the cytoplasm. Total, total cell extract; Cyt, cytoplasm; Nuc, nucleus; NP, nucleoplasm; Chr, chromatin. (B) Volcano plot of the 1,245 PHF19L significant peaks identified by DiffBind (P value < 0.05 and FDR < 0.2) introducing two biological replicates of each sample (ChIP and Input). The x-axis represents the difference in the number of reads at each peak between ChIPs and the corresponding inputs. The y-axis represents the significance of the peaks (–log P value). (C) Histogram showing the distribution of PHF19L binding sites (ChIP-seq peaks) relative to the nearest TSS. The x-axis represents relative distance (bp) from the peak summit to the TSS, and the y-axis, the number of peaks in each class. (D) Boxplot showing PHF19 ChIP-seq signal intensity at the 1245 binding sites in two independent replicates (R1 and R2) of control (shCTR) and PHF19L knockdown (shPHF19L#4) DU145 cells. PHF19L knockdown cells showed strongly reduced binding, demonstrating the specificity of the antibody. Input signal is shown as negative control. Values associated to the peaks were normalized by the total number of reads of each ChIP-seq experiment. (E) UCSC genome browser screenshots of three PHF19L target genes showing the profiles of the corresponding ChIP-seq experiments in control and PHF19L knockdown (shPHF19L#4) DU145 cells. (F) ChIP-qPCR validation of eight representative PHF19L binding sites and two negative controls (GATA2 and an intergenic region) in control (shCTR) and PHF19L-depleted (shPHF19L#4 and shPHF19L#B) DU145 cells. Data represent the mean ± SD from three biological replicates. (G,H) (Top) TSS (± 5 kb) enrichment plot of the indicated ChIP-seq experiments (Replicate 2) at the 1,010 PHF19L target genes in DU145 cells. Boxplots showing the corresponding distribution of values are shown next to each TSS plot. Enrichment levels are normalized for the total number of reads of each sample. (Bottom) Scatter plots comparing the ChIP-seq enrichment signals (IP/IgG) of PHF19 against EZH2 (G, left panel), SUZ12 (G, right panel), or H3K27me3 (H) in the 1,245 PHF19 peaks for the second set of replicates. CC is the correlation between each pair of variables (P value ≤ 10−16 in all cases). P values were computed using Pearson’s product-moment correlation. (I) Venn diagram showing a significant overlapping between the 1,010 PHF19L target genes and the 4,256 H3K27me3 target genes in DU145 cells (P value ≤ 10−16; Fisher’s exact test).
Figure 3 with 1 supplement
Increase of PRC2 occupancy upon PHF19L depletion.
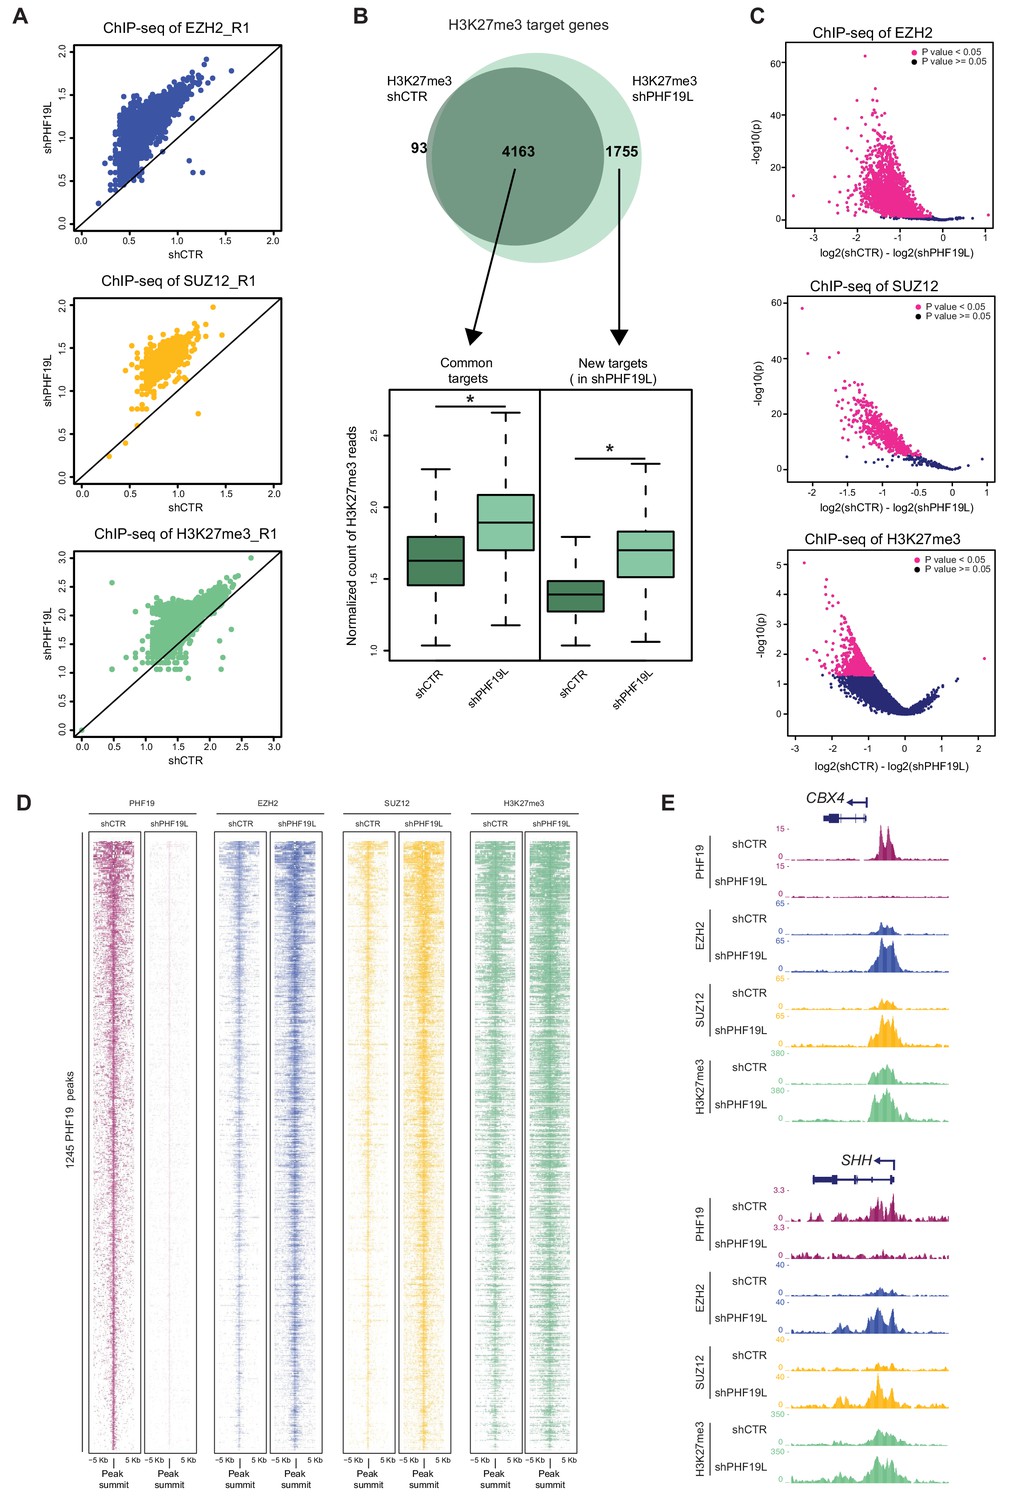
(A) Scatter plots showing correlation of EZH2, SUZ12, and H3K27me3 ChIP-seq reads in shCTR versus shPHF19L#4 DU145 cells. Each dot in the plot corresponds to the number of ChIP-seq reads normalized by the number of fly spike-in reads of each sample for each target gene. Data correspond to replicate 1 (R1). Upper panel: EZH2 target genes; middle panel: SUZ12 target genes; lower panel: H3K27me3 target genes. After depletion of PHF19L a significant increase in EZH2, SUZ12 and H3K27me3 signal was observed. P value ≤ 10−16 in all cases. P values were computed using Wilcoxon test (two-sided). (B) (Top) Venn diagram showing the overlapping of H3K27me3 target genes in control (shCTR) and PHF19L-depleted (shPHF19L#4) DU145 cells (P value ≤ 10−16, Fisher’s exact test). (Bottom) Boxplot showing H3K27me3 ChIP-seq signal intensity for common genes and new targets in control (shCTR) and PHF19L knockdown (shPHF19L#4) DU145 cells. The increase of signal is significant in all cases (P value ≤ 10−16, Wilcoxon test, two-sided). Values associated to the peaks were normalized by the total number of fly spike-in reads of each ChIP-seq experiment. (C) Volcano plots of the EZH2 (top), SUZ12 (middle), and H3K27me3 (bottom) ChIP-seq peaks, showing significant changes in signal upon PHF19 loss, as reported by DiffBind using two biological replicates for each condition (shCTR and shPHF19L#4) (P value < 0.05). For each plot, the union of all peaks of the corresponding ChIP (peaks called in shCTR and peaks called in shPHF19L) was considered. The x-axis represents the difference in the number of reads between the shCTR and the shPHF19L#4, considering both replicates. The y-axis represents the significance of the peaks (-log P value). (D) ChIP-seq heatmap showing the distribution of the PHF19L, EZH2, SUZ12, and H3K27me3 reads on PHF19L peaks (peak summit ± 5 kb) in control and PHF19L-depleted (shPHF19L#4) DU145 cells. Enrichment levels are normalized for the total number of spike-in reads of each sample. Peaks are ranked by the intensity of PHF19 signal in the control condition. (E) UCSC genome browser screenshot of PHF19, EZH2, SUZ12, and H3K27me3 ChIP-seq-profiles from control or PHF19L-depleted (shPHF19L#4) DU145 cells in two representative PHF19L target genes.
Figure 3—figure supplement 1
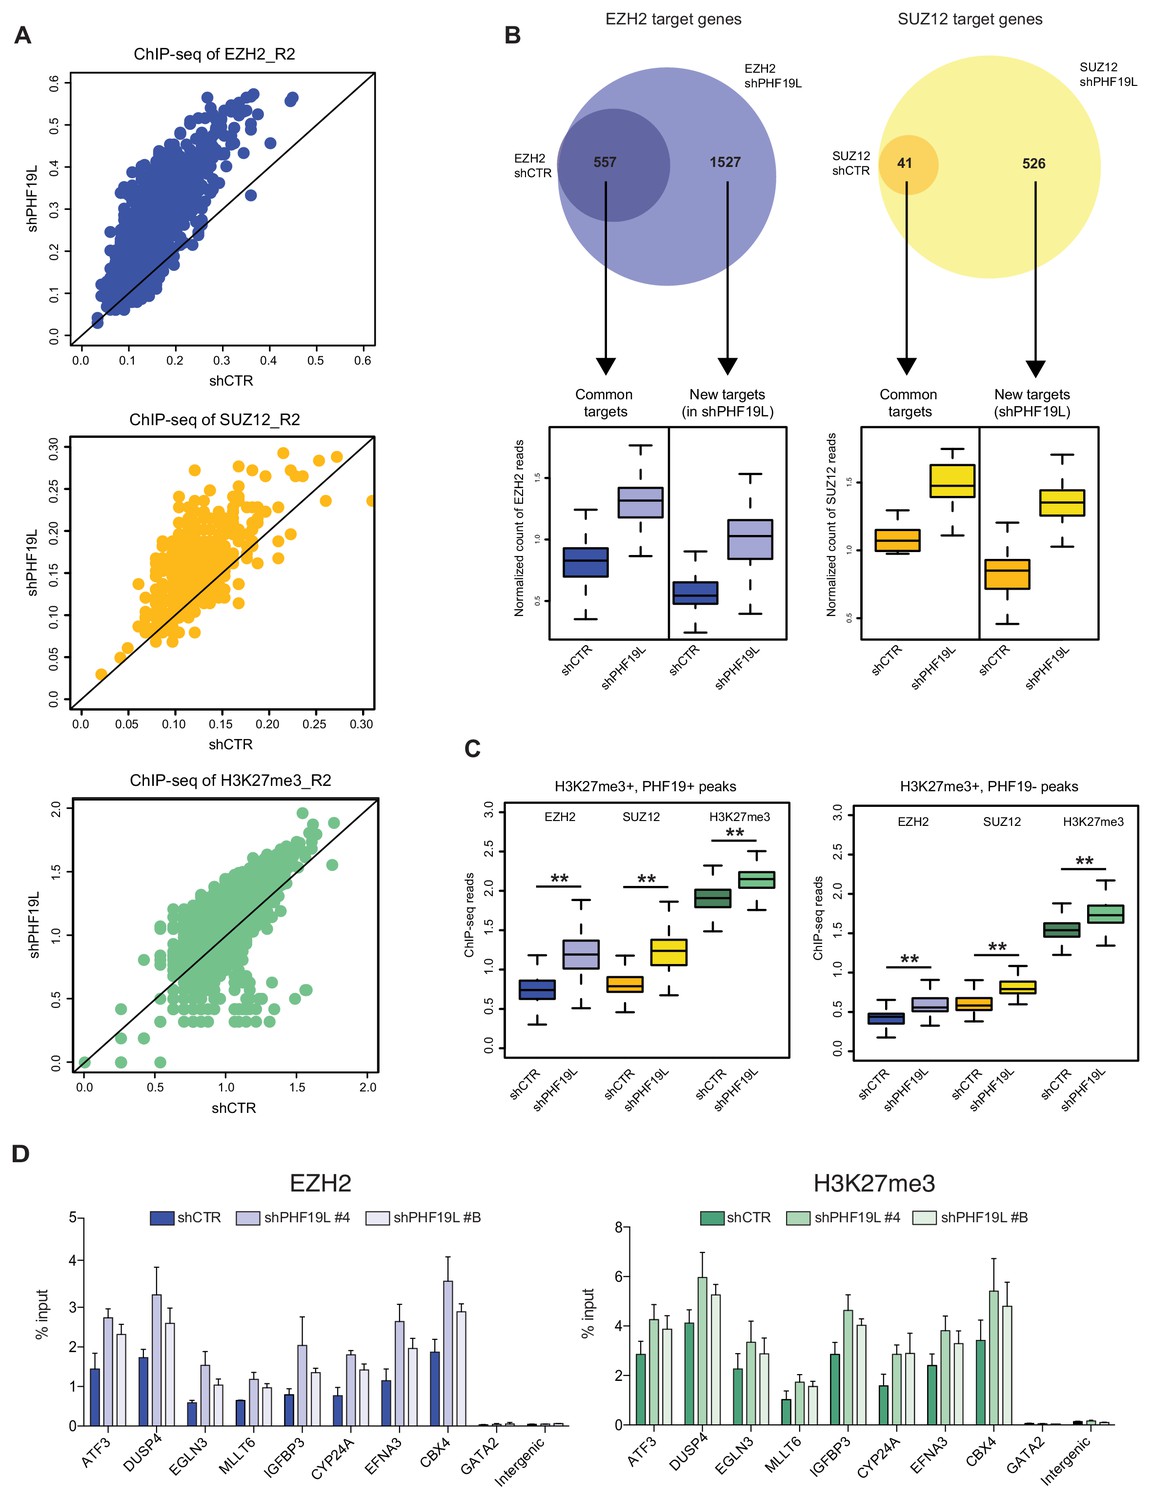
Increase of PRC2 occupancy after PHF19L depletion.
(A) Scatter plots showing correlation of ChIP-seq reads for the second replicate (R2) of EZH2, SUZ12, and H3K27me3 ChIP-seq experiments in shCTR versus shPHF19L#4 DU145 cells. Each dot in the plot corresponds to the number of ChIP-seq reads normalized by the number of fly spike-in reads of each sample for each target gene. Upper panel: EZH2 target genes; middle panel: SUZ12 target genes; lower panel: H3K27me3 target genes. After PHF19L depletion, a significant increase in EZH2, SUZ12 and H3K27me3 signal was observed. P value ≤ 10−16 in all cases. P values were computed using Wilcoxon test (two-sided). (B) (Top) Venn diagrams showing overlapping of EZH2 (left) and SUZ12 (right) target genes in control (shCTR) and PHF19L-depleted (shPHF19L#4) DU145 cells (P value ≤ 10−16, Fisher’s exact test). (Bottom) Boxplot showing EZH2 and SUZ12 ChIP-seq signal intensity for common genes and new targets in control (shCTR) and PHF19L knockdown (shPHF19L#4) DU145 cells. The increase of signal is significant in all cases (P value ≤ 10−16 in all cases except for SUZ12 common targets: P value ≤ 10−11. P values were calculated using the Wilcoxon test, two-sided). Values associated to the peaks were normalized by the total number of fly spike-in reads of each ChIP-seq experiment. (C) Boxplot showing ChIP signal intensity of EZH2, SUZ12, and H3K27me3 in control (shCTR) or PHF19L-depleted (shPHF19L#4) DU145 cells, at the H3K27me3 peaks that overlap (left panel) or not (right panel) with PHF19L peaks. Values associated to the peaks were normalized by the total number of spike-in reads of each ChIP-seq experiment. After PHF19L depletion, a significant increase in signal was observed in all cases. P value ≤ 10−16 (**). P values were computed using Wilcoxon test (two-sided). (D) ChIP-qPCR validation of the increase in EZH2 and H3K27me3 signal upon depletion of PHF19L using two different shRNAs (shPHF19L#4 and shPHF19L#B) in DU145 cells. Eight representative PHF19L binding sites and two negative controls (GATA2 and an intergenic region) are evaluated. Data represent mean ± SD from two biological replicates.
Figure 4 with 1 supplement

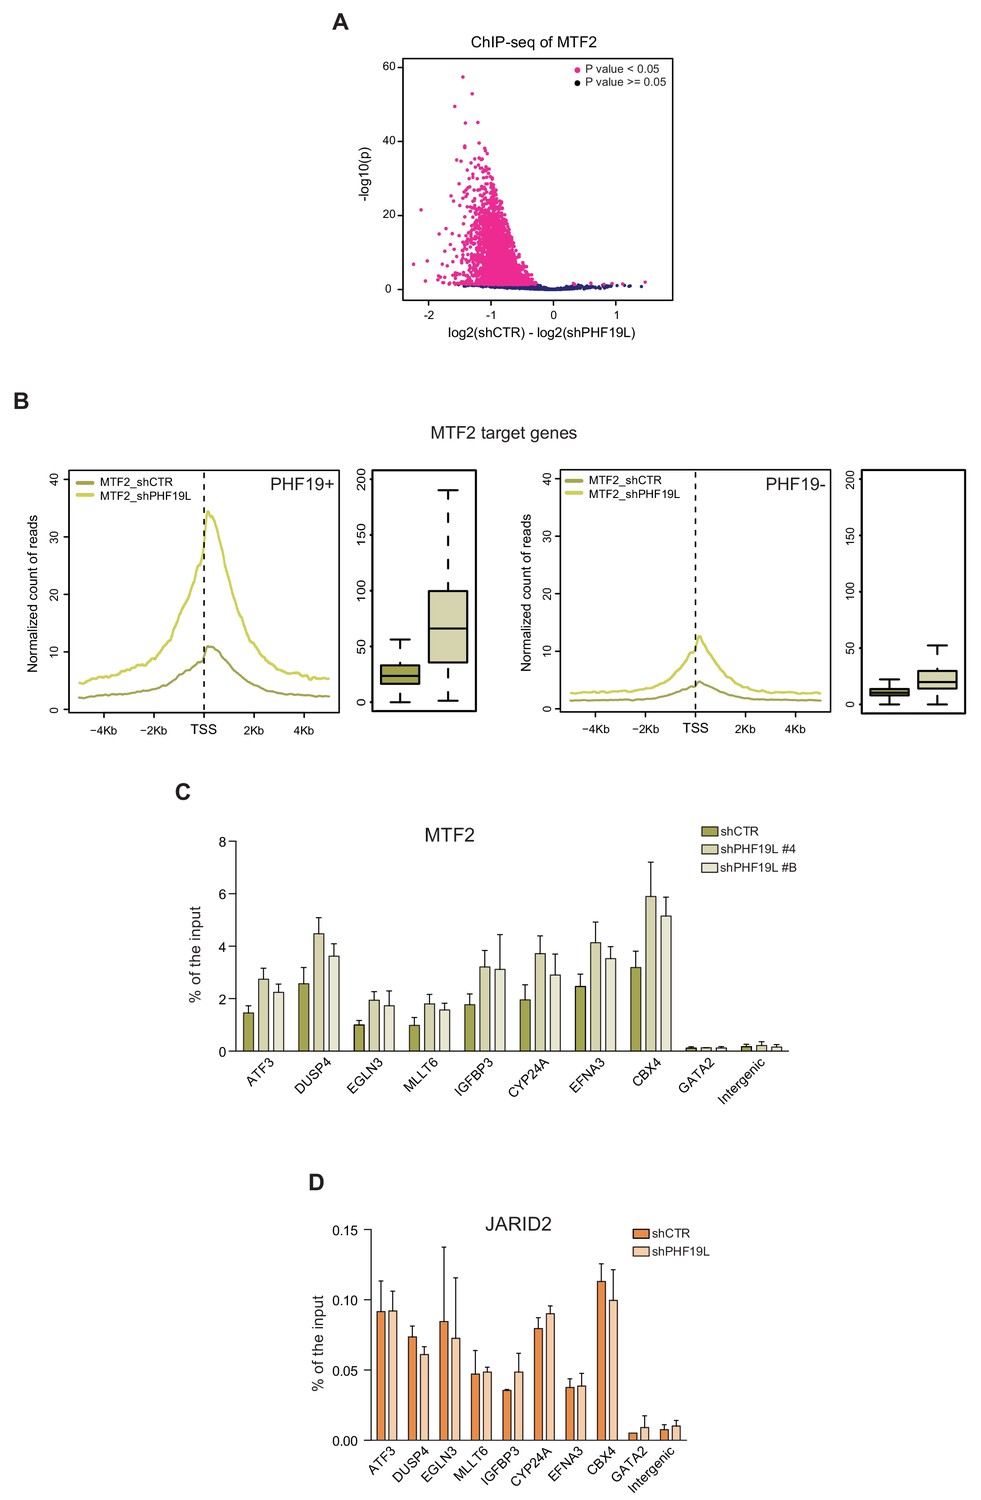
MTF2 is enriched in chromatin in the absence of PHF19L.
(A) Schematic representation of PRC2.1 and PRC2.2 complexes. (B) RT-qPCR of PRC2-associated factors in control and PHF19L-depleted (shPHF19L#4) DU145 cells. Expression was normalized to that of the housekeeping gene RPLPO. Data are presented as the mean ± SD of three biological replicates. Significance was analyzed through Student’s t-test. P value was < 0.05 (*). (C) Cell fractionation showing specific increase of MTF2 protein in whole cell extracts (total) and in the chromatin compartment after knockdown of PHF19L (shPHF19L#4) in DU145 cells. (D) Venn diagram showing overlapping of 1010 PHF19L targets with MTF2 target genes in control (shCTR) and PHF19L-depleted (shPHF19L#4) DU145 cells. (P value ≤ 10−16; Fisher’s exact test). (E) ChIP-seq heatmap of MTF2 on PHF19L peaks (peak summit ± 5 kb) in control and PHF19L-depleted (shPHF19L#4) DU145 cells. Enrichment levels are normalized for the total number of spike-in reads of each sample. Peaks are ranked by the intensity of PHF19 signal in the control condition. (F) UCSC genome browser screenshot showing two examples of genes (CBX4 and SHH) that gain MTF2 after PHF19L knockdown in DU145 cells. (G) Knockdown and rescue of PHF19: ChIP-qPCR experiments of PHF19L and MTF2 in DU145 cells control (shCTR) and PHF19L knockdown (shPHF19L#B, targeting the 3’ UTR region), transduced with either FLAG-tagged PHF19L (+PHF19) or FLAG-Empty vector (-). Amplification of the GATA2 and an intergenic region were used as a negative control. Data represent the mean ± SD from two biological replicates.
Figure 4—figure supplement 1
MTF2 is enriched in chromatin in the absence of PHF19L.
(A) Volcano plot of the MTF2 ChIP-seq peaks, showing a significant gain in signal upon PHF19 loss, as reported by DiffBind biological replicates for each condition (shCTR and shPHF19L#4) (P value < 0.05). The union of all MTF2 peaks (peaks called in shCTR and peaks called in shPHF19L) was considered. The x-axis represents the difference in the number of reads between the shCTR and the shPHF19L#4 replicates. The y-axis represents the significance of the peaks (–log P value). (B) TSS (± 5 kb) enrichment plot of MTF2 ChIP-seq in DU145 cells, showing a general gain of MTF2 signal after PHF19L depletion (shPHF19L#4) in both MTF2+/PHF19+ target genes (left panel) and MTF2+/PHF19– target genes (right panel). Boxplots showing the corresponding distribution of values are shown next to each TSS plot. The increase is significant in both cases (P value ≤ 10−16). P values were computed using Wilcoxon test (two-sided). Enrichment levels were normalized to the total number of spike-in reads of each sample. (C) ChIP-qPCR validation showing increase of MTF2 ChIP-signal in PHF19L target genes after PHF19L depletion (shPHF19L#4 and shPHF19L#B) in DU145 cells. Data represent mean ± SD from two biological replicates. (D) ChIP-qPCR showing no changes in JARID2 binding in PHF19L target genes after PHF19L knockdown (shPHF19L#4) in DU145 cells. Data represent mean ± SD from two biological replicates.
Figure 5 with 1 supplement
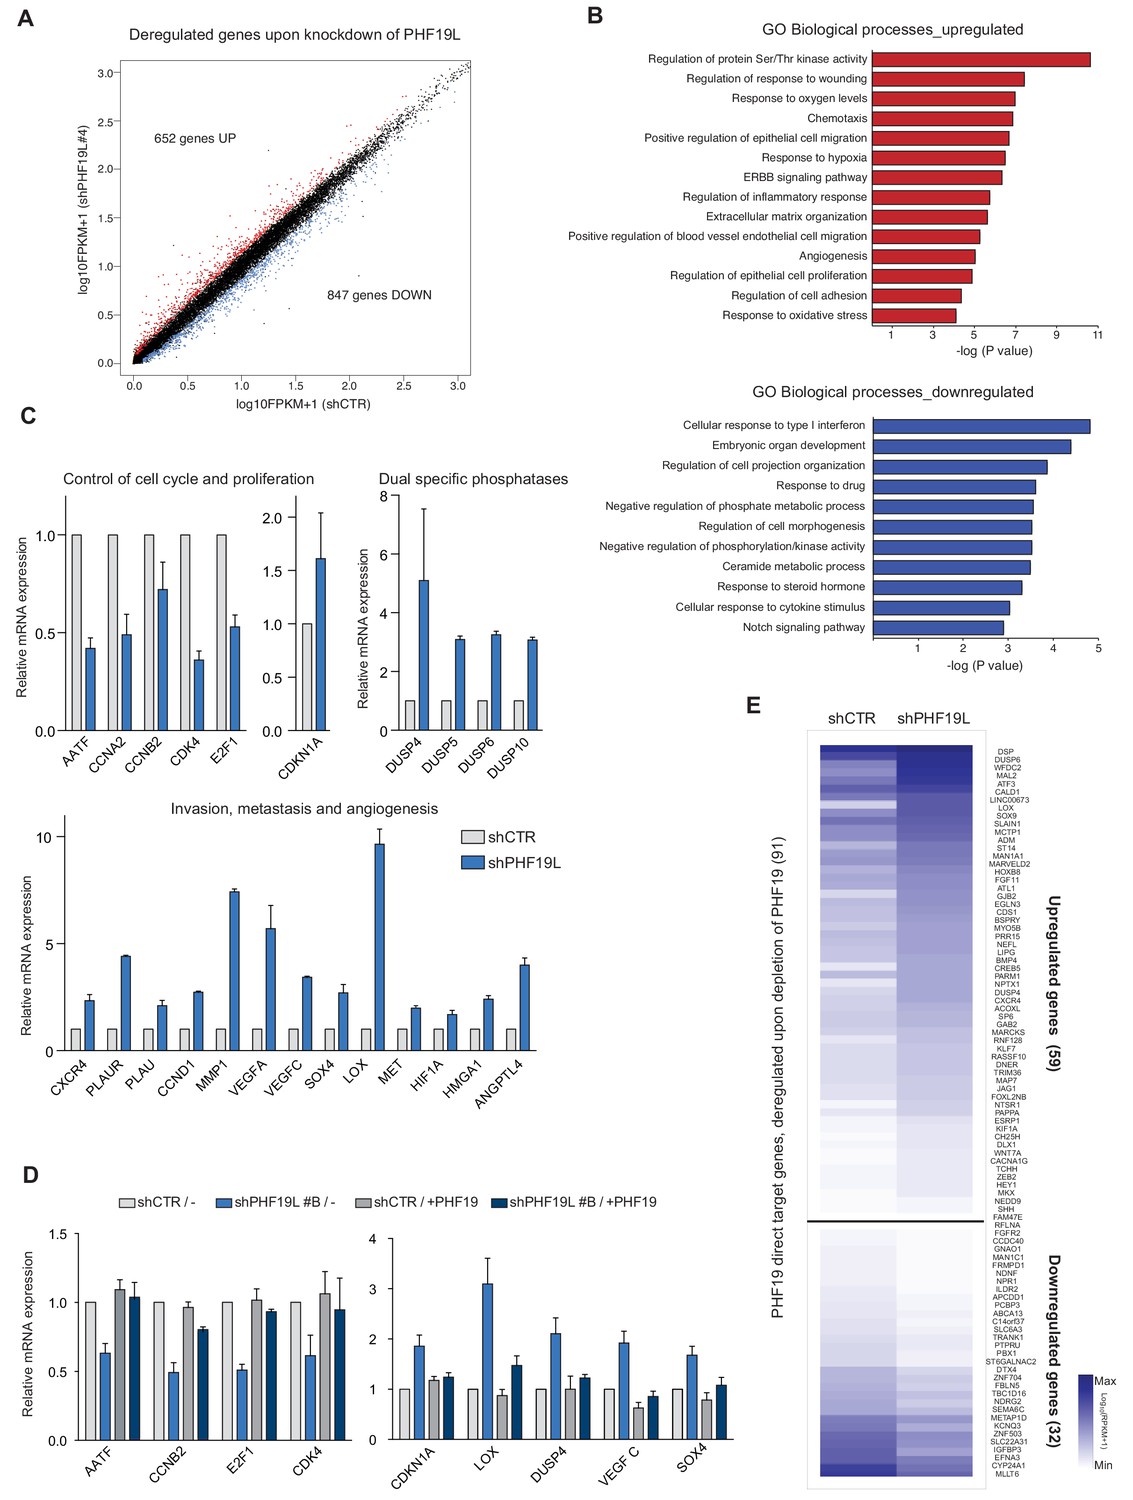
PHF19L regulates the expression of genes essential for tumor growth, invasiveness, and metastasis in prostate cancer cells.
(A) Scatter plot showing changes in gene expression as detected by RNA-seq in PHF19L knockdown (shPHF19L#4) as compared to control (shCTR) DU145 cells. Up- and downregulated genes are highlighted in red and blue, respectively. The remaining genes are shown in black. (B) GO analysis of biological processes of upregulated (upper panel) and downregulated (lower panel) genes in DU145 cells after PHF19L knockdown. (C) Expression levels of selected genes were determined by RT-qPCR in control and PHF19L-depleted (shPHF19L#4) DU145 cells. Results are shown relative to shCTR and are normalized to the housekeeping gene RPLPO. Data are presented as mean ± SD of three biological replicates. (D) Expression levels of selected genes were determined by RT-qPCR in DU145 cells control (shCTR) and PHF19L knockdown (shPHF19L#B, targeting the 3’ UTR region), transduced with either FLAG-tagged PHF19L (+PHF19) or FLAG-Empty vector. Results are shown relative to shCTR /-and are normalized to the housekeeping gene RPLPO. Data are presented as the mean ± SD of two biological replicates. (E) Heatmaps showing RNA-seq signal on PHF19L direct target genes that are transcriptionally up- or downregulated after loss of PHF19L (shPHF19L#4) in DU145 cells.
Figure 5—figure supplement 1
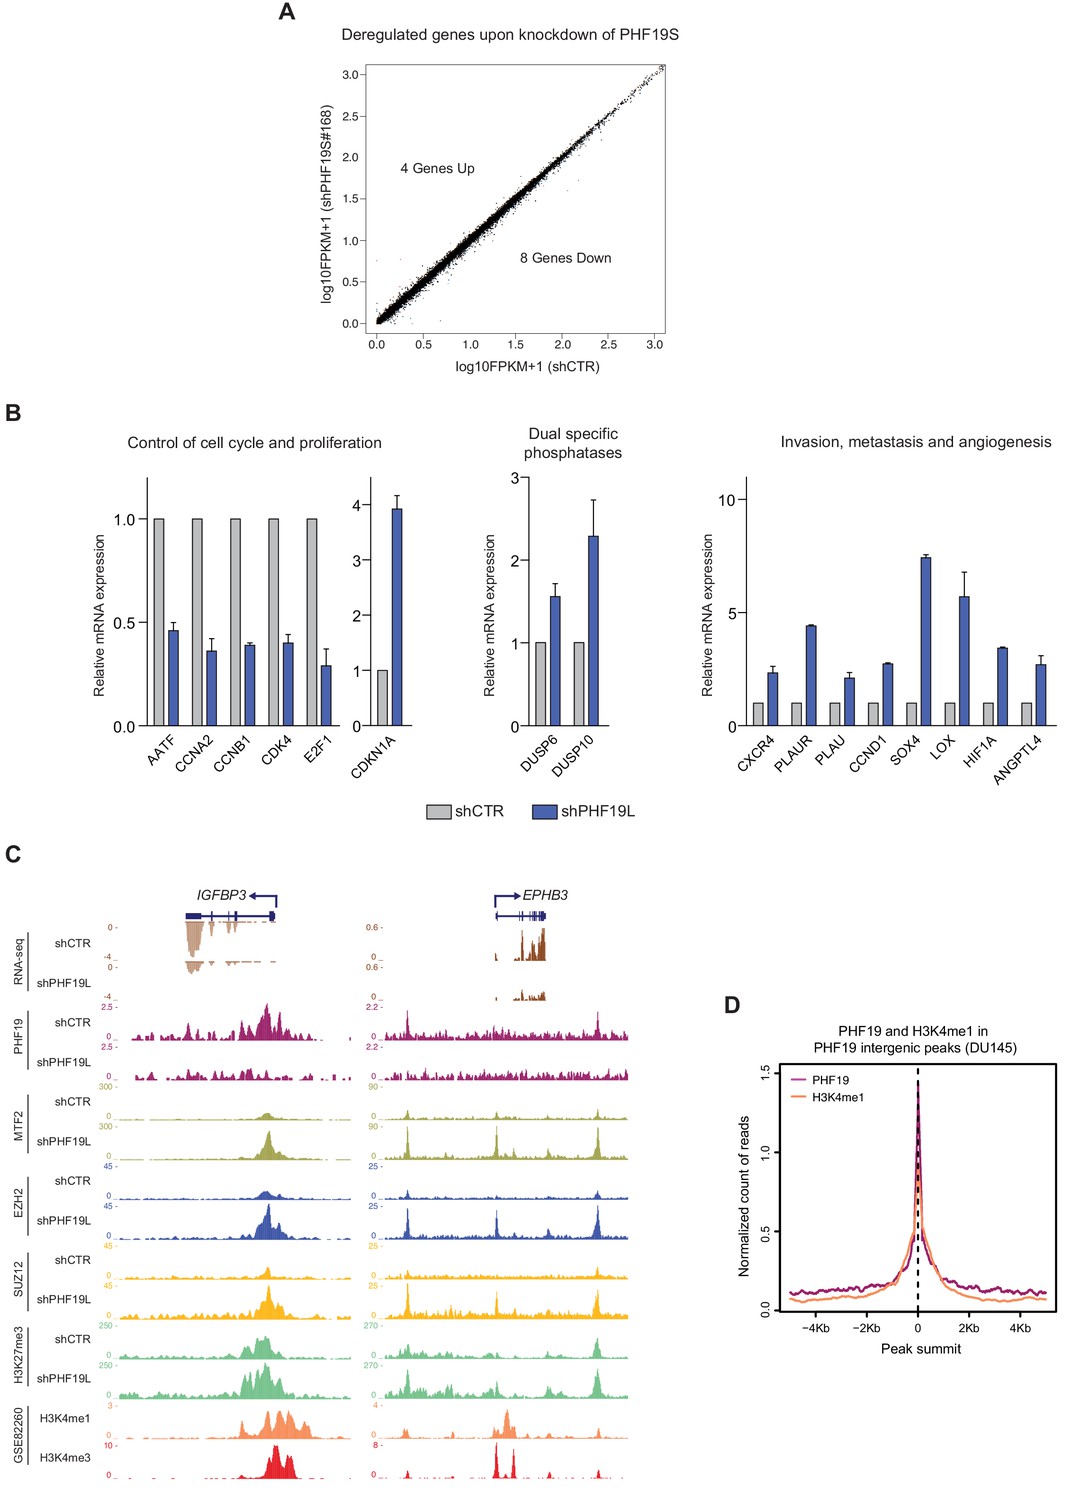
PHF19L regulates the expression of genes essential for tumor growth, invasiveness, and metastasis in prostate cancer cells.
(A) Scatter plot showing no significant changes in gene expression detected by RNA-seq in control (shCTR) versus PHF19S knockdown (shPHF19S#168) DU145 cells. Up- and downregulated genes are highlighted in red and blue, respectively. The remaining genes are shown in black. (B) Expression levels of selected genes were determined by RT-qPCR in control and PHF19L-depleted (shPHF19L#4) PC3 cells. Results are shown relative to shCTR and are normalized to the housekeeping gene RPLPO. Data represent mean ± SD from three biological replicates. (C) Representative examples from UCSC genome browser showing RNA-seq and the indicated ChIP-seq results from control (shCTR) or PHF19L-depleted (shPHF19L#4) DU145 cells. Screenshots correspond to genes downregulated after PHF19L depletion. Left, IGFBP3 gene, which has a PHF19L binding site around its TSS; right, EPHB3 gene, which has two adjacent intergenic PHF19L binding sites. Data corresponding to H3K4me1 and H3K3me3 were obtained from Li et al. (2016) (GSE82260). (D) Enrichment plot of H3K4me1 and PHF19 ChIP-seqs on PHF19L intergenic binding sites (peak summit ± 5 kb) in DU145 cells. Data corresponding to H3K4me1 were obtained from Li et al. (2016) (GSE82260).
Figure 6 with 1 supplement
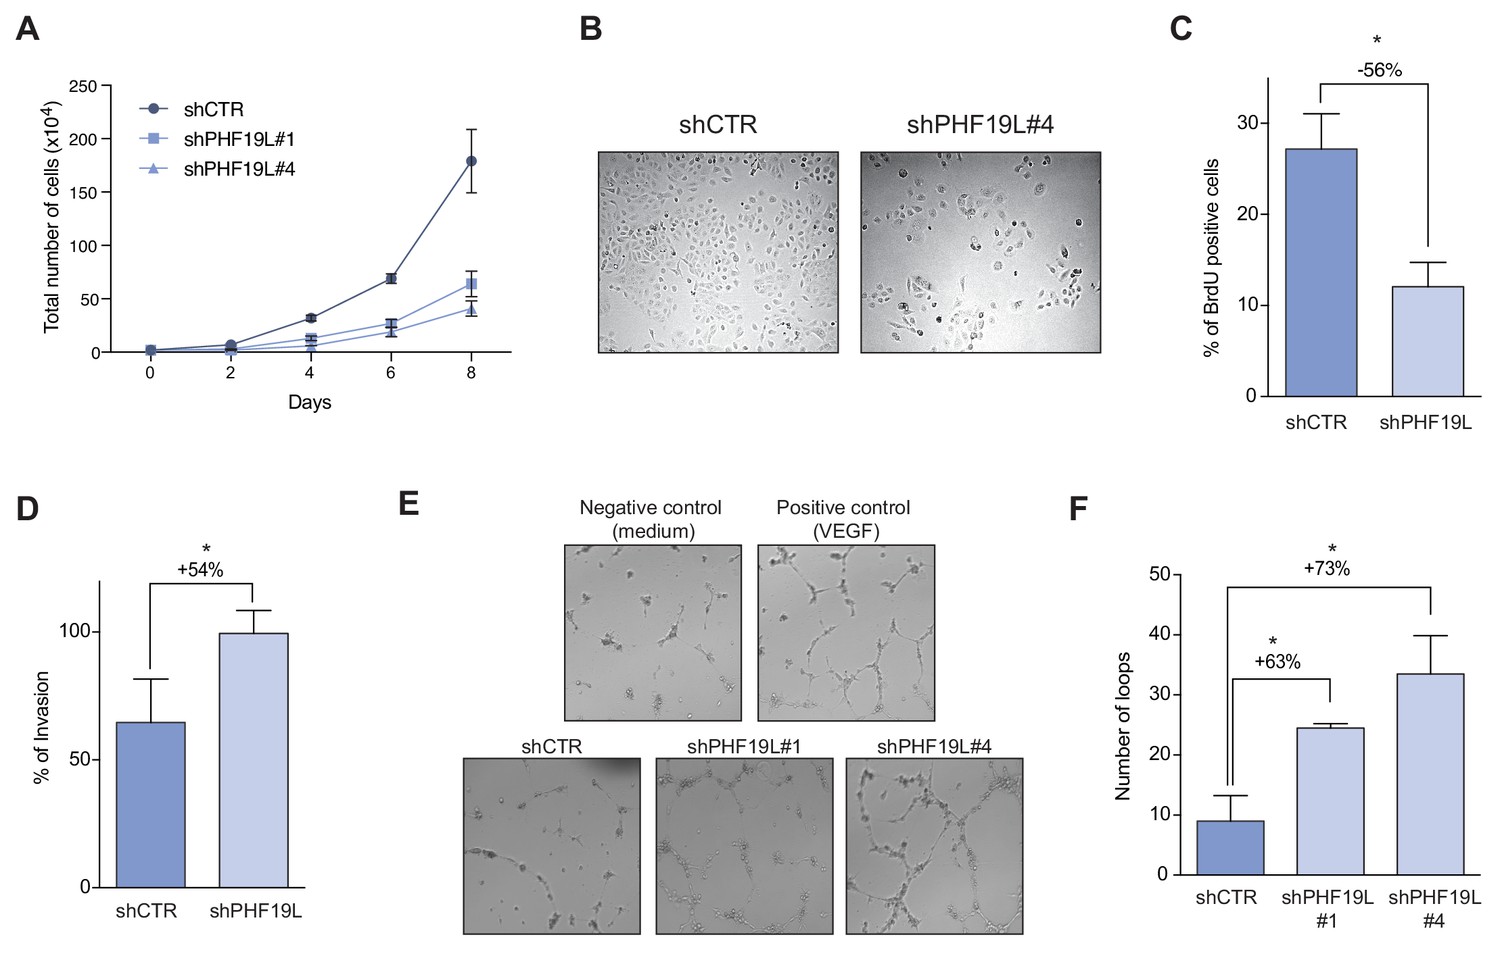
Depletion of PHF19L switches the cells to a less proliferative but more aggressive phenotype.
(A) Growth curve comparing cell growth of control and PHF19L knockdown (shPHF19L#1 or shPHF19L#4) DU145 cells. Data are presented as mean ± SD of three biological replicates. (B) Phase contrast microscope images of DU145 cells in culture showing decrease in cell growth after PHF19L depletion. (C) Effect of PHF19L depletion (shPHF19L#4) on BrdU incorporation in DU145 cells. Data are presented as mean ± SD of three biological replicates. Significance was analyzed using Student’s t-test. P value was ≤ 0.05 (*). (D) Transwell invasion assay in control and PHF19L-depleted (shPHF19L#4) DU145 cells. Graph shows the percentage of invasion (mean ± SD) from two biological replicates. Significance was analyzed through Student’s t test. P value ≤ 0.05 (*). (E,F) Tube formation assays were performed by treating HUVECs with conditioned media from control (shCTR) or PHF19L-depleted (shPHF19L#1 or #4) DU145 cells. (E) Representative images showing increased tube formation in the PHF19L-knockdown as compared to control DU145 cells. VEGF (50 ng/ml) and unconditioned medium were used as positive and negative controls, respectively. (F) Quantification of the number of loops in each condition. Bars represent the mean ± SD from two biological replicates. Significance was analyzed using Student’s t-test. P value was ≤ 0.05 (*).
Figure 6—figure supplement 1
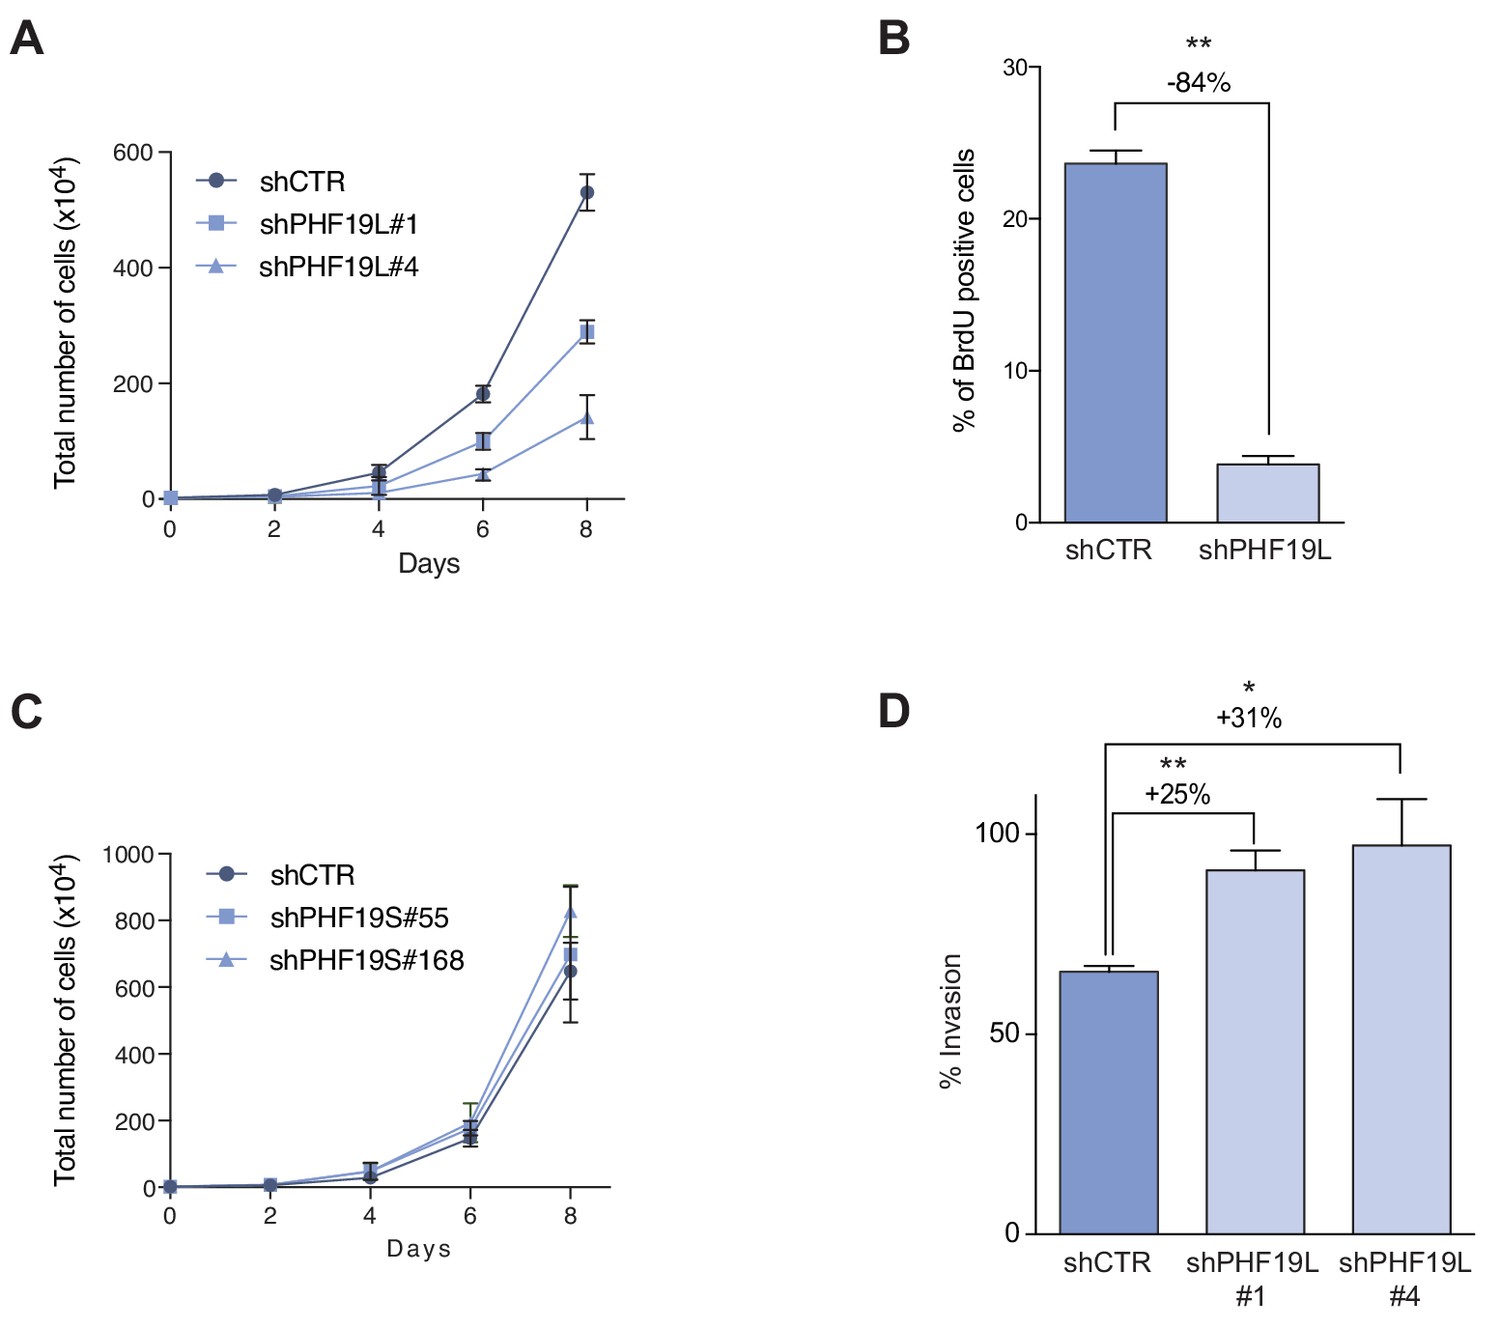
PHF19L depletion switches prostate cancer cells to a less proliferative but more aggressive phenotype.
(A) Growth curve comparing cell growth of control and PHF19L-knockdown PC3 cells. Error bars represent SD of three independent experiments. (B) Effect of PHF19L depletion (shPHF19L#4) on BrdU incorporation in PC3 cells. Data represent mean ± SD from three biological replicates. Significance was analyzed through Student’s t-test. P value was ≤ 0.0005 (*). (C) Growth curve showing no changes in cell growth after PHF19S knockdown in PC3 cells. Data represent mean ± SD from three biological replicates. (D) Transwell invasion assay in control and PHF19L-depleted PC3 cells. Graph shows percentage of invasion (mean ± SD) from three biological replicates. Significance was analyzed through Student’s t test. P value was ≤ 0.05 (*); or ≤0.01 (**).
Tables
Key resources table
| Reagent type (species) or resource | Designation | Source or reference | Identifiers | Additional information |
|---|---|---|---|---|
| Cell line (human) | DU145 | ATCC HTB-81 | RRID:CVCL_0105 | |
| Cell line (human) | PC3 | ATCC CRL-1435 | RRID:CVCL_0035 | |
| Cell line (human) | RWPE1 | ATCC CRL-11609 | RRID:CVCL_3791 | |
| Antibody | PHF19 (rabbit, polyclonal) | Cell Signaling | Cell Signaling #77271; RRID:AB_2799892 | WB (1:1000), ChIP (1:50, 5 µl/chip), IP (1:500, 5 µl/IP) |
| Antibody | EZH2 (rabbit, monoclonal) | Cell Signaling | Cell Signaling #5246; RRID:AB_10694683 | WB (1:1000), ChIP (1:50, 5 µl/chip), IP (1:500, 5 µl/IP) |
| Antibody | SUZ12 (rabbit, monoclonal) | Abcam | Abcam #ab12073; RRID:AB_442939 | ChIP (5 µg/chip) |
| Antibody | H3K27me3 (rabbit, polyclonal) | Millipore | Millipore #07–449; RRID:AB_310624 | ChIP (5 µg/chip) |
| Antibody | MTF2 (rabbit, polyclonal) | Proteintech | Proteintech 16208–1-AP; RRID:AB_2147370 | WB (1:1000), ChIP (5 µg/chip) |
| Antibody | JARID2 (rabbit, polyclonal) | Novus | Novus #NB100-2214; RRID:AB_10000529 | WB (1:1000) |
| Antibody | IgG (rabbit, monoclonal) | Abcam | Abcam #ab172730; RRID:AB_2687931 | ChIP (5 µg/chip) |
| Antibody | EPOP (rabbit polyclonal) | ActiveMotif | Active Motif #61753; RRID:AB_2793758 | WB (1:1000) |
| Antibody | PALI1 (rabbit polyclonal) | Generated in Adrian Bracken's laboratory (Conway et al., 2018) | WB (1:500) | |
| Antibody | Drosophila H2Av | Active Motif | Active Motif #61686; RRID:AB_2737370 | ChIP (1 µg/chip) |
| Antibody | GAPDH (mouse monoclonal) | Santa Cruz Biotechnology | Santa Cruz #sc32233; RRID:AB_627679 | WB (1:5000) |
| Antibody | H3 (rabbit polyclonal) | Abcam | Abcam #ab1791 RRID:AB_302613 | WB (1:2000) |
| Recombinant DNA reagent | Plasmid: MISSION pLKO.1-puro Empty Vector Control | Addgene | Addgene: SHC001 | |
| Recombinant DNA reagent | Plasmid: Plko.1-Puro_ shPHF19L#1 | This study | See Supplementary file 3 | |
| Recombinant DNA reagent | Plasmid: Plko.1-Puro_ shPHF19L#4 | This study | See Supplementary file 3 | |
| Recombinant DNA reagent | Plasmid: Plko.1-Puro_ shPHF19L#B | This study | See Supplementary file 3 | |
| Recombinant DNA reagent | Plasmid: Plko.1-Puro_ shPHF19L#168 | This study | See Supplementary file 3 | |
| Recombinant DNA reagent | Plasmid: Plko.1-Puro_ shPHF19L#55 | This study | See Supplementary file 3 | |
| Sequence-based reagent | RT-qPCR primers | This study | See Supplementary file 3 | |
| Sequence-based reagent | ChIP-qPCR primers | This study | See Supplementary file 3 | |
| Commercial assay or kit | ChIP-IT High Sensitivity Kit | Active Motif | Active Motif #53040 | |
| Commercial assay or kit | QIAquick PCR purification kit | Qiagen | Qiagen #28106 | |
| Commercial assay or kit | RNeasy Plus Mini Kit | Qiagen | Qiagen #74134 | |
| Commercial assay or kit | APC BrdU Flow Kit | BD Pharmingen | BD #552598 | |
| Software, algorithm | Bowtie | PMID:19261174 | RRID:SCR_005476 | |
| Software, algorithm | MACS | PMID:18798982 | RRID:SCR_013291 | |
| Software, algorithm | DiffBind | PMID:22217937 | RRID:SCR_012918 | |
| Software, algorithm | R software | R Development Core Team, 2019 | RRID:SCR_001905 | |
| Software, algorithm | UCSC genome browser | PMID:29106570 | RRID:SCR_005780 | |
| Software, algorithm | Enrichr | PMID:27141961 | RRID:SCR_001575 | |
| Software, algorithm | TopHat | PMID:19289445 | RRID:SCR_013035 | |
| Software, algorithm | Cufflinks | PMID:22383036 | RRID:SCR_014597 | |
| Software, algorithm | SeqCode | http://ldicrocelab.crg.eu/ | RRID:SCR_018070 | Applications to generate ChIP-seq meta-plots, heat maps and boxplots of counts |
Additional files
-
Supplementary file 1
Summary table of ChIP-seq data for all ChIPs performed in this study: ChIP-seq peaks and target genes.
- https://cdn.elifesciences.org/articles/51373/elife-51373-supp1-v1.xlsx
-
Supplementary file 2
Summary table of RNAseq data: Lists of upregulated and downregulated genes detected in PHF19L knockdown as compared to control DU145 cells.
- https://cdn.elifesciences.org/articles/51373/elife-51373-supp2-v1.xlsx
-
Supplementary file 3
Lists of primers for RT-qPCR and ChIP-qPCR, shRNA sequences and antibodies used in this study.
- https://cdn.elifesciences.org/articles/51373/elife-51373-supp3-v1.xlsx
-
Transparent reporting form
- https://cdn.elifesciences.org/articles/51373/elife-51373-transrepform-v1.pdf
Download links
A two-part list of links to download the article, or parts of the article, in various formats.
Downloads (link to download the article as PDF)
Open citations (links to open the citations from this article in various online reference manager services)
Cite this article (links to download the citations from this article in formats compatible with various reference manager tools)
PHF19 mediated regulation of proliferation and invasiveness in prostate cancer cells
eLife 9:e51373.
https://doi.org/10.7554/eLife.51373


