Proteome profile of peripheral myelin in healthy mice and in a neuropathy model
- Department of Neurogenetics, Max Planck Institute of Experimental Medicine, Germany
- Proteomics Group, Max Planck Institute of Experimental Medicine, Germany
- Department of Psychiatry and Psychotherapy, University Hospital, LMU Munich, Germany
- Centre for Discovery Brain Sciences, University of Edinburgh, United Kingdom
- Institute of Anatomy, University of Leipzig, Germany
- Department of Clinical Neurophysiology, University Medical Center, Germany
Figures
Figure 1 with 1 supplement
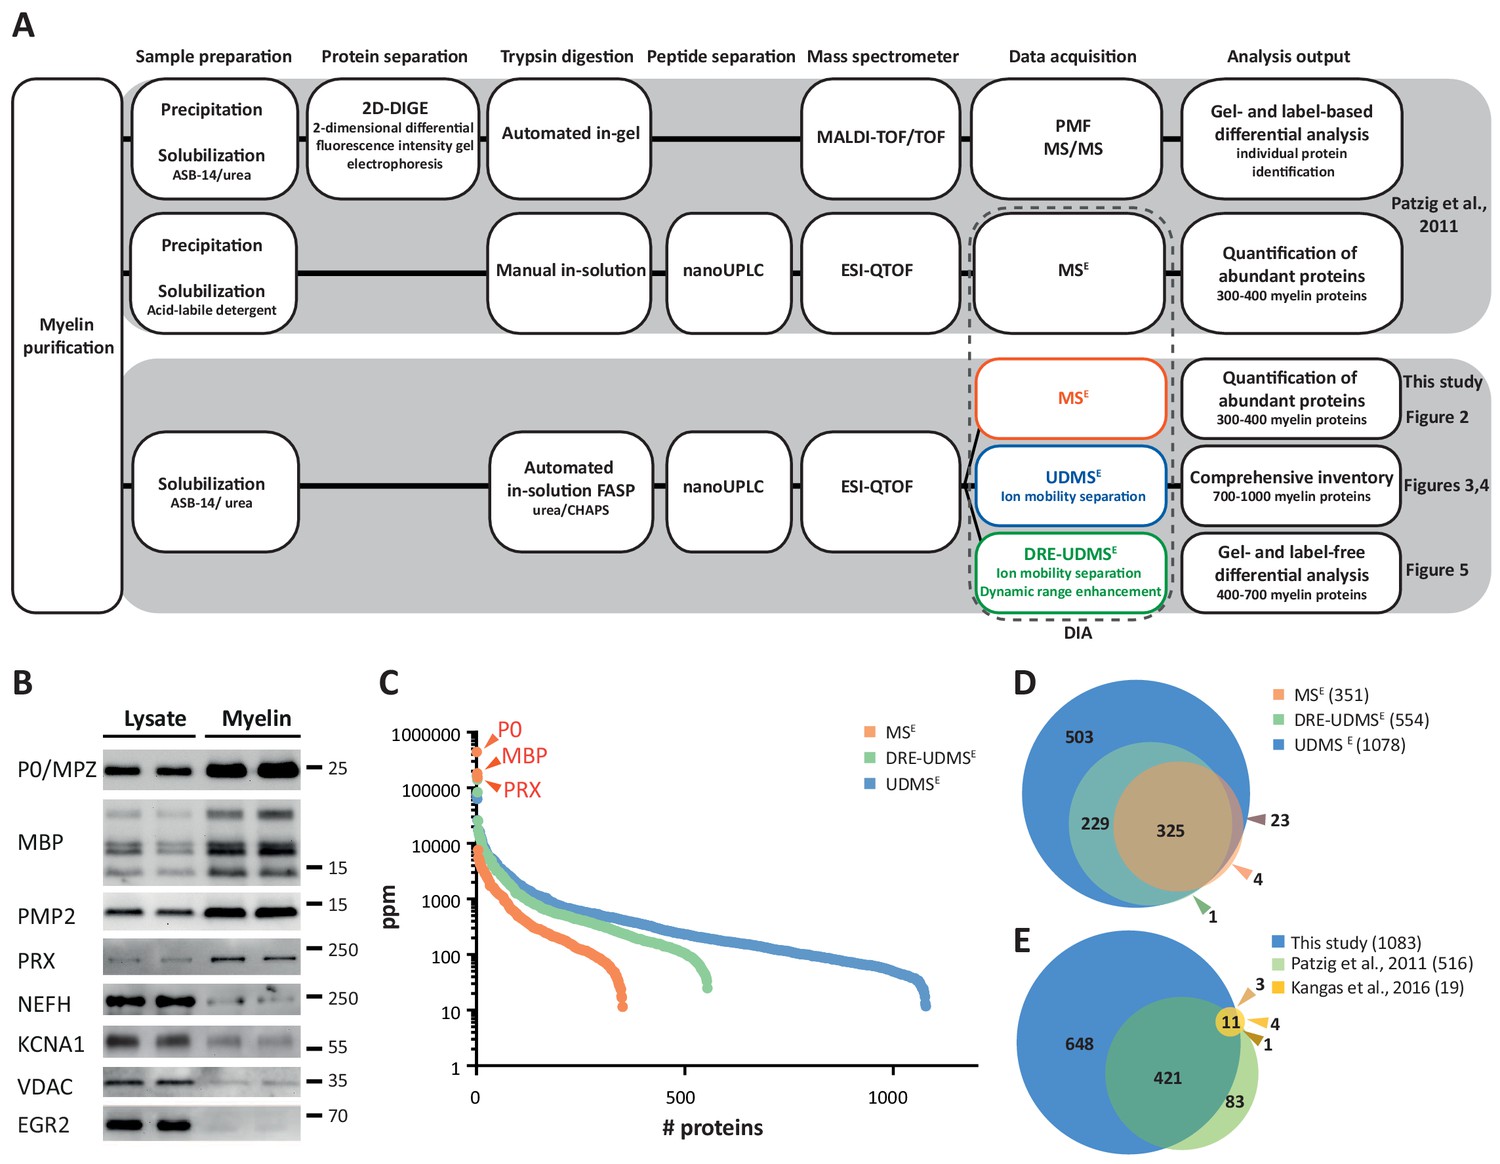
Proteome analysis of peripheral myelin.
(A) Schematic illustration of a previous approach to the peripheral myelin proteome (Patzig et al., 2011) compared with the present workflow. Note that the current workflow allows largely automated sample processing and omits labor-intense 2-dimensional differential gel-electrophoresis, thereby considerably reducing hands-on time. Nano LC-MS analysis by data-independent acquisition (DIA) using three different data acquisition modes provides efficient identification and quantification of abundant myelin proteins (MSE; see Figure 2), a comprehensive inventory (UDMSE; see Figures 3–4) and gel-free differential analysis of hundreds of distinct proteins (DRE-UDMSE; see Figure 5). Samples were analyzed in three biological replicates. (B) Immunoblot of myelin biochemically enriched from sciatic nerves of wild-type mice at postnatal day 21 (P21). Equal amounts of corresponding nerve lysate were loaded to compare the abundance of marker proteins for compact myelin (MPZ/P0, MBP, PMP2), non-compact myelin (PRX), the Schwann cell nucleus (KROX20/EGR2), axons (NEFH, KCNA1) and mitochondria (VDAC). Blots show n = 2 biological replicates representative of n = 3 biological replicates. Note that myelin markers are enriched in purified myelin; other cellular markers are reduced. (C) Number and relative abundance of proteins identified in myelin purified from the sciatic nerves of wild-type mice using three different data acquisition modes (MSE, UDMSE, DRE-UDMSE). Note that MSE (orange) provides the best information about the relative abundance of high-abundant myelin proteins (dynamic range of more than four orders of magnitude) but identifies comparatively fewer proteins in purified myelin. UDMSE (blue) identifies the largest number of proteins but provides only a lower dynamic range of about three orders of magnitude. DRE-UDMSE (green) identifies an intermediate number of proteins with an intermediate dynamic range of about four orders of magnitude. Note that MSE with very high dynamic range is required for the quantification of the exceptionally abundant myelin protein zero (MPZ/P0), myelin basic protein (MBP) and periaxin (PRX). ppm, parts per million. (D) Venn diagram comparing the number of proteins identified in PNS myelin by MSE, UDMSE and DRE-UDMSE. Note the high overlap of identified proteins. (E) Venn diagram of the proteins identified in PNS myelin by UDMSE in this study compared with those identified in two previous approaches (Patzig et al., 2011; Kangas et al., 2016).
-
Figure 1—source data 1
Label-free quantification of proteins in wild-type PNS myelin fractions by three different data acquisition modes Identification and quantification data of detected myelin-associated proteins.
Tryptic peptides derived from four technical replicates (replicate digestion and replicate injection) per three biological replicate (20 sciatic nerves pooled from 10 animals) were analyzed by LC-MS (12 runs in total). Proteins (FDR < 1%; 2 peptides/protein) and peptides (FDR < 1%;≥7 amino acids) were identified by database search against the UniprotKB/SwissProt mouse database using PLGS. Data were post-processed with the software package ISOQuant to calculate absolute in-sample amounts for each detected protein based on the TOP3 approach. Reported abundance values are defined as the relative amount of each protein in respect to the sum over all detected proteins (ppm: parts per million (w/w) of total protein). Typical contaminant proteins like keratins were filtered. → sheet 1: protein identification details → sheet 2: WT myelin proteome by MSE → sheet 3: WT myelin proteome by UD-MSE → sheet 4: WT myelin proteome by DRE UD-MSE → sheet 5: 45 proteins additionally identified in WT myelin by 1D-gel-LC-MS.
- https://cdn.elifesciences.org/articles/51406/elife-51406-fig1-data1-v1.xlsx
Figure 1—figure supplement 1
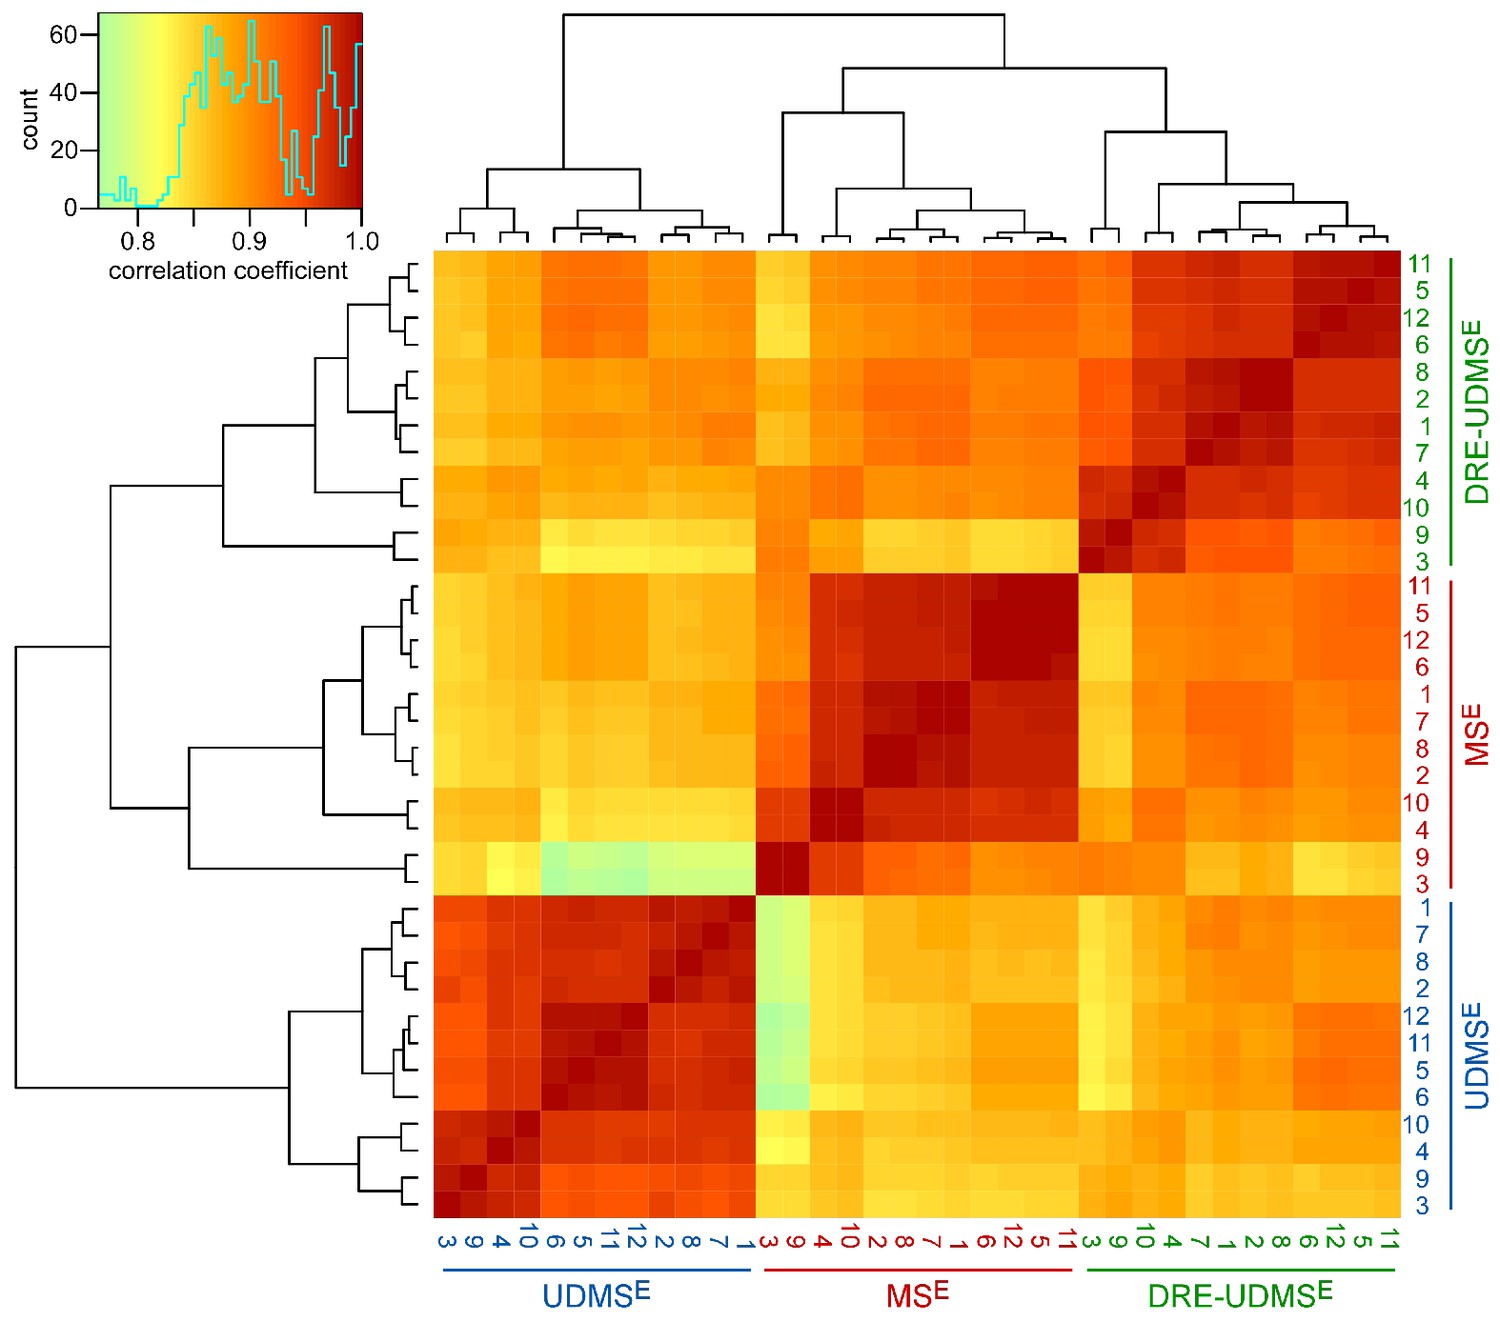
Clustered heatmap of Pearson’s correlation coefficients for protein abundance comparing data acquisition modes.
The heatmap compares the log2 transformed ppm protein abundance values to assess peripheral myelin purified from wild type mice using three data acquisition modes (MSE, UDMSE, DRE-UDMSE). The inset shows the color key and the histogram for the values of the correlation coefficients. Note that the runs cluster with a high overall correlation (>0.75) into three conditions defined by the acquisition mode, in agreement with the experimental design. Among the samples analyzed by different acquisition modes, DRE-UDMSE similarly correlates with both MSE and UDMSE, reflecting its intermediate nature.
Figure 2
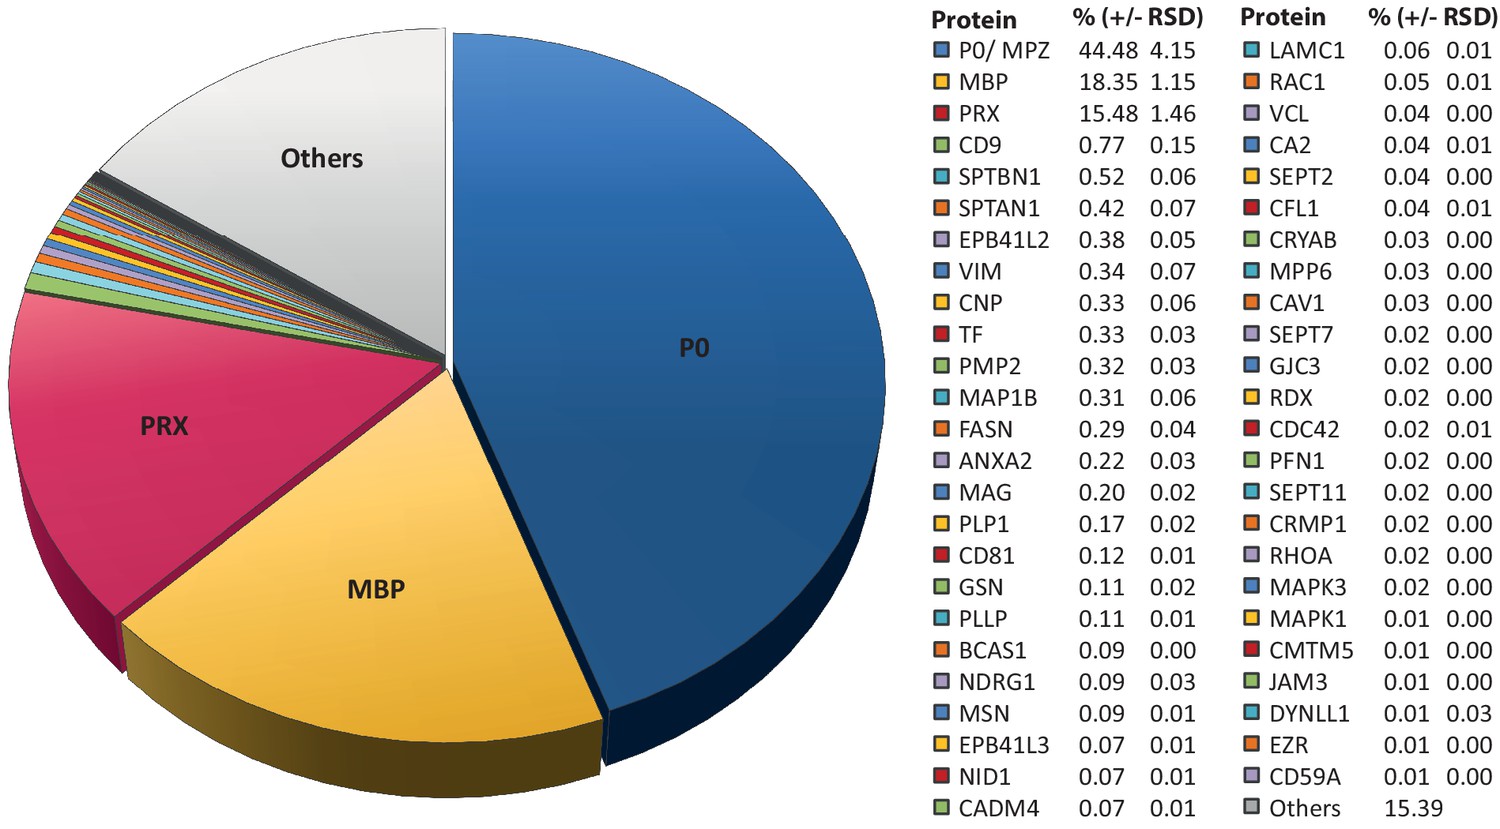
Relative abundance of peripheral myelin proteins.
MSE was used to identify and quantify proteins in myelin purified from the sciatic nerves of wild-type mice at P21; their relative abundance is given as percent with relative standard deviation (% +/- RSD). Note that known myelin proteins constitute >80% of the total myelin protein; proteins not previously associated with myelin constitute <20%. Mass spectrometric quantification based on 3 biological replicates per genotype with 4 technical replicates each (see Figure 1—source data 1).
Figure 3
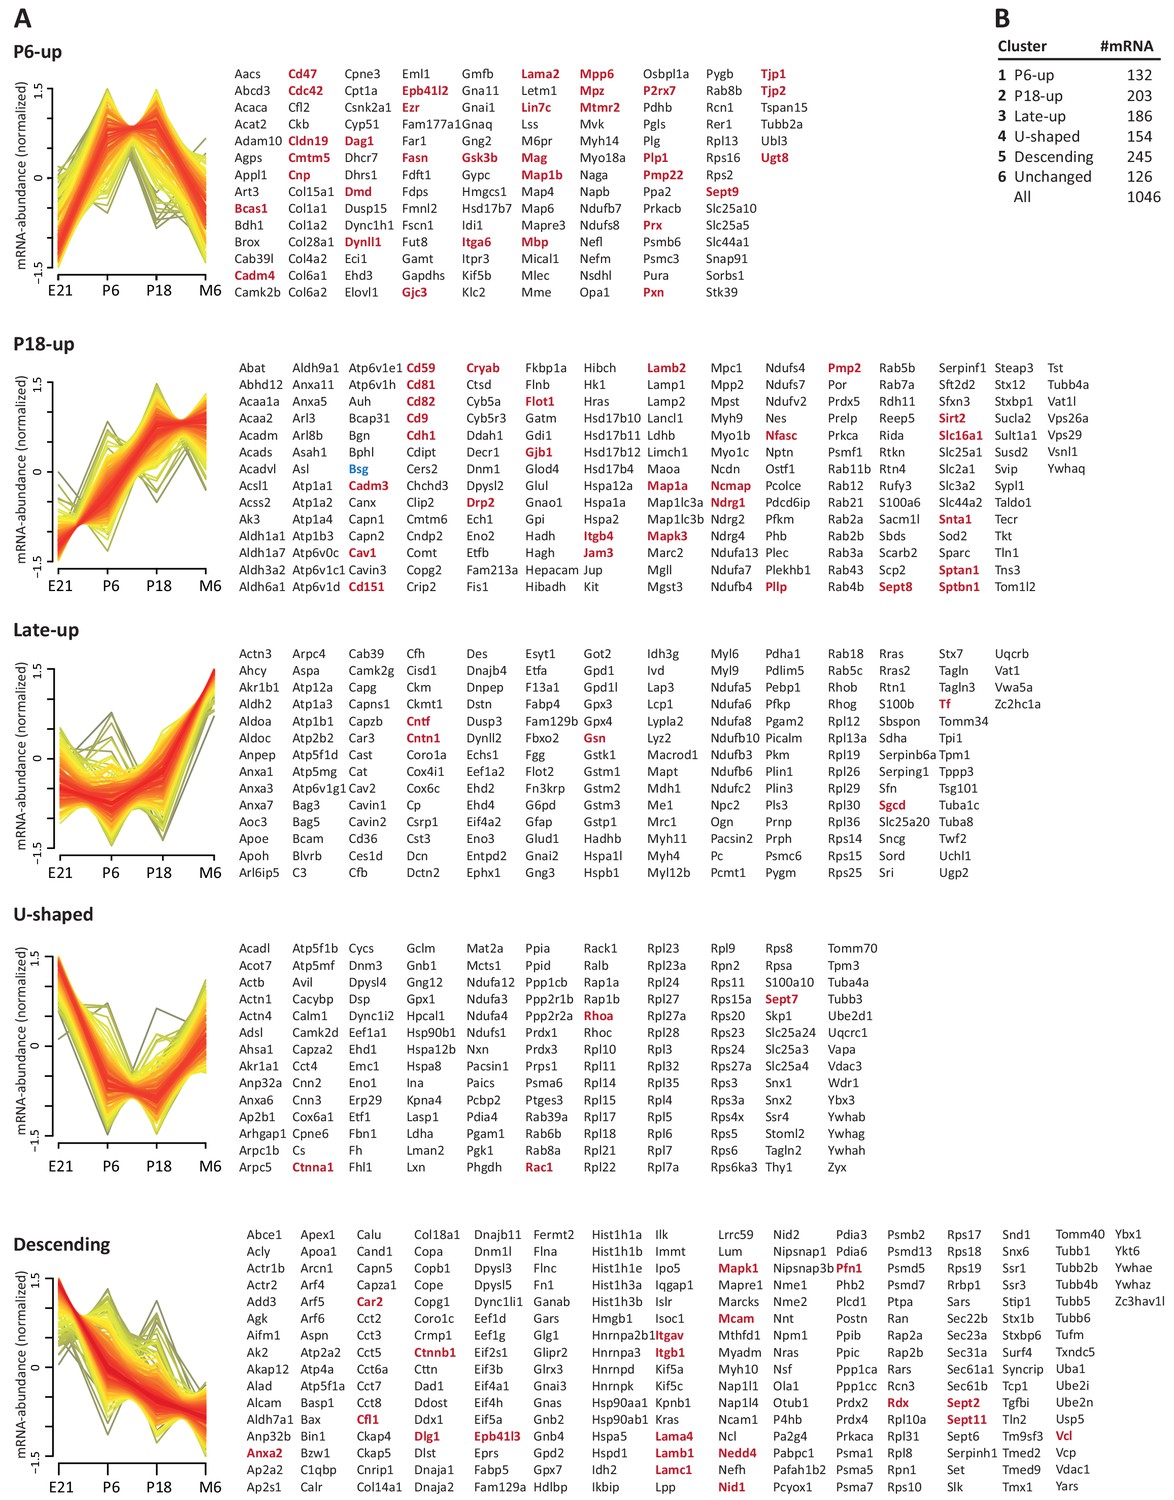
Developmental mRNA abundance profiles of myelin-associated genes.
(A) K-means clustering was performed for the mRNA profiles of those 1046 proteins in our myelin proteome inventory for which significant mRNA expression was found by RNA-Seq in the sciatic nerve of rats dissected at ages E21, P6, P18 and 6 months (M6). Note that this filtering strategy allows to selectively display the developmental abundance profiles of those transcripts that encode myelin-associated proteins rather than of all transcripts present in the nerve. Standardized mRNA abundance profiles are shown (n = 4 biological replicates per age). Known myelin genes are displayed in red. For comparison, Pmp22 mRNA was included although the small tetraspan protein PMP22 was not mass spectrometrically identified due to its unfavorable distribution of tryptic cleavage sites. Normalized counts for all mRNAs including those displaying developmentally unchanged abundance are provided in Figure 3—source data 1. (B) Numbers of mRNAs per cluster.
-
Figure 3—source data 1
Normalized developmental mRNA abundance data → sheet 1: normalized values for all individual 4 biological replicates per age → sheet 2: normalized values for biological replicates averaged to give mean per age.
- https://cdn.elifesciences.org/articles/51406/elife-51406-fig3-data1-v1.xlsx
Figure 4

Categorization of annotated protein functions.
All proteins identified in peripheral myelin by UDMSE (turquoise) and the respective developmental expression clusters (Figure 3; shades of red) were analyzed for overrepresented functional annotations using gene ontology (GO) terms. The graph displays the percentage of proteins in each cluster that were annotated with a particular function. For comparison, known myelin proteins were annotated. n.o., not over-represented.
Figure 5 with 1 supplement
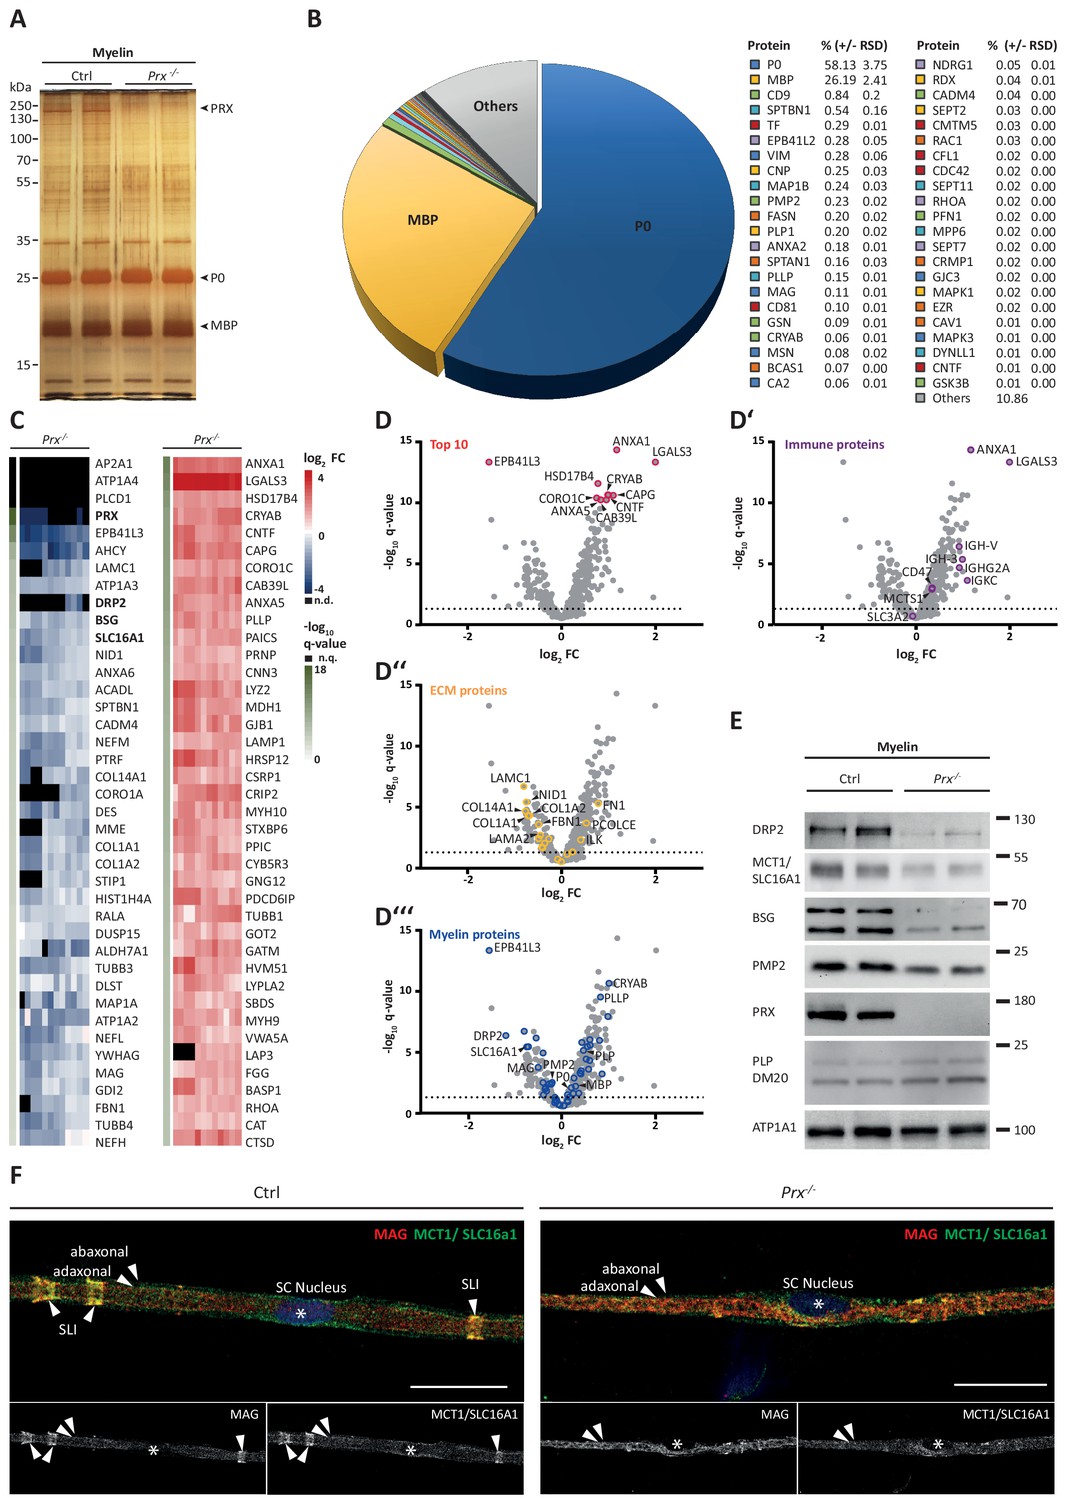
Molecular analysis of myelin in the Prx-/- mouse model of CMT4F.
(A) Myelin purified from sciatic nerves dissected from Prx-/- and control mice at P21 was separated by SDS-PAGE (0.5 µg protein load) and proteins were visualized by silver staining. Bands constituted by the most abundant myelin proteins (MPZ/P0, MBP, PRX) are annotated. Note that no band constituted by PRX was detected in Prx-/- myelin and that several other bands also display genotype-dependent differences in intensity. Gel shows n = 2 biological replicates representative of n = 3 biological replicates. (B) The relative abundance of proteins in myelin purified from Prx-/- sciatic nerves as quantified by MSE is given as percent with relative standard deviation (% +/- RSD). Note the increased relative abundance of MPZ/P0 and MBP compared to wild-type myelin (see Figure 2) when PRX is lacking. Mass spectrometric quantification based on 3 biological replicates with 4 technical replicates each (see Figure 5—source data 1). (C,D) Differential proteome analysis by DRE-UDMSE of myelin purified from Prx-/- and wild-type mice. Mass spectrometric quantification based on 3 biological replicates per genotype with 4 technical replicates each (see Figure 5—source data 2). (C) Top 40 proteins of which the abundance is reduced (blue) or increased (red) in peripheral myelin purified from Prx-/- compared to wild-type mice with the highest level of significance according to the -log10 transformed q-value (green). In the heatmaps, each horizontal line corresponds to the fold-change (FC) of a distinct protein compared to its average abundance in wild-type myelin plotted on a log2 color scale. Heatmaps display 12 replicates, that is 3 biological replicates per genotype with 4 technical replicates each. (D-D‘‘‘) Volcano plots representing genotype-dependent quantitative myelin proteome analysis. Data points represent quantified proteins in Prx-/- compared to wild-type myelin and are plotted as the log2-transformed fold-change (FC) on the x-axis against the -log10-transformed q-value on the y-axis. Stippled lines mark a -log10-transformed q-value of 1.301, reflecting a q-value of 0.05 as significance threshold. Highlighted are the datapoints representing the Top 10 proteins displaying highest zdist values (Euclidean distance between the two points (0,0) and (x,y) with x = log2(FC) and y = -log10(q-value) (red circles in D), immune-related proteins (purple circles in D‘), proteins of the extracellular matrix (ECM; yellow circles in D‘‘) and known myelin proteins (blue circles in D‘‘‘). n.d., not detected; n.q., no q-value computable due to protein identification in one genotype only. Also see Figure 5—figure supplement 1. (E) Immunoblot of myelin purified from Prx-/- and control sciatic nerves confirms the reduced abundance of DRP2, SLC16A1/MCT1, BSG and PMP2 in Prx-/- myelin, as found by differential DRE-UDMSE analysis (in C,D). PRX was detected as genotype control; PLP/DM20 and ATP1A1 serve as markers. Blot shows n = 2 biological replicates per genotype. (F) Teased fiber preparations of sciatic nerves dissected from Prx-/- and control mice immunolabelled for MAG (red) and SLC16A1 (green). Note that SLC16A1 co-distributes with MAG in Schmidt-Lanterman incisures (SLI) in control but not in Prx-/- nerves, in accordance with the reduced abundance of SLC16A1 in Prx-/- myelin (C–E). Also note that, in Prx-/- myelin, SLI were largely undetectable by MAG immunolabeling.
-
Figure 5—source data 1
Label-free quantification of proteins in PNS myelin fractions from Prx-/- mice by MSE Identification and quantification data of detected myelin-associated proteins.
Tryptic peptides derived from four technical replicates (replicate digestion and replicate injection) per three biological replicate (20 sciatic nerves pooled from 10 animals) were analyzed by LC-MS (12 runs in total). Proteins (FDR < 1%; 2 peptides/protein) and peptides (FDR < 1%;≥7 amino acids) were identified by database search against the UniprotKB/SwissProt mouse database using PLGS. Data were post-processed with the software package ISOQuant to calculate absolute in-sample amounts for each detected protein based on the TOP3 approach. Reported abundance values are defined as the relative amount of each protein in respect to the sum over all detected proteins (ppm: parts per million (w/w) of total protein). Typical contaminant proteins like keratins were filtered. → sheet 1: protein identification details → sheet 2: Prx-/- myelin proteome by MSE.
- https://cdn.elifesciences.org/articles/51406/elife-51406-fig5-data1-v1.xlsx
-
Figure 5—source data 2
Label-free quantification of proteins in PNS myelin fractions from WT and Prx-/- mice by DRE-UDMSE Identification and quantification data of detected myelin-associated proteins by DRE-UDMSE.
For each genotype, tryptic peptides derived from four technical replicates (replicate digestion and replicate injection) per three biological replicate (20 sciatic nerves pooled from 10 animals) were analyzed by LC-MS (24 runs in total). Proteins (FDR < 1%; 2 peptides/protein) and peptides (FDR < 1%;≥7 amino acids) were identified by database search against the UniprotKB/SwissProt mouse database using PLGS. Data were post-processed with the software package ISOQuant to calculate absolute in-sample amounts for each detected protein based on the TOP3 approach. Reported abundance values are defined as the relative amount of each protein in respect to the sum over all detected proteins (ppm: parts per million (w/w) of total protein). Typical contaminant proteins like keratins were filtered. The -log10-transformed q-value was plotted against the log2-transformed fold change to obtain the volcano plot shown in Figure 5D. As no imputation of missing values was performed, proteins exclusive for only one of the conditions do not appear in the volcano plot, but are appended at the end of the list. Criteria for statistically significant regulation were as follows: fold change of at least 1.5 and q-value below 0.05. → sheet 1: protein identification details → sheet 2: comparison of WT vs. Prx-/- myelin proteome by DRE-UDMSE.
- https://cdn.elifesciences.org/articles/51406/elife-51406-fig5-data2-v1.xlsx
Figure 5—figure supplement 1
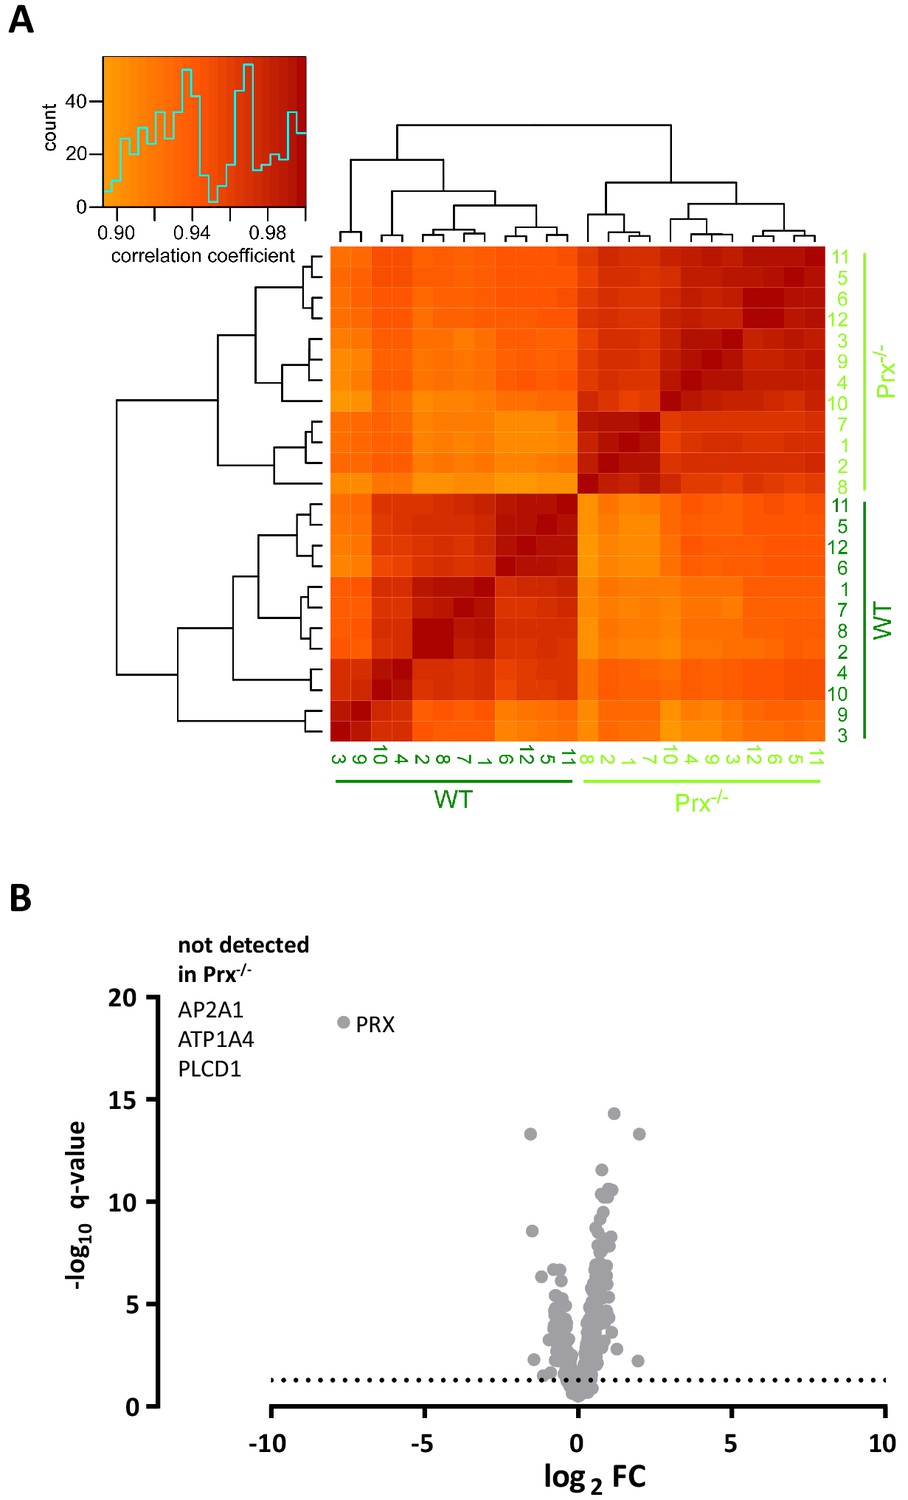
Clustered heatmap of Pearson’s correlation coefficients for protein abundance comparing genotypes.
(A) The heatmap compares the log2 transformed ppm protein abundance values from the DRE-UDMSE runs to assess peripheral myelin purified from wild type and Prx-/- mice. The inset shows the color key and the histogram for the values of the correlation coefficients. Note that the runs cluster with a high overall correlation (>0.85) into two conditions defined by the genotype, in agreement with the experimental design. (B) Volcano plot representing genotype-dependent quantitative myelin proteome analysis. Data points represent quantified proteins in Prx-/- compared to wild-type myelin plotted as the log2-transformed fold-change (FC) on the x-axis against the -log10-transformed q-value on the y-axis. Note the different axis scale compared to Figure 5D. Stippled line marks a -log10-transformed q-value of 1.301, reflecting a q-value of 0.05 as significance threshold. Highlighted is the datapoint for PRX to illustrate that only trace amounts of PRX were detected when assessing Prx-/- myelin. ATP2A1, ATP1A4 and PLCD1 were not detected in Prx-/- myelin.
Figure 6
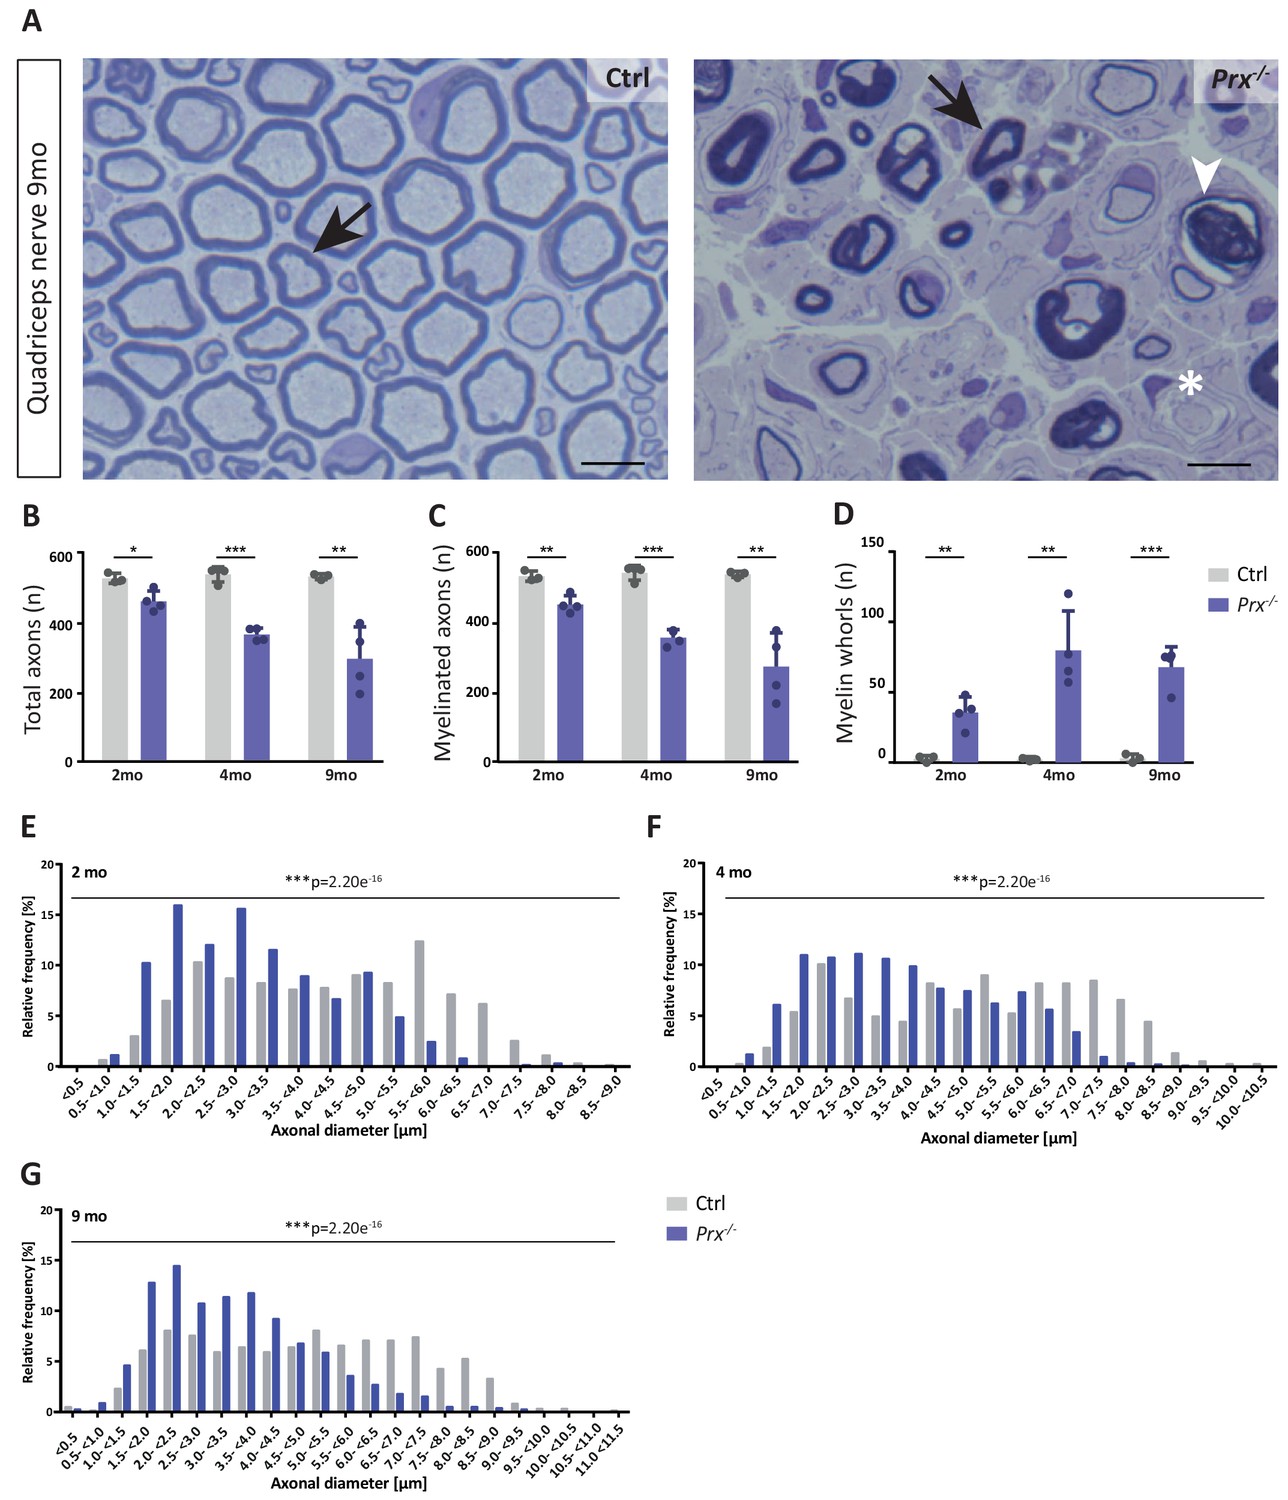
Progressive loss and reduced diameters of peripheral axons in Prx-/- mice.
(A–D) Genotype-dependent quantitative assessment of light micrographs of toluidine-stained semi-thin sectioned quadriceps nerves dissected at 2, 4 and 9 months of age reveals progressive loss of peripheral axons in Prx-/- compared to control mice. (A) Representative micrographs. Arrows point at myelinated axons; asterisk denotes an unmyelinated axon; arrowhead points at a myelin whorl lacking a recognizable axon. Scale bars, 10 µm. (B) Total number of axons per nerve that are not associated with a Remak bundle. (C) Total number of myelinated axons per nerve. (D) Total number per nerve of myelin whorls that lack a recognizable axon. Mean +/SD, n = 3–4 mice per genotype and age; *p<0.05, **p<0.01, ***p<0.001 by Student’s unpaired t-test. (E–G) Genotype-dependent assessment of myelinated axons shows a shift toward reduced axonal diameters in quadriceps nerves of Prx-/- compared to control mice at 2 months (E), 4 months (F) and 9 months (G) of age. Data are presented as frequency distribution with 0.5 µm bin width. ***, p<0.001 by two-sided Kolmogorow-Smirnow test. For precise p-values see methods section.
Author response image 1

Quantification of immunoblots in Figure 1B and Figure 5E.
Tables
Table 1
Known myelin proteins in the myelin proteome.
Proteins mass-spectrometrically identified in peripheral myelin are compiled according to availability of prior references as myelin proteins. Given are the official gene name, one selected reference, the number of transmembrane domains (TMD) and the mRNA abundance profile cluster (see Figure 3).
| Protein name | Gene | Reference | TMD | Cluster |
|---|---|---|---|---|
| 2-hydroxyacylsphingosine 1-beta-galactosyltransferase | Ugt8 | Bosio et al., 1996 | 2 | P6-up |
| Syntrophin α1 | Snta1 | Fuhrmann-Stroissnigg et al., 2012 | - | P18-up |
| Annexin A2 | Anxa2 | Hayashi et al., 2007 | - | Descending |
| Band 4.1 protein B/4.1B | Epb41l3 | Ivanovic et al., 2012 | - | Descending |
| Band 4.1 protein G/4.1G | Epb41l2 | Ohno et al., 2006 | - | P6-up |
| Breast carcinoma-amplified sequence 1 | Bcas1 | Ishimoto et al., 2017 | - | P6-up |
| Cadherin 1/E-Cadherin | Cdh1 | Fannon et al., 1995 | 1 | P18-up |
| Carbonic anhydrase 2 | Ca2 | Cammer and Tansey, 1987 | - | Descending |
| Catenin α1 | Ctnna1 | Murata et al., 2006 | - | U-shaped |
| Catenin ß1 | Ctnnb1 | Fannon et al., 1995 | - | Descending |
| Caveolin 1 | Cav1 | Mikol et al., 2002 | 1 | P18-up |
| CD9, tetraspanin 29 | Cd9 | Ishibashi et al., 2004 | 4 | P18-p |
| CD59A | Cd59a | Funabashi et al., 1994 | 1 | P18-up |
| CD47, integrin-associated signal transducer | Cd47 | Gitik et al., 2011 | 5 | P6-up |
| CD81, tetraspanin 28 | Cd81 | Ishibashi et al., 2004 | 4 | P18-up |
| CD82, tetraspanin 27 | Cd82 | Chernousov et al., 2013 | 4 | P18-up |
| CD151, tetraspanin 24 | Cd151 | Patzig et al., 2011 | 4 | P18-up |
| Cell adhesion molecule 4/NECL4 | Cadm4 | Spiegel et al., 2007 | 1 | P6-up |
| Cell division control protein 42 | Cdc42 | Benninger et al., 2007 | - | P6-up |
| Cell surface glycoprotein MUC18 | Mcam | Shih et al., 1998 | 1 | Descending |
| Ciliary neurotrophic factor | Cntf | Rende et al., 1992 | - | Late-up |
| CKLF-like MARVEL TMD-containing 5 | Cmtm5 | Patzig et al., 2011 | 4 | P6-up |
| Claudin-19 | Cldn19 | Miyamoto et al., 2005 | 4 | P6-up |
| Cofilin 1 | Cfl1 | Sparrow et al., 2012 | - | Descending |
| Crystallin α2 | Cryab | D'Antonio et al., 2006 | - | P18-up |
| Cyclic nucleotide phosphodiesterase | Cnp | Matthieu et al., 1980 | - | P6-up |
| Sarcoglycan δ | Sgcd | Cai et al., 2007 | 1 | Late-up |
| Dihydropyrimidinase related protein 1 | Crmp1 | D'Antonio et al., 2006 | - | Descending |
| Disks large homolog 1 | Dlg1 | Cotter et al., 2010 | - | Descending |
| Dynein light chain 1 | Dynll1 | Myllykoski et al., 2018 | - | P6-up |
| Dystroglycan | Dag1 | Yamada et al., 1994 | 1 | P6-up |
| Dystrophin/DP116 | Dmd | Cai et al., 2007 | - | P6-up |
| Dystrophin-related protein 2 | Drp2 | Sherman et al., 2001 | - | P18-up |
| E3 ubiquitin-protein ligase NEDD4 | Nedd4 | Liu et al., 2009 | - | Descending |
| Ezrin | Ezr | Scherer et al., 2001 | - | P6-up |
| Fatty acid synthase | Fasn | Salles et al., 2002 | - | P6-up |
| Flotillin 1 | Flot1 | Lee et al., 2014 | - | P18-up |
| Gap junction ß1 protein/Cx32 | Gjb1 | Li et al., 2002 | 4 | P18-up |
| Gap junction γ3 protein/Cx29 | Gjc3 | Li et al., 2002 | 1 | P6-up |
| Gelsolin | Gsn | Gonçalves et al., 2010 | - | Late-up |
| Glycogen synthase kinase 3ß | Gsk3b | Ogata et al., 2004 | - | P6-up |
| Integrin α6 | Itga6 | Nodari et al., 2008 | 1 | P6-up |
| Integrin αV | Itgav | Chernousov and Carey, 2003 | 1 | Descending |
| Integrin ß1 | Itgb1 | Feltri et al., 2002 | 1 | Descending |
| Integrin ß4 | Itgb4 | Quattrini et al., 1996 | 2 | P18-up |
| Junctional adhesion molecule C | Jam3 | Scheiermann et al., 2007 | 1 | P18-up |
| Laminin α2 | Lama2 | Yang et al., 2005 | - | P6-up |
| Laminin α4 | Lama4 | Yang et al., 2005 | - | Descending |
| Laminin ß1 | Lamb1 | LeBeau et al., 1994 | - | Descending |
| Laminin ß2 | Lamb2 | LeBeau et al., 1994 | - | P18-up |
| Laminin γ1 | Lamc1 | Chen and Strickland, 2003 | - | Descending |
| Membrane Palmitoylated Protein 6 | Mpp6 | Saitoh et al., 2019 | - | P6-up |
| Microtubule-associated protein 1A | Map1a | Fuhrmann-Stroissnigg et al., 2012 | - | P18-up |
| Microtubule-associated protein 1B | Map1b | Fuhrmann-Stroissnigg et al., 2012 | - | P6-up |
| Mitogen-activated protein kinase 1/ERK2 | Mapk1 | Mantuano et al., 2015 | - | Descending |
| Mitogen-activated protein kinase 3/ERK1 | Mapk3 | Mantuano et al., 2015 | - | P18-up |
| Moesin | Msn | Scherer et al., 2001 | - | Unchanged |
| Monocarboxylate transporter 1 | Slc16a1 | Domènech-Estévez et al., 2015 | 11 | P18-up |
| Myelin associated glycoprotein | Mag | Figlewicz et al., 1981 | 1 | P6-up |
| Myelin basic protein | Mbp | Boggs, 2006 | - | P6-up |
| Myelin protein 2 | Pmp2 | Trapp et al., 1984 | - | P18-up |
| Myelin protein zero/P0 | Mpz | Giese et al., 1992 | 1 | P6-up |
| Myelin proteolipid protein | Plp1 | Garbern et al., 1997 | 4 | P6-up |
| Myotubularin-related protein 2 | Mtmr2 | Bolino et al., 2004 | - | P6-up |
| Noncompact myelin-associated protein | Ncmap | Ryu et al., 2008 | 1 | P18-up |
| NDRG1, N-myc downstream regulated | Ndrg1 | Berger et al., 2004 | - | P18-uP |
| Neurofascin | Nfasc | Tait et al., 2000 | 2 | P18-up |
| Nidogen 1 | Nid1 | Lee et al., 2007 | - | Descending |
| P2X purinoceptor 7 | P2r×7 | Faroni et al., 2014 | - | P6-up |
| Paxillin | Pxn | Fernandez-Valle et al., 2002 | - | P6-up |
| Periaxin | Prx | Gillespie et al., 1994 | - | P6-up |
| Plasmolipin | Pllp | Bosse et al., 2003 | 4 | P18-up |
| Profilin 1 | Pfn1 | Montani et al., 2014 | - | Descending |
| Lin-7 homolog C | Lin7c | Saitoh et al., 2017 | - | P6-up |
| Rac1 | Rac1 | Benninger et al., 2007 | - | U-Shaped |
| Radixin | Rdx | Scherer et al., 2001 | - | Descending |
| RhoA | Rhoa | Brancolini et al., 1999 | - | U-Shaped |
| Septin 2 | Sept2 | Buser et al., 2009 | - | Descending |
| Septin 7 | Sept7 | Buser et al., 2009 | - | U-Shaped |
| Septin 8 | Sept8 | Patzig et al., 2011 | - | P18-up |
| Septin 9 | Sept9 | Patzig et al., 2011 | - | P6-up |
| Septin 11 | Sept11 | Buser et al., 2009 | - | Descending |
| Sirtuin 2, NAD-dependent deacetylase | Sirt2 | Werner et al., 2007 | - | P18-up |
| Spectrin alpha chain, non-erythrocytic 1 | Sptan1 | Susuki et al., 2018 | - | P18-up |
| Spectrin beta chain, non-erythrocytic 1 | Sptbn1 | Susuki et al., 2018 | - | P18-up |
| Tight junction protein ZO-1 | Tjp1 | Poliak et al., 2002 | - | P6-up |
| Tight junction protein ZO-2 | Tjp2 | Poliak et al., 2002 | - | P6-up |
| Transferrin | Tf | Lin et al., 1990 | 2 | Late-up |
| Vimentin | Vim | Triolo et al., 2012 | - | Unchanged |
| Vinculin | Vcl | Beppu et al., 2015 | - | Descending |
Table 2
Peripheral myelin proteins identified in PNS myelin involved in neuropathological diseases.
Proteins mass-spectrometically identified in peripheral myelin were analyzed regarding the involvement of the ortholog human gene in neuropathological diseases. PMP22 was added, though it was not identified by MS analyses due to its unfavorable distribution of tryptic cleavage sites. CMT, Charcot-Marie-Tooth disease; DHMN, distal hereditary motor neuropathy; DI-CMTC, dominant intermediate CMTC; DFN, X-linked deafness; HMN, hereditary motor neuropathy; HSAN, hereditary sensory and autonomic neuropathy; HNA, hereditary sensory and autonomic neuropathy; OMIM, Online Mendelian Inheritance in Man; PHARC, polyneuropathy, hearing loss, ataxia, retinitis pigmentosa and cataract; SCA, spinocerebellar ataxia; SPG, spastic paraplegia.
| Protein name | Gene name | OMIM# | Gene locus | Neuropathy |
|---|---|---|---|---|
| Monoacylglycerol lipase ABHD12 | ABHD12 | 613599 | 20p11.21 | Pharc |
| Apoptosis-inducing factor 1 | AIFM1 | 300169 | Xq26.1 | CMTX4, DFNX5 |
| Na+/K+ -transporting ATPase α1 | ATP1A1 | 182310 | 1p13.1 | CMT2DD |
| Cytochrome c oxidase subunit 6A1 | COX6A1 | 602072 | 12q24.31 | CMTRID |
| Dystrophin-related protein 2 | DRP2 | 300052 | Xq22.1 | CMTX |
| Dynactin subunit 1 | DCTN1 | 601143 | 2p13.1 | DHMN7B |
| Dynamin 2 | DNM2 | 602378 | 19p13.2 | CMT2M, CMTDIB |
| Cytoplasmic dynein 1 heavy chain 1 | DYNC1H1 | 600112 | 14q32.31 | CMT20, SMALED1 |
| E3 SUMO-protein ligase | EGR2 | 129010 | 10q21.3 | CMT1D, CMT3, CMT4E |
| Glycine-tRNA ligase | GARS (Gart) | 600287 | 7p14.3 | CMT2D, HMN5A |
| Gap junction ß1 protein/Cx32 | GJB1 | 304040 | Xq13.1 | CMTX1 |
| Guanine nucleotide-binding protein ß4 | GNB4 | 610863 | 3q26.33 | CMTDIF |
| Histidine triad nucleotide-binding protein 1 | HINT1 | 601314 | 5q23.3 | NMAN |
| Hexokinase 1 | HK1 | 142600 | 10q22.1 | CMT4G |
| Heat shock protein ß1 | HSPB1 | 602195 | 7q11.23 | CMT2F, DHMN2B |
| Kinesin heavy chain isoform 5A | KIF5A | 602821 | 12q13.3 | SPG10 |
| Prelamin A/C | LMNA | 150330 | 1q22 | CMT2B1 |
| Neprilysin | MME | 120520 | 3q25.2 | CMT2T, SCA43 |
| Myelin protein zero/P0 | MPZ | 159440 | 1q23.3 | CHN2,CMT1B, CMT2I, CMT2J,CMT3, CMTDID, Roussy-Levy syndrome |
| Myotubularin-related protein 2 | MTMR2 | 603557 | 11q21 | CMT4B1 |
| Alpha-N-acetylglucosaminidase | NAGLU (NAGA) | 609701 | 17q21.2 | CMT2V |
| NDRG1, N-myc downstream regulated | NDRG1 | 605262 | 8q24.22 | CMT4D |
| Neurofilament heavy polypeptide | NEFH | 162230 | 22q12.2 | CMT2CC |
| Neurofilament light polypeptide | NEFL | 162280 | 8p21.2 | CMT2E, CMT1F, CMTDIG |
| Peripheral myelin protein 2 | PMP2 | 170715 | 8q21.13 | CMT1G |
| Peripheral myelin protein 22 | PMP22 | 601907 | 17p12 | CMT1A, CMT1E, CMT3, HNPP, Roussy-Levy syndrome |
| Ribose-phosphate pyrophosphokinase 1 | PRPS1 | 311850 | Xq22.3 | Arts syndrome, CMTX5, DFNX1 |
| Periaxin | PRX | 605725 | 19q13.2 | CMT4F, CMT3 |
| Ras-related protein Rab 7a | RAB7A | 602298 | 3q21.3 | CMT2B |
| Septin 9 | SEPT9 | 604061 | 17q25.3 | HNA |
| Transitional ER-ATPase | VCP | 601023 | 9p13.3 | CMT2Y |
| Tryptophan-tRNA ligase, cytoplasmic | WARS | 191050 | 14q32.32 | HMN9 |
| Tyrosine-tRNA ligase, cytoplasmic | YARS | 603623 | 1p35.1 | DI-CMTC |
Additional files
Download links
A two-part list of links to download the article, or parts of the article, in various formats.
Downloads (link to download the article as PDF)
Open citations (links to open the citations from this article in various online reference manager services)
Cite this article (links to download the citations from this article in formats compatible with various reference manager tools)
Proteome profile of peripheral myelin in healthy mice and in a neuropathy model
eLife 9:e51406.
https://doi.org/10.7554/eLife.51406


