Molecular structures of the human Slo1 K+ channel in complex with β4
- The Rockefeller University, Howard Hughes Medical Institute, United States
Figures
Figure 1 with 4 supplements
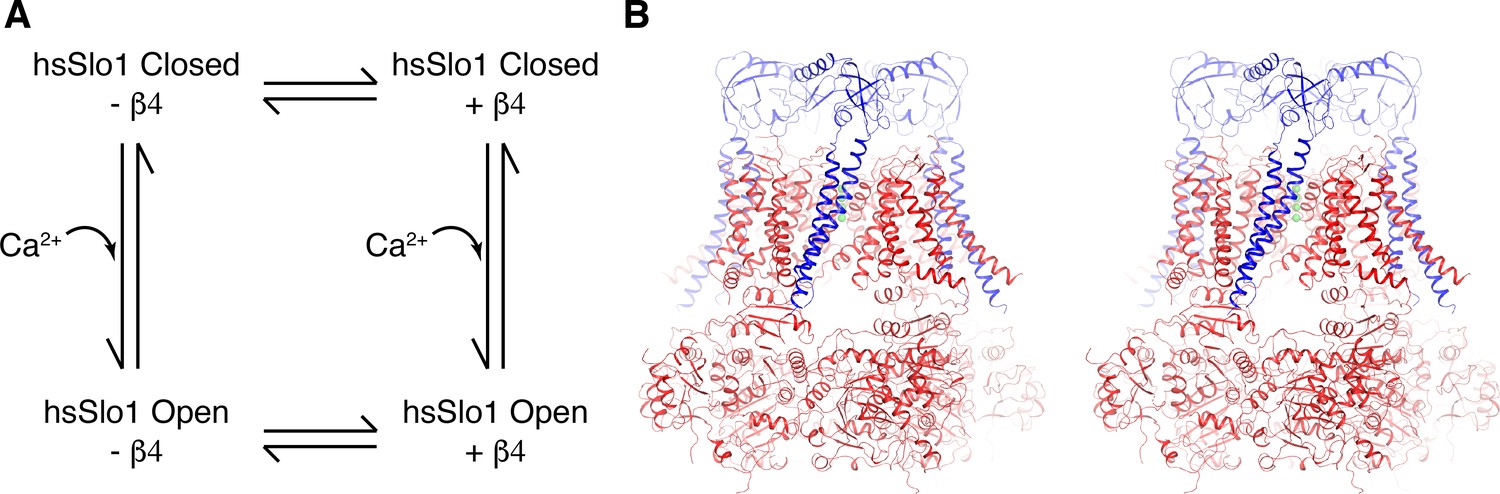
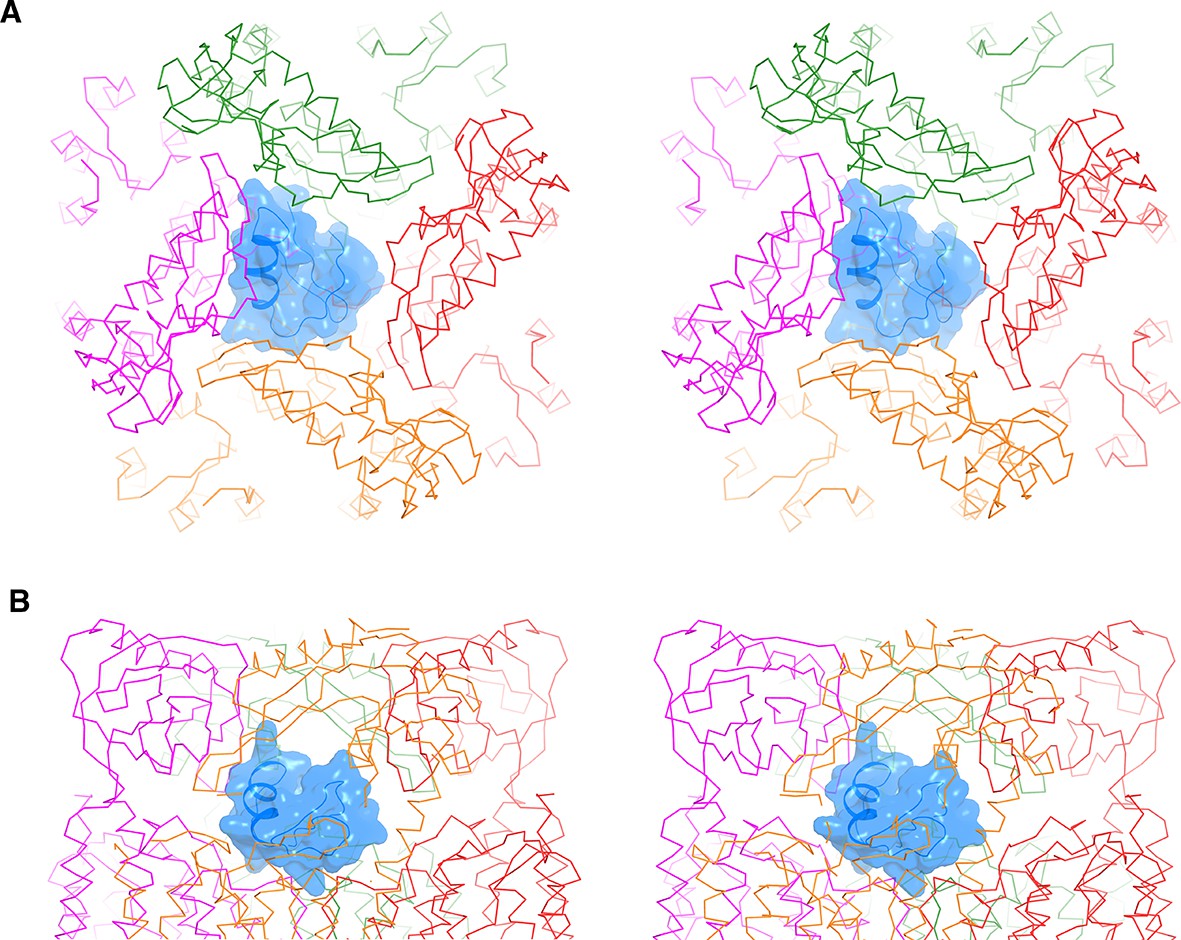
Overall structure of the open human Slo1 channel in complex with the β4 subunit.
(A) Determination of atomic structures of human Slo1 in four various states. (B) Overall structure of the human Slo1-β4 channel complex in the presence of 10 mM Ca2+ in stereo, viewed parallel to the membrane. The Slo1 channel and β4 subunits are shown in ribbon representation, and colored red and blue respectively. Green spheres represent the K+ ions in the selectivity filter.
Figure 1—figure supplement 1
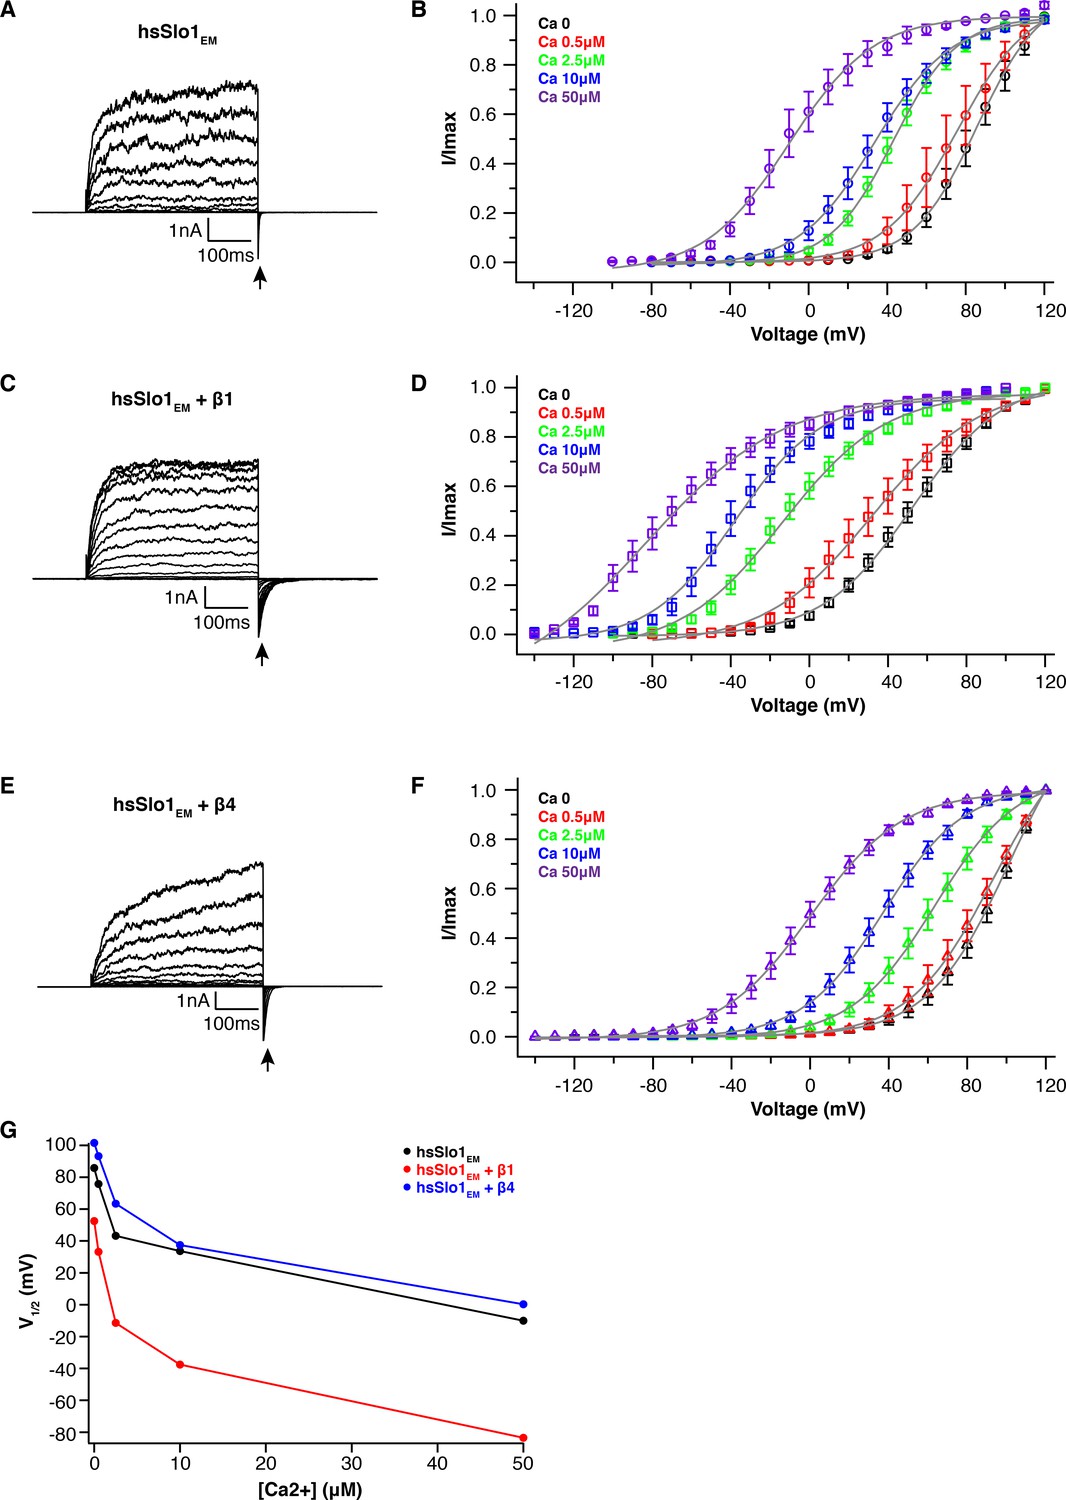
Electrophysiological studies of truncated hsSlo1 alone, co-expressed with β1 or β4 in HEK293T cells.
(A, C, E) Voltage-dependent channel activation of the truncated hsSlo1 (hsSlo1EM) alone (A), co-expressed with the β1 (C) or β4 (E) subunit in the absence of Ca2+. Representative current traces recorded in excised inside-out patch configuration are shown. Voltage protocol: holding potential −80 mV, depolarized from −80 to +120 mV in 10 mV incremental steps, stepping back to −40 mV. Tail currents used to generate activation curves are indicated by an arrow. (B, D, F) Ca2+ titration of the truncated hsSlo1 (hsSlo1EM) alone (B), co-expressed with the β1 (D) or β4 (F) subunit using excised inside-out patch recording. At each Ca2+ concentration, fraction of the maximum tail current at that concentration (n = 7–14; means ± SEM) is plotted against the depolarization voltage and fitted with a two-state Boltzmann function. (G). Plot of half activation voltage (V1/2) from the Boltzmann fitting against [Ca2+] for hsSlo1EM, hsSlo1EM + β1, hsSlo1EM + β4.
Figure 1—figure supplement 2
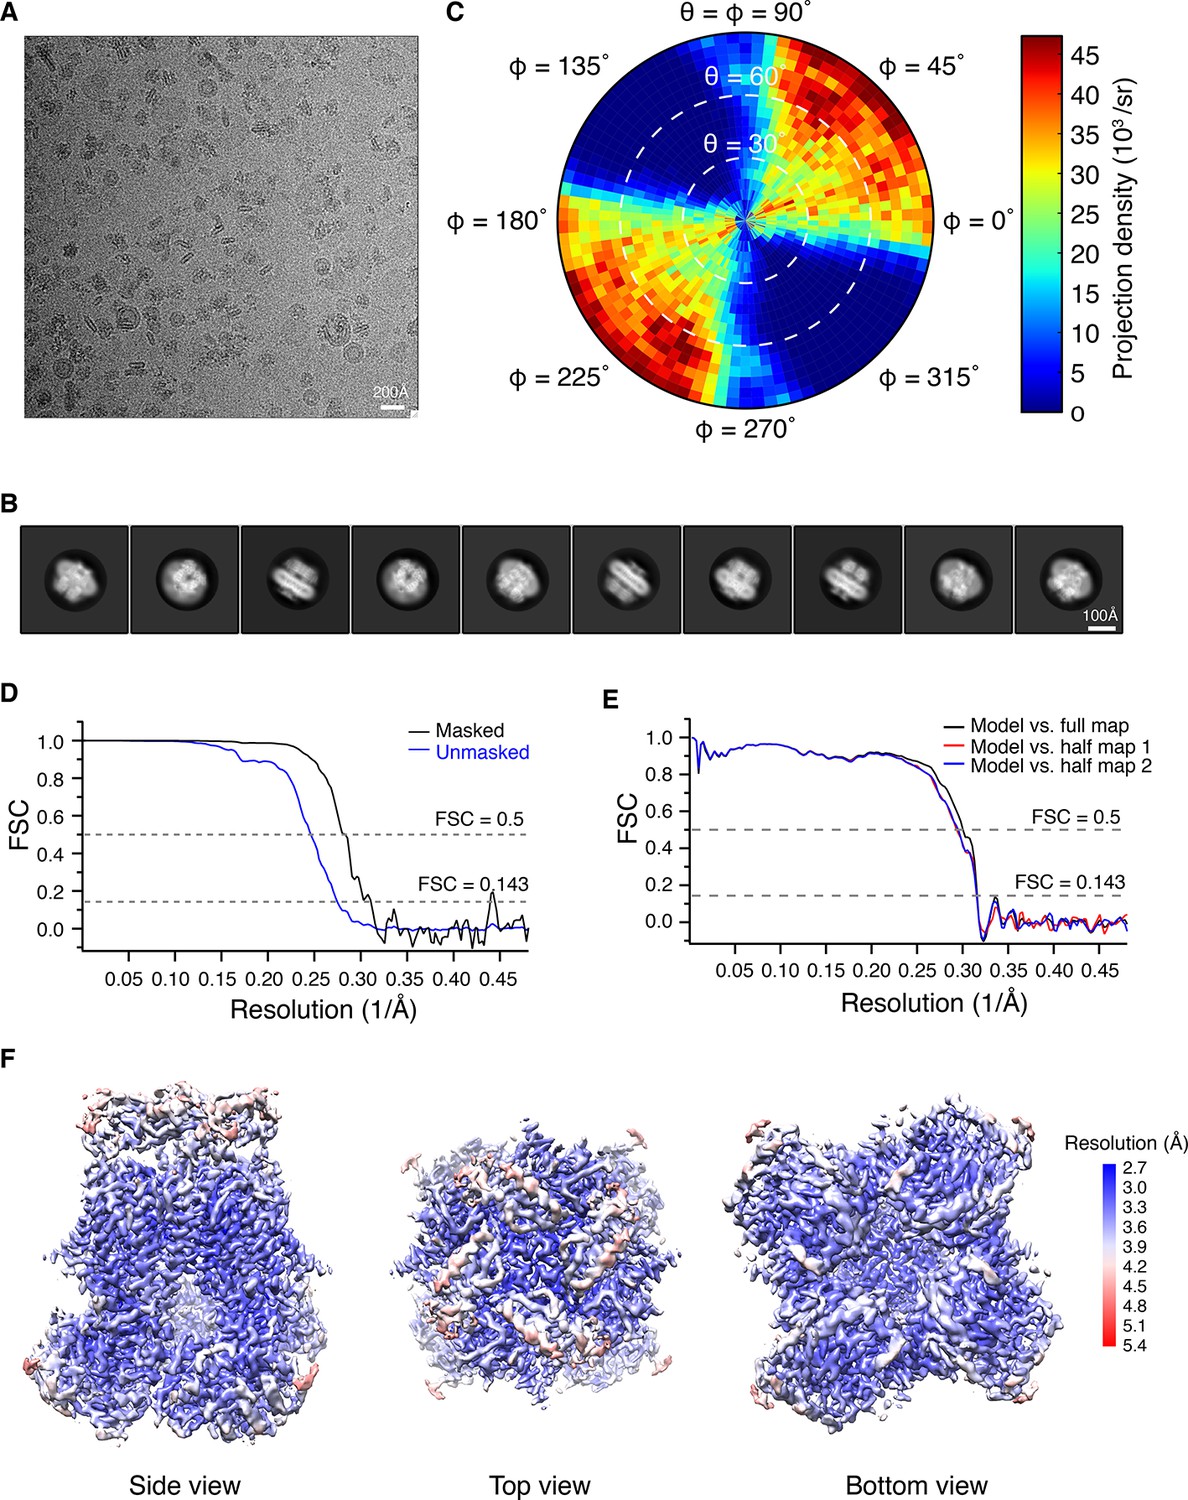
Structure determination of the open Human Slo1 channel in complex with β4 using Cryo-EM.
(A) Representative raw micrograph. (B) Selected 2D class averages. (C) Euler angle distribution of particles for the final 3D reconstruction. (D) Fourier shell correlation (FSC) curves between the two half maps before (blue) and after (black) postprocessing. (E) FSC curves between model and half map 1 (red), half map 2 (blue), full map (black). (F) Local resolution of the final reconstruction estimated by Blocres (Cardone et al., 2013).
Figure 1—figure supplement 3
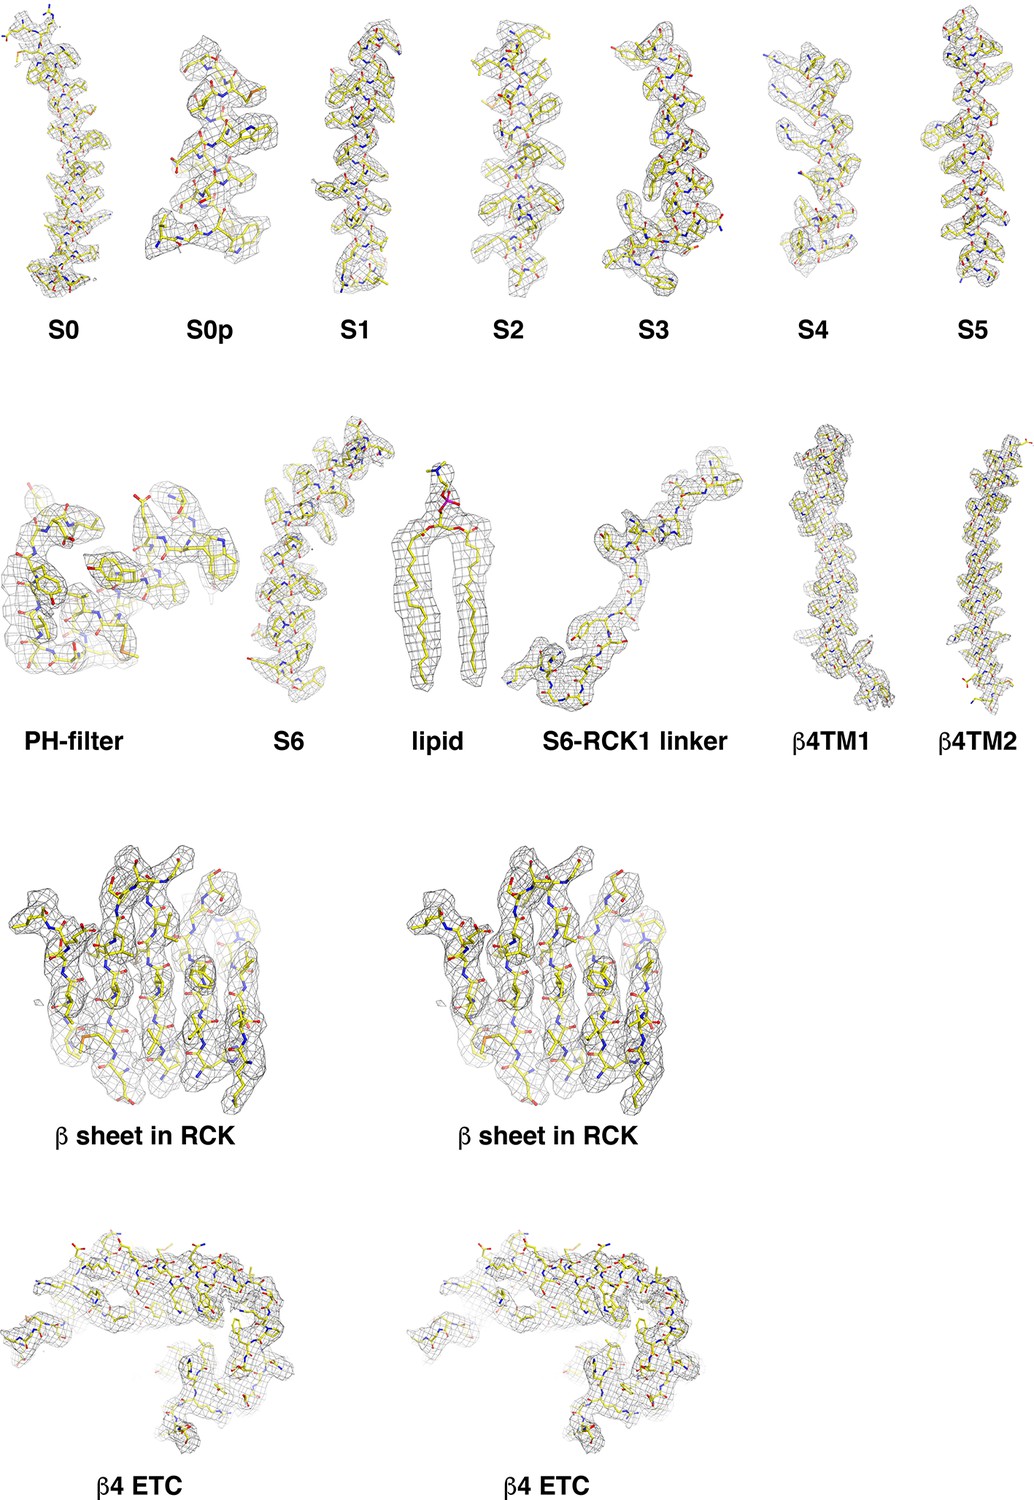
Individual EM densities of the open human Slo1 channel in complex with β4.
Figure 1—figure supplement 4
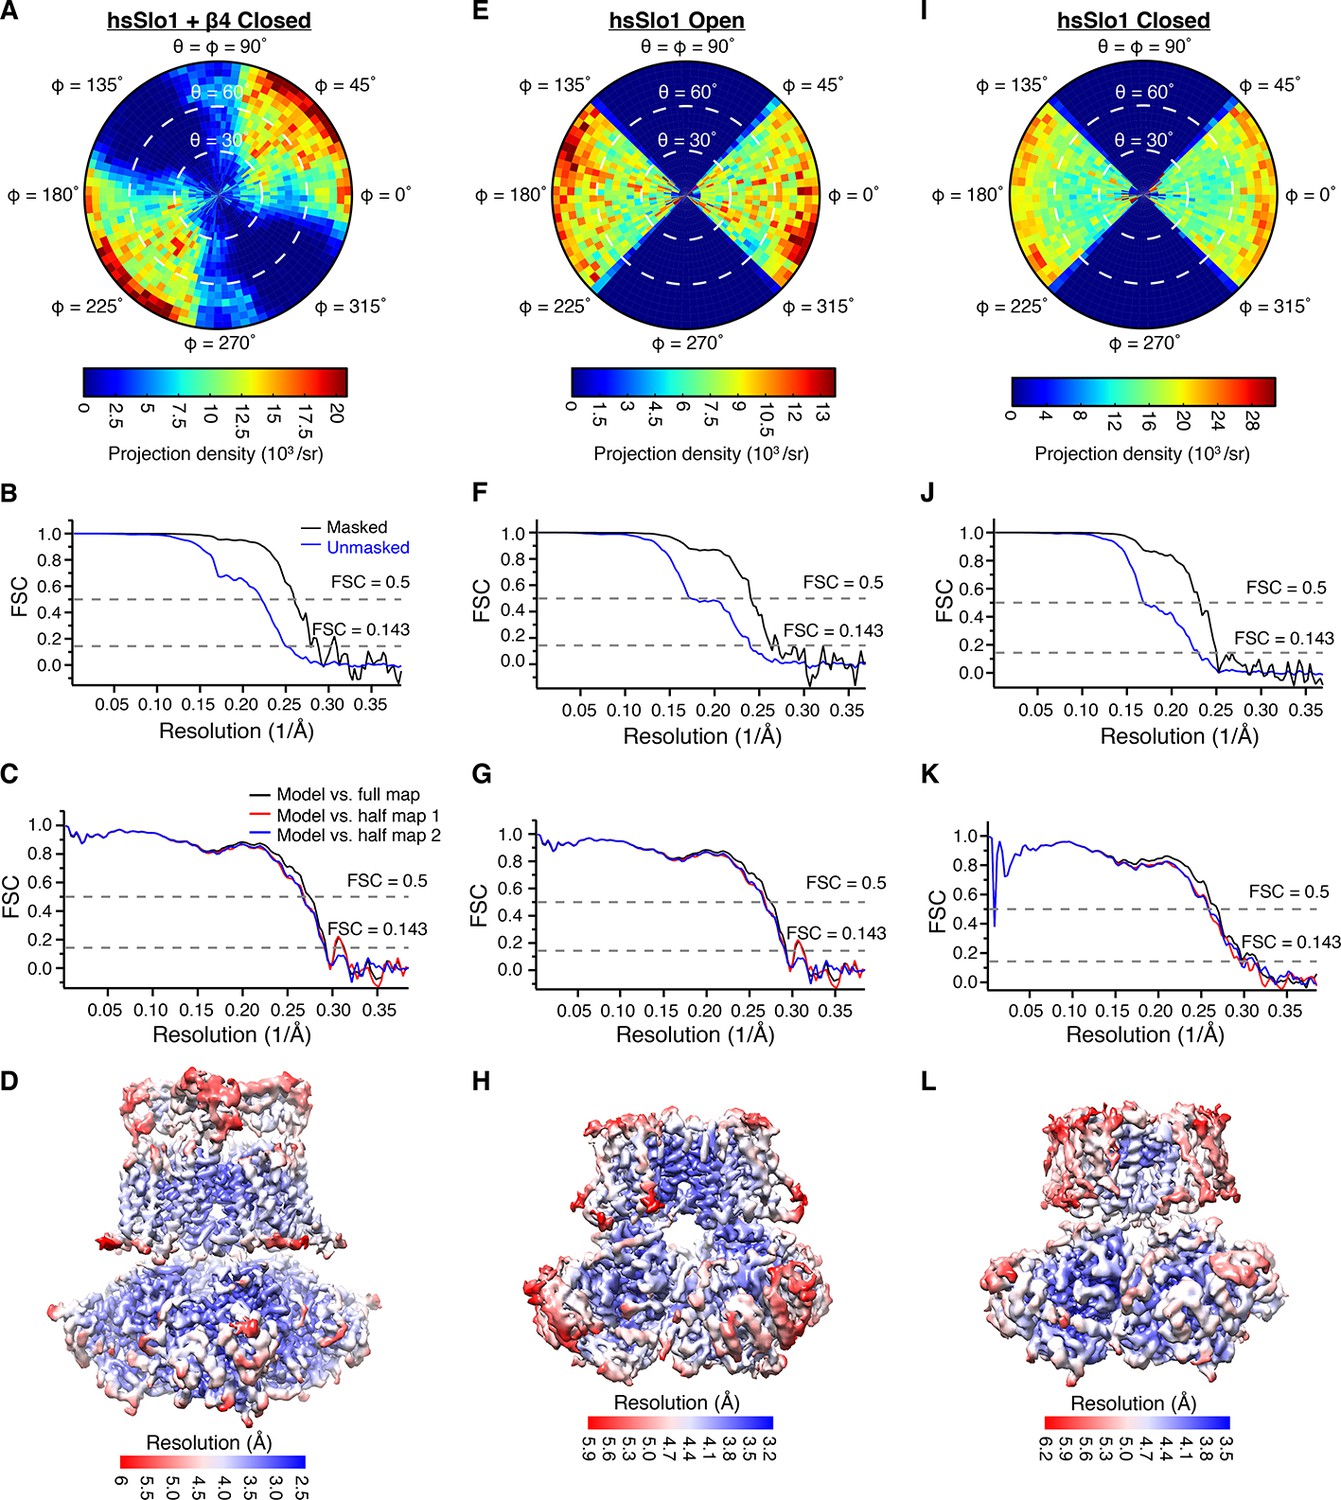
Structure determination of the closed human Slo1 channel in complex with β4, the open human Slo1 channel, and the closed human Slo1 channel using Cryo-EM.
(A, E, I) Euler angle distribution of particles for the final 3D reconstruction of closed hsSlo1 in complex with β4 (A), open hsSlo1 (E), and closed hsSlo1 (I). (B, F, J) Fourier shell correlation (FSC) curves between the two half maps before (blue) and after (black) postprocessing of the closed hsSlo1 in complex with β4 (B), open hsSlo1 (F), and closed hsSlo1 (J). (C, G, K) FSC curves between model and half map 1 (red), half map 2 (blue), full map (black) of the closed hsSlo1 in complex with β4 (C), open hsSlo1 (G), and closed hsSlo1 (K). (D, H, L) Local resolution of the final reconstruction of the closed hsSlo1 in complex with β4 (D), open hsSlo1 (H), and closed hsSlo1 (L), estimated by Blocres (Cardone et al., 2013).
Figure 2 with 1 supplement
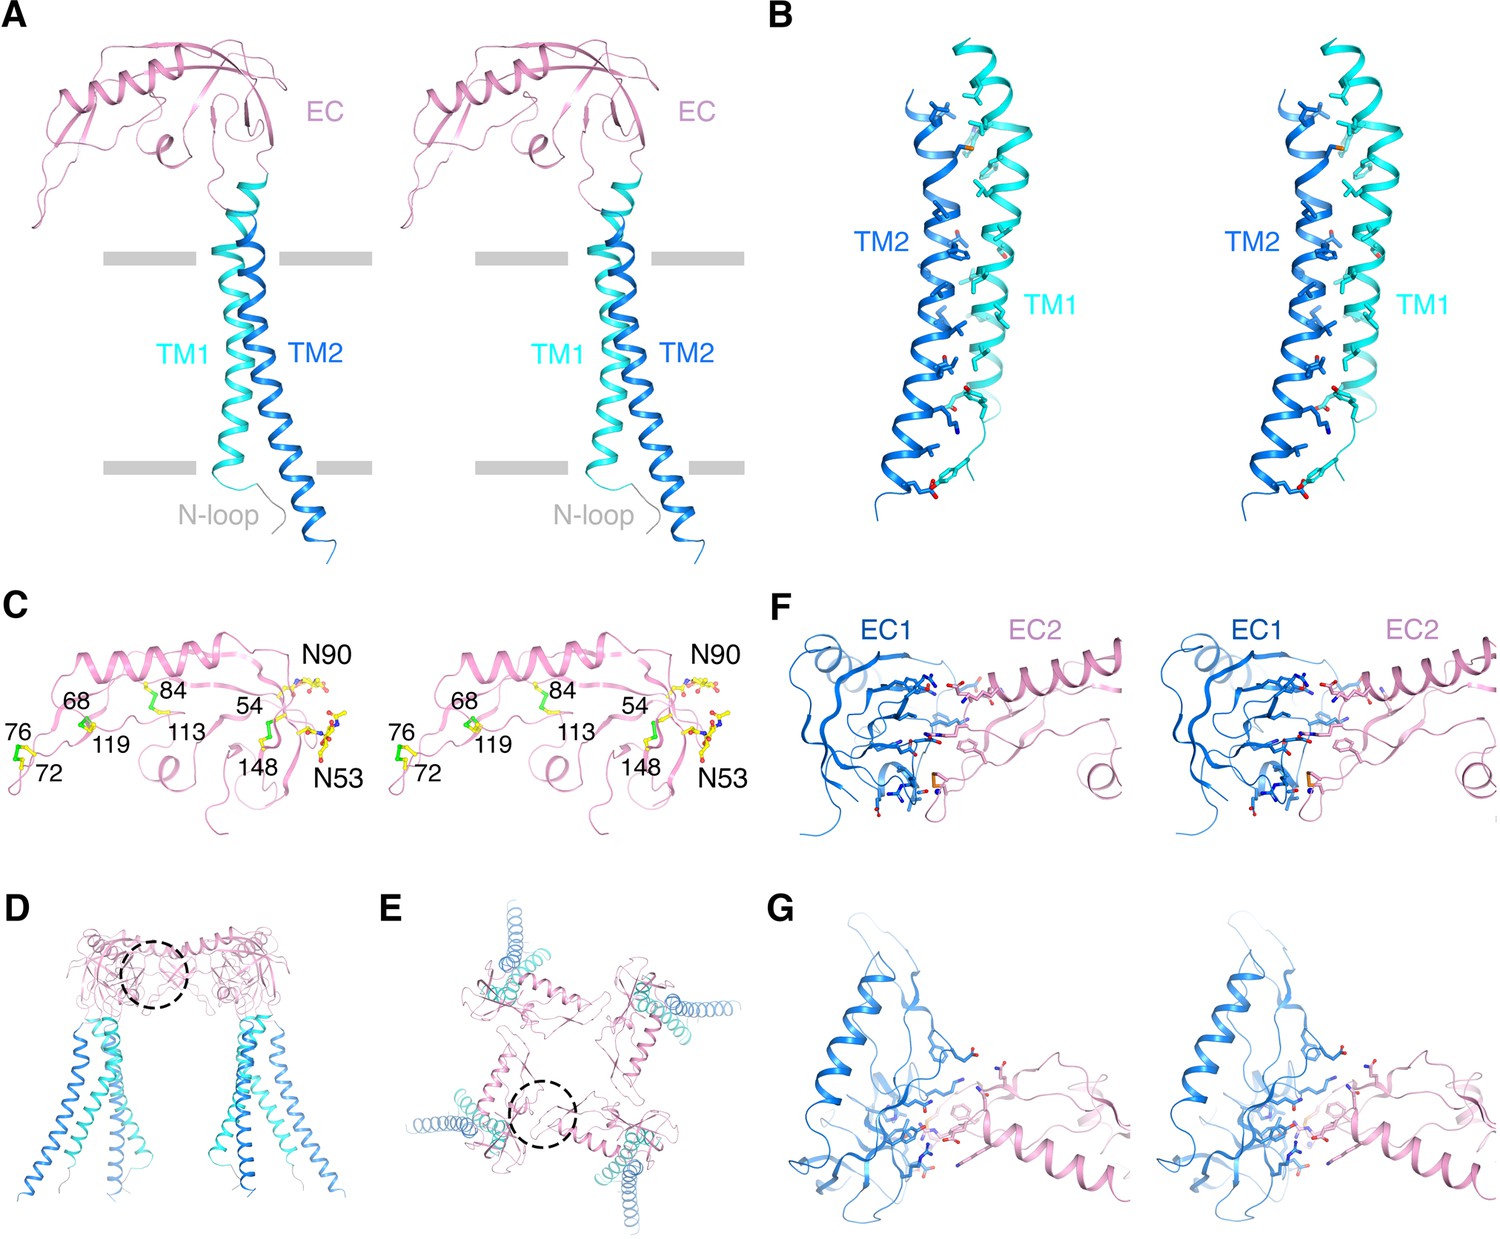
Architecture of the β4 subunit.
(A) Stereo view of the β4 subunit monomer in ribbon representation with the extracellular side up. The N-terminal loop (‘N-loop’), TM1, extracellular domain (‘EC’) and TM2 are discretely colored gray, cyan, pink and blue. The gray bars delimit the membrane boundaries. (B) TM1 and TM2 within one β4 subunit interact extensively with each other. TM1 and TM2 are shown as ribbons in stereo view. Residues involved in the interactions are shown in sticks and colored according to atom type. (C) The EC domain of β4 subunit in stereo, viewed parallel to the membrane. The protein is shown as ribbons and colored as in panel (A). Four disulfide bonds and 2 N-glycosylation sugar groups are shown as sticks and colored according to atom type. (D, E) The β4 subunit tetramer in ribbon representation viewed parallel to the membrane (D) or from the extracellular side (E). Interfaces between two neighboring EC domains are highlighted by dotted circles. (F, G) The interface between the EC domain of two neighboring β4 subunits viewed parallel to the membrane (F) or from the extracellular side (G). The two EC domains are colored blue and pink. Sidechains of residues at the interface are shown as sticks and colored according to atom type.
Figure 2—figure supplement 1
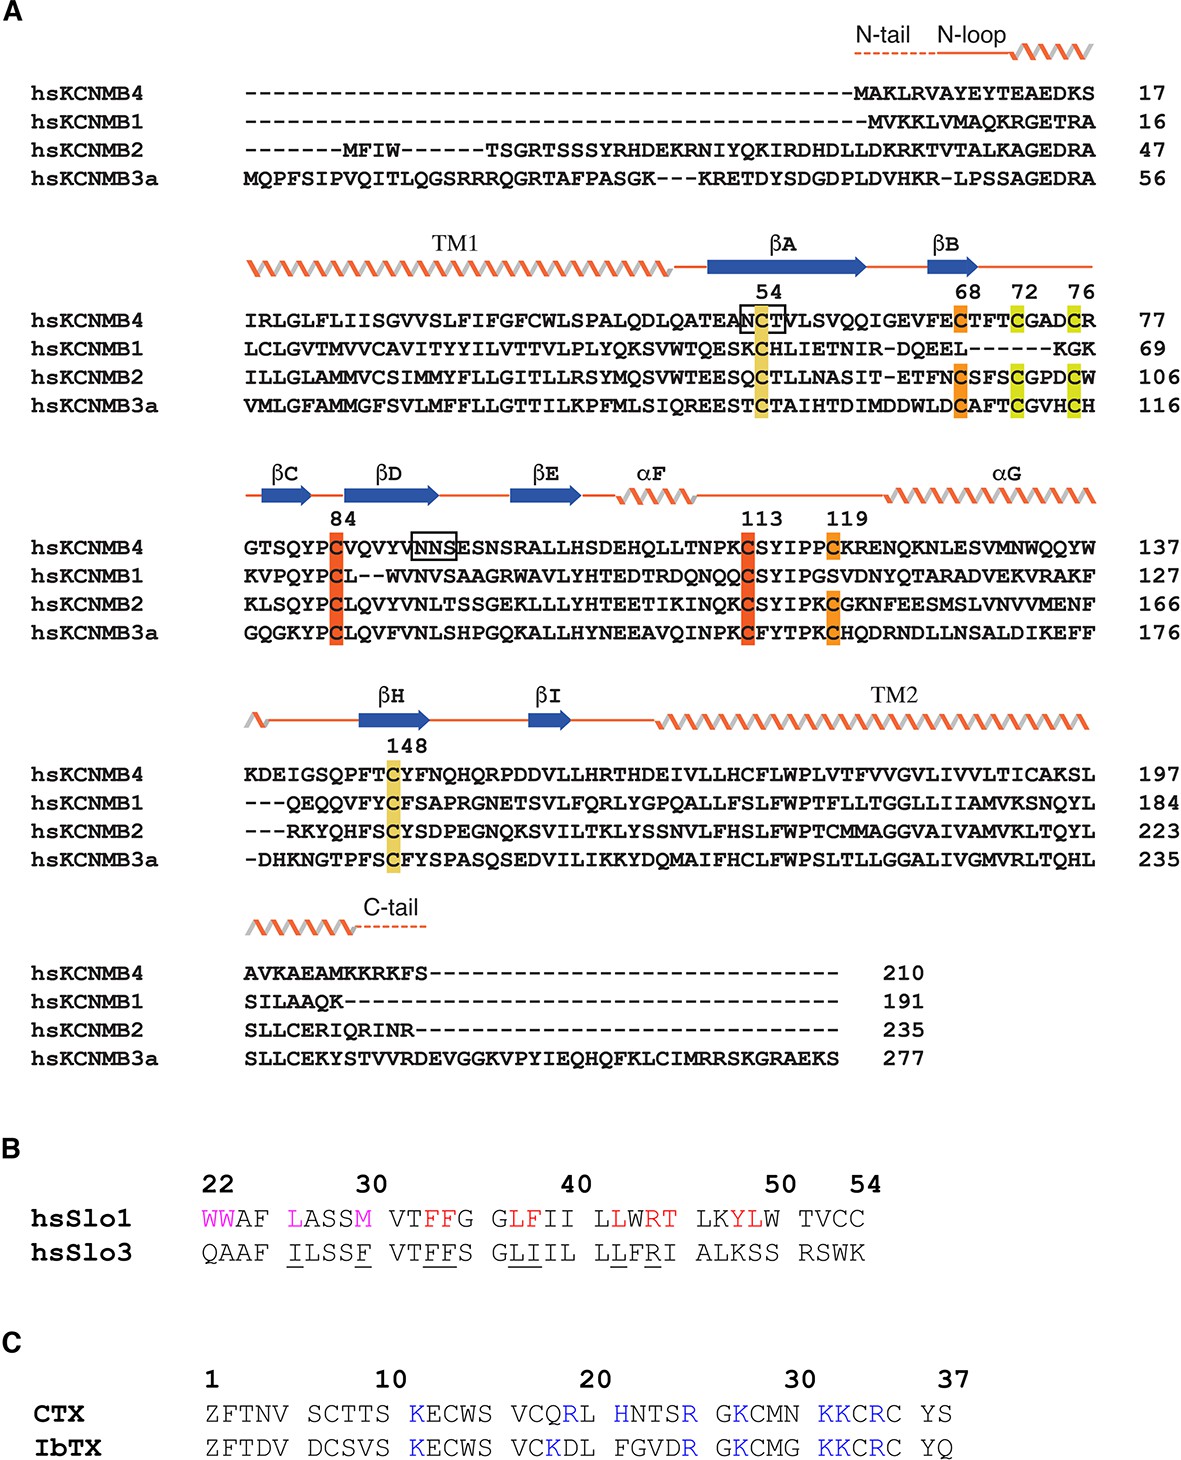
Sequence alignments.
(A) Sequence alignment of the β subunit family. Secondary structures based on the cryo-EM structure of β4 are represented by ribbons (α helices), arrows (β strands), and lines (loops). Residues of the β4 subunit not modeled in the cryo-EM structure are denoted by dash lines. The four pairs of cysteine residues forming disulfide bonds are highlighted with color pairs. The two N-glycosylation sites are also highlighted in boxes. (B) Sequence alignment of the S0 helix of human Slo1 and human Slo3. Residues involved in Slo1-β4 association either through lipids or directly are highlighted purple and red, respectively. The corresponding residues conserved in Slo3 are underlined. (C) Sequence alignment of the two pore blocking toxins of human Slo1: CTX and IbTX, highlighting the basic residues.
Figure 3
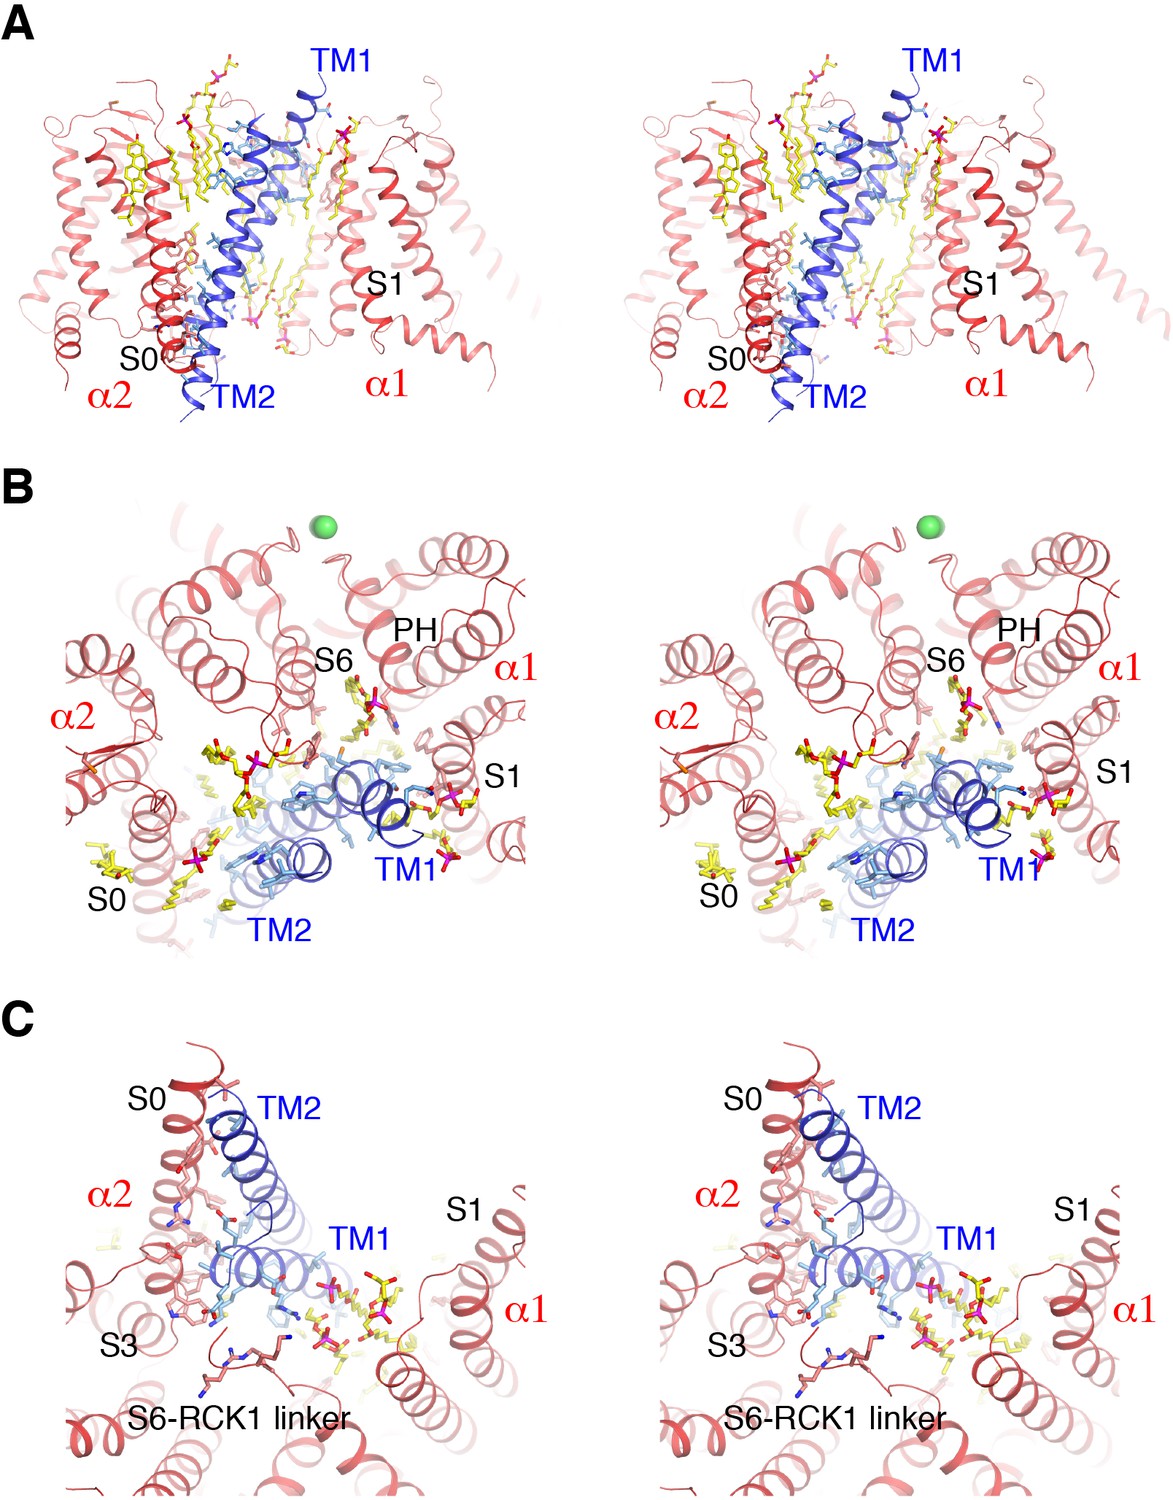
Detailed interactions between Slo1 and β4.
(A) Extensive interactions between TM1, TM2 of β4 subunit and transmembrane domains of two contiguous Slo1 subunits (α1 and α2) in stereo. β4 and Slo1 are shown as ribbons and colored blue and red, respectively. Sidechains as well as lipids at the interfaces are shown as sticks and colored according to atom type. (B) β4 and Slo1 interface near the outer leaflet of the membrane in stereo, viewed from the extracellular side. Proteins and lipids are represented and colored as in panel (A). Green spheres represent the K+ ions in the selectivity filter. (C) β4 and Slo1 interface near the inner leaflet of the membrane in stereo, viewed from the intracellular side. Proteins and lipids are represented and colored as in panel (A).
Figure 4 with 1 supplement

Influence of β4 N-terminus on Slo1 gating.
(A) Voltage-dependent channel activation of the human Slo1 channel alone and co-expressed with the β1 or β4 subunit. Representative current traces recorded using two-electrode voltage clamp (TEVC) are shown. Recording buffer: HEPES 5 mM, KCl 98 mM, CaCl2 0.3 mM, and MgCl2 1 mM. Voltage protocol: holding potential 0 mV, step from −80 to 120 mV in 10 mV incremental steps, step back to 40 mV. A superposition of one single sweep (stepping to 100 mV) from the left three recordings is shown on the right. (B) A schematic drawing of the β4 subunit showing the 10 regions divided based on the atomic structure. (C) Quantification of channel activation and deactivation kinetics by fitting with a single exponential function (see Materials and methods). (D) Comparison of three pairs of mutants demonstrated that the nature of N-tail is correlated with the activation kinetics: the presence of β4 N-tail (left column) results in slower activation kinetics than β1 N-tail (right column). Schematic drawing of each corresponding mutant is shown next to the representative current traces. Voltage protocols are the same as in panel (A).
Figure 4—figure supplement 1
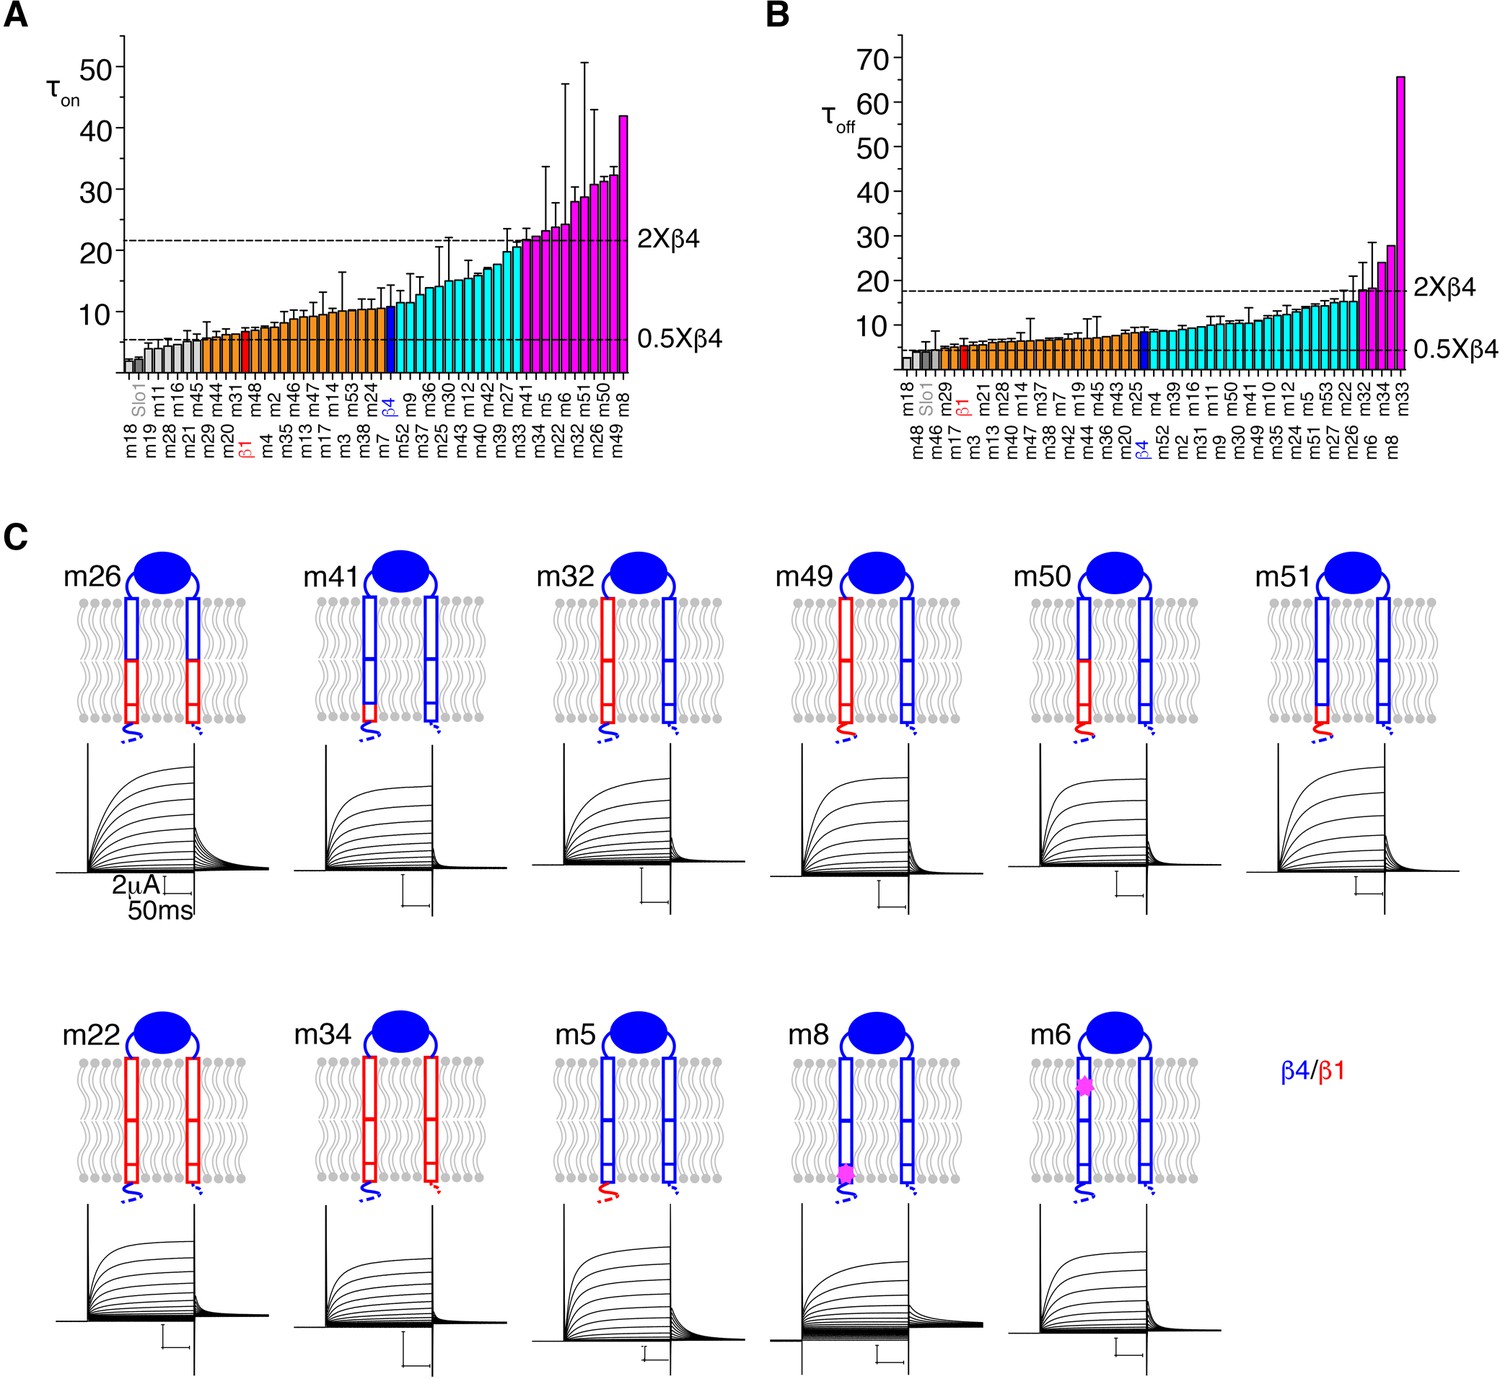
Identification of the β4 regions with critical functional effects with TEVC.
(A, B) Bar graphs of the activation time constant (τ_on) (A) and deactivation time constant (τ_off) (B) of all the mutants in an ascending order from left to right. The activation and deactivation time constants were measured at voltage of 100 mV and 40 mV, respectively. Data are represented as mean ± SEM (n = 3–5). α alone (i.e. Slo1), β1 wt and β4 wt are colored dark gray, red and blue respectively. The two dashed lines indicate the time constant value of 50% and 2-fold of β4 wt. Mutants with time constant below 50% of β4 wt are colored light gray; more than 2-fold of β4 wt colored magenta; between 50% and β4 wt colored orange; between β4 wt and 2-fold of that colored cyan. (C) Schematic drawings and representative TEVC recordings of those mutants with significantly slower activation kinetics are shown.
Figure 5 with 1 supplement
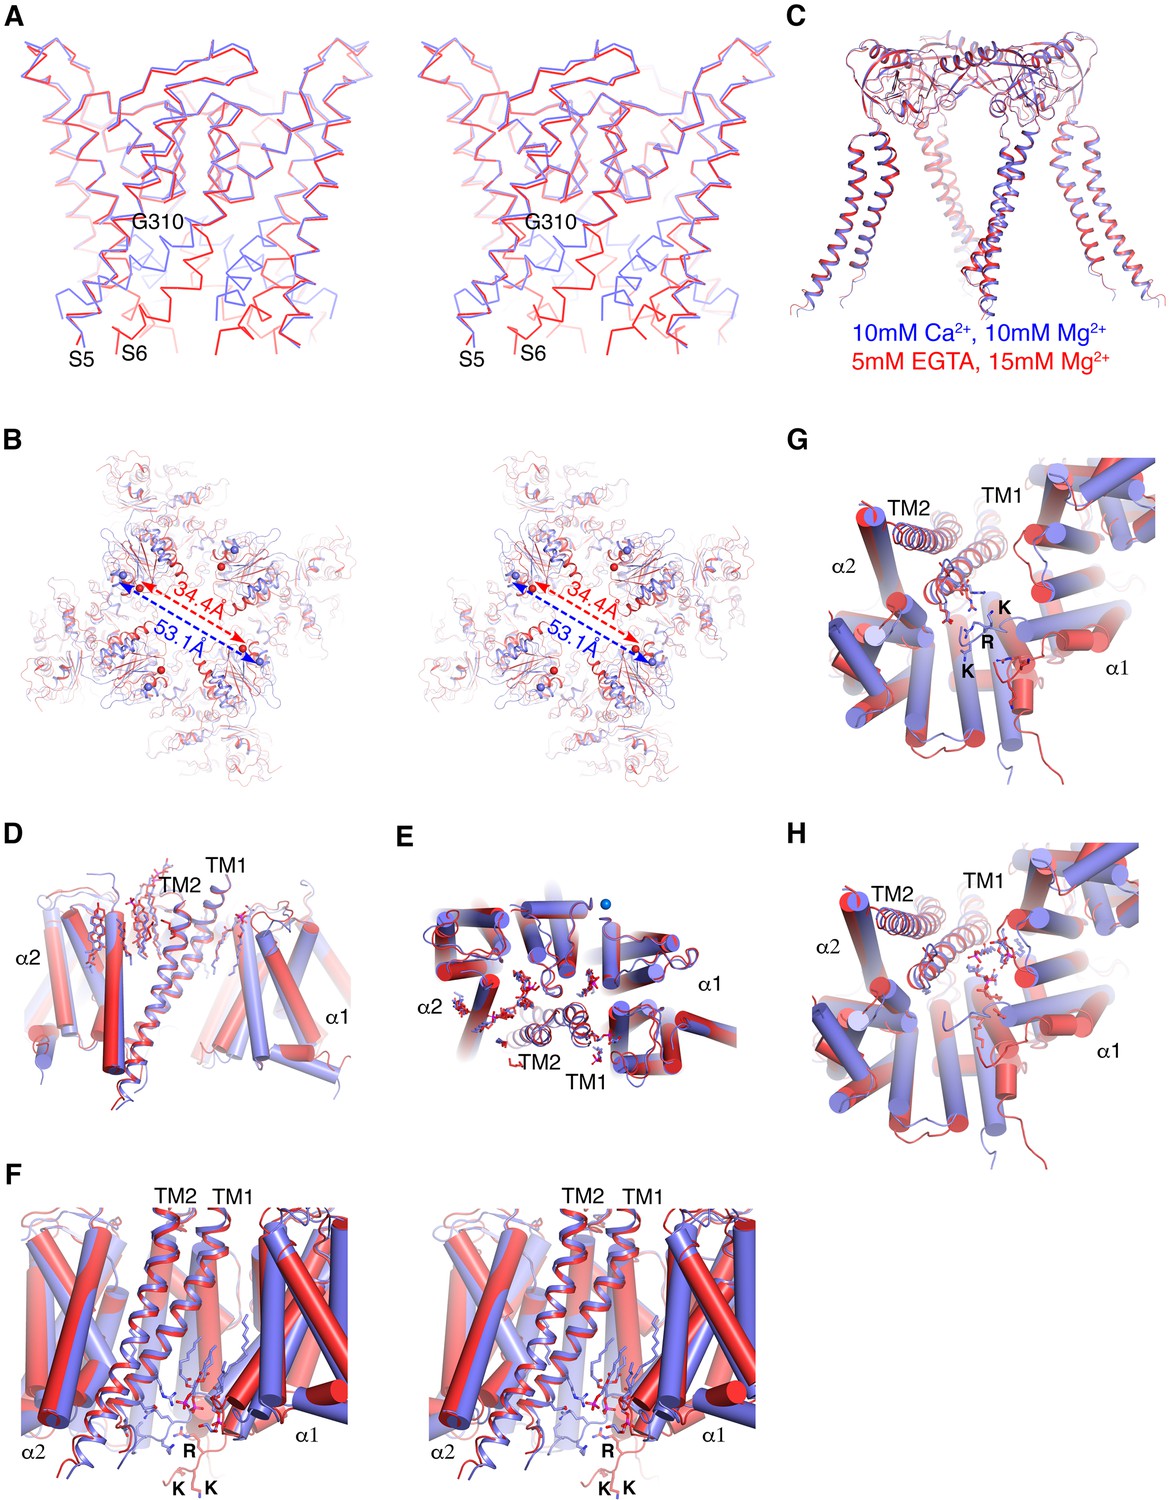
Ca2+gating mechanism of human Slo1 in the absence and presence of β4 subunit.
(A) Ca2+-induced conformational changes in the pore domain of human Slo1-β4 channel complex. Superposition of the pore domain in the absence (red Cα trace) and presence (blue Cα trace) of Ca2+ is shown in stereo. The gating hinge residue G310 on inner helix is labeled. (B) Ca2+-induced conformational changes in the gating ring of human Slo1-β4 channel complex. Superposition of the gating ring (aligning the RCK2 domain) in the absence (red) and presence (blue) of Ca2+ is shown in stereo. The spheres indicate the position of Cα atoms of Gly334 at the beginning of RCK1 domain. Distances between the Cα atoms of Gly334 on opposing RCK1 subunits are labeled. (C) Ca2+ produced essentially no conformational changes in the β4 tetramer. Superposition of the β4 tetramer in the absence (red) and presence (blue) of Ca2+ is shown. (D, E) Ca2+ produced minimal conformational changes in the Slo1-β4 interfaces near the membrane outer leaflet, including the positions of lipid molecules, viewed parallel to membrane (D) or from the extracellular side (E). Superposition of the Slo1-β4 channel complex in the absence (red) and presence (blue) of Ca2+ is shown, aligning the transmembrane domain. For clarity, only one β4 subunit (as ribbons) and the two interacting Slo1 subunits (α1 and α2) (as cylinders) are shown. Lipids at the Slo1 and β4 TM1 outer leaflet interface are shown as sticks. K+ ions in the selectivity filter are show as marine spheres (E). (F) Ca2+-induced conformational changes in the Slo1-β4 interfaces near the membrane inner leaflet. Superposition of the Slo1-β4 channel complex in the absence (red) and presence (blue) of Ca2+ is shown in stereo, viewed parallel to the membrane, aligning the transmembrane domain. Sidechains of the β4 TM1 facing the S6-RCK1 linker as well as the three positively charged residues on S6-RCK1 linker (‘RKK’) are shown as sticks. Lipids at the Slo1 and β4 TM1 inner leaflet interface in the Ca2+-bound state are also shown as sticks. (G) Superposition of the Slo1-β4 channel complex in the absence (red) and presence (blue) of Ca2+ viewed from the intracellular side, aligning the transmembrane domain. Color and representation schemes are the same as in panel (F). Sidechains of the β4 TM1 facing the S6-RCK1 linker as well as the three positively charged residues on S6-RCK1 linker (‘RKK’) are shown as sticks. (H) The same superposition as in panel (G) with lipids at the Slo1 and β4 TM1 inner leaflet interface in the Ca2+-bound state (blue) and Ca2+-free state (red) shown as sticks.
Figure 5—figure supplement 1
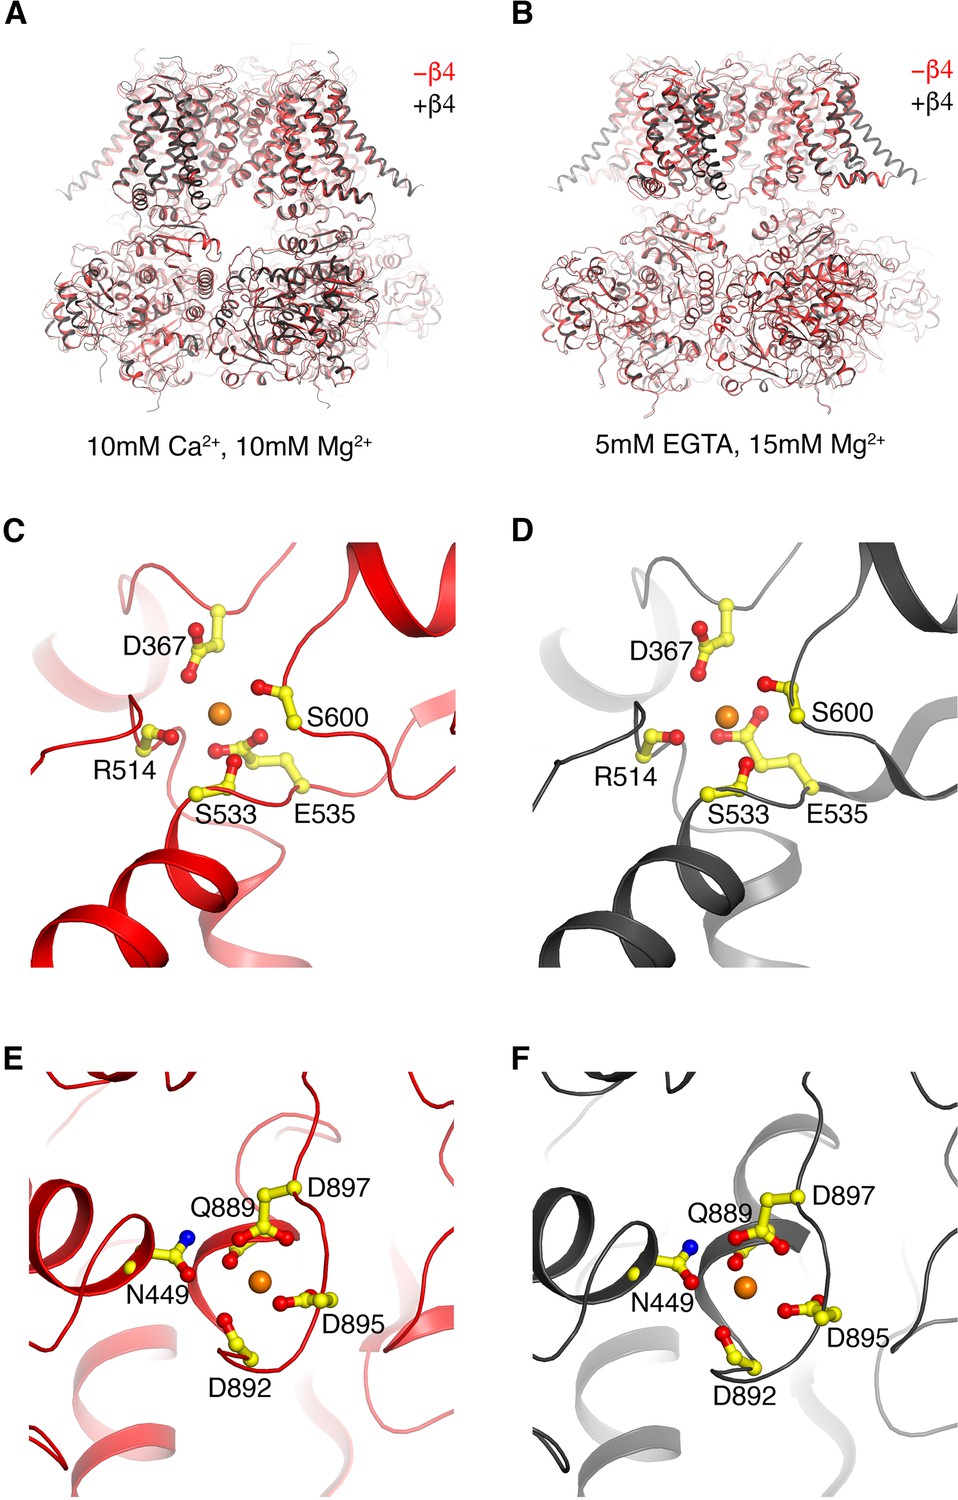
β4 has minimal impact on the Ca2+-induced open and closed conformations of hsSlo1.
(A) Overlay of Ca2+-bound human Slo1 in the absence (red) and presence (black) of β4. (B) Overlay of Ca2+-free human Slo1 in the absence (red ribbon) and presence (black) of β4. (C, D) The Ca-RCK1 site in the absence (C) and presence (D) of β4 in high Ca2+. The protein is shown as ribbons and Ca2+ ion shown as orange sphere. Sidechains as well as mainchains coordinating the Ca2+ ion are shown as sticks and colored according to atom types. (E, F) The Ca-bowl site in the absence (E) and presence (F) of β4 in high Ca2+. The protein is shown as ribbons and Ca2+ ion shown as orange sphere. Sidechains as well as mainchains coordinating the Ca2+ ion are shown as sticks and colored according to atom types.
Figure 6 with 1 supplement
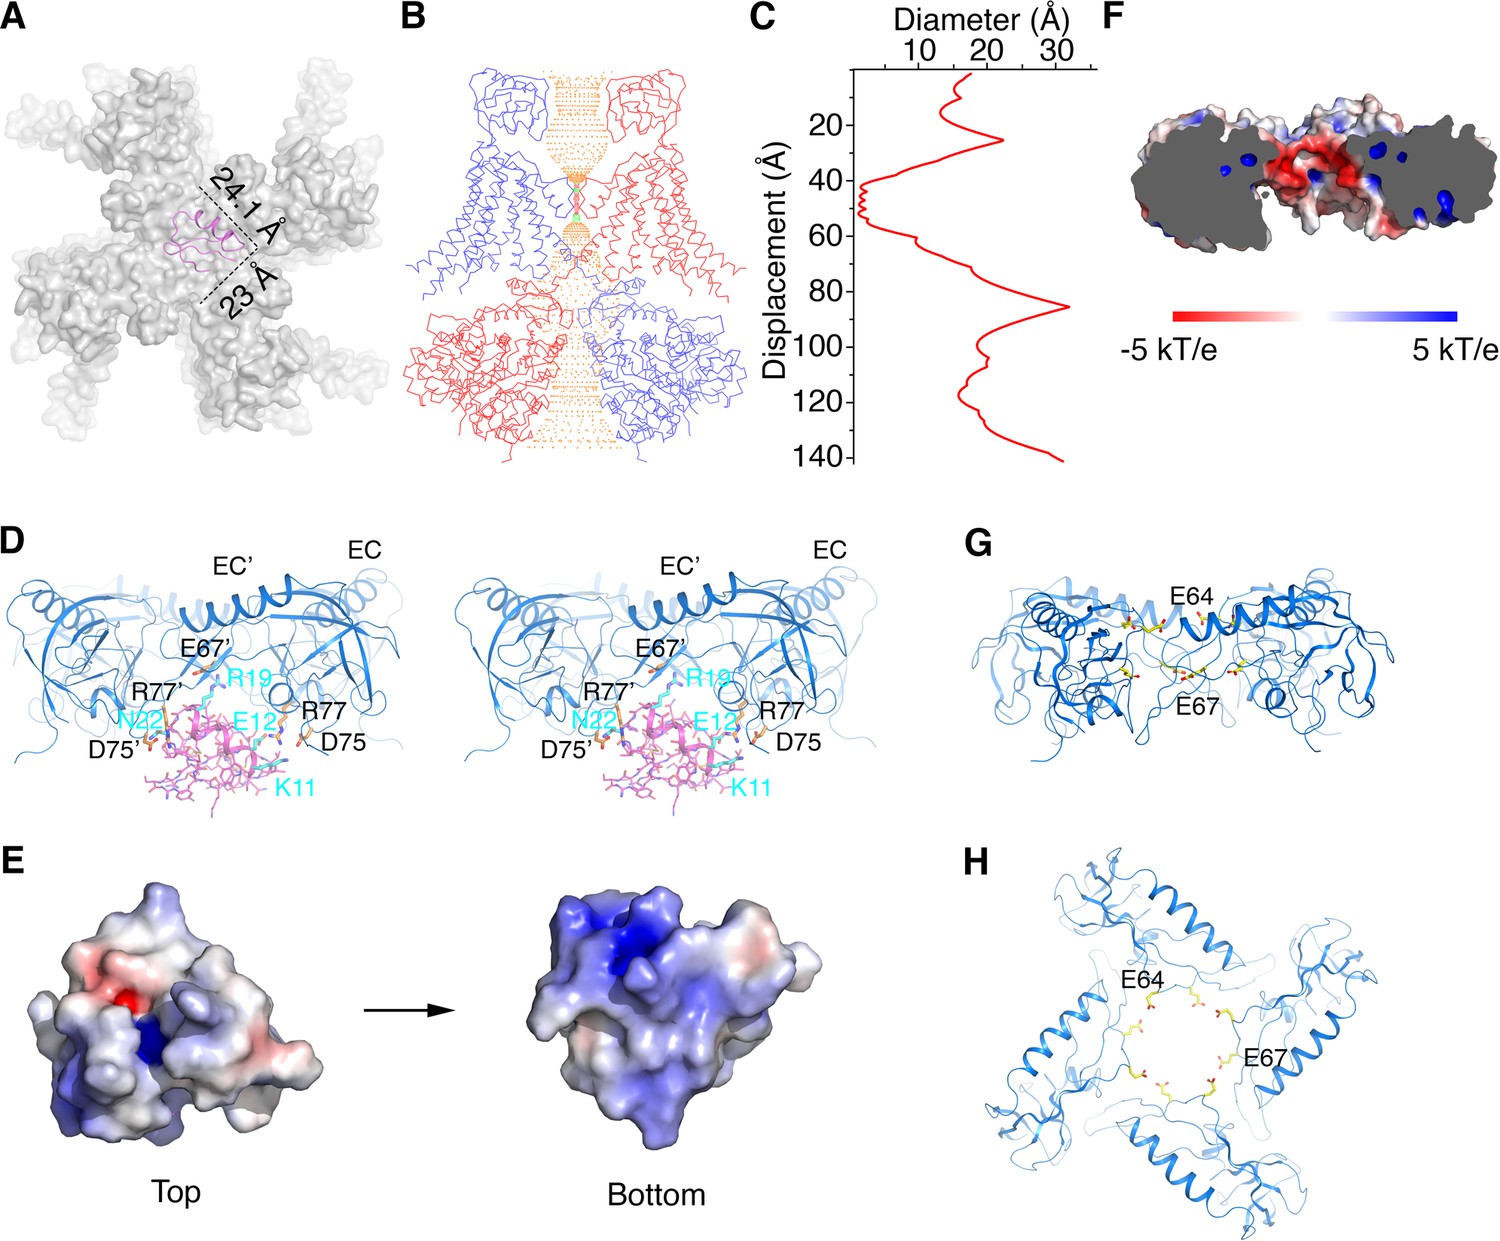
Structural basis for modification of Slo1 toxin sensitivity by β subunits.
(A) CTX docked onto the Slo1 channel based on the crystal structure of the CTX-Kv1.2–2.1 paddle chimera (PDB 4JTA). Only the transmembrane domain of Slo1 is shown (gray surface) and CTX is shown as pink ribbons. Dimensions of CTX in the plane parallel to membrane are indicated. (B) Central conduction pore of the open Slo1-β4 channel complex generated with Hole (Smart et al., 1996). For clarity, only two opposing subunits of Slo1 and β4 are shown (blue and red Cα traces). Pore radius: red,<1.15 Å; green, 1.15 to 2.30 Å; orange,>2.30 Å. (C) Diameter of the central pore. The van der Waals radius is plotted against the distance along the pore axis. (D) The EC domain tetramer of β4 provides potential new toxin binding sites. The EC tetramer is shown as blue ribbons. CTX is shown as pink sticks and ribbons. Potential new CTX binding sites on the EC domain and the corresponding interacting residues on CTX are shown as sticks and colored according to atom type. (E) Electrostatic surface potential of CTX viewed from the extracellular side (‘Top’) or the opposite side (‘Bottom’), calculated with APBS. (F) Negatively charged inner surface of the central pore formed by the EC tetramer of β4 subunits, calculated with APBS. (G, H) Two rings of negatively charged residues E64 and E67 on the EC domain of β4, facing the central pore axis, viewed parallel to the membrane (G) or from the extracellular side (H). EC domains are shown as blue ribbons. Sidechains of E64 and E67 are shown as sticks and colored according to atom type.
Figure 6—figure supplement 1
CTX docked onto the Ca2+-bound hsSlo1-β4 channel complex.
(A, B) Stereo side view (A) and top view (B) of CTX docked onto the Ca2+-bound hsSlo1-β4 channel complex based on the crystal structure of the CTX-Kv1.2–2.1 paddle chimera (PDB 4JTA). The hsSlo1-β4 channel complex is shown as Cα traces with four subunits colored uniquely. CTX is shown as blue ribbons and surface.
Tables
Table 1
Structure refinement and validation, related to Figure 1 and Figure 5.
| hsSlo1 + β4 Open | hsSlo1 + β4 Closed | hsSlo1 Open | hsSlo1 Closed | |
|---|---|---|---|---|
| Data acquisition | ||||
| Microscope/Camera | Titan Krios/Gatan K2 Summit | |||
| Voltage (kV) | 300 | |||
| Defocus range (μM) | 0.7 to 2.0 | 0.7 to 2.0 | 0.8 to 2.4 | 0.8 to 2.4 |
| Pixel size (Å) | 1.04 | 1.3 | 1.3 | 1.3 |
| Total electron dose (e-/Å2) | 74 | 89 | 89 | 89 |
| Exposure time (s) | 10 | 15 | 15 | 15 |
| Reconstruction | ||||
| Particle number | 117,791 | 42,842 | 28,073 | 53,961 |
| Resolution (unmasked, Å) | 3.7 | 4.0 | 4.2 | 4.4 |
| Resolution (masked, Å) | 3.2 | 3.5 | 3.8 | 4.0 |
| RMS deviation | ||||
| Bond length (Å) | 0.007 | 0.007 | 0.007 | 0.01 |
| Bond angle (°) | 0.801 | 0.946 | 0.950 | 0.94 |
| Ramachandran plot | ||||
| Favored (%) | 95.55 | 91.70 | 91.72 | 90.43 |
| Allowed (%) | 4.45 | 8.30 | 8.16 | 9.46 |
| Outliers (%) | 0.00 | 0.00 | 0.12 | 0.11 |
| MolProbity | ||||
| Clash score | 5.83 | 6.07 | 8.56 | 5.36 |
| Rotamer outliers (%) | 0.21 | 0.30 | 1.56 | 0.63 |
Table 2
List of the β4 mutants for TEVC studies, related to Figure 4.
| ShortName | β4 sequence | β1 sequence | ShortName | β4 sequence | β1 sequence | |
|---|---|---|---|---|---|---|
| Slo1 | N/A | N/A | m27 | 1-10,20-190,206-210 | 10-18,178-191 | |
| β1 | N/A | 1-191 | m28 | 11-193 | 1-9,181-191 | |
| β4 | 1-210 | N/A | m29 | 11-198 | 1-9,181-186 | |
| m2 | 7-210 | N/A | m30 | 49-210 | 1-47 | |
| m3 | 1-205 | N/A | m31 | 1-163 | 151-191 | |
| m4 | 10-210 | N/A | m32 | 1-10,49-210 | 10-47 | |
| m5 | 14-210 | 1-12 | m33 | 1-163,206-210 | 151-191 | |
| m6 | 1-34,40-210 | 34-38 | m34 | 1-10,49-163 | 10-47,151-191 | |
| m7 | 1-190,197-210 | 178-183 | m35 | 1-28,49-210 | 28-47 | |
| m8 | 1-10,14-210 | 10-12 | m36 | 1-163,181-210 | 151-167 | |
| m9 | E9A | N/A | m37 | 1-19,30-210 | 19-28 | |
| m10 | 1-18,20-210 (R19C) | 18 | m38 | 1-180,191-210 | 168-177 | |
| m11 | R19L | N/A | m39 | 1-10,30-210 | 10-28 | |
| m12 | E14A | N/A | m40 | 1-180,206-210 | 168-191 | |
| m13 | 1-42,44-210 (A43Y) | 42 | m41 | 1-10,20-210 | 10-18 | |
| m14 | 1-164,168-210 | 152-154 | m42 | 1-190,206-210 | 178-191 | |
| m16 | 7-205 | N/A | m43 | 11-210 | 1-9 | |
| m17 | 1-42,44-164,168-210 | 42,152-154 | m44 | replace β4EC (49-166) with "GGSGGGSG" | N/A | |
| m18 | 1-11,13-14,16-18,20-210 (E12R, D15T, R19C) | 11,14,18 | m45 | replace β1EC (41-153) with "GGSGGGSG" | N/A | |
| m19 | 1-48,164-210 | 48-150 | m46 | replace β1EC (48-153) with "GGSGGGSG" | N/A | |
| m20 | 1-45,167-210 | 45-153 | m47 | 1-47,151-210 | 49-163 | |
| m21 | 49-163 | 1-47,151-191 | m48 | 1-44,154-210 | 46-166 | |
| m22 | 1-10,49-163,206-210 | 10-47,151-191 | m49 | 1-6,49-210 | 6-47 | |
| m23 | 1-10,49-163,196-210 | 10-47,151-182 | m50 | 1-6,30-210 | 6-28 | |
| m24 | 1-28,49-163,181-210 | 28-47,151-167 | m51 | 1-2,30-210 | 2-28 | |
| m25 | 1-19,30-180,191-210 | 19-28,168-177 | m52 | 1-6,20-210 | 6-18 | |
| m26 | 1-10,30-180,206-210 | 10-28,168-191 | m53 | 1-2,20-210 | 2-18 |
Key resources table
| Reagent type (species) or resource | Designation | Source or reference | Identifiers | Additional information | |
|---|---|---|---|---|---|
| Gene (Homo sapiens) | hsSlo1 (human_KCNMA1) | synthetic | accession: Q12791.2 GI: 46396283 | synthesized at GeneWiz | |
| gene (Homo sapiens) | hsbeta4 (human_KCNMB4) | synthetic | accession: NP_055320.4 GI: 26051275 | synthesized at GeneWiz | |
| gene (Homo sapiens) | hsbeta1(human_KCNMB1) | synthetic | accession: Q16558.5 GI: 292495100 | synthesized at GeneWiz | |
| Recombinant DNA reagent | pEG BacMam | DOI: 10.1038/nprot.2014.173 | |||
| Recombinant DNA reagent | pGEM | https://www.addgene.org/vector-database/2835/ | |||
| Cell line (Homo sapiens) | HEK293S GnTI- | ATCC | CRL-3022 | cells purchased from ATCC and we have now confirmed there is no mycoplasma contamination | |
| Cell line (Homo sapiens) | HEK293T | ATCC | CRL-3216 | cells purchased from ATCC and we have now confirmed there is no mycoplasma contamination | |
| Cell line (Spodoptera frugiperda) | Sf9 | ATCC | CRL-1711 | cells purchased from ATCC and we have now confirmed there is no mycoplasma contamination | |
| Strain, strain background (Escherichia coli) | DH10Bac | ThermoFisher | 10361012 | MAX Efficiency DH10Bac Competent Cells | |
| Biological sample (Xenopus laevi) | oocyte | Xenopus laevi | |||
| Chemical compound, drug | Freestyle 293 medium | Gibco | 12338018 | ||
| Chemical compound, drug | sf-900 II SFM medium | Gibco | 10902088 | ||
| Chemical compound, drug | 2,2-didecylpropane-1,3-bis-β-D-maltopyranoside (LMNG) | Anatrace | NG310 | ||
| Chemical compound, drug | Cholesteryl hemisuccinate (CHS) | Anatrace | CH210 | ||
| Chemical compound, drug | Digitonin | Sigma-Aldrich | D141 | ||
| Chemical compound, drug | Cellfectin II | Invitrogen | 10362100 | ||
| Chemical compound, drug | FuGENE HD transfection reagent | Promega | E2312 | ||
| Chemical compound, drug | Collegenase type II | Gibco | 17107–0125 | ||
| Chemical compound, drug | Gentamicin sulphate | Sigma-Aldrich | A0752 | ||
| Commercial assay or kit | CNBr-activated sepharose beads | GE Healthcare | 17043001 | ||
| Commercial assay or kit | Superose 6, 10/300 GL | GE Healthcare | 17517201 | ||
| Commercial assay or kit | mMESSAGE mMACHINE T7 Transcription Kit | ThermoFisher | AM1344 | ||
| Commercial assay or kit | AmpliCap-MaxT7 high yield message maker kit | CELLSCRIPT | C-ACM04037 | ||
| Commercial assay or kit | R1.2/1.3 400 mesh Au holey carbon grids | Quantifoil | 1210627 | ||
| Software, algorithm | SerialEM | DOI: 10.1016/j.jsb.2005.07.007 | http://bio3d.colorado.edu/SerialEM | ||
| Software, algorithm | MotionCor2 | DOI: 10.1038/nmeth.4193 | https://msg.ucsf.edu/software | ||
| Software, algorithm | Gctf | DOI: 10.1016/j.jsb.2015.11.003 | https://www.mrc-lmb.cam.ac.uk/kzhang/ | ||
| Software, algorithm | Gautomatch | other | https://www.mrc-lmb.cam.ac.uk/kzhang/ | ||
| Software, algorithm | cryoSPARC | DOI: 10.1038/nmeth.4169 | http://www.cryosparc.com | ||
| Software, algorithm | RELION-3 | DOI: 10.7554/eLife.18722 | http://www2.mrc-lmb.cam.ac.uk/relion | ||
| Software, algorithm | FrealignX | DOI: 10.1016/j.jsb.2013.07.005 | http://grigoriefflab.janelia.org/frealign | ||
| Software, algorithm | COOT | DOI: 10.1107/S0907444910007493 | https://www2.mrc-lmb.cam.ac.uk/personal/pemsley/coot/ | ||
| Software, algorithm | PHENIX | DOI: 10.1107/S2059798318006551 | https://www.phenix-online.org | ||
| Software, algorithm | UCSF Chimera | DOI: 10.1002/jcc.20084 | https://www.cgl.ucsf.edu/chimera | ||
| Software, algorithm | Pymol | PyMOL Molecular Graphics System, Schrödinger, LLC | http://www.pymol.org | ||
| Software, algorithm | HOLE | DOI: 10.1016/s0263-7855(97)00009-x | http://www.holeprogram.org | ||
| Software, algorithm | pClamp | Axon Instruments, Inc |
Additional files
Download links
A two-part list of links to download the article, or parts of the article, in various formats.
Downloads (link to download the article as PDF)
Open citations (links to open the citations from this article in various online reference manager services)
Cite this article (links to download the citations from this article in formats compatible with various reference manager tools)
Molecular structures of the human Slo1 K+ channel in complex with β4
eLife 8:e51409.
https://doi.org/10.7554/eLife.51409


