Endothelial heterogeneity across distinct vascular beds during homeostasis and inflammation
- The University of Illinois College of Medicine, United States
- The University of Illinois College of Engineering and College of Medicine, United States
- University of Illinois, United States
Figures
Figure 1 with 5 supplements

Endothelial heterogeneity exists in classic endothelial functions.
(A) Principal component analysis of RNA-Seq data generated from brain, lung, and heart endothelial samples isolated from RiboTagEC mice displays the organ-specific in-situ endothelial clusters. (B) Differential expression analysis of 18,910 genes which are expressed in brain, lung, and heart endothelium at baseline identified tissue-specific differentially expressed genes. (FDR < 5%) (C–F) Hierarchical clustering of classical endothelial processes including (C) endothelial genes, (D–E) metabolism, and (F) transporters results in distinct clustering of brain, lung, and heart endothelial baseline samples.
Figure 1—figure supplement 1
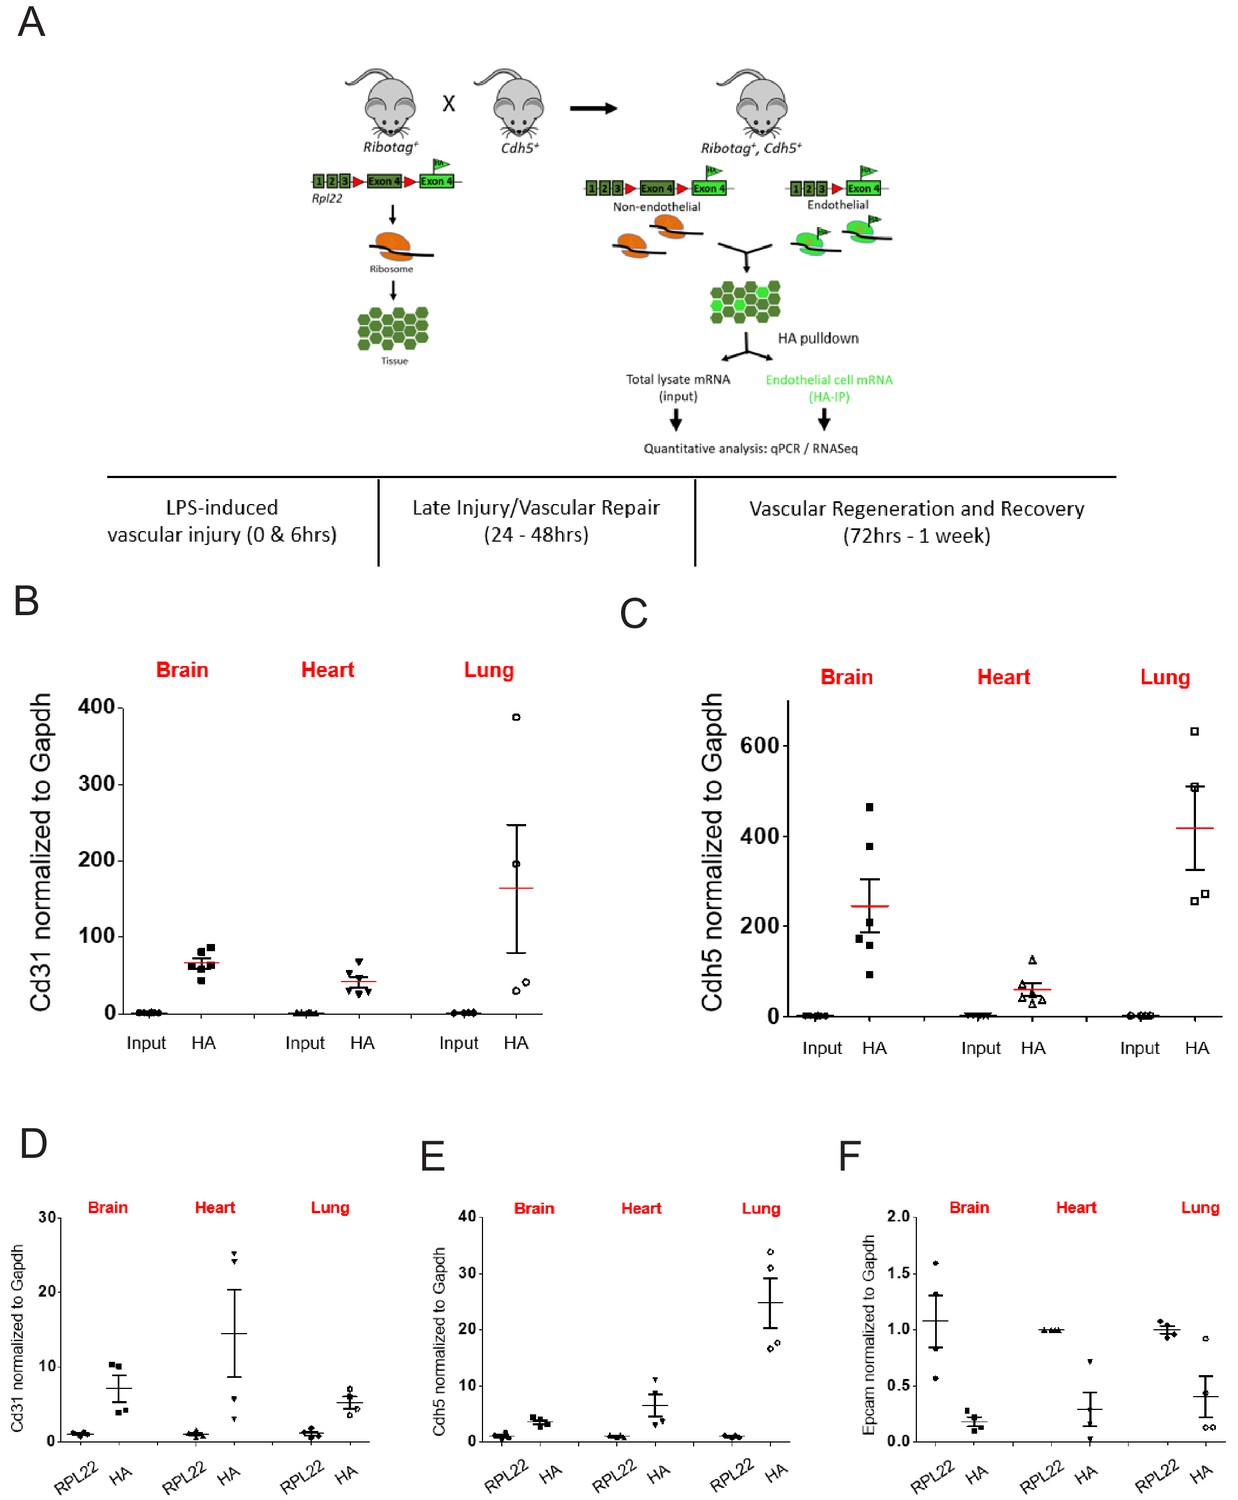
RiboTag Isolation of endothelial mRNA.
(A) Schematic of RiboTag method for isolating the endothelial-specific translatome at various time points during LPS induced inflammatory injury, repair, and regeneration. (B–D) Mice brain, lung, and heart RiboTagEC samples were homogenized with ice-cold homogenization buffer. mRNA from total lysate input and IP with HA antibody were used for RT-qPCR to compare (A) CD31, (B) Cdh5 (VE-cadherin). (D–F) RiboTagEC mice brain, lung, and heart samples were homogenized with ice-cold homogenization buffer. Total ribosome associated mRNA (IP with anti-RPL22) and endothelial specific ribosome associated mRNA (IP with anti-HA) were used for RT-qPCR to compare (D) Cd31 and (E) Cdh5 (VE-cadherin) (F) Epcam mRNA levels.
Figure 1—figure supplement 2
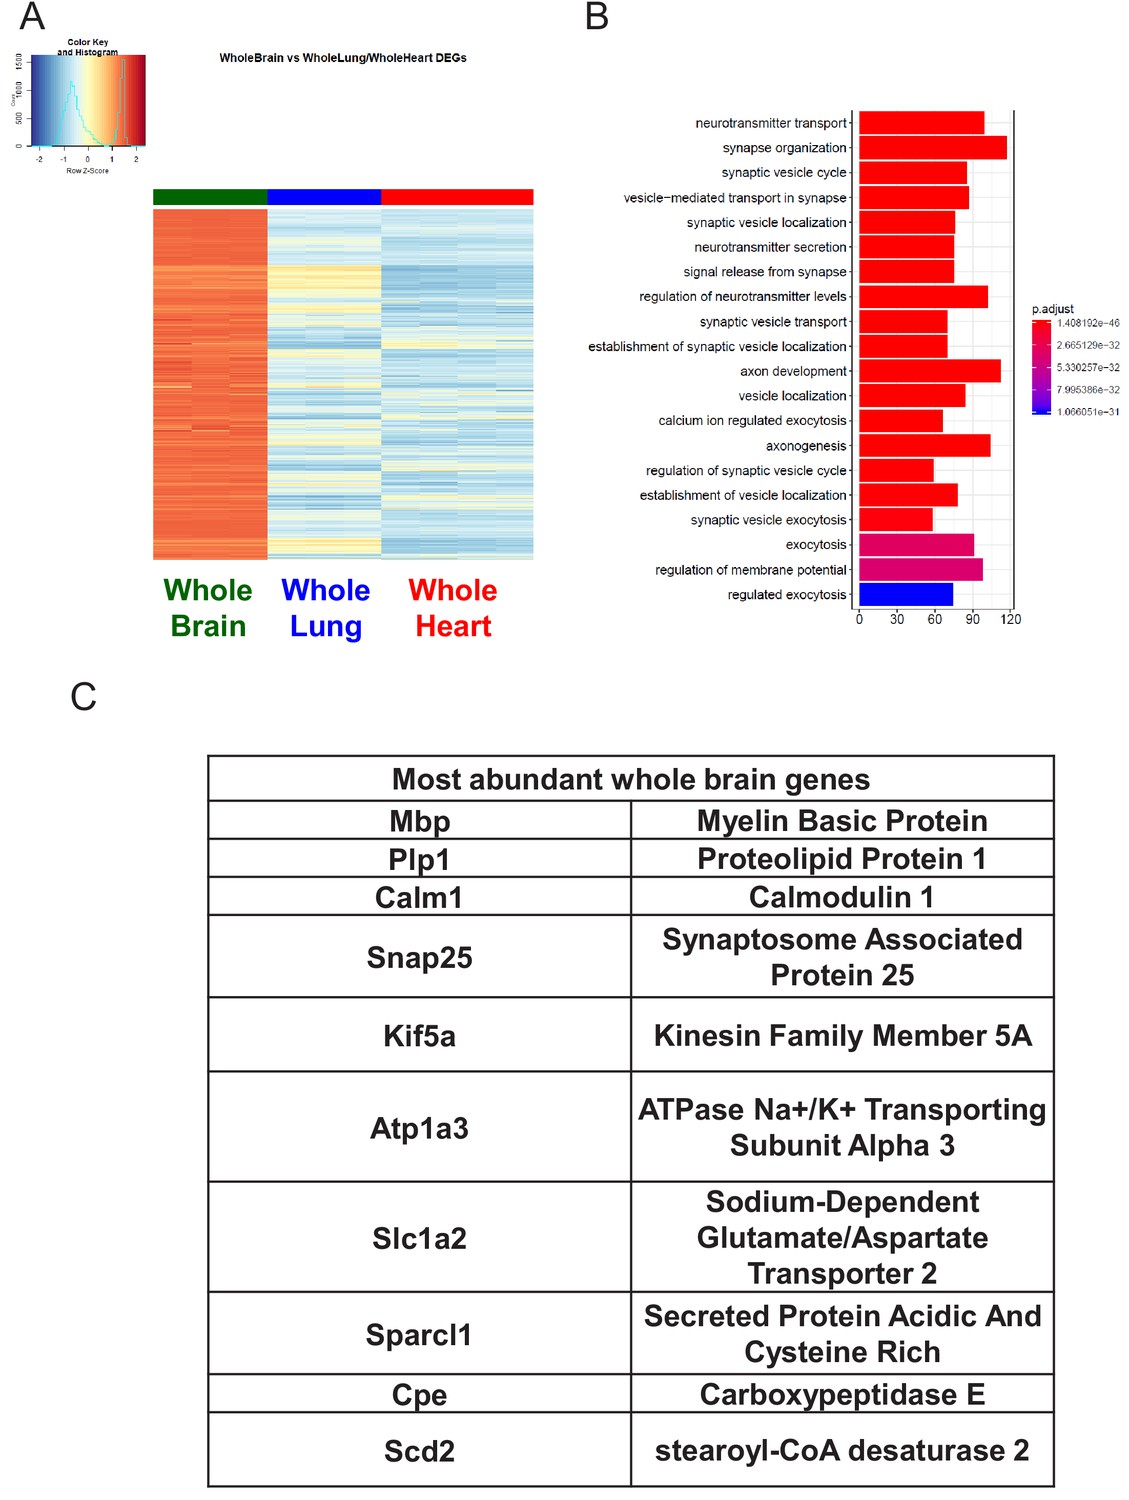
Characterization of Whole Brain RNA-Seq data.
(A) Heat map representation of differentially upregulated genes identified by comparing whole brain RNA-Seq samples to whole lung and whole heart tissues at baseline. The blue to white to red gradient represents increasing expression of the pathway with blue representing minimal expression while the red represents high expression of the pathway. (B) The GSEA results of enriched GO terms from whole brain samples at baseline. (C) Top whole brain signature genes ranked in order of abundance.
Figure 1—figure supplement 3
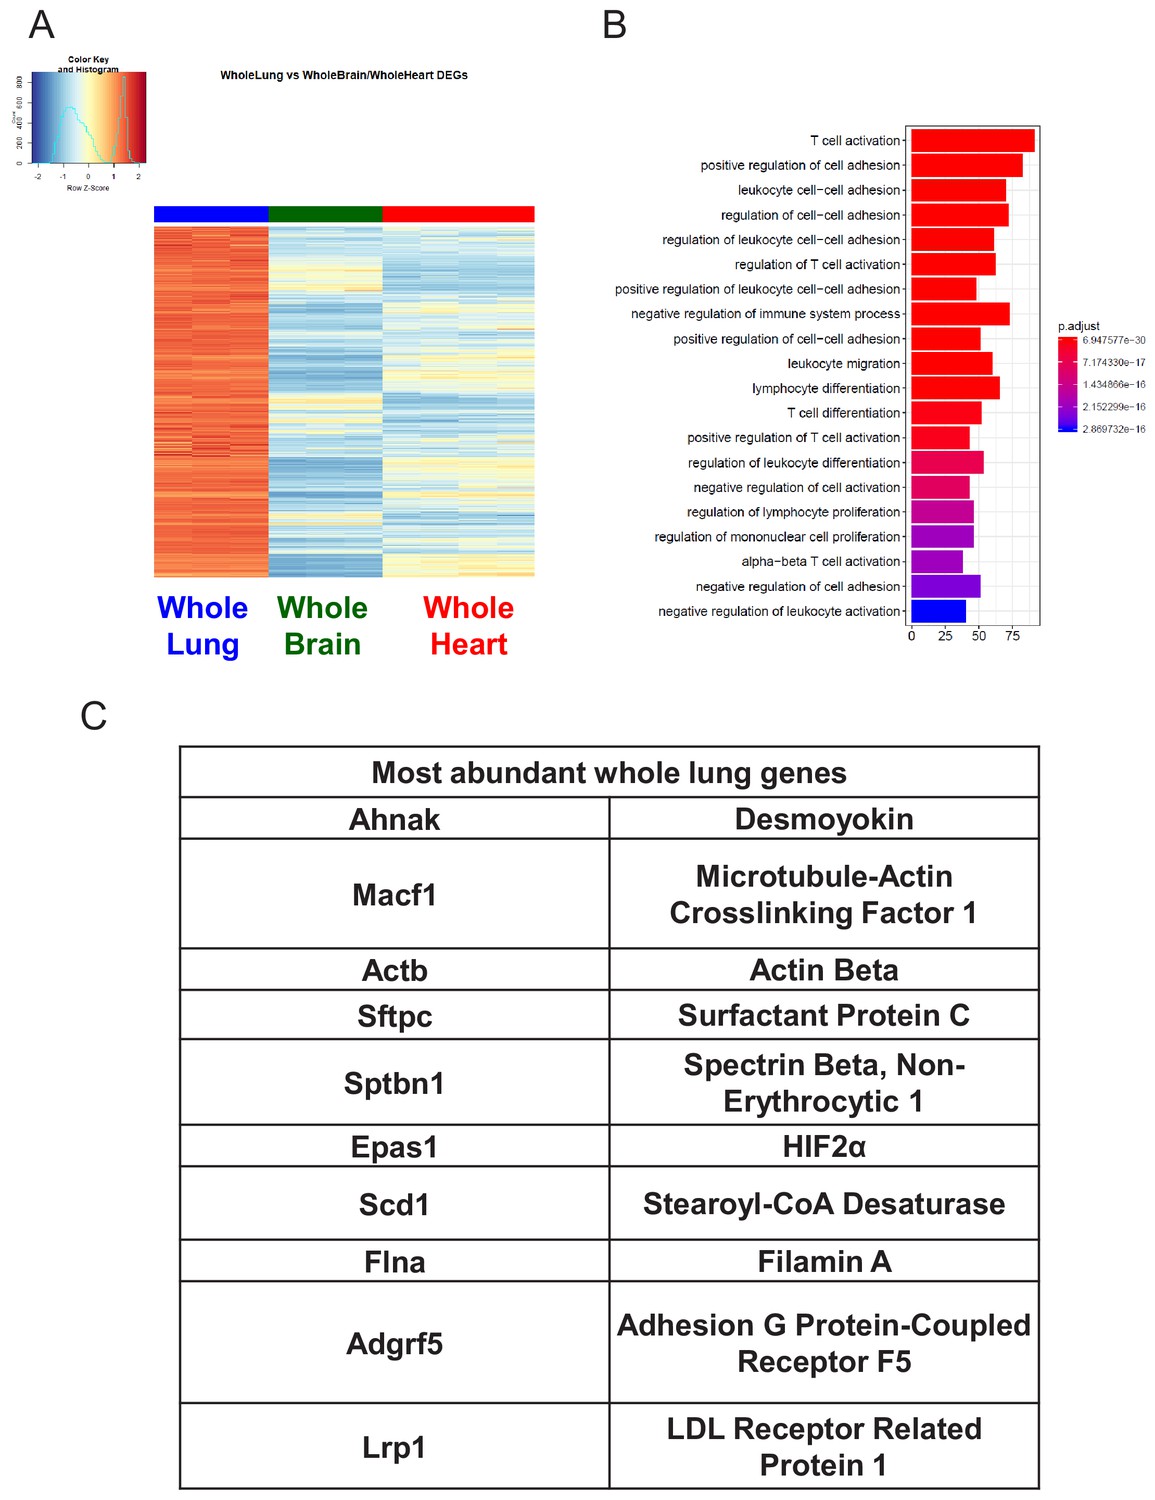
Characterization of Whole Lung RNA-Seq data.
(A) Heat map representation of differentially upregulated genes identified by comparing whole lung RNA-Seq samples to whole brain and whole heart tissues at baseline. The blue to white to red gradient represents increasing expression of the pathway with blue representing minimal expression while the red represents high expression of the pathway. (B) The GSEA results of enriched GO terms from whole lung samples at baseline. (C) Top whole lung signature genes ranked in order of abundance.
Figure 1—figure supplement 4
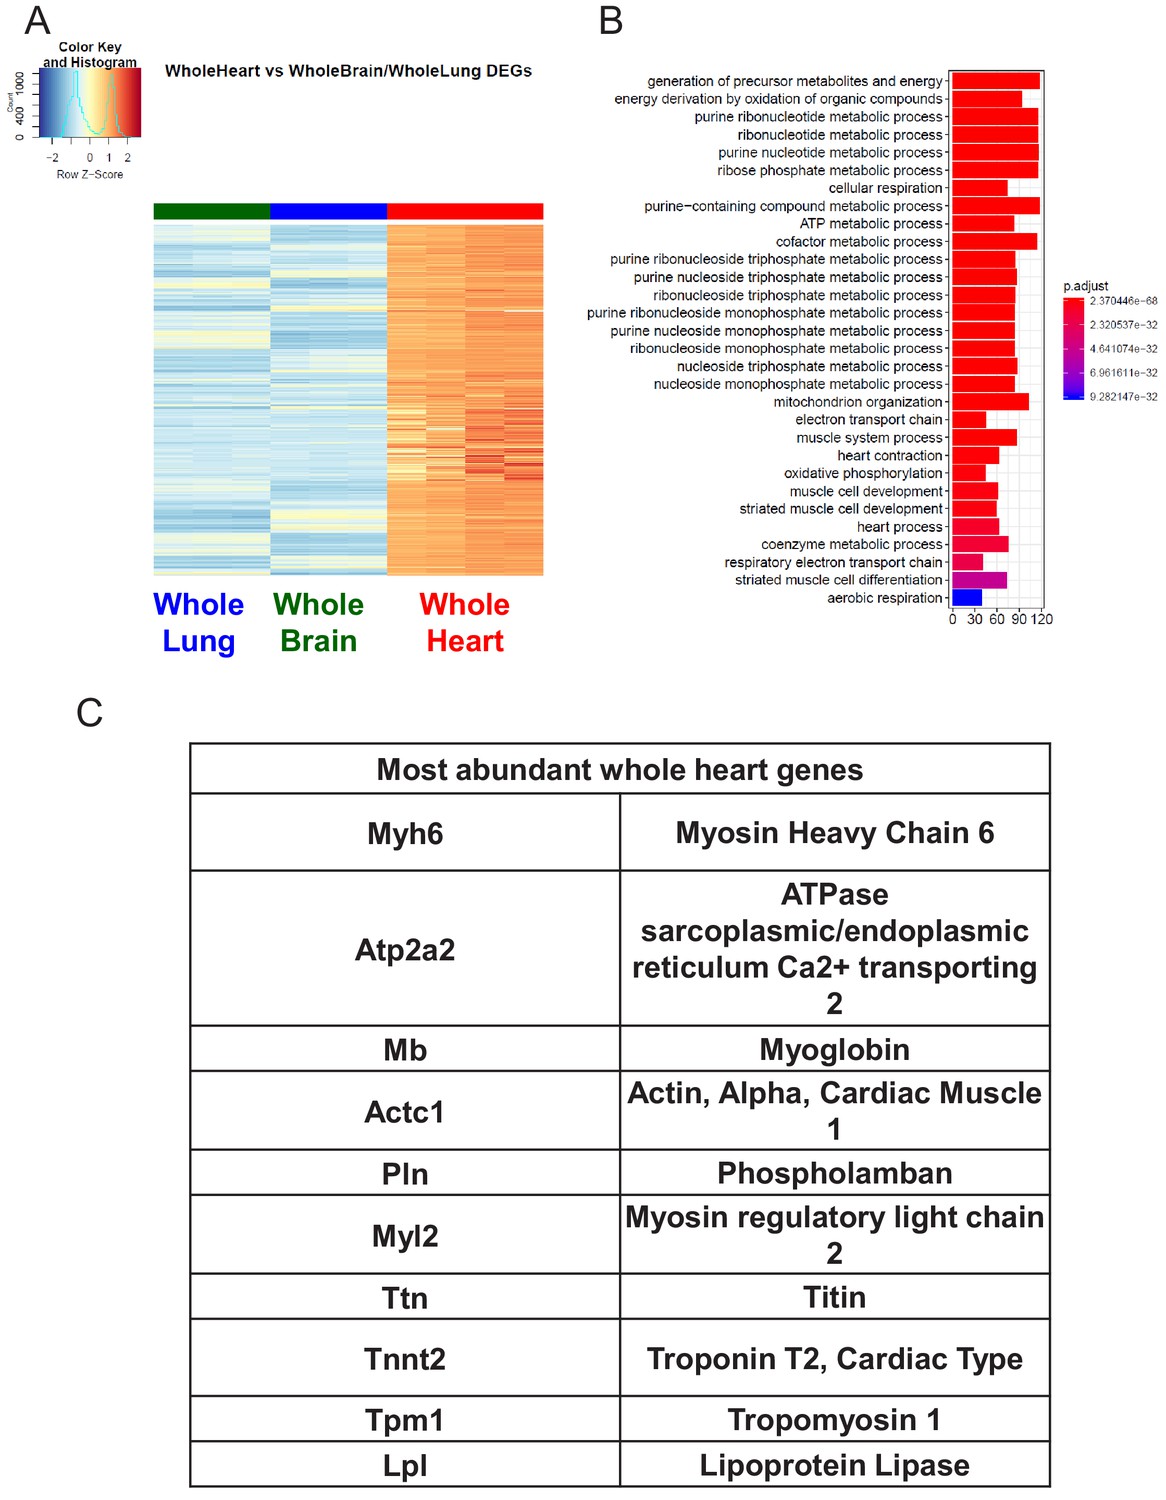
Characterization of Whole Heart RNA-Seq data.
(A) Heat map representation of differentially upregulated genes identified by comparing whole heart RNA-Seq samples to whole brain and whole lung tissues at baseline. The blue to white to red gradient represents increasing expression of the pathway with blue representing minimal expression while the red represents high expression of the pathway. (B) The GSEA results of enriched GO terms from whole heart samples at baseline. (C) Top whole heart signature genes ranked in order of abundance.
Figure 1—figure supplement 5
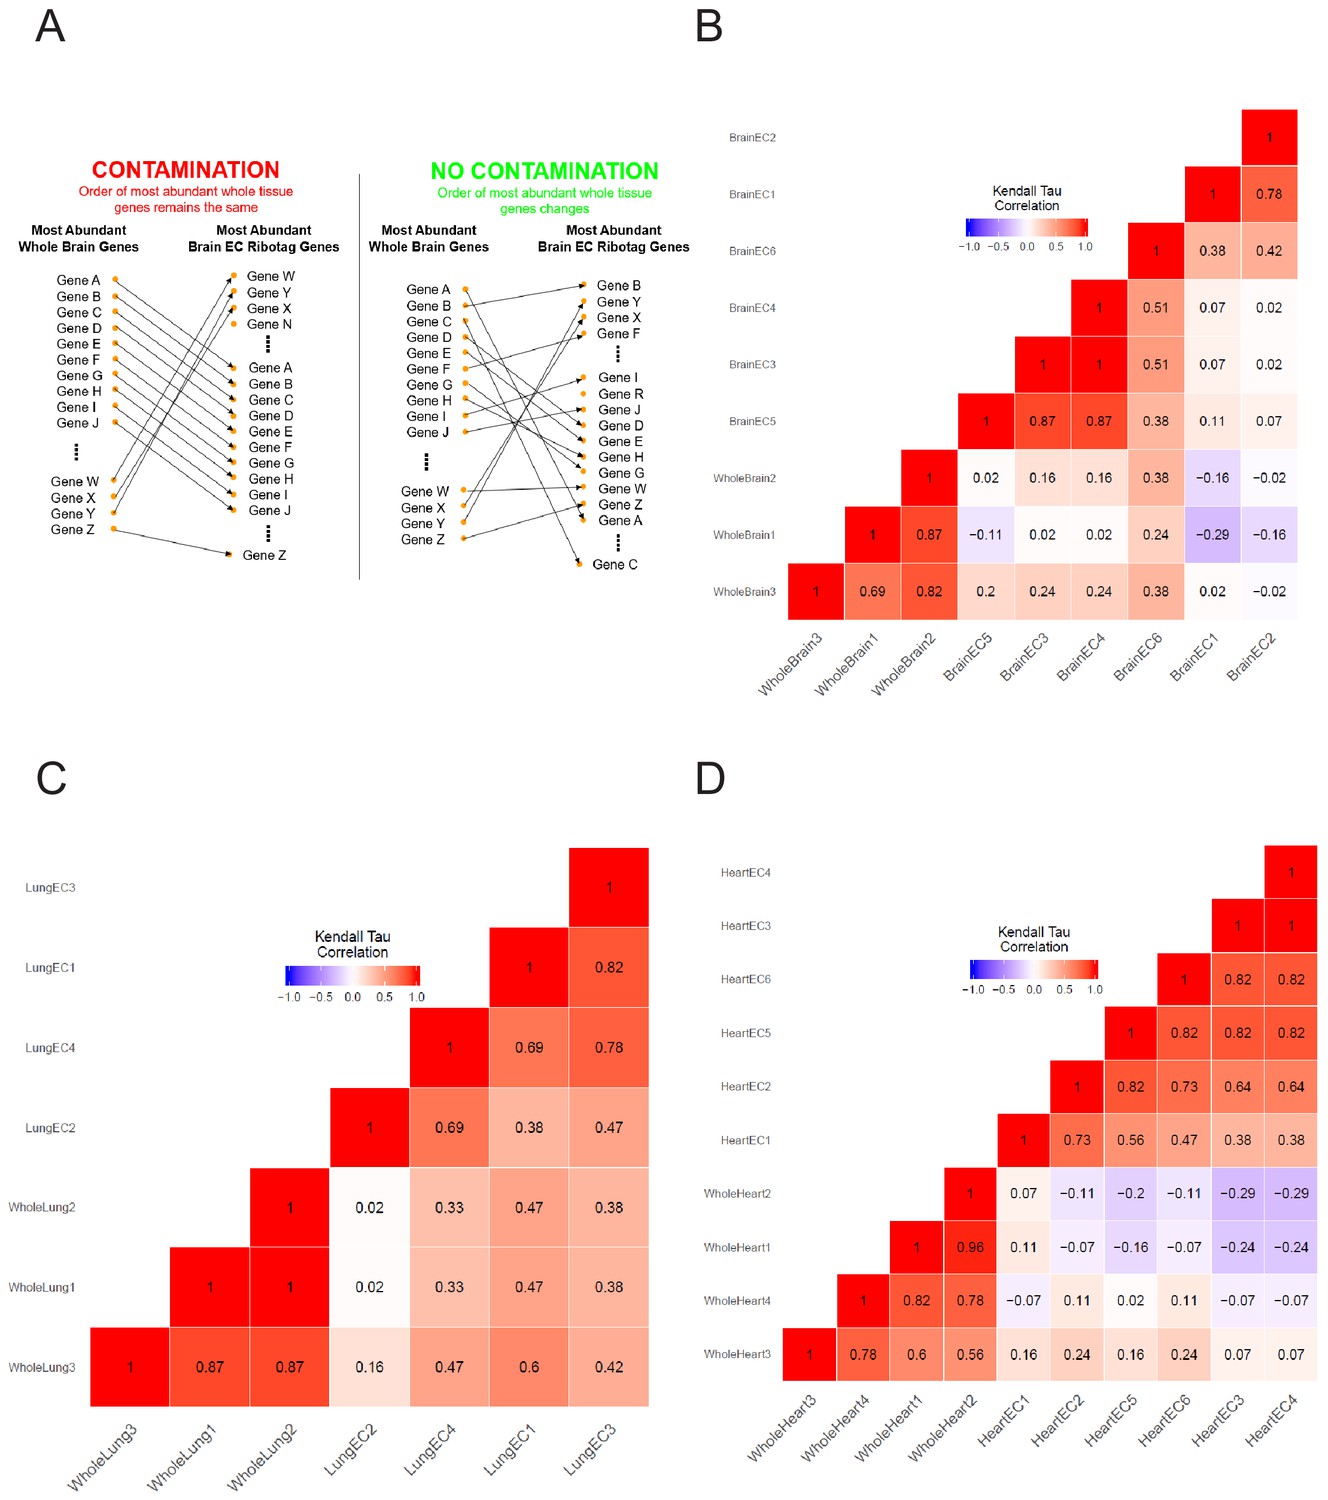
Kendall’s Tau correlation supports endothelial mRNA isolation from RiboTagEC mice.
(A) Schematic of assessing endothelial purity in RiboTagEC using Kendall’s Tau correlation shows rearrangement in the rank of most abundant genes between whole tissue and endothelial samples supports purity of the endothelial samples. (B–D) Kendall’s Tau non-parametric correlation plots for whole tissue and RiboTagEC RNA-Seq samples for (B) brain, (C) lung, and (D) heart tissue.
Figure 2
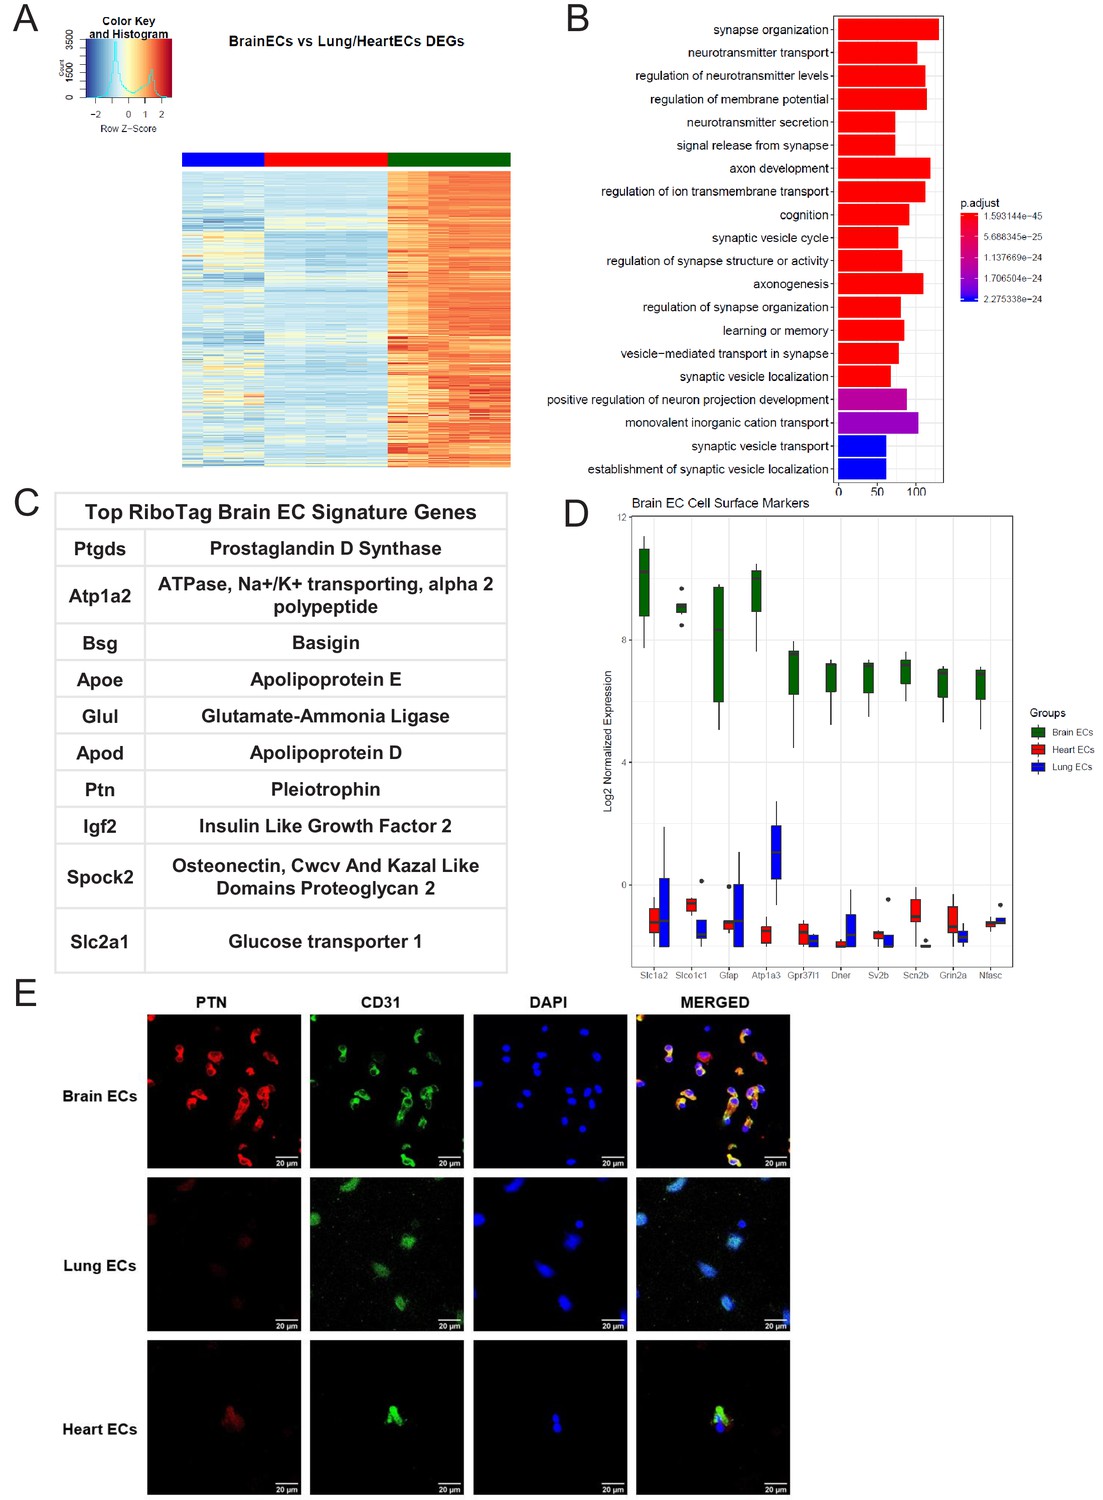
Brain endothelial specific signature.
(A) Heat map representation of differentially upregulated genes identified by comparing brain ECs to lung and heart ECs at baseline. The blue to white to red gradient represents increasing expression of the pathway with blue representing minimal expression while the red represents high expression of the pathway. Individual gene expression values can be visualized at www.rehmanlab.org/ribo (B) The GSEA results of enriched GO terms from RiboTag brain ECs at baseline. (C) Top RiboTag brain EC signature markers ranked in order of logFC. (D) Top RiboTag brain EC cell surface markers identified using the Cell Surface Protein Atlas. (E) Confocal analysis was performed after brain, lung, and heart ECs were processed on a cytospin to assess brain EC PTN (Pleotrophin) specificity. A scale bar of 20 µm is included on all images.
Figure 3
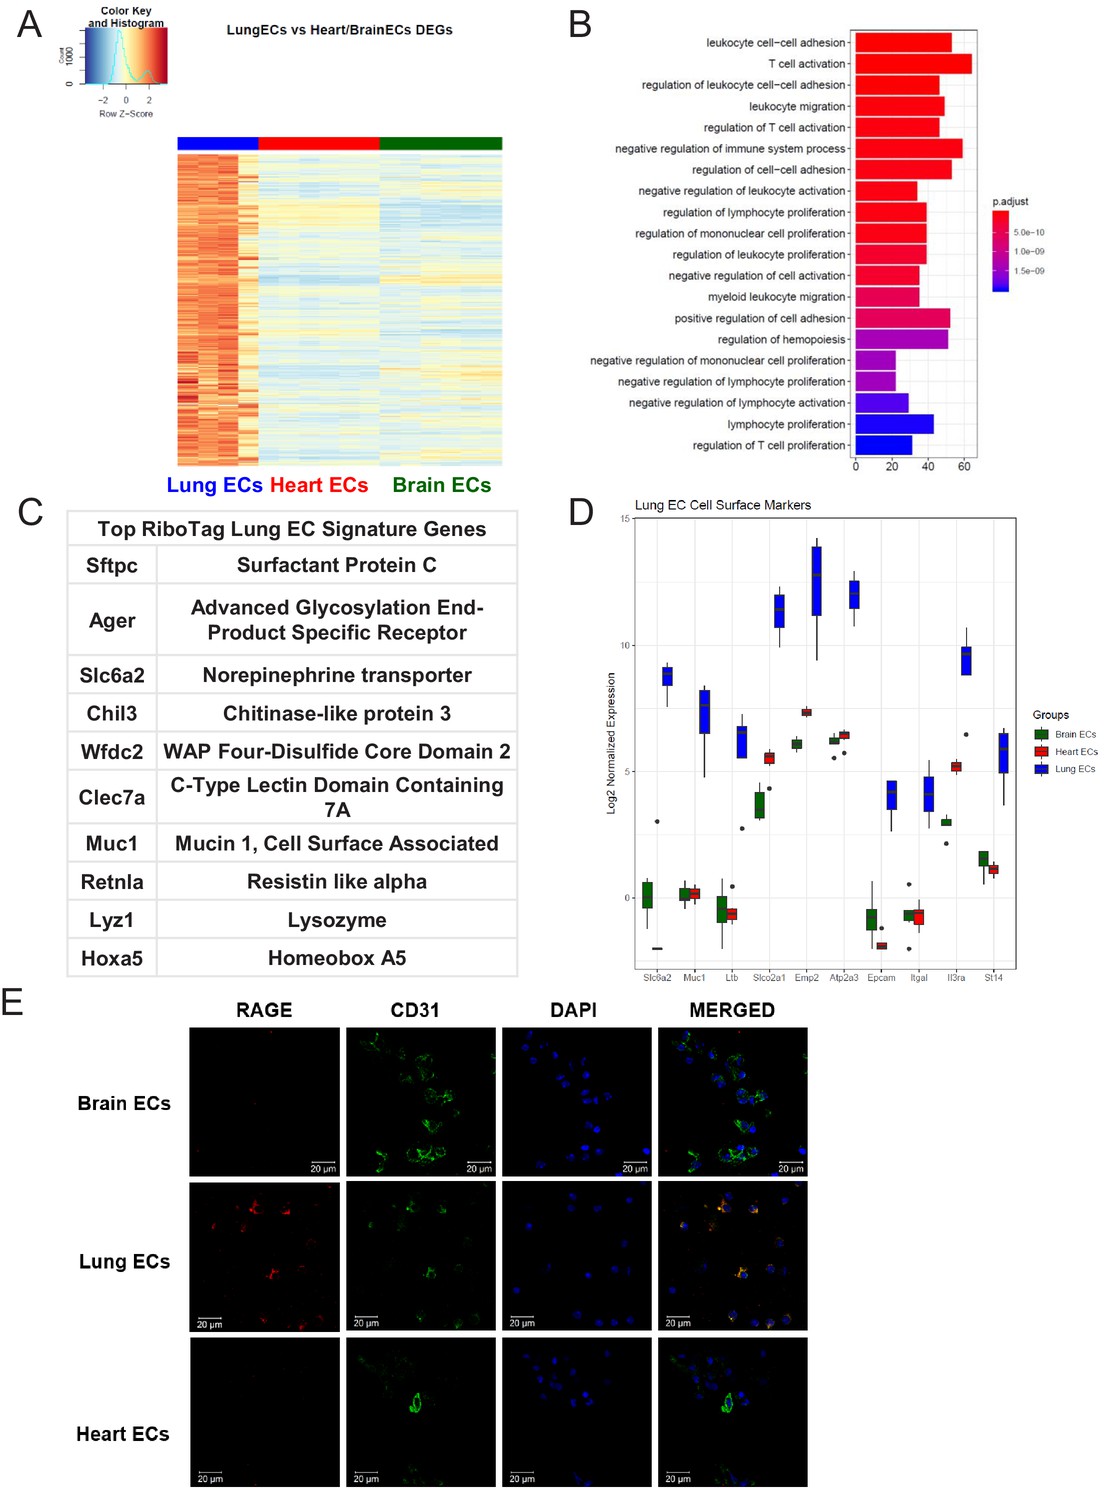
Lung endothelial specific signature.
(A) Heat map representation of differentially upregulated genes identified by comparing lung ECs to brain and heart ECs at baseline. The blue to white to red gradient represents increasing expression of the pathway with blue representing minimal expression while the red represents high expression of the pathway. Individual gene expression values can be visualized at www.rehmanlab.org/ribo (B) The GSEA results of enriched GO terms from RiboTag lung ECs at baseline. (C) Top RiboTag lung EC signature markers ranked in order of logFC. (D) Top RiboTag lung EC cell surface markers identified using the Cell Surface Protein Atlas. (E) Confocal analysis was performed after brain, lung, and heart ECs were processed on a cytospin to assess lung EC RAGE (Receptor for Advanced Glycation Endproducts) specificity. A scale bar of 20 µm is included on all images.
Figure 4

Heart endothelial specific signature (A) Heat map representation of differentially upregulated genes identified by comparing heart ECs to brain and lung ECs at baseline.
The blue to white to red gradient represents increasing expression of the pathway with blue representing minimal expression while the red represents high expression of the pathway. Individual gene expression values can be visualized at www.rehmanlab.org/ribo (B) The GSEA results of enriched GO terms from RiboTag heart ECs at baseline. (C) Top RiboTag heart EC signature markers ranked in order of logFC. (D) Top RiboTag heart EC cell surface markers identified using the Cell Surface Protein Atlas. (E) Confocal analysis was performed after brain, lung, and heart ECs were processed on a cytospin to assess heart EC AQP7 (Aquaporin 7) specificity. A scale bar of 20 µm is included on all images.
Figure 5
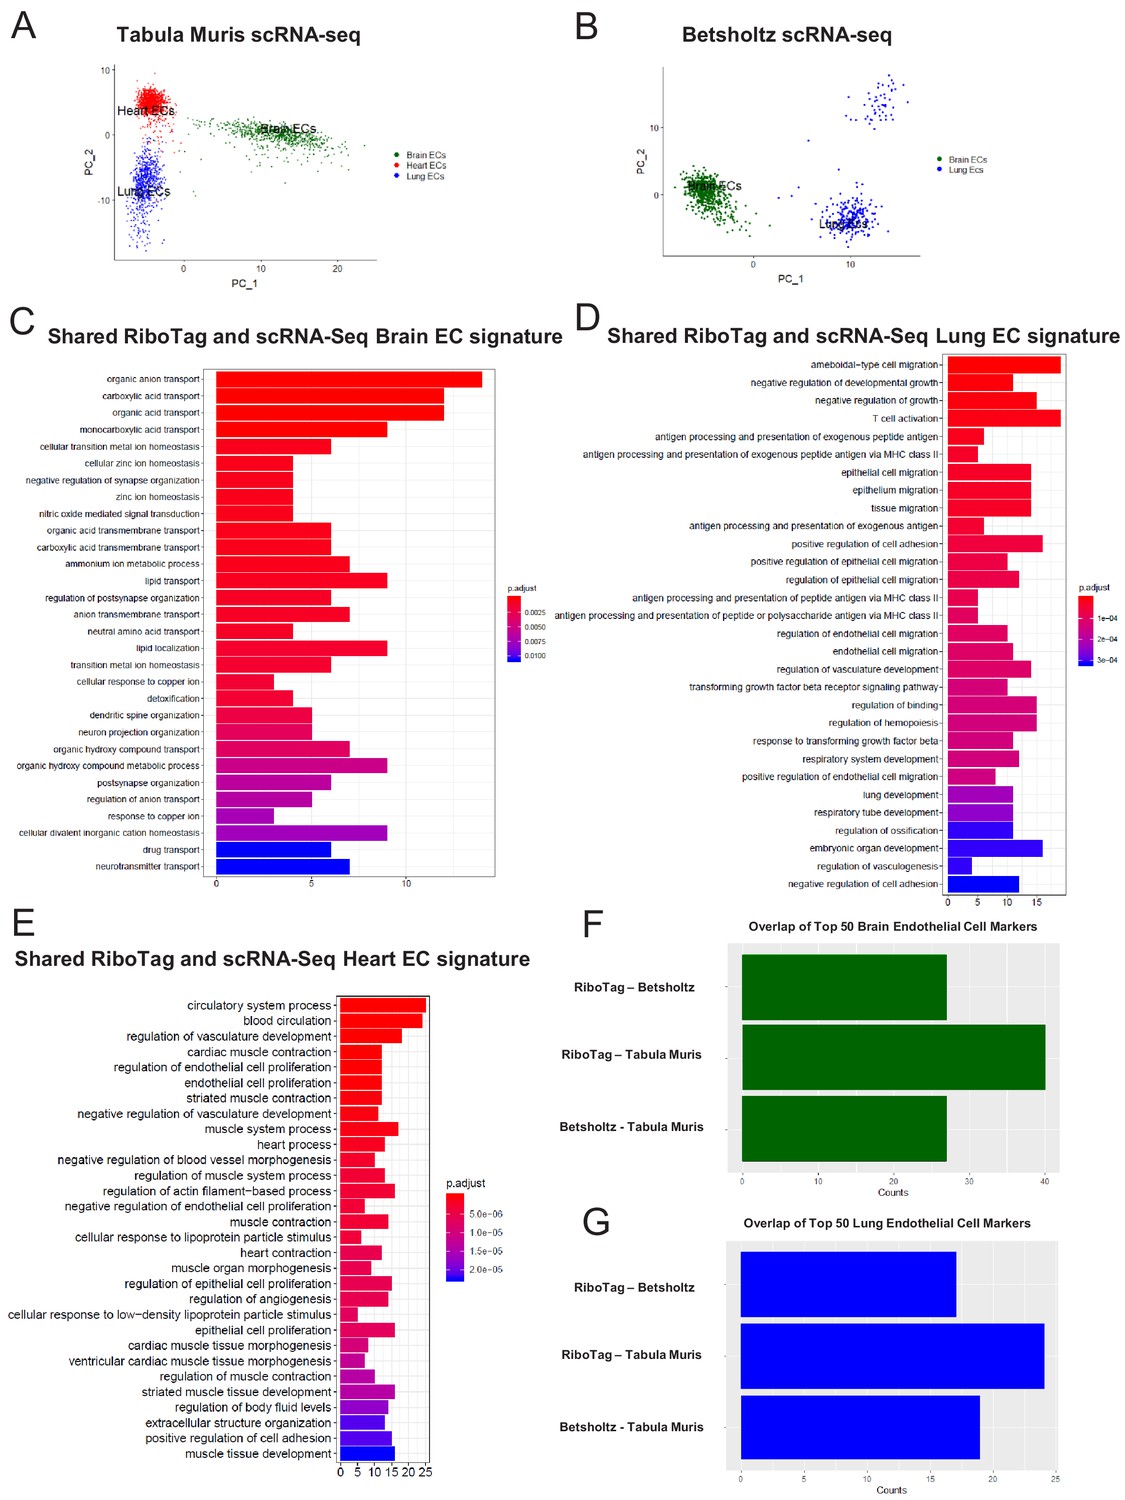
Single-cell endothelial heterogeneity (A) PCA of endothelial scRNA-Seq data from the Tabula Muris collection of mouse tissues colored by tissue.
(B) PCA of endothelial scRNA-Seq data from the Betsholtz Lab of mouse tissues colored by tissue. The GSEA results of enriched GO terms from overlapping differentially expressed genes between RiboTag and Betsholtz or Tabula Muris for (C) brain ECs, (D) lung ECs, and (E) heart ECs. (F) Overlap of top 50 scRNA-Seq brain EC marker genes with RiboTag brain EC marker genes. (G) Overlap of top 50 scRNA-Seq lung EC marker genes with RiboTag lung EC marker genes.
Figure 6 with 1 supplement
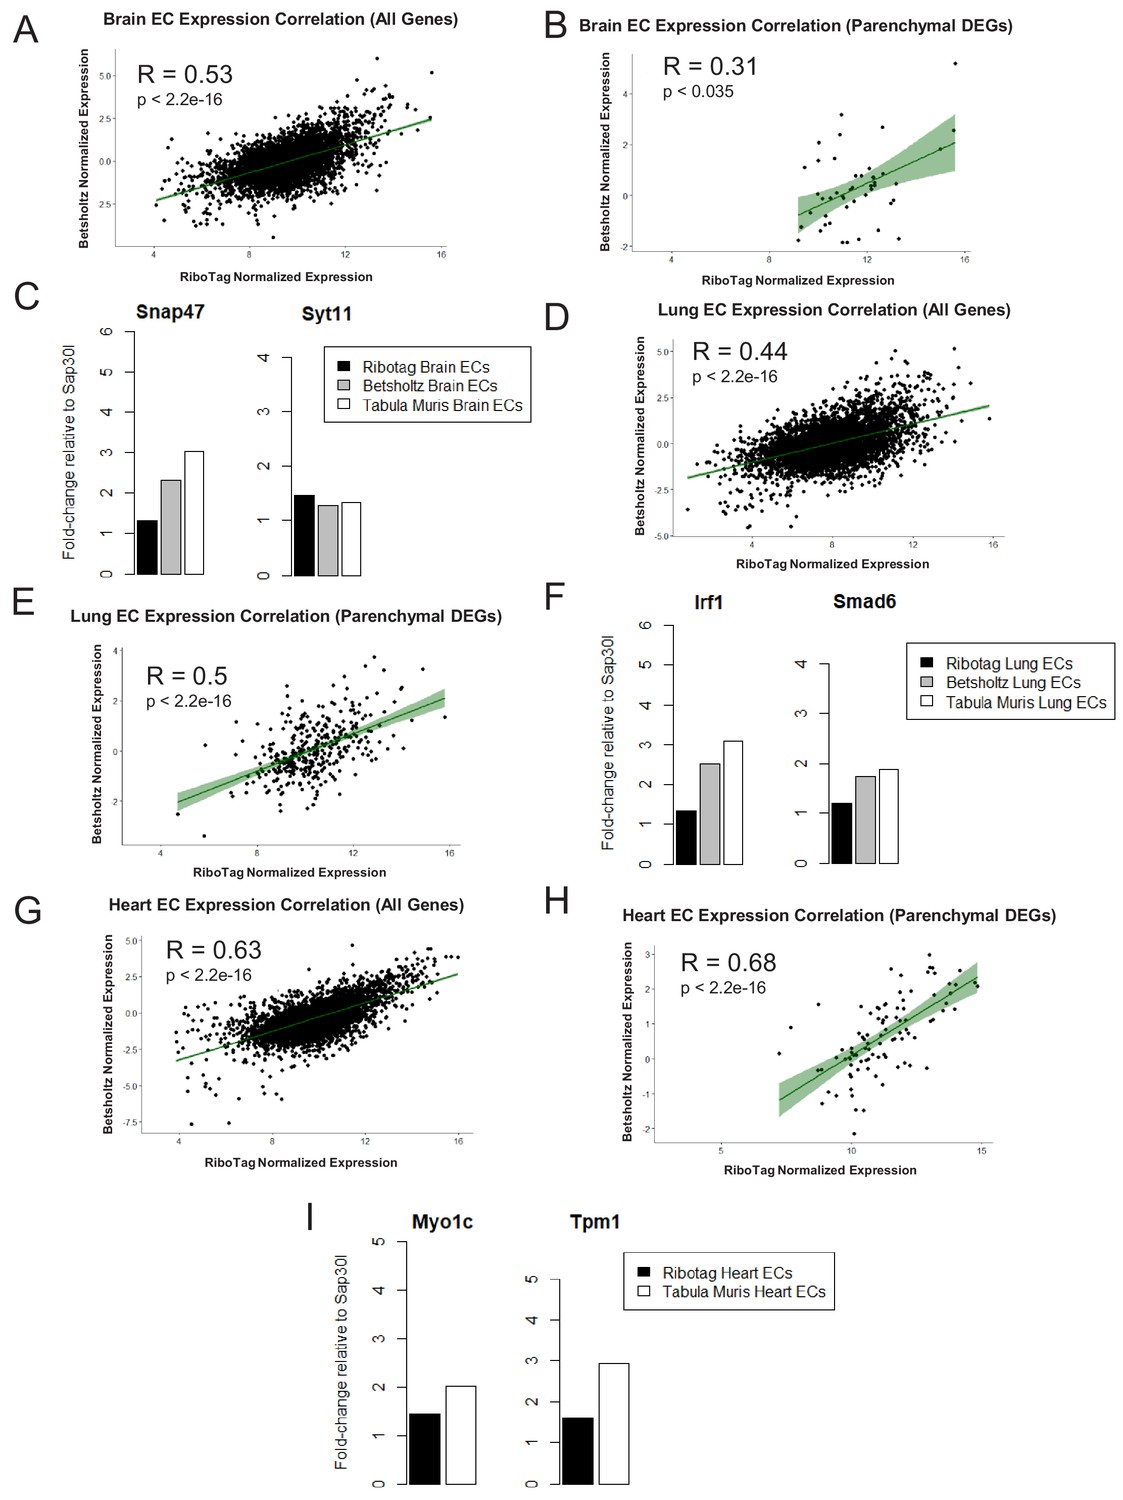
Expression Correlation Analysis between endothelial gene expression generated by RiboTag, Betsholtz, and Tabula Muris Spearman correlation scatter plots of average gene expression in RiboTag bulk RNA-Seq, Betsholtz scRNA-Seq (Smart-Seq2), and Tabula Muris scRNA-Seq (10x Genomics).
(A) All genes detected in brain ECs. (B) Parenchymal (non-endothelial) genes detected in brain ECs. (C) All genes detected in lung ECs. (D) Parenchymal (non-endothelial) genes detected in lung ECs. (E) All genes detected in heart ECs. (F) Parenchymal (non-endothelial) genes detected in heart ECs.
Figure 6—figure supplement 1
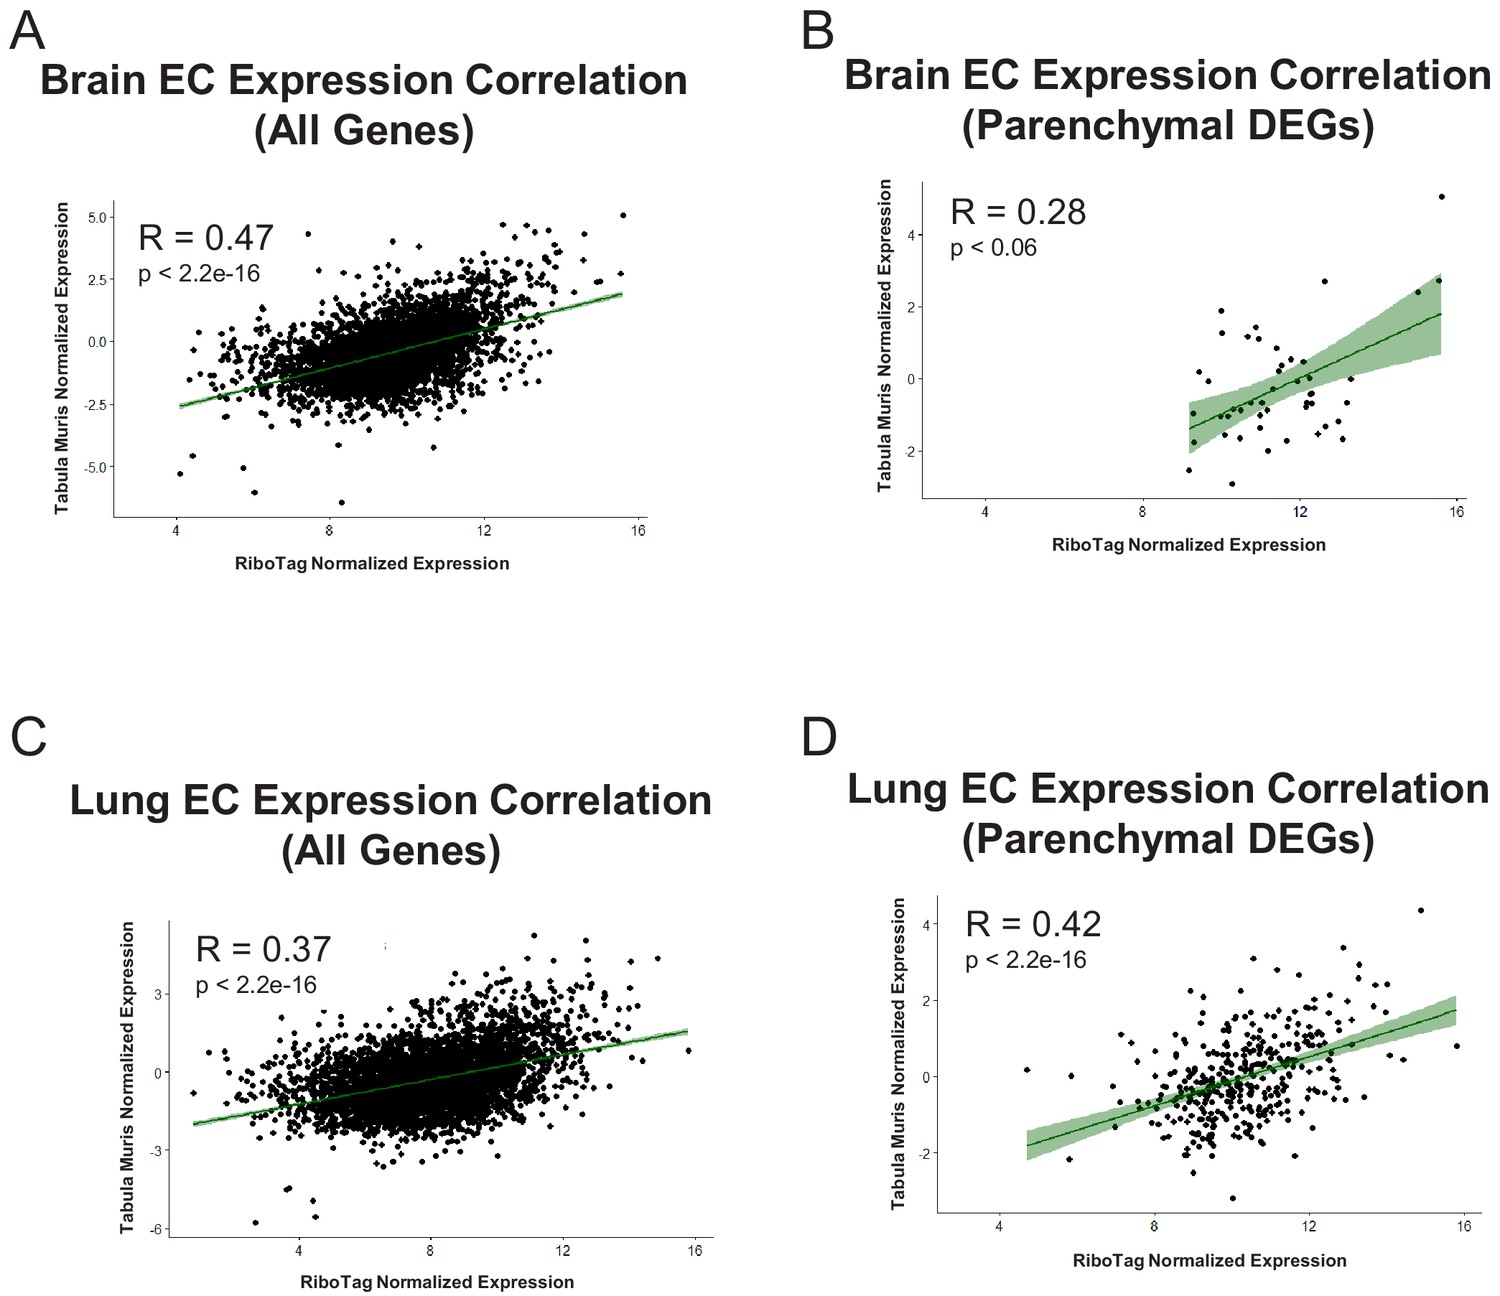
Endothelial gene expression correlation analysis across three distinct datasets (RiboTag Endothelial Translatome, Betsholtz single-cell transcriptomics, Tabula Muris single-cell transcriptomics).
Spearman correlation scatter plots of average gene expression in RiboTag bulk RNA-Seq and Betsholtz scRNA-Seq were generated for (A) all genes detected in brain ECs and (B) parenchymal (non-endothelial) genes detected in brain ECs. (C) Average expression level of representative brain EC parenchymal genes. Spearman correlation scatter plots of average gene expression in RiboTag bulk RNA-Seq and Betsholtz scRNA-Seq were generated for (D) all genes detected in lung ECs and (E) parenchymal (non-endothelial) genes detected in lung ECs (F) Average expression level of representative lung EC parenchymal genes. Spearman correlation scatter plots of average gene expression in RiboTag bulk RNA-Seq and Tabula Muris scRNA-Seq were generated for (D) all genes detected in heart ECs and (E) parenchymal (non-endothelial) genes detected in heart ECs (F) Average expression level of representative heart EC parenchymal genes.
Figure 7
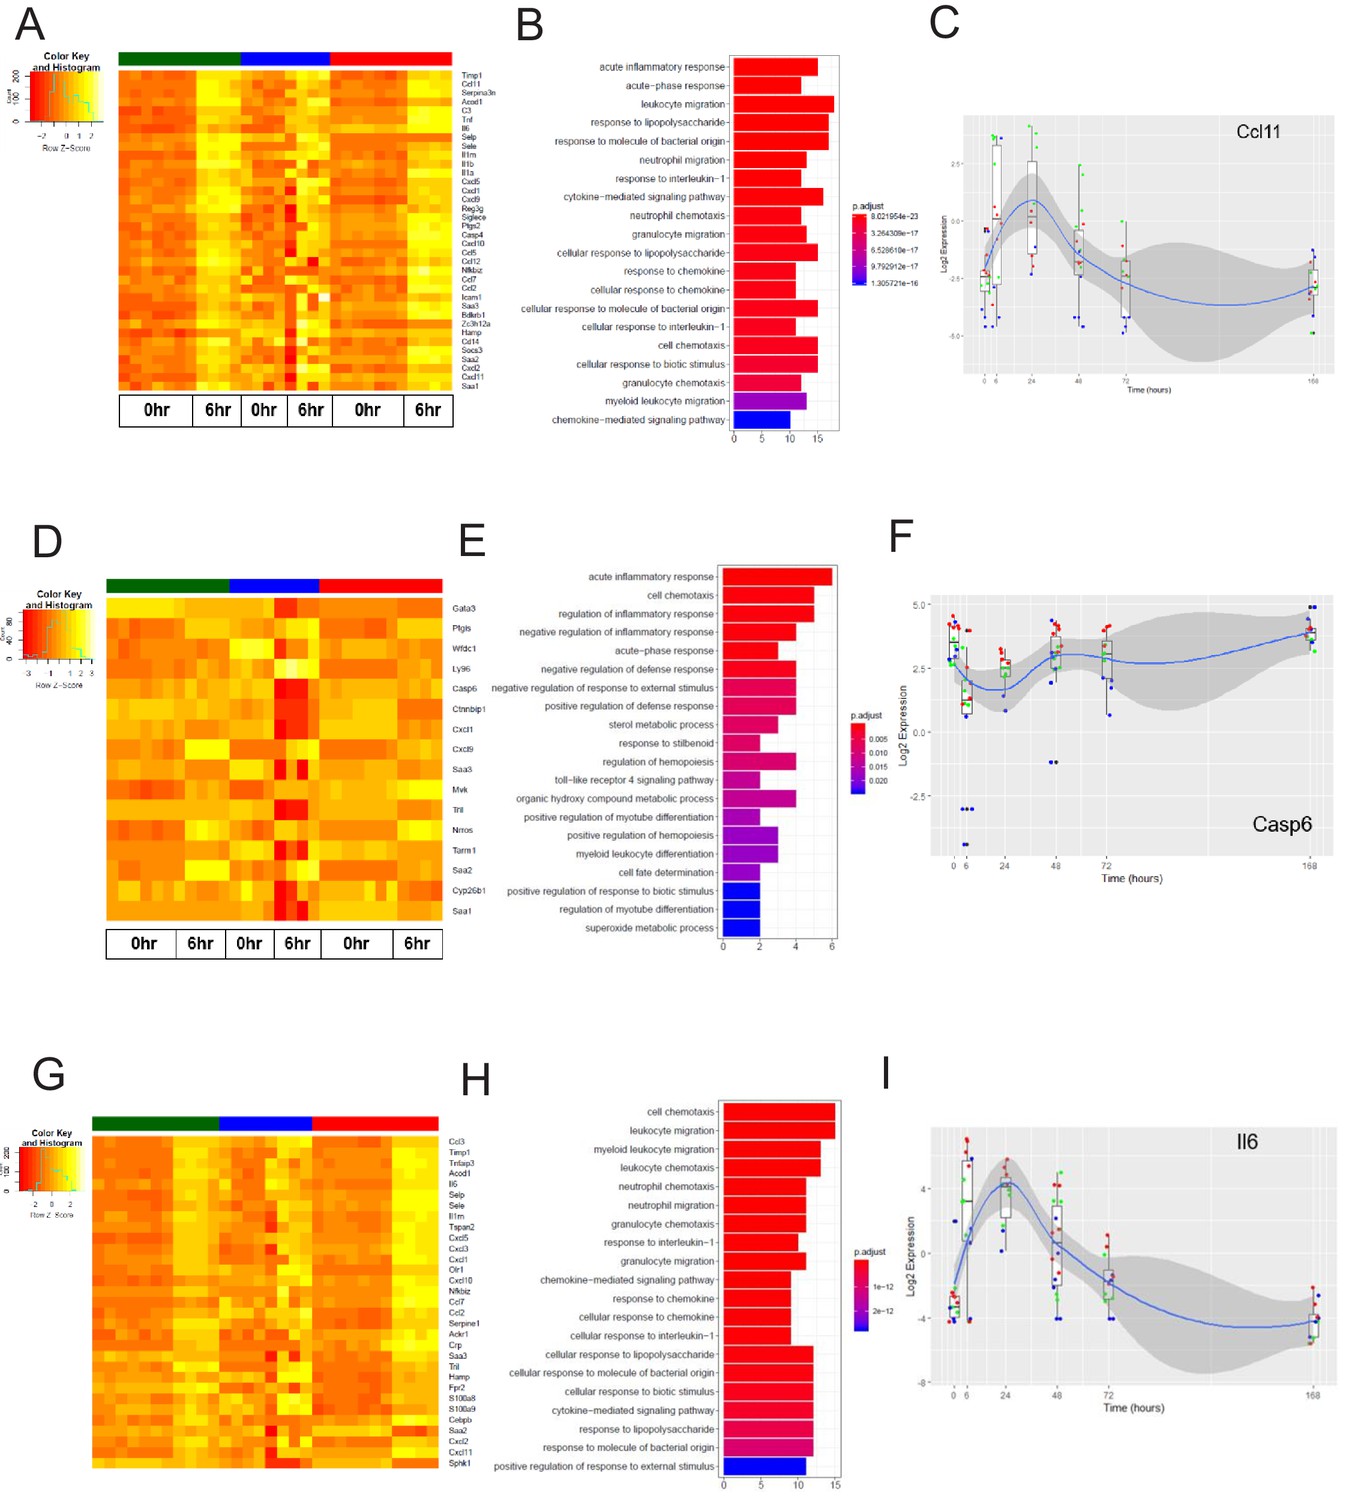
The early inflammation (6 hr) markers across organ-specific endothelial cells.
(A) Heat map representation of differentially expressed genes identified by comparing brain ECs to lung and heart ECs at the 6 hr time point. The orange to yellow to white gradient represents increasing expression of the pathway with orange representing minimal expression while the white represents high expression of the pathway. (B) The GSEA results of enriched GO terms from RiboTag brain ECs at the 6 hr time point. (C) Tissue-specific kinetics of a specific RiboTag brain EC early inflammatory marker during the progression and resolution of inflammation. (D) Heat map representation of differentially expressed genes identified by comparing lung ECs to brain and heart ECs at the 6 hr time point. The orange to yellow to white gradient represents increasing expression of the pathway with orange representing minimal expression while the white represents high expression of the pathway. (E) The GSEA results of enriched GO terms from RiboTag lung ECs at the 6 hr time point. (F) Tissue-specific kinetics of a specific RiboTag lung EC early inflammatory marker during the progression and resolution of inflammation. (G) Heat map representation of differentially expressed genes identified by comparing heart ECs to brain and lung ECs at the 6 hr time point. The orange to yellow to white gradient represents increasing expression of the pathway with orange representing minimal expression while the white represents high expression of the pathway. (H) The GSEA results of enriched GO terms from RiboTag heart ECs at the 6 hr time point. (I) Tissue-specific kinetics of a specific RiboTag heart EC early inflammatory marker during the progression and resolution of inflammation.
Figure 8 with 1 supplement
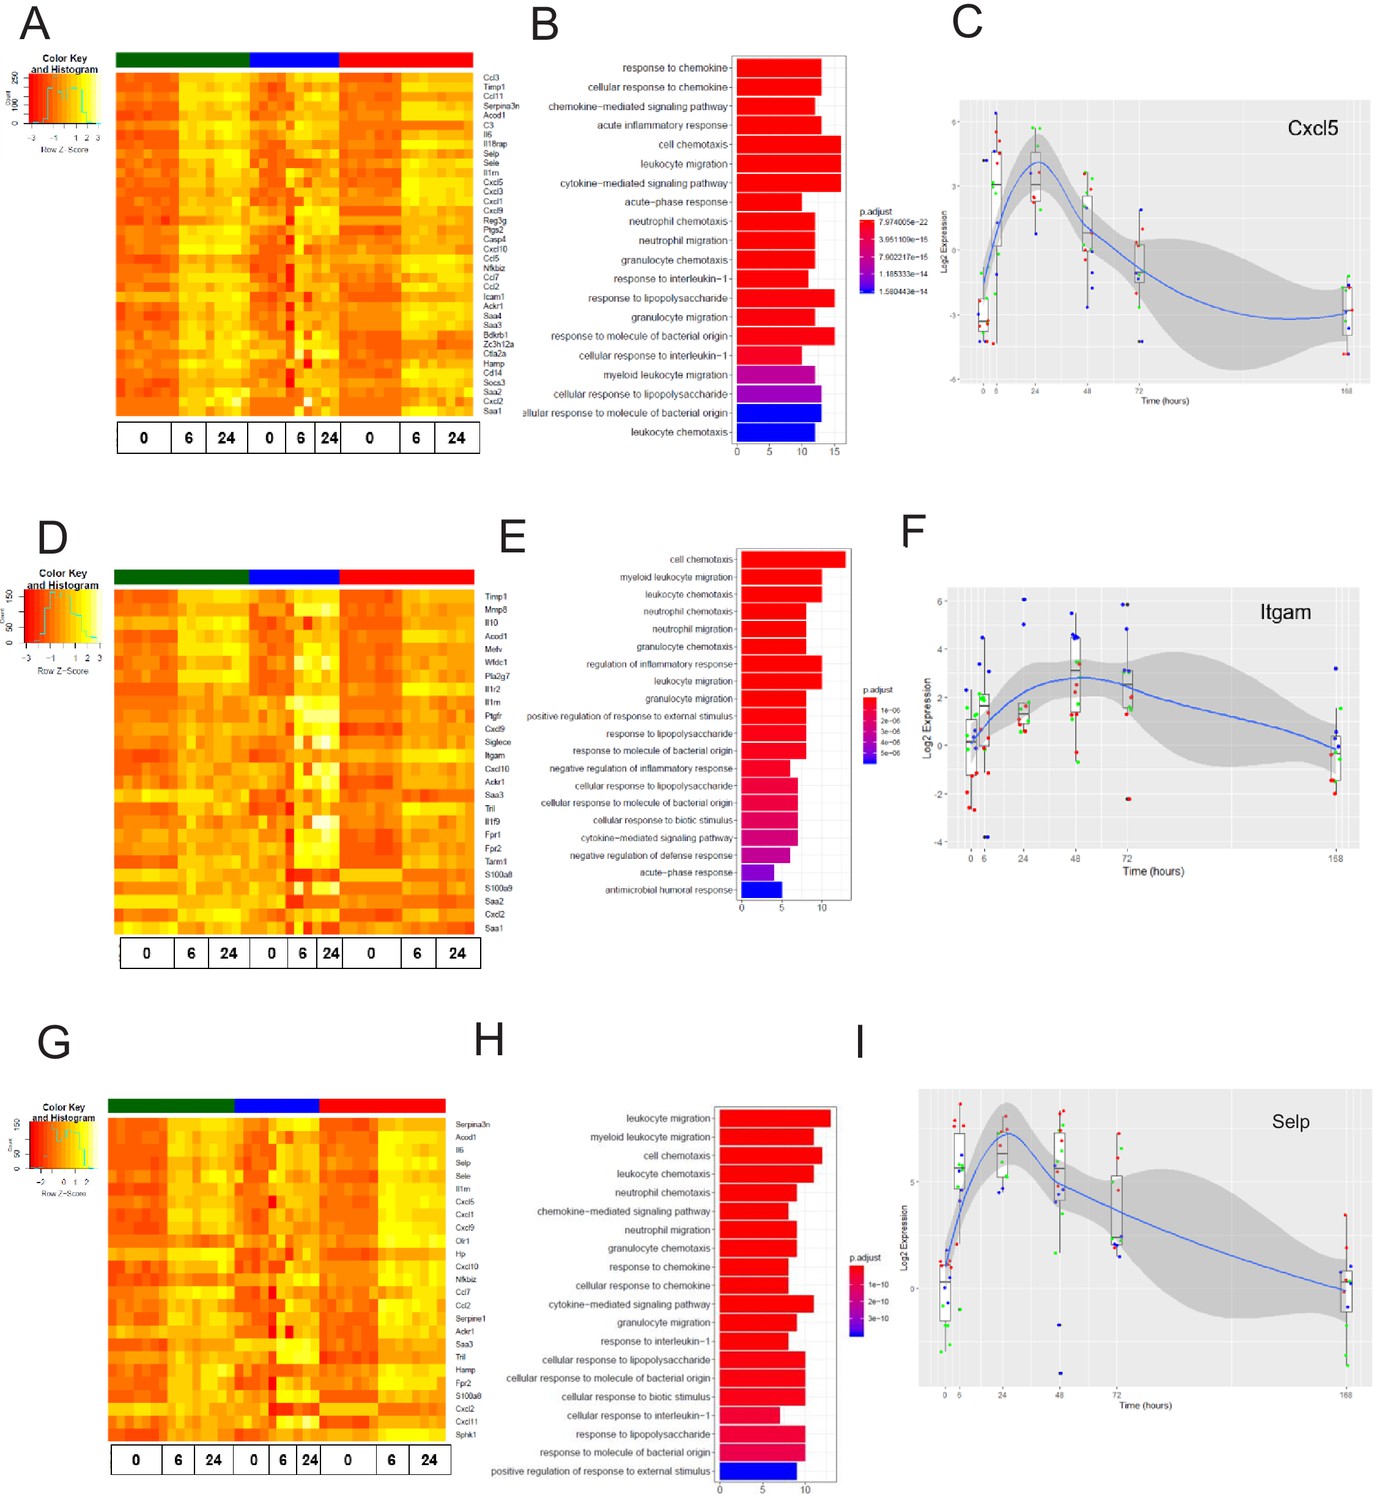
The late inflammation (24 hr) markers across organ-specific endothelial cells.
Heat map representation of differentially expressed genes identified by comparing brain ECs to lung and heart ECs at the 24 hr time point. The orange to yellow to white gradient represents increasing expression of the pathway with orange representing minimal expression while the white represents high expression of the pathway. (B) The GSEA results of enriched GO terms from RiboTag brain ECs at the 24 hr time point. (C) Tissue-specific kinetics of a specific RiboTag brain EC late inflammatory marker during the progression and resolution of inflammation. (D) Heat map representation of differentially expressed genes identified by comparing lung ECs to brain and heart ECs at the 24 hr time point. The orange to yellow to white gradient represents increasing expression of the pathway with orange representing minimal expression while the white represents high expression of the pathway. (E) The GSEA results of enriched GO terms from RiboTag lung ECs at the 24 hr time point. (F) Tissue-specific kinetics of a specific RiboTag lung EC late inflammatory marker during the progression and resolution of inflammation. (G) Heat map representation of differentially expressed genes identified by comparing heart ECs to brain and lung ECs at the 24 hr time point. The orange to yellow to white gradient represents increasing expression of the pathway with orange representing minimal expression while the white represents high expression of the pathway. (H) The GSEA results of enriched GO terms from RiboTag heart ECs at the 24 hr time point. (I) Tissue-specific kinetics of a specific RiboTag heart EC late inflammatory marker during the progression and resolution of inflammation.
Figure 8—figure supplement 1
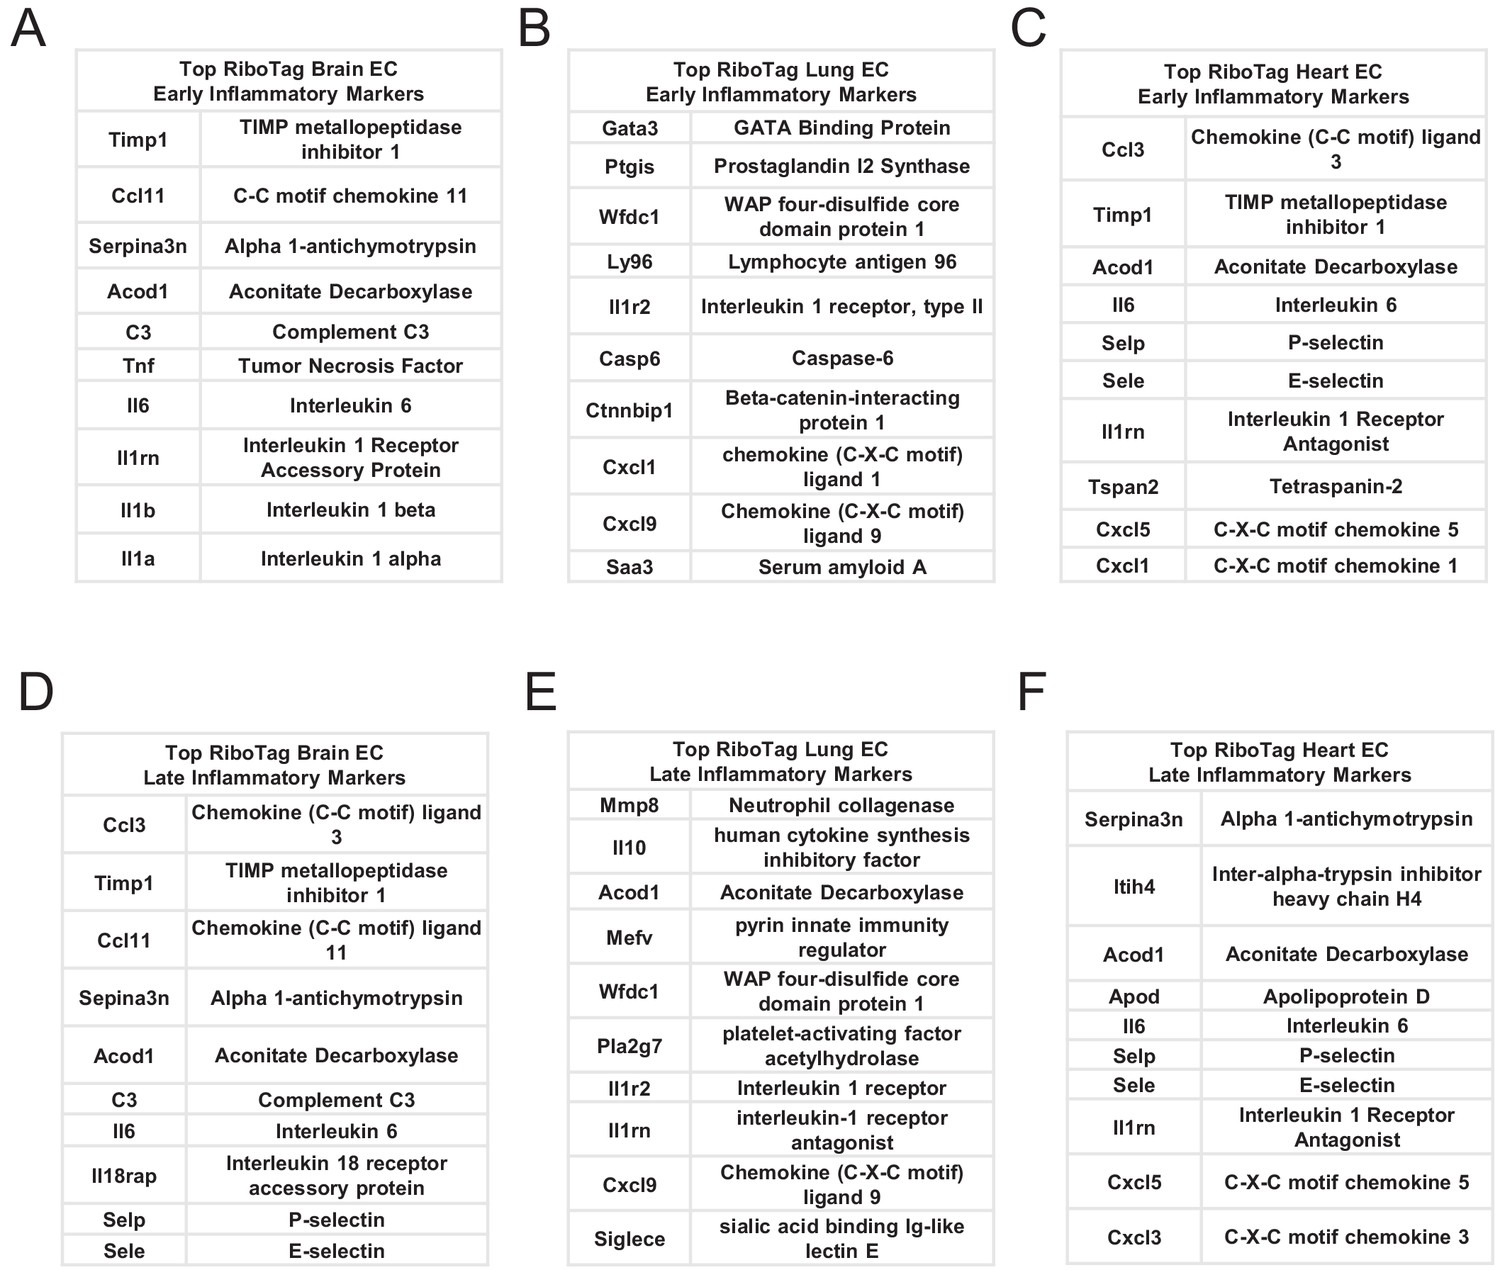
Markers of early (6 hr) and late (24 hr) LPS-induced inflammation in brain, lung, and heart ECs.
(A) Top RiboTag brain EC early (6 hr) inflammatory markers (B) Top RiboTag lung EC early (6 hr) inflammatory markers (C) Top RiboTag heart EC early (6 hr) inflammatory markers (D) Top RiboTag brain EC late (24 hr) inflammatory markers (E) Top RiboTag lung EC late (24 hr) inflammatory markers (F) Top RiboTag heart EC late (24 hr) inflammatory markers.
Figure 9 with 1 supplement
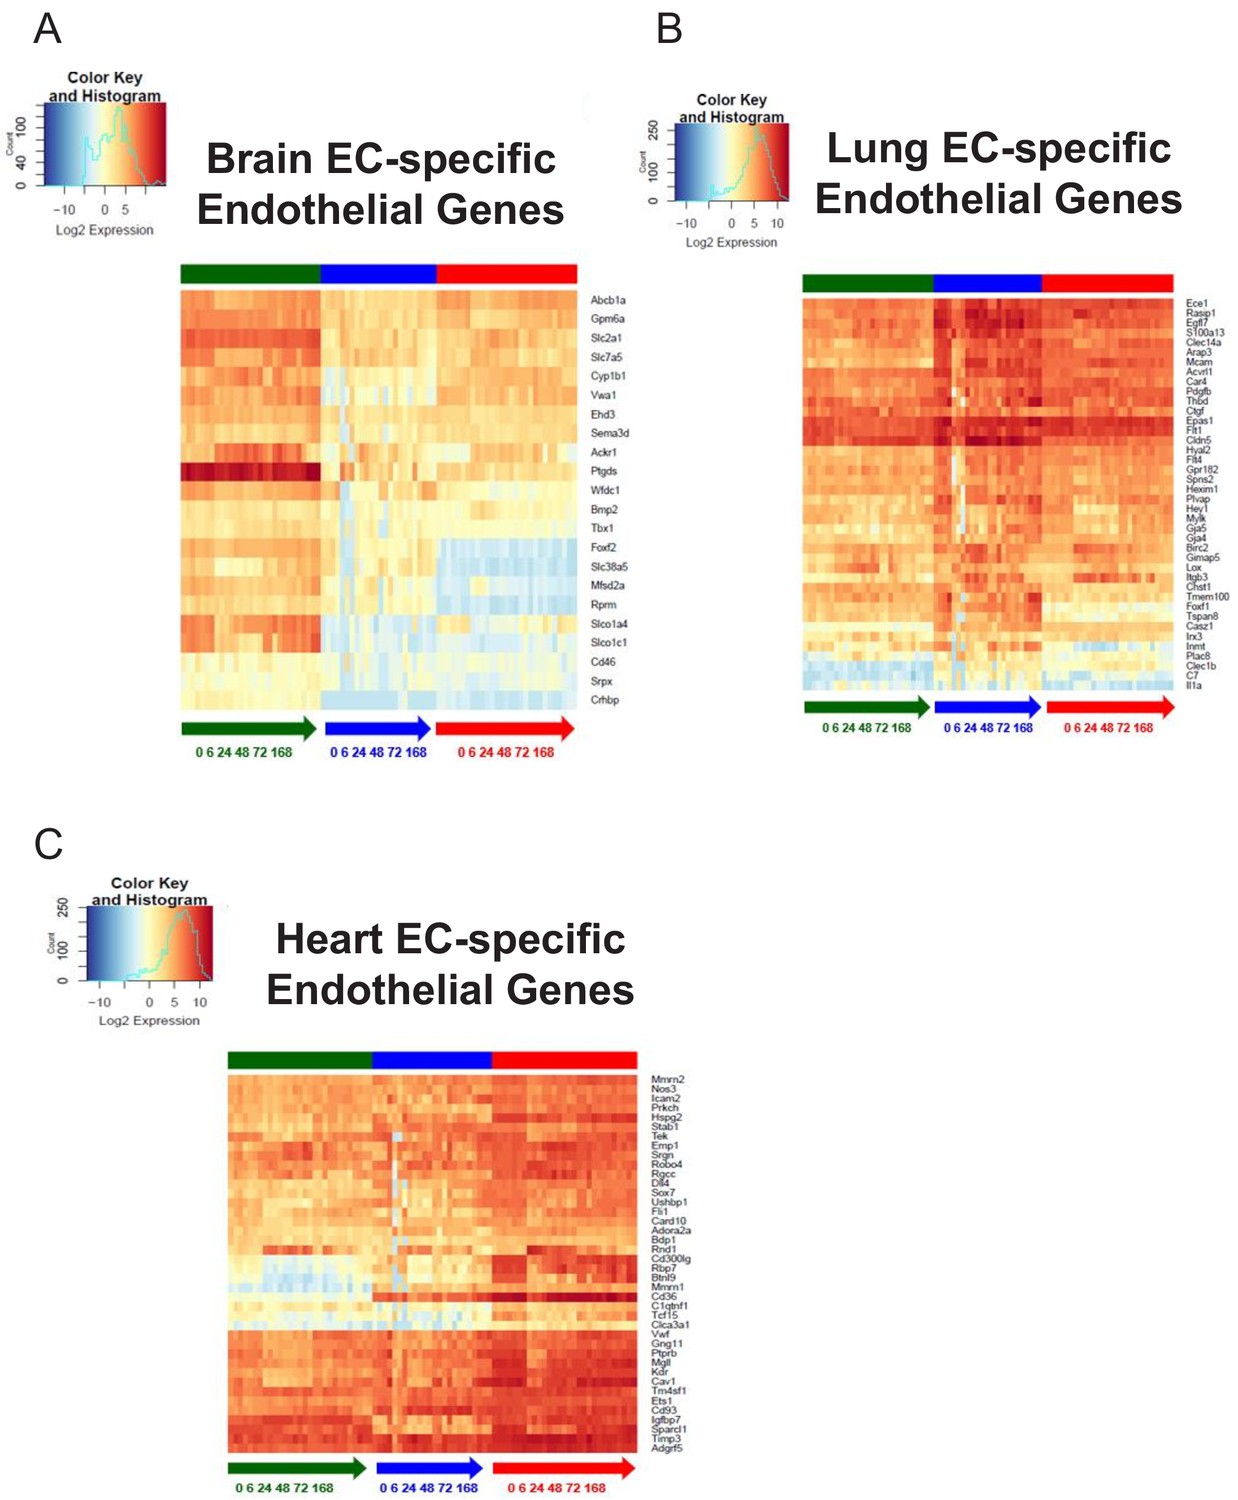
Organ-specific endothelial cells uniquely regulate endothelial genes during the progression and resolution of inflammation.
(A–C) Time-series heat map of significantly upregulated endothelial genes at baseline in (A) brain ECs (B) lung ECs and (C) heart ECs. The blue to white to red gradient represents increasing expression of the pathway with blue representing minimal expression while the red represents high expression of the pathway.
Figure 9—figure supplement 1

Organ-specific endothelial cells uniquely regulate glycolysis genes during the progression and resolution of inflammation.
(A–C) Time-series heat map of upregulated glycolysis genes at baseline in (A) brain ECs (B) lung ECs and (C) heart ECs. The blue to white to red gradient represents increasing expression of the pathway with blue representing minimal expression while the red represents high expression of the pathway.
Author response image 1
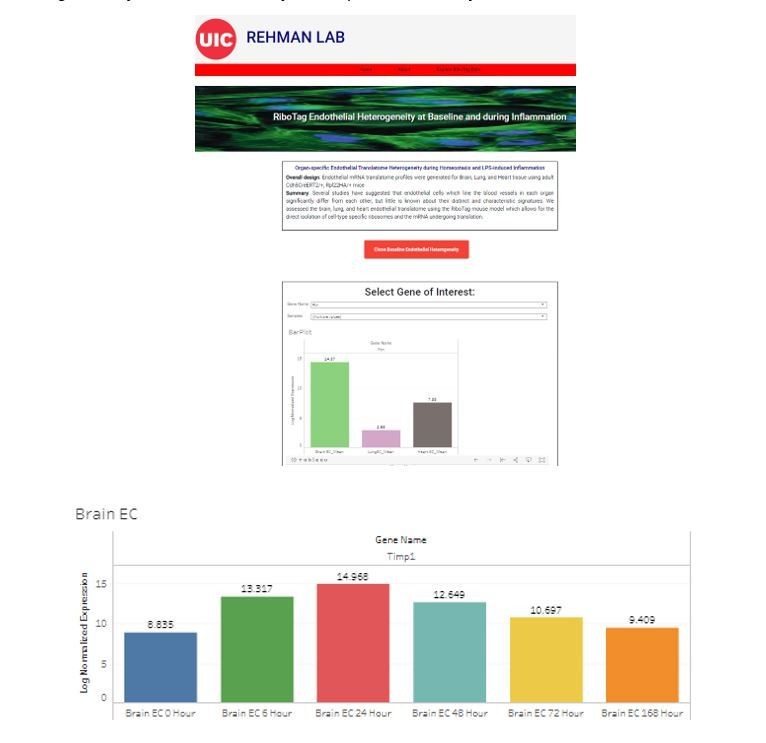
Organ-specific endothelial translatome database.
Tables
Key resources table
| Reagent type (species) or resource | Designation | Source or reference | Identifiers | Additional information |
|---|---|---|---|---|
| Antibody | Anti-HA (Rabbit polyclonal) | Abcam | Cat#: Ab9110; RRID:AB_307019 | (1:133) |
| Antibody | Anti-IgG1(Mouse monoclonal) | Sigma | Cat#: M5284; RRID:AB_1163685 | (1:133) |
| Antibody | Anti-RPL22 (Rabbit polyclonal) | Invitrogen | Cat#: PA5-68320; RRID:AB_2692054 | (1:133) |
| Antibody | Anti-CD31(Rat monoclonal) | BD Pharmingen | Cat#: 550274; RRID:AB_393571 | (1:25) |
| Antibody | Anti-RAGE (Rabbit polyclonal) | Abcam | Cat#: Ab3611; RRID:AB_303947 | (1:3200) |
| Antibody | Anti-PTN (Mouse monoclonal) | Santa Cruz Biotechnology | Cat#: sc-74443; RRID:AB_1128556 | (1:3200) |
| Antibody | Anti-AQP7 (Rabbit polyclonal) | Novus Biologicals | Cat#: NBP1-30862; RRID:AB_2258607 | (1:3200) |
| Antibody | Anti-rat (Donkey polyclonal) | Invitrogen | Cat#: A-21208; RRID:AB_141709 | (1:300) |
| Antibody | Anti-rabbit (Donkey polyclonal) | Invitrogen | Cat#: A-21207; RRID:AB_141637 | (1:300) |
| Antibody | Anti-mouse (Goat polyclonal) | Invitrogen | Cat#: A11032; RRID:AB_2534091 | (1:300) |
| Chemical compound, drug | Lipopolysaccharide (LPS) | Sigma-Aldrich | Cat#: L2630 | |
| Chemical compound, drug | collagenase A | Roche | Cat#:10103586001 | |
| Chemical compound, drug | red blood cell lysis buffer | Biolegend | Cat#: 420301 | |
| Chemical compound, drug | Dynabeads | Invitrogen | Cat#: 11035 | |
| Chemical compound, drug | Collagenase/Dispase | Roche | Cat#: 11097113001 | |
| Chemical compound, drug | DNAse | Worthington Biochemical | Cat#: LK003170 | |
| Genetic reagent (M. musculus) | Mouse: Cdh5CreERT2/+; Rpl22HA/+ | This paper | Ref: Materials and methods – Experimental Animals | |
| Genetic reagent (M. musculus) | Rpl22HA/+ | Jackson Labs | JAX: 011029; RRID:IMSR_JAX:011029 | |
| Genetic reagent (M. musculus) | Cdh5CreERT2/+ | Jeong et al., 2017, Sörensen et al., 2009 | ||
| Other | Myelin Removal Beads | Miltenyl Biotec | Cat#: 130-096-433 | |
| Other | LS columns | Miltenyl Biotec | Cat#: 130-042-401 | |
| Other | CD31 microbeads | Miltenyl Biotec | Cat#: 130-097-418; RRID:AB_2814657 | |
| Other | MACS BSA Stock Solution | Miltenyl Biotec | Cat#: 130-091-376 | |
| Other | autoMACS Rinsing Solution | Miltenyl Biotec | Cat#: 130-091-222 | |
| Other | MS columns | Miltenyl Biotec | Cat#: 130-042-201 | |
| Other | ProLong Gold mounting medium | Invitrogen | CA#: P36934 | |
| Software, algorithm | Zen software | ZEISS | ||
| Software, algorithm | STAR v. 2.4.2 | Dobin et al., 2013 | ||
| Software, algorithm | HTSeq-count v. 0.6.1 | Anders et al., 2015 | ||
| Software, algorithm | biomaRt package v. 2.26.1 | Durinck et al., 2009 | ||
| Software, algorithm | ComBat | Johnson et al., 2007 | ||
| Software, algorithm | limma | Ritchie et al., 2015 | ||
| Software, algorithm | GSEA | Subramanian et al., 2005 | ||
| Software, algorithm | Seurat | Butler et al., 2018 | ||
| Software, algorithm | Tableau Public | Tableau Software |
Additional files
-
Supplementary file 1
Brain endothelial-specific gene list.
The RiboTag brain endothelial signature genes are listed in rank order according to log fold-change (LogFC). The expression levels for all RiboTag EC samples are provided for each gene.
- https://cdn.elifesciences.org/articles/51413/elife-51413-supp1-v2.xlsx
-
Supplementary file 2
Lung endothelial-specific gene list.
The RiboTag lung endothelial signature genes are listed in rank order according to log fold-change (LogFC). The expression levels for all RiboTag EC samples are provided for each gene.
- https://cdn.elifesciences.org/articles/51413/elife-51413-supp2-v2.xlsx
-
Supplementary file 3
Heart endothelial-specific gene list.
The RiboTag heart endothelial signature genes are listed in rank order according to log fold-change (LogFC). The expression levels for all baseline RiboTag EC samples are provided for each gene.
- https://cdn.elifesciences.org/articles/51413/elife-51413-supp3-v2.xlsx
-
Supplementary file 4
Brain endothelial parenchymal signature.
The RiboTag brain EC signature genes which are not found in the PanglaoDB list of endothelial cell marker genes.
- https://cdn.elifesciences.org/articles/51413/elife-51413-supp4-v2.xlsx
-
Supplementary file 5
Lung endothelial parenchymal signature.
The RiboTag lung EC signature genes which are not found in the PanglaoDB list of endothelial cell marker genes.
- https://cdn.elifesciences.org/articles/51413/elife-51413-supp5-v2.xlsx
-
Supplementary file 6
Heart endothelial parenchymal signature.
The RiboTag lung EC signature genes which are not found in the PanglaoDB list of endothelial cell marker genes.
- https://cdn.elifesciences.org/articles/51413/elife-51413-supp6-v2.xlsx
-
Supplementary file 7
Brain endothelial signature gene expression across translatome and single cell transcriptomes.
The relative abundance for brain endothelial translatome signature genes in RiboTag brain EC translatome samples, Betsholtz brain endothelial single-cell transcriptomes, and Tabula Muris brain endothelial single-cell transcriptomes using a housekeeping gene, Sap30l, to calculate fold change.
- https://cdn.elifesciences.org/articles/51413/elife-51413-supp7-v2.xlsx
-
Supplementary file 8
Heart endothelial signature gene expression across translatome and single cell transcriptomes.
The relative abundance for heart endothelial translatome signature genes in RiboTag heart EC translatome samples, Betsholtz heart endothelial single-cell transcriptomes, and Tabula Muris heart endothelial single-cell transcriptomes using a housekeeping gene, Sap30l, to calculate fold change.
- https://cdn.elifesciences.org/articles/51413/elife-51413-supp8-v2.xlsx
-
Supplementary file 9
Lung endothelial signature gene expression across translatome and single cell transcriptomes.
The relative abundance for lung endothelial translatome signature genes in RiboTag lung EC translatome samples, Betsholtz lung endothelial single-cell transcriptomes, and Tabula Muris lung endothelial single-cell transcriptomes using a housekeeping gene, Sap30l, to calculate fold change.
- https://cdn.elifesciences.org/articles/51413/elife-51413-supp9-v2.xlsx
-
Transparent reporting form
- https://cdn.elifesciences.org/articles/51413/elife-51413-transrepform-v2.docx
Download links
A two-part list of links to download the article, or parts of the article, in various formats.
Downloads (link to download the article as PDF)
Open citations (links to open the citations from this article in various online reference manager services)
Cite this article (links to download the citations from this article in formats compatible with various reference manager tools)
Endothelial heterogeneity across distinct vascular beds during homeostasis and inflammation
eLife 9:e51413.
https://doi.org/10.7554/eLife.51413


